ugi 2015 q2 earnings call presentation v final
TRANSCRIPT

May 5, 2015
2015 Q2 Earnings
Conference Call
May 5, 2015
May 5, 2015 2
This presentation contains certain forward-looking statements that management
believes to be reasonable as of today’s date only. Actual results may differ
significantly because of risks and uncertainties that are difficult to predict and many
of which are beyond management’s control. You should read UGI’s Annual Report on
Form 10-K and quarterly reports on Form 10-Q for a more extensive list of factors
that could affect results. Among them are adverse weather conditions, cost volatility
and availability of all energy products, including propane, natural gas, electricity and
fuel oil, increased customer conservation measures, the impact of pending and
future legal proceedings, domestic and international political, regulatory and
economic conditions in the United States and in foreign countries, including the
current conflicts in the Middle East and those involving Russia, and currency
exchange rate fluctuations (particularly the euro), the timing of development of
Marcellus Shale gas production, the timing and success of our acquisitions,
commercial initiatives and investments to grow our business, and our ability to
successfully integrate acquired businesses and achieve anticipated synergies. UGI
undertakes no obligation to release revisions to its forward-looking statements to
reflect events or circumstances occurring after today.
About This Presentation
May 5, 2015
John Walsh President & CEO, UGI
Kirk Oliver Chief Financial Officer, UGI
Jerry Sheridan President & CEO, AmeriGas
May 5, 2015 4
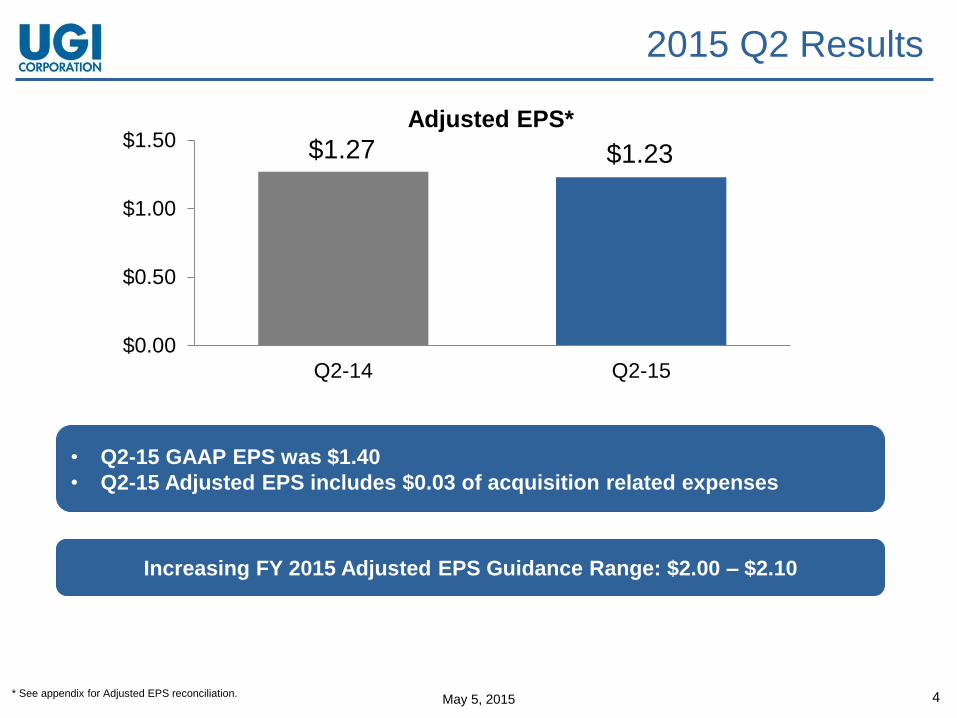
$1.27 $1.23
$0.00
$0.50
$1.00
$1.50
Q2-14 Q2-15
• Q2-15 GAAP EPS was $1.40
• Q2-15 Adjusted EPS includes $0.03 of acquisition related expenses
Increasing FY 2015 Adjusted EPS Guidance Range: $2.00 – $2.10
* See appendix for Adjusted EPS reconciliation.
Adjusted EPS*
2015 Q2 Results
May 5, 2015 5
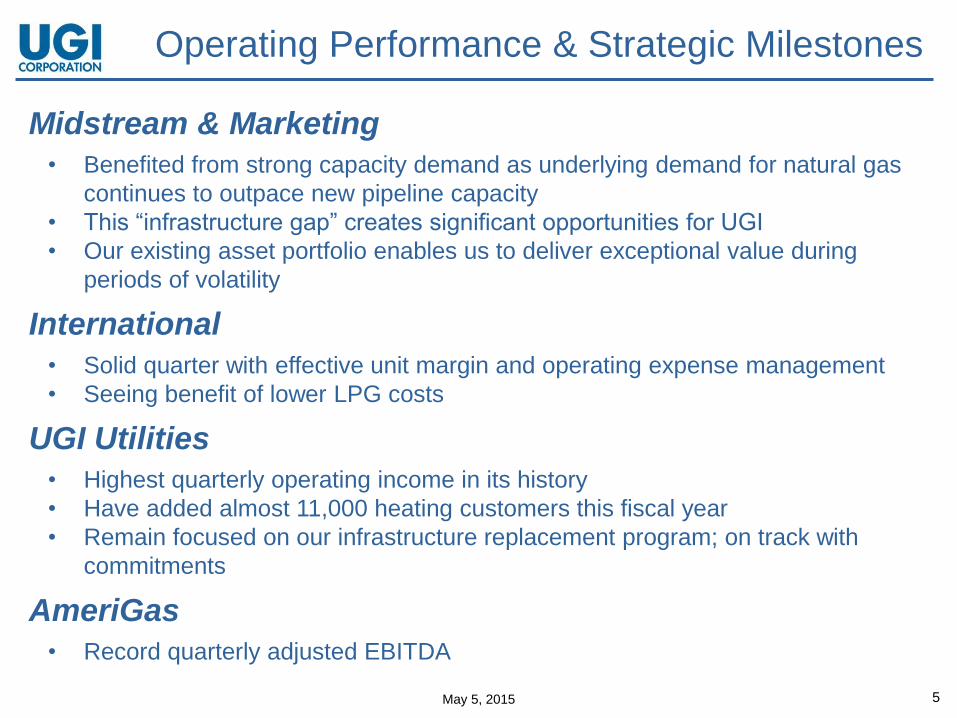
Operating Performance & Strategic Milestones
Midstream & Marketing
• Benefited from strong capacity demand as underlying demand for natural gas
continues to outpace new pipeline capacity
• This “infrastructure gap” creates significant opportunities for UGI
• Our existing asset portfolio enables us to deliver exceptional value during
periods of volatility
International
• Solid quarter with effective unit margin and operating expense management
• Seeing benefit of lower LPG costs
UGI Utilities
• Highest quarterly operating income in its history
• Have added almost 11,000 heating customers this fiscal year
• Remain focused on our infrastructure replacement program; on track with
commitments
AmeriGas
• Record quarterly adjusted EBITDA
May 5, 2015
Kirk Oliver Chief Financial Officer
May 5, 2015 7
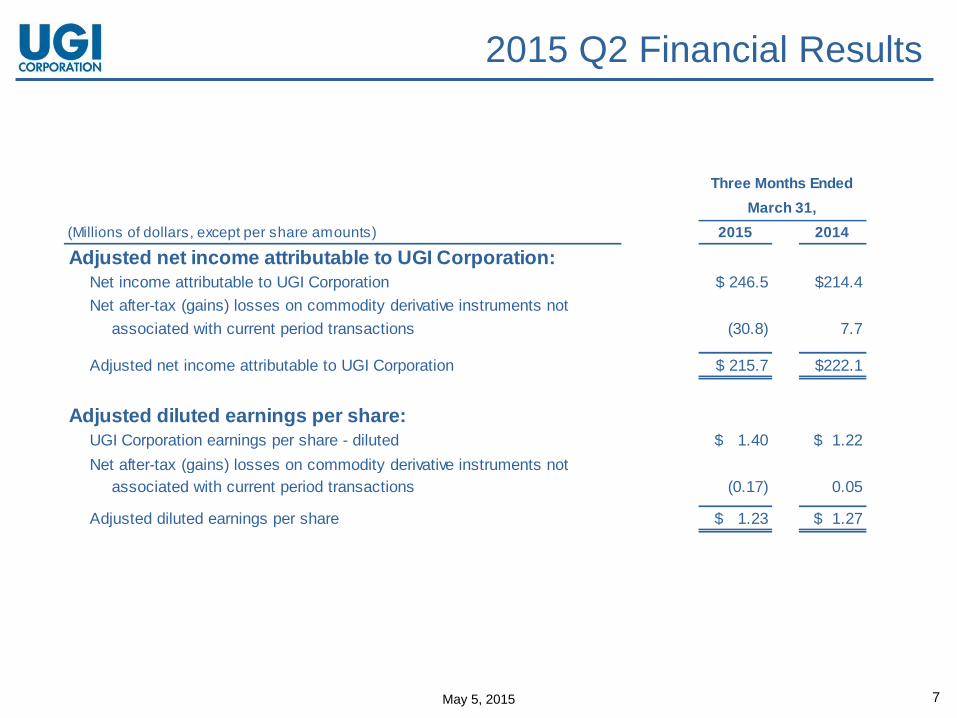
2015 Q2 Financial Results
Three Months Ended
March 31,
(Millions of dollars, except per share amounts) 2015 2014
Adjusted net income attributable to UGI Corporation:
Net income attributable to UGI Corporation $ 246.5 $214.4
Net after-tax (gains) losses on commodity derivative instruments not
associated with current period transactions (30.8) 7.7
Adjusted net income attributable to UGI Corporation $ 215.7 $222.1
Adjusted diluted earnings per share:
UGI Corporation earnings per share - diluted $ 1.40 $ 1.22
Net after-tax (gains) losses on commodity derivative instruments not
associated with current period transactions (0.17) 0.05
Adjusted diluted earnings per share $ 1.23 $ 1.27
May 5, 2015 8
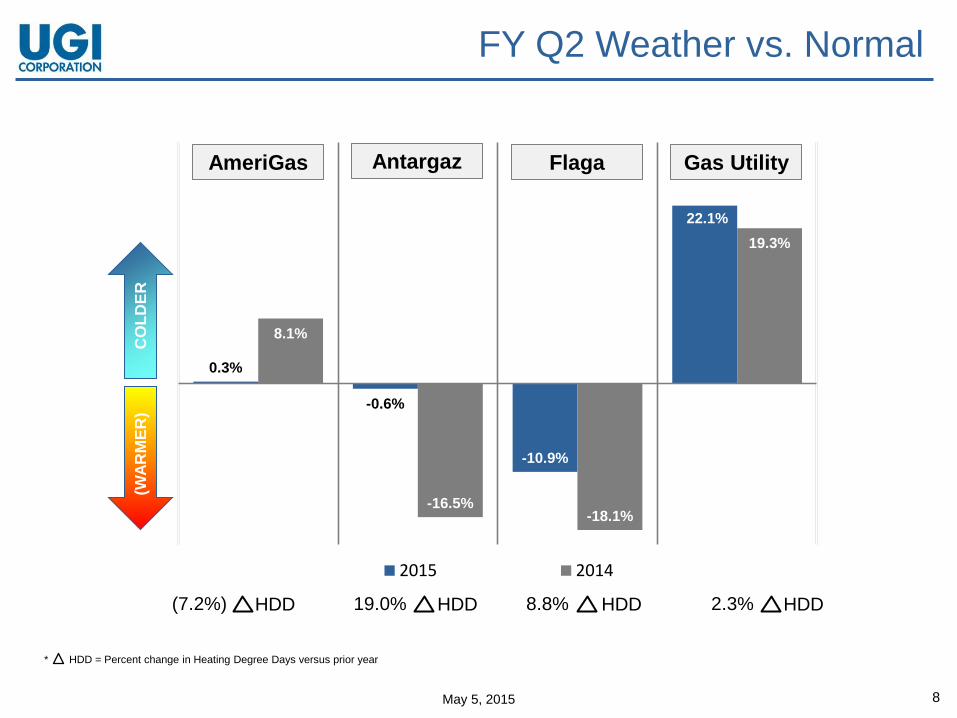
Antargaz Flaga Gas Utility AmeriGas C
OL
DE
R
(WA
RM
ER
)
* HDD = Percent change in Heating Degree Days versus prior year
FY Q2 Weather vs. Normal
0.3%
-0.6%
-10.9%
22.1%
8.1%
-16.5% -18.1%
19.3%
2015 2014
(7.2%) HDD 19.0% HDD 8.8% HDD 2.3% HDD
May 5, 2015 9
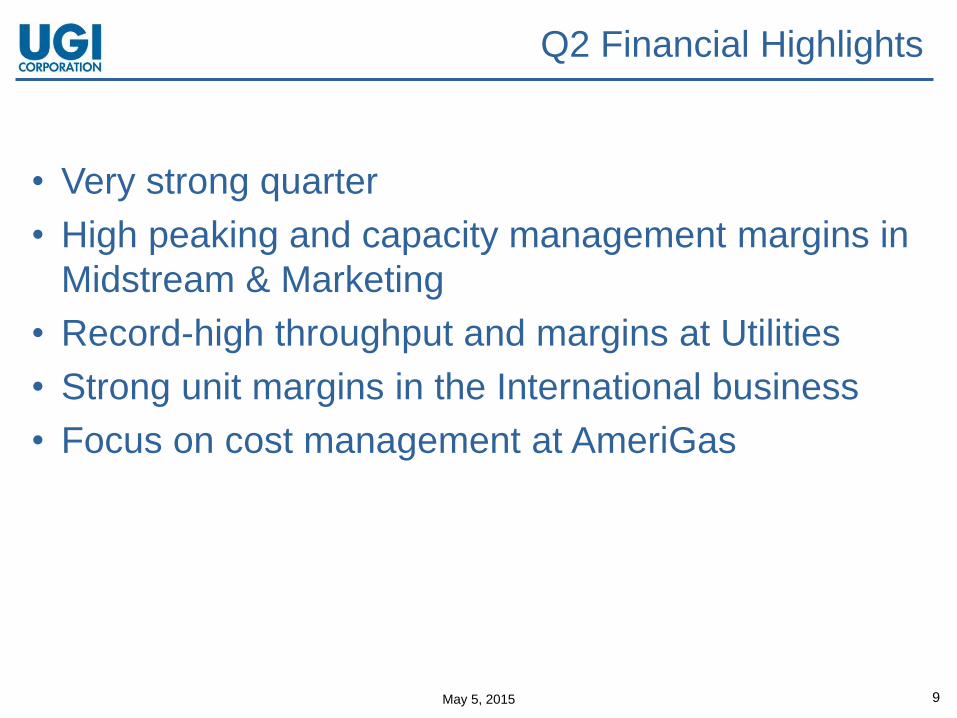
Q2 Financial Highlights
• Very strong quarter
• High peaking and capacity management margins in
Midstream & Marketing
• Record-high throughput and margins at Utilities
• Strong unit margins in the International business
• Focus on cost management at AmeriGas
May 5, 2015 10
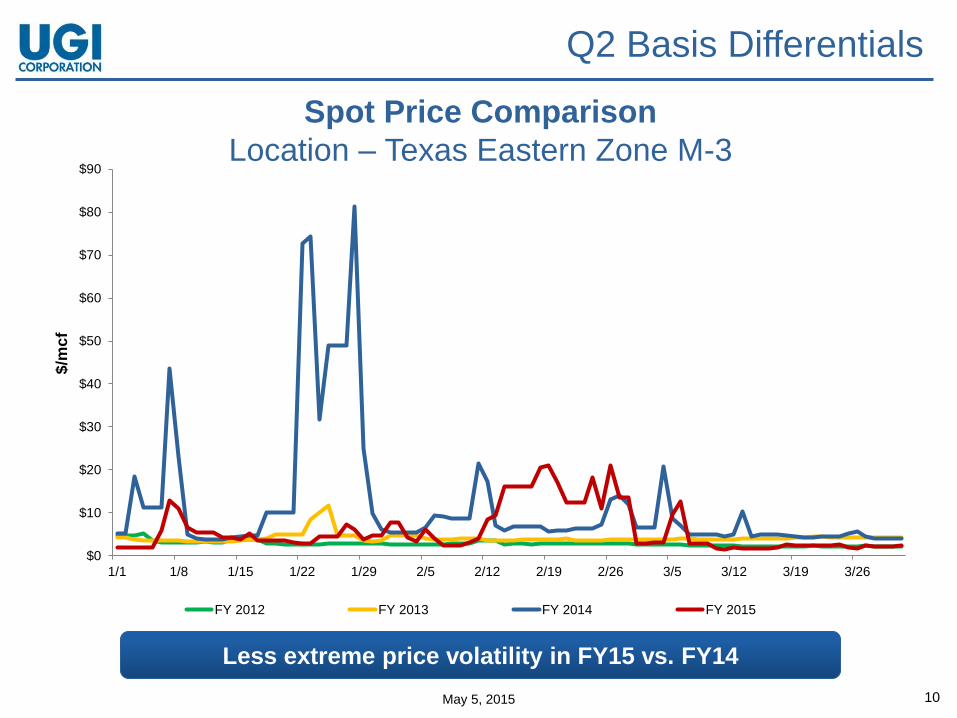
Q2 Basis Differentials (W
AR
ME
R)
Spot Price Comparison
Location – Texas Eastern Zone M-3
$/m
cf
Less extreme price volatility in FY15 vs. FY14
$0
$10
$20
$30
$40
$50
$60
$70
$80
$90
1/1 1/8 1/15 1/22 1/29 2/5 2/12 2/19 2/26 3/5 3/12 3/19 3/26
FY 2012 FY 2013 FY 2014 FY 2015
May 5, 2015 11
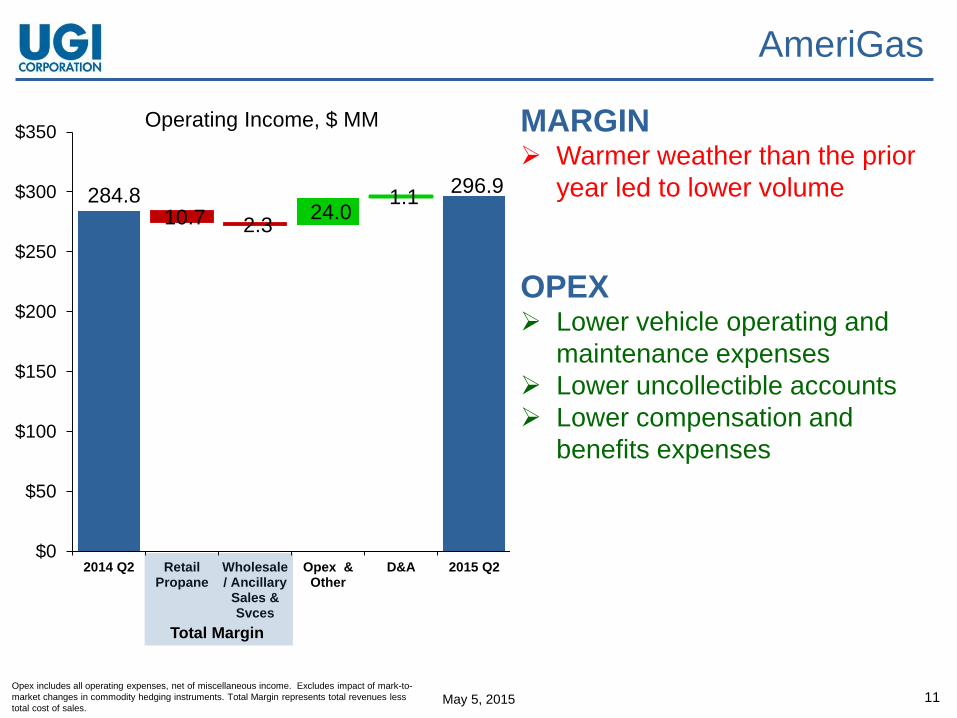
284.8 296.9
10.7 2.3 24.0
1.1
$0
$50
$100
$150
$200
$250
$300
$350
2014 Q2 RetailPropane
Wholesale/ Ancillary
Sales &Svces
Opex &Other
D&A 2015 Q2
Operating Income, $ MM
Opex includes all operating expenses, net of miscellaneous income. Excludes impact of mark-to-
market changes in commodity hedging instruments. Total Margin represents total revenues less
total cost of sales.
AmeriGas
MARGIN Warmer weather than the prior
year led to lower volume
OPEX Lower vehicle operating and
maintenance expenses
Lower uncollectible accounts
Lower compensation and
benefits expenses
Total Margin
May 5, 2015 12
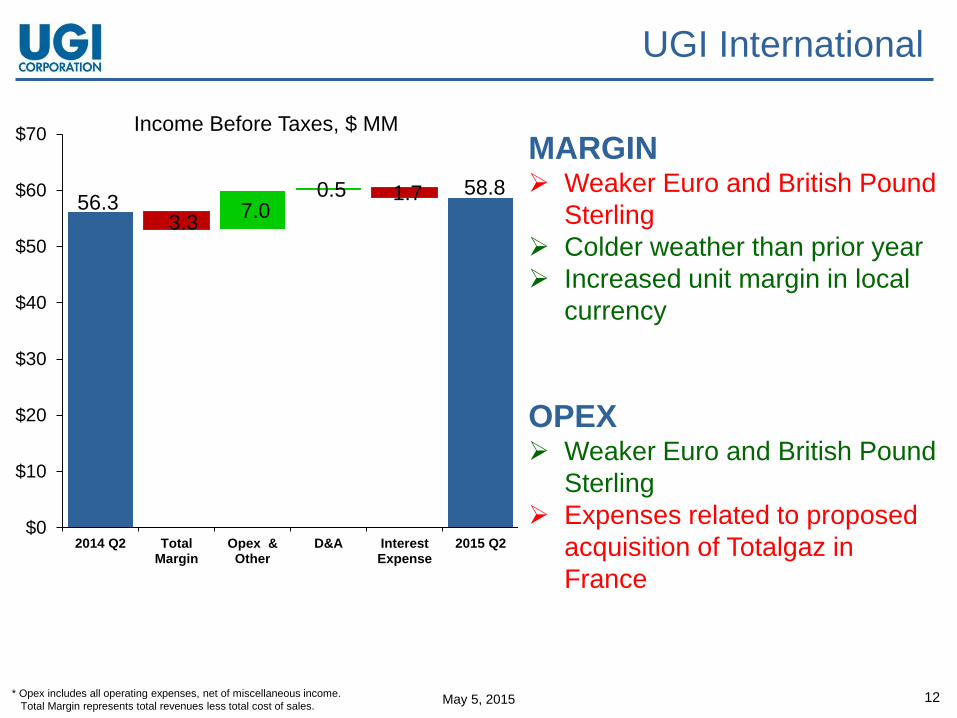
UGI International
MARGIN Weaker Euro and British Pound
Sterling
Colder weather than prior year
Increased unit margin in local
currency
OPEX Weaker Euro and British Pound
Sterling
Expenses related to proposed
acquisition of Totalgaz in
France
* Opex includes all operating expenses, net of miscellaneous income.
Total Margin represents total revenues less total cost of sales.
56.3 58.8
3.3
1.7 7.0
0.5
$0
$10
$20
$30
$40
$50
$60
$70
2014 Q2 TotalMargin
Opex &Other
D&A InterestExpense
2015 Q2
Income Before Taxes, $ MM
May 5, 2015 13
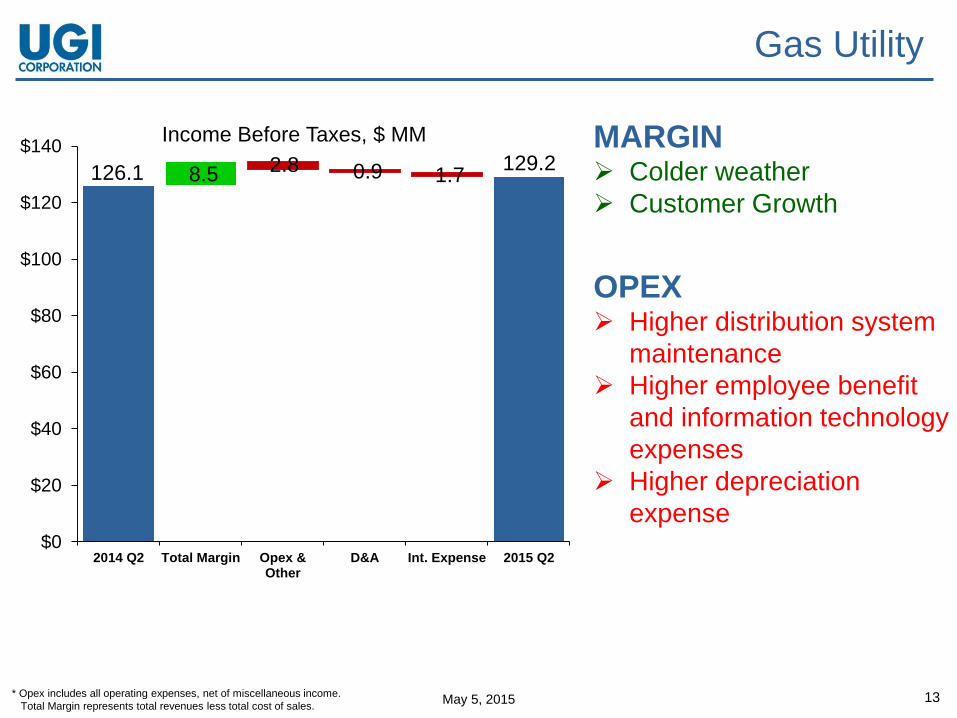
Gas Utility
MARGIN Colder weather
Customer Growth
OPEX Higher distribution system
maintenance
Higher employee benefit
and information technology
expenses
Higher depreciation
expense
* Opex includes all operating expenses, net of miscellaneous income.
Total Margin represents total revenues less total cost of sales.
126.1 129.2 2.8 0.9 1.7 8.5
$0
$20
$40
$60
$80
$100
$120
$140
2014 Q2 Total Margin Opex &Other
D&A Int. Expense 2015 Q2
Income Before Taxes, $ MM
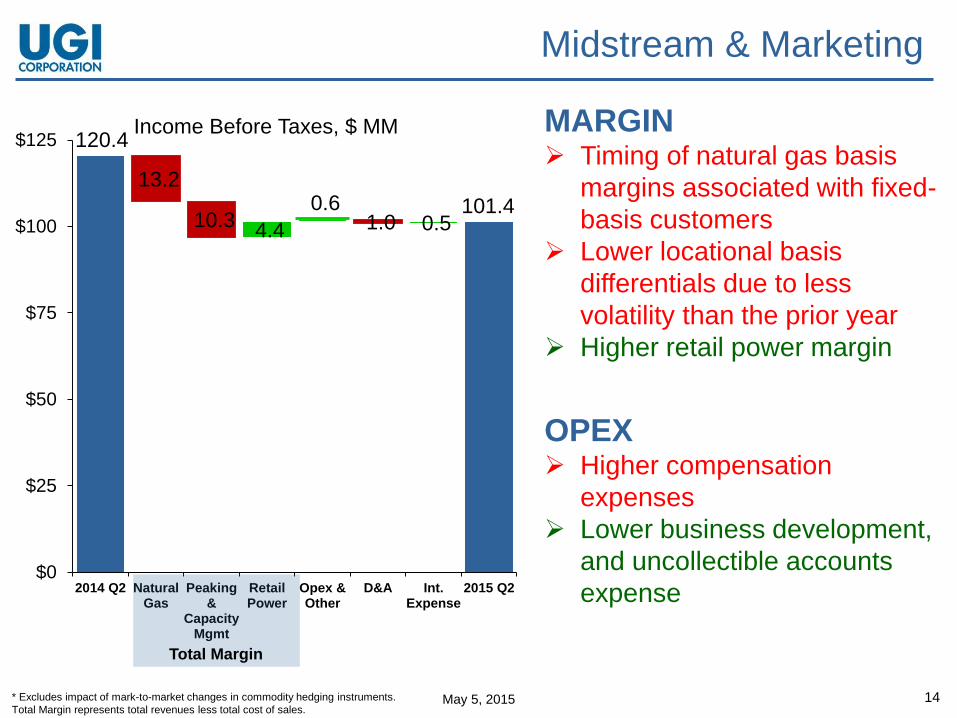
May 5, 2015 14
120.4
101.4
13.2
10.3 1.0 4.4
0.6 0.5
$0
$25
$50
$75
$100
$125
2014 Q2 NaturalGas
Peaking&
CapacityMgmt
RetailPower
Opex &Other
D&A Int.Expense
2015 Q2
Income Before Taxes, $ MM
Midstream & Marketing
MARGIN Timing of natural gas basis
margins associated with fixed-
basis customers
Lower locational basis
differentials due to less
volatility than the prior year
Higher retail power margin
OPEX Higher compensation
expenses
Lower business development,
and uncollectible accounts
expense
Total Margin
* Excludes impact of mark-to-market changes in commodity hedging instruments.
Total Margin represents total revenues less total cost of sales.
May 5, 2015 15
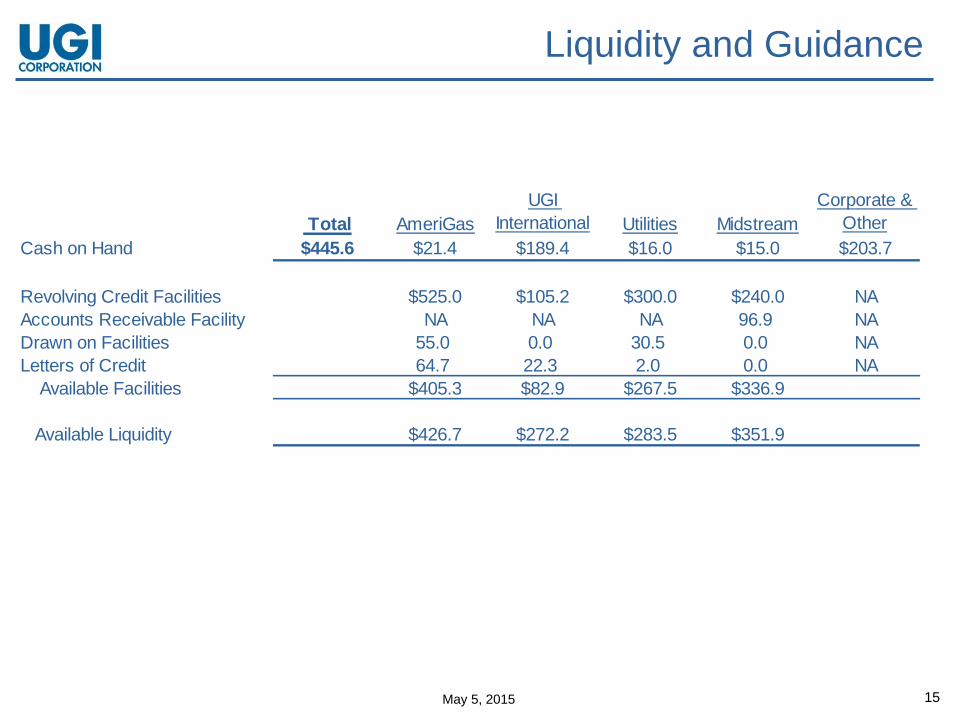
Liquidity and Guidance
Total AmeriGas
UGI
International Utilities Midstream
Corporate &
Other
Cash on Hand $445.6 $21.4 $189.4 $16.0 $15.0 $203.7
Revolving Credit Facilities $525.0 $105.2 $300.0 $240.0 NA
Accounts Receivable Facility NA NA NA 96.9 NA
Drawn on Facilities 55.0 0.0 30.5 0.0 NA
Letters of Credit 64.7 22.3 2.0 0.0 NA
Available Facilities $405.3 $82.9 $267.5 $336.9
Available Liquidity $426.7 $272.2 $283.5 $351.9

May 5, 2015
Jerry Sheridan CEO of AmeriGas
May 5, 2015 17
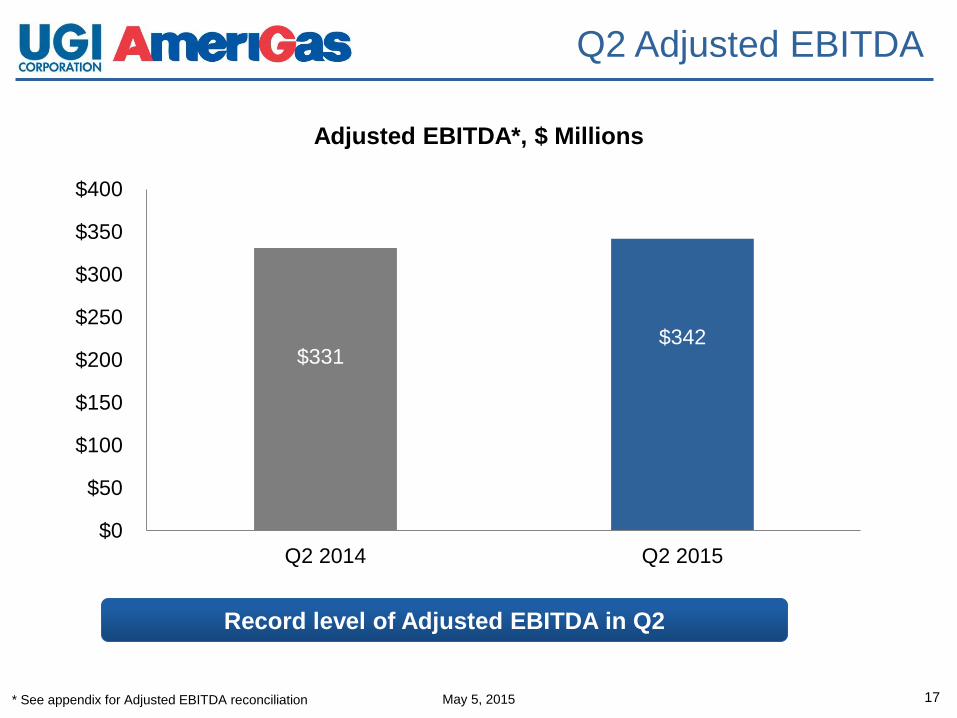
Q2 Adjusted EBITDA
* See appendix for Adjusted EBITDA reconciliation
$331 $342
$0
$50
$100
$150
$200
$250
$300
$350
$400
Q2 2014 Q2 2015
Adjusted EBITDA*, $ Millions
Record level of Adjusted EBITDA in Q2
May 5, 2015 18
• Retail volume decreased 5.7% (27 million gallons) on
weather that was 7% warmer than the prior year
• Mt. Belvieu cost was 30% lower than Q1 and 60% lower
than the prior year period
• Sold off remaining higher cost inventory and reduced
average selling price by approximately 20% while
maintaining slightly higher margins
• Operating expenses were down 9% on lower bad debt, fuel
and maintenance, and overtime expenses
Operational Highlights
May 5, 2015 19
Growth Initiatives
• The AmeriGas Propane Exchange program’s volume
increased 3% in the quarter
• National Accounts program increased 14% in the quarter
• Pipeline of acquisition opportunities remains strong;
completed one small scale acquisition in the quarter
• Stability of lower priced propane is good for the industry
and will promote demand
• Maintaining our previous guidance range of $635-$665
million for FY 2015

May 5, 2015
John Walsh President & CEO
May 5, 2015 21
Operational Highlights
PennEast
• ~$1bn project expected to deliver one bcf of gas per day
• Currently progressing through the FERC pre-approval process
• Expected to be on-stream in late calendar year 2017
Announced Two Marcellus Pipeline Projects
• Midstream & Marketing segment announced project to supply 1000MW
plant in Sunbury, PA
• Utility segment announced project to supply natural gas to a power
generation facility operated by Invenergy
Panda Energy Project
• Nearing completion of a $25 million project to serve a 1000MW plant
operated by Panda Power Funds
Totalgaz Acquisition On Track
• Currently being reviewed by French Competition Authority; we believe
closing remains on track for the first half of this year
May 5, 2015 22
In Conclusion
• This quarter demonstrated the strength of our
earnings capacity across our balanced portfolio
• Made significant progress on both our capital
projects and acquisitions
• Weather, increased volatility, and focus on
operations drove this quarter’s results
• The “infrastructure gap” will remain for some
time and opens new investment opportunities
while enhancing the value of our existing assets

May 5, 2015
Q&A

May 5, 2015
Appendix
May 5, 2015 25
UGI Supplemental Information: Footnotes
Management uses "adjusted net income attributable to UGI" and "adjusted diluted earnings per share," both of
which are non-GAAP financial measures, when evaluating UGI's overall performance. Adjusted net income
attributable to UGI is net income attributable to UGI after excluding net after-tax gains and losses on commodity
derivative instruments not associated with current-period transactions and items that management regards as highly
unusual and not expected to recur. Volatility in net income at UGI can occur as a result of gains and losses on
derivative instruments not associated with current period transactions but included in earnings in accordance with
U.S. generally accepted accounting principles ("GAAP"). Midstream & Marketing records gains and losses on
commodity derivative instruments not associated with current-period transactions in cost of sales or revenues for
all periods presented. Effective October 1, 2014, UGI International determined that on a prospective basis it would
not elect cash flow hedge accounting for its commodity derivative transactions and also de-designated its then-
existing commodity derivative instruments accounted for as cash flow hedges. Also effective October 1, 2014,
AmeriGas Propane de-designated its remaining commodity derivative instruments accounted for as cash flow
hedges. Previously, AmeriGas Propane had discontinued cash flow hedge accounting for all commodity derivative
instruments entered into beginning April 1, 2014.
Non-GAAP financial measures are not in accordance with, or an alternative to, GAAP and should be considered in
addition to, and not as a substitute for, the comparable GAAP measures. Management believes that these non-
GAAP measures provide meaningful information to investors about UGI’s performance because they eliminate the
impact of (1) gains and losses on commodity derivative instruments not associated with current-period transactions
and (2) those items that management regards as highly unusual in nature and not expected to recur.
The following table reconciles consolidated net income attributable to UGI, the most directly comparable GAAP
measure, to adjusted net income attributable to UGI, and reconciles diluted earnings per share, the most
comparable GAAP measure, to adjusted diluted earnings per share, to reflect the adjustments referred to above.
May 5, 2015 26
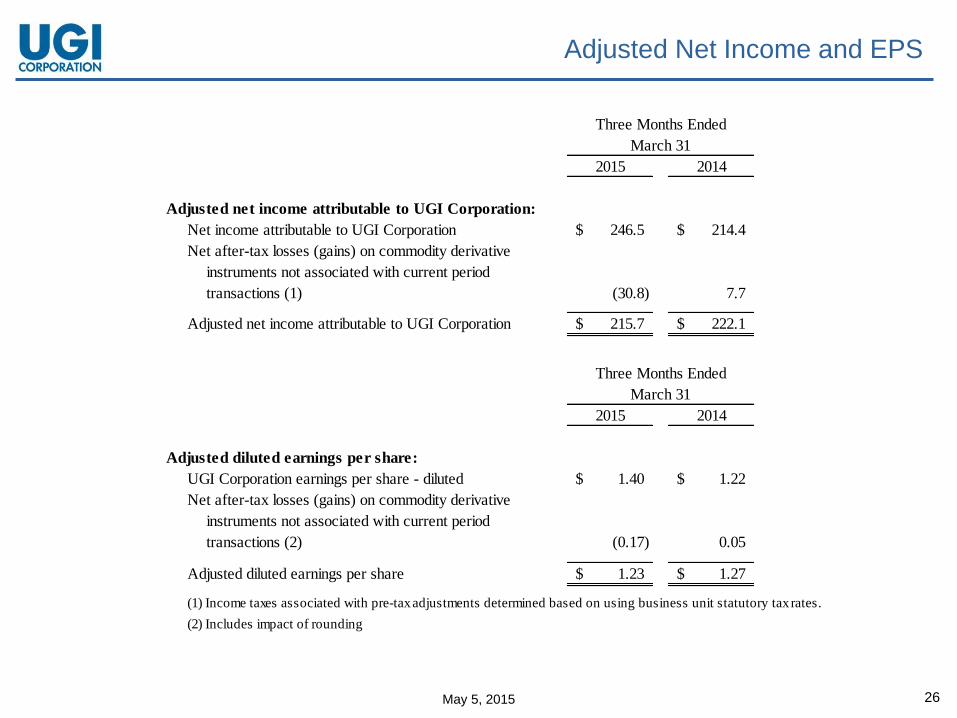
Adjusted Net Income and EPS
Three Months Ended
March 31
2015 2014
Adjusted net income attributable to UGI Corporation:
Net income attributable to UGI Corporation 246.5$ 214.4$
Net after-tax losses (gains) on commodity derivative
instruments not associated with current period
transactions (1) (30.8) 7.7
Adjusted net income attributable to UGI Corporation 215.7$ 222.1$
Three Months Ended
March 31
2015 2014
Adjusted diluted earnings per share:
UGI Corporation earnings per share - diluted 1.40$ 1.22$
Net after-tax losses (gains) on commodity derivative
instruments not associated with current period
transactions (2) (0.17) 0.05
Adjusted diluted earnings per share 1.23$ 1.27$
(1) Income taxes associated with pre-tax adjustments determined based on using business unit statutory tax rates.
(2) Includes impact of rounding
May 5, 2015 27
AmeriGas Supplemental Information: Footnotes
The enclosed supplemental information contains a reconciliation of earnings before interest expense, income taxes, depreciation and amortization ("EBITDA") and Adjusted EBITDA to Net Income.
EBITDA and Adjusted EBITDA are not measures of performance or financial condition under accounting principles generally accepted in the United States ("GAAP"). Management believes EBITDA and Adjusted EBITDA are meaningful non-GAAP financial measures used by investors to compare the Partnership's operating performance with that of other companies within the propane industry. The Partnership's definitions of EBITDA and Adjusted EBITDA may be different from those used by other companies.
EBITDA and Adjusted EBITDA should not be considered as alternatives to net income (loss) attributable to AmeriGas Partners, L.P. Management uses EBITDA to compare year-over-year profitability of the business without regard to capital structure as well as to compare the relative performance of the Partnership to that of other master limited partnerships without regard to their financing methods, capital structure, income taxes or historical cost basis. Management uses Adjusted EBITDA to exclude from AmeriGas Partners’ EBITDA gains and losses that competitors do not necessarily have to provide additional insight into the comparison of year-over-year profitability to that of other master limited partnerships. In view of the omission of interest, income taxes, depreciation and amortization from EBITDA and Adjusted EBITDA, management also assesses the profitability of the business by comparing net income attributable to AmeriGas Partners, L.P. for the relevant years. Management also uses EBITDA to assess the Partnership's profitability because its parent, UGI Corporation, uses the Partnership's EBITDA to assess the profitability of the Partnership, which is one of UGI Corporation’s business segments. UGI Corporation discloses the Partnership's EBITDA in its disclosures about its business segments as the profitability measure for its domestic propane segment.
May 5, 2015 28
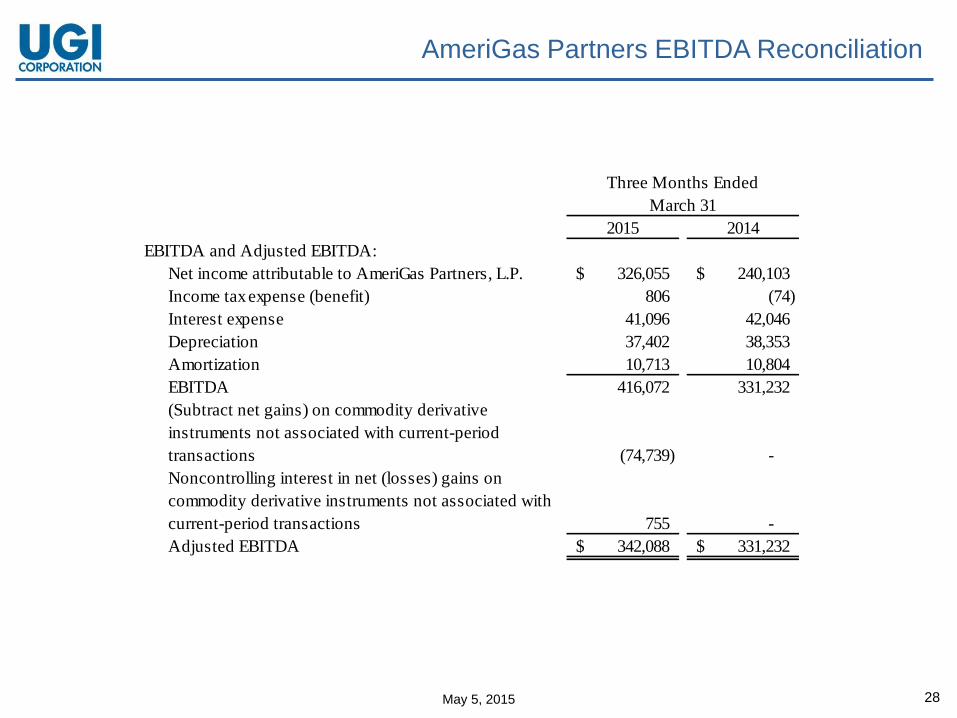
AmeriGas Partners EBITDA Reconciliation
2015 2014
EBITDA and Adjusted EBITDA:
Net income attributable to AmeriGas Partners, L.P. 326,055$ 240,103$
Income tax expense (benefit) 806 (74)
Interest expense 41,096 42,046
Depreciation 37,402 38,353
Amortization 10,713 10,804
EBITDA 416,072 331,232
(Subtract net gains) on commodity derivative
instruments not associated with current-period
transactions (74,739) -
Noncontrolling interest in net (losses) gains on
commodity derivative instruments not associated with
current-period transactions 755 -
Adjusted EBITDA 342,088$ 331,232$
Three Months Ended
March 31
May 5, 2015 29
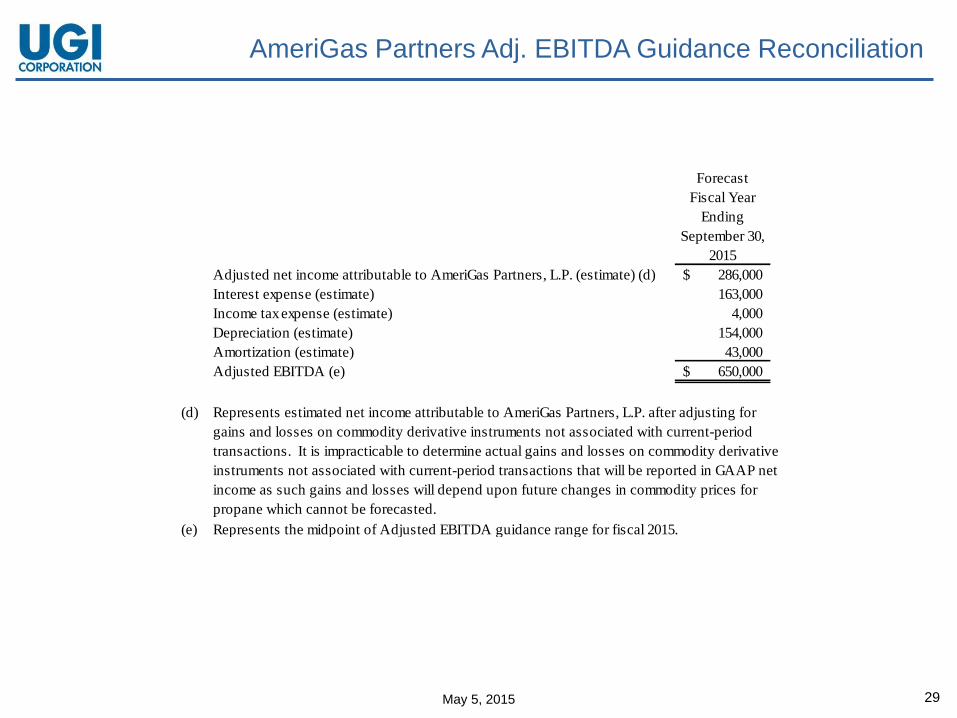
AmeriGas Partners Adj. EBITDA Guidance Reconciliation
Forecast
Fiscal Year
Ending
September 30,
2015
Adjusted net income attributable to AmeriGas Partners, L.P. (estimate) (d) 286,000$
Interest expense (estimate) 163,000
Income tax expense (estimate) 4,000
Depreciation (estimate) 154,000
Amortization (estimate) 43,000
Adjusted EBITDA (e) 650,000$
(d)
(e) Represents the midpoint of Adjusted EBITDA guidance range for fiscal 2015.
Represents estimated net income attributable to AmeriGas Partners, L.P. after adjusting for
gains and losses on commodity derivative instruments not associated with current-period
transactions. It is impracticable to determine actual gains and losses on commodity derivative
instruments not associated with current-period transactions that will be reported in GAAP net
income as such gains and losses will depend upon future changes in commodity prices for
propane which cannot be forecasted.