ue-based location model of rapid charging …docs.trb.org/prp/14-3809.pdf1 ue-based location model...
TRANSCRIPT
UE-based Location Model of Rapid Charging Stations for EVs with Batteries 1
that Have Different States-of-charge 2
3
Yong-Gwan Lee 4
Department of Civil and Environmental Engineering, Seoul National University 5 1 Gwanak-ro, Gwanak-gu, Seoul, 151-744, Korea 6
Phone: +82-2-880-7377 7 Fax: +82-2-873-2684 8
E-mail: [email protected] 9 10
Hyo-Seung Kim 11
Integrated Research Institute of Construction and Environmental Engineering 12 Seoul National University 13
1 Gwanak-ro, Gwanak-gu, Seoul, 151-744, Korea 14 Phone: +82-2-880-1536 15 Fax: +82-2-873-2684 16
E-mail: [email protected] 17 18
Seung-Young Kho 19
Department of Civil and Environmental Engineering, Seoul National University 20 1 Gwanak-ro, Gwanak-gu, Seoul, 151-744, Korea 21
Phone: +82-2-880-1447 22 Fax: +82-2-873-2684 23
E-mail: [email protected] 24 25
Chungwon Lee 26
Corresponding author 27 Department of Civil and Environmental Engineering, Seoul National University 28
1 Gwanak-ro, Gwanak-gu, Seoul, 151-744, Korea 29 Phone: +82-2-880-7368 30
Fax: +82-2-873-2684 31 E-mail: [email protected] 32
33
34
35
Submission date: August 1, 2013 36
Resubmission date: November 15, 2013 37
Word Count: 5,522 Words + 7 Figures + 1 Table = 7,522 Words 38
39
Submitted for presentation at the 93rd Transportation Research Board Annual Meeting and publication in 40
the Transportation Research Record 41
TRB 2014 Annual Meeting Paper revised from original submittal.
Lee, Kim, Kho, and Lee 2
ABSTRACT 1
The aim of this research is to develop a location model of rapid charging stations for electric vehicles (EV) 2
in urban areas considering the batteries’ state-of-charge (SOC) and the users’ charging and traveling 3
behaviors. EVs are developed to prepare for the energy crisis and reduce greenhouse gas emissions. In 4
order to help relieve range anxiety, an adequate number of EV charging stations must be constructed. In 5
urban areas, the construction of rapid charging stations is needed because there is inadequate space for 6
slow-charging equipment. The objective function of the model is to minimize EVs’ travel fail distance 7
and total travel time of the entire network when the link flow is determined by user equilibrium (UE) 8
assignment. The remaining fuel range (RFR) at the origin node is assumed to follow a probabilistic 9
distribution in order to reflect users’ charging behavior or technical development. The results indicate 10
that the location model described in this paper can identify locations for charging stations by using a 11
probabilistic distribution function for the RFR. And the location model, which is developed based on UE 12
assignment, is likely to consider the congested traffic conditions of urban areas in order to avoid locating 13
charging stations where they could cause further traffic congestion. The proposed model can assist 14
decision makers in developing policies that encourage the use of EVs, and it will be useful in developing 15
an appropriate budget for implementing the plan. 16
17
18
TRB 2014 Annual Meeting Paper revised from original submittal.

Lee, Kim, Kho, and Lee 3
INTRODUCTION 1
The electric vehicle (EV) is one of the most popular alternative-fuel vehicles (1). However, range anxiety 2
has restricted the pace at which EVs have penetrated the market. The construction of an adequate number 3
of EV charging stations can help relieve this range anxiety (2). Considering the budget constraints, 4
choosing where such stations should be located is an important issue. Access to EV charging stations will 5
impact the use rates of EVs, decisions concerning their use, the percentage of miles attained with 6
electricity, the demand for petroleum, and power consumption at various times during the day (3, 4). So 7
the problem of properly locating EV charging stations is an essential topic, and some important studies 8
have been conducted in the past few years (5-10). 9
To formulate a practical model for determining the appropriate locations for EV charging 10
stations, serveral variables must be considered, including the vehicle range (VR), batteries’ state-of-11
charge (SOC), users’ charging behavior, and travel preferences. In the early stages of EVs, the targeted 12
consumers were people who traveled almost exclusively within the urban area (11). In existing models for 13
locating EV charging stations in urban areas, slow-charging equipment was targeted, and the objectives of 14
the existing studies were to optimize the total usage of electrical power, maximize profit, and minimize 15
costs. The location of rapid charging stations in urban areas also is very important because adequate space 16
cannot be made available to accommodate the larger numbers of slow-charging equipment that would be 17
necessary. However, most studies are based on parking behavior, and there is a lack of research on 18
charging on route. Rapid charging stations in urban area can help increase accessibility to charging to a 19
greater extent than such stations could in rural areas. Therefore, current planning involves establishing 20
charging stations first in urban areas and then expanding their availability to intercity roads (12). However, 21
rapid charging stations, at which EV users can recharge during their trips, have not been considered in the 22
most of the studies. 23
Flow-refueling location models (FRLMs) have been developed to find adequate location of gas 24
station for vehicles that need refuel during their trip. FRLMs for alternative-fuel vehicles are extended 25
models of flow-capturing location models (FCLMs) that were developed for convenience stores by 26
Hodgson (13, 14). An FCLM is a maximum covering model, and it cannot handle the multiple refueling 27
stations needed for paths longer than the VR. Vehicle range (VR) is the distance that a vehicle can travel 28
when it is fully charged, and FRLMs can be extended by adding the vehicle-range constraint. 29
However, it is difficult to apply FRLMs to urban areas for two reasons. First, the travel paths 30
used in these models were determined exogenously. In the existing models, all of the vehicles from the 31
same origin-destination (OD) pair must be assigned to one path. This is reasonable for inter-city trips, but 32
it would rarely occur in urban areas, because numerous alternative paths are available. In practice, drivers 33
can detour to charge their vehicles they so desire. Some studies have considered such detours, but only 34
from the standpoint of the probability of trip availability (15, 16). Second, the SOC level was assumed to 35
be 0.5 because only the marginal case of alternative fuel vehicles was considered in the studies of FRLMs 36
TRB 2014 Annual Meeting Paper revised from original submittal.

Lee, Kim, Kho, and Lee 4
(17). If each vehicle has a different remaining fuel range (RFR), the path used by each vehicle may be 1
different. RFR can be calculated by multiplying VR by the SOC level of the battery. When a constant 2
RFR is used, the number of stations that should be constructed can be underestimated in urban areas. 3
Summarizing the literature, two variations are required to develop the location model for EV 4
charging stations in an urban area. One is determining the travel path endogenously, and the other is 5
assuming probabilistic RFR. In this way, the model can simulate EV users’ behaviors reasonably and 6
extend the results by enhancing batteries’ volume or charging performances. The summary of the 7
literature review and the contribution of this study are presented in Table 1. 8
9
TABLE 1 Literature Review and the difference of this study (5-10, 14-24) 10
Previous studies Objective function Station Spatial scope RFR Travel path
Kuby and Lim (2005) Minimum failure AFV INT D EXO
Wang (2009) Minimum number of stations AFV - D EXO
Upchurch et al. (2009) Minimum failure cost AFV INT D EXO
Wang and Lin (2009) Minimum number of stations AFV INT D EXO
Kim (2010) Minimum failure AFV INT D EXO
Ip et al. (2010) Minimum operational cost EV - - -
Wang and Wang (2010) Minimum failure +
construction cost AFV INT D EXO
Hanabusa and Horiguchi (2011) Entropy maximization EV - - -
Ge et al. (2011) Minimum users’ loss EV - - -
Wang et al. (2011) Maximum net income BS - - -
Frade et al. (2011) Maximum covering EV-S INN - -
Kim and Kuby (2012) Minimum failure AFV INT D EXO
Capar and Kuby (2012) Minimum failure AFV INT D EXO
Chen et al. (2013) Minimum access cost EV-S INN - -
Proposed Model Minimum failure cost
+ network cost EV-R INN P ENDO
note: -= not considered, AFV = station for alternative fuel vehicle, EV = station for electric vehicle, 11
BS=battery switch station for EV, EV-S=slow-charging station for EV, EV-R=rapid charging station for 12
EV, INT = intercity, INN = inner-city, D = deterministic, P = probabilistic, EXO = exogenously 13
determined (all-or-nothing assignment), ENDO = endogenously determined (user equilibrium assignment) 14
15
TRB 2014 Annual Meeting Paper revised from original submittal.

Lee, Kim, Kho, and Lee 5
The aim of the research reported in this paper is to develop a location model of rapid charging 1
stations considering vehicles’ ranges, batteries’ SOC, and users’ charging and travel behaviors. The 2
model was formed as a bi-level optimization model in which the main problem was formulated to 3
determine the locations of the stations and the patterns of use by EVs. The sub-problem was formulated to 4
determine link flow based on the user-equilibrium principle. To solve the problem in reasonable time, a 5
modified, simulated annealing algorithm was proposed. The applicability of the model was tested in a 6
network in the example networks 7
The structure of this paper is as follows. In section 2, the location model of rapid charging 8
stations based on the user-equilibrium principle is formulated, and a heuristic algorithm is proposed that 9
assists in efficiently determining the approximate solution of the problem. In section 3, potential 10
applications of the proposed model on a simulated network are performed, and the results are compared 11
with those provided by existing methods. Our conclusions and recommendations for future research are 12
presented in section 4. 13
14
MODEL FORMULATION 15
The proposed model is an uncapacitated facility location problem to minimize travelers’ costs. The model 16
is a modification of a P-median problem combined with a user-equilibrium problem. The proposed model 17
was based on the following considerations. First, the vehicle range is assumed to be longer than the 18
distance between the origin and destination for all OD pairs. This means that the EV’s battery would not 19
have to be recharged more than once during the trip. Thus, we can eliminate the vehicle-range constraint 20
from the FRLM. 21
Second, it was assumed that the remaining fuel range at the origin node followed a probabilistic 22
distribution. The state of technical development or the supply of slow-recharging equipment at the origin 23
node could affect the SOC. An EV that has a long range must be charged longer than an EV that has a 24
shorter range. If charging time becomes shorter or larger numbers of slow-recharging equipment are 25
offered, the SOC level can be higher. If the remaining fuel range is assumed to be constant, as Capar and 26
Kuby did (18), the RFR function is a unit impulse function. The cumulative distribution function of RFR, 27
which is used in the literature, can be written as shown in equation 1. In this study, the RFR function was 28
assumed to be a probabilistic distribution function, such as a uniform distribution, an increasing 29
distribution, and a triangular distribution. The distribution functions that were assumed in this study are 30
shown in equations 2-4. 31
Constant function : 𝐺(𝑟) = �0 if 0 ≤ 𝑟 < 0.5𝑟𝑉1 if 0.5𝑟𝑉 ≤ 𝑟 ≤ 𝑟𝑉
1)
Uniform function : 𝐺(𝑟) = 1𝑟𝑉
× 𝑟 2)
TRB 2014 Annual Meeting Paper revised from original submittal.

Lee, Kim, Kho, and Lee 6
Increasing function : 𝐺(𝑟) = 1𝑟𝑉2
× 𝑟2 3)
Triangular function : 𝐺(𝑟) = �
2𝑟𝑉2
× 𝑟2 if 0 ≤ 𝑟 < 0.5𝑟𝑉4𝑟𝑉
× 𝑟 − 2𝑟𝑉2
× 𝑟2 − 1 if 0.5𝑟𝑉 ≤ 𝑟 ≤ 𝑟𝑉 4)
where: 1
𝑟 = remaining fuel range in distance 2
𝑟𝑉= vehicle range in distance 3
𝐺(𝑟) = cumulative distribution function of 𝑟 4
5
The probability of how many EVs can travel with or without charging can be calculated by the 6
RFR distribution function. Figure 1 shows the relationship between the type of RFR distribution function 7
and trip ratio. An increasing distribution may be found when people can easily charge their parked EVs. 8
However, a uniform or a triangular distribution may be found when sufficient slow-charging equipment is 9
not installed to accommodate the requirements of the EVs. 10
11
Flow from 𝑖 to 𝑗 : 100 Path used for trip without recharging : 𝑖 → 𝑗 Path used for trip with recharging : 𝑖 → 𝑘(station) → 𝑗
Distribution Constant
distribution Uniform
distribution Triangular distribution
Increasing distribution
𝑟𝑉 = 20
Trip failure 0 35 25 13
Trip success 100 65 75 87
without recharging 0 25 12 43
with recharging 100 40 63 44
𝑟𝑉 = 40
Trip failure 0 18 7 4
Trip success 100 82 93 96
without recharging 100 62 71 85
with recharging 0 20 22 11
FIGURE 1 RFR distribution functions and travel path by RFR. 12
13
Third, trips are classified by users’ recharging behaviors. An existing fossil-fuel vehicle can be refueled 14
easily, because there are many gas stations available. But there are far fewer charging stations for EVs 15
than there are gas stations for fossil-fuel vehicles, so it was assumed that, before departure, the drivers of 16
TRB 2014 Annual Meeting Paper revised from original submittal.

Lee, Kim, Kho, and Lee 7
EVs chose where they would recharge their EVs. A user’s behavior is determined based on the remaining 1
fuel range displayed in the vehicle’s instrument panel. If the RFR is greater than the distance between the 2
origin of the trip and its destination, the travelers can go to their destination without recharging, while 3
they must locate a charging station or travel using gasoline when the RFR is less than the distance to the 4
destination. Here, we propose two new decision variables, 𝑦�𝑖𝑗𝑘 and 𝑦�𝑖𝑗, to divide the entire trip into 5
three groups. The decision variable 𝑦�𝑖𝑗𝑘 is trip ratio travels via station 𝑘 among whole trip from origin 6
𝑖 to destination 𝑗. The decision variable 𝑦�𝑖𝑗 is the ratio who cannot travel with EV. Travelers who can 7
no longer travel in their EVs may travel by public transportation, taxi, or incur the cost of an emergency 8
service to recharge their EV. In the flow refueling location model, travel paths are given as input data. As 9
shown in Figure 2, three paths are available with the same distance from node 1 to node 8, i.e., 1-2-4-8, 1-10
5-4-8, and 1-5-7-8. In the existing model, just one path is available among the three paths. Here, we 11
assume that the consumption of the battery’s charge is proportional to the distance traveled because the 12
RFR is displayed in kilometers, and users usually use this information to decide whether their EVs must 13
be charged on their routes or not. 14
15
Travel path FRLM (17-19) Proposed model
Path used when the station is located at
node 2
Path used when the station is located at
node 5
note: The RFR distribution function is assumed to be a uniform function. The link travel time is assumed 16
to be constant. 17
FIGURE 2 Travel paths by location of charging station. 18
19
Finally, a traveler’s trip follows the user-equilibrium principle in terms of mean travel time, 20
while the purpose of locating rapid charging stations is to minimize social costs, including travel time cost 21
and the penalty associated with EV travel failure. The notation for formulating the model is as follows: 22
23
(a) Sets 24
𝑁 = node set, indexed by 𝑛 (𝑁 ∋ 𝑛) 25
TRB 2014 Annual Meeting Paper revised from original submittal.
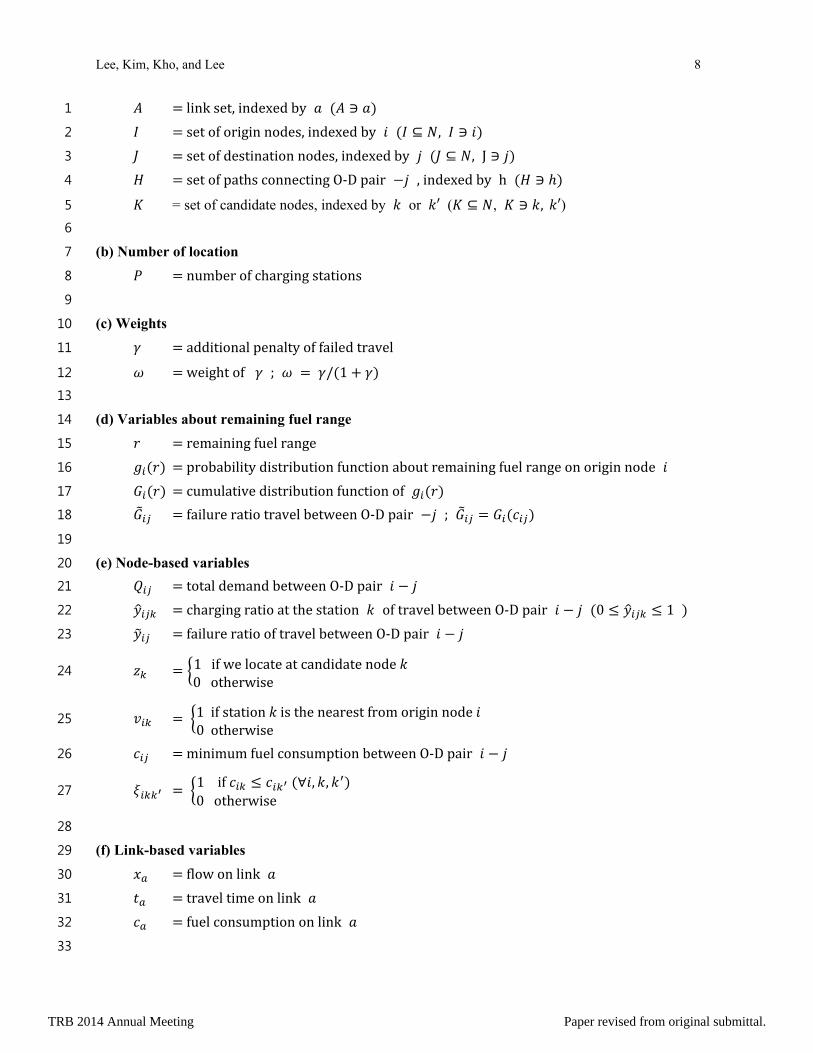
Lee, Kim, Kho, and Lee 8
𝐴 = link set, indexed by 𝑎 (𝐴 ∋ 𝑎) 1
𝐼 = set of origin nodes, indexed by 𝑖 (𝐼 ⊆ 𝑁, 𝐼 ∋ 𝑖) 2
𝐽 = set of destination nodes, indexed by 𝑗 (𝐽 ⊆ 𝑁, J ∋ 𝑗) 3
𝐻 = set of paths connecting O-D pair −𝑗 , indexed by h (𝐻 ∋ ℎ) 4
𝐾 = set of candidate nodes, indexed by 𝑘 or 𝑘′ (𝐾 ⊆ 𝑁, 𝐾 ∋ 𝑘, 𝑘′) 5
6
(b) Number of location 7
𝑃 = number of charging stations 8
9
(c) Weights 10
𝛾 = additional penalty of failed travel 11
𝜔 = weight of 𝛾 ; 𝜔 = 𝛾/(1 + 𝛾) 12
13
(d) Variables about remaining fuel range 14
𝑟 = remaining fuel range 15
𝑔𝑖(𝑟) = probability distribution function about remaining fuel range on origin node 𝑖 16
𝐺𝑖(𝑟) = cumulative distribution function of 𝑔𝑖(𝑟) 17
𝐺�𝑖𝑗 = failure ratio travel between O-D pair −𝑗 ; 𝐺�𝑖𝑗 = 𝐺𝑖(𝑐𝑖𝑗) 18
19
(e) Node-based variables 20
𝑄𝑖𝑗 = total demand between O-D pair 𝑖 − 𝑗 21
𝑦�𝑖𝑗𝑘 = charging ratio at the station 𝑘 of travel between O-D pair 𝑖 − 𝑗 (0 ≤ 𝑦�𝑖𝑗𝑘 ≤ 1 ) 22
𝑦�𝑖𝑗 = failure ratio of travel between O-D pair 𝑖 − 𝑗 23
𝑧𝑘 = �1 if we locate at candidate node 𝑘0 otherwise
24
𝑣𝑖𝑘 = �1 if station 𝑘 is the nearest from origin node 𝑖0 otherwise
25
𝑐𝑖𝑗 = minimum fuel consumption between O-D pair 𝑖 − 𝑗 26
𝜉𝑖𝑘𝑘′ = �1 if 𝑐𝑖𝑘 ≤ 𝑐𝑖𝑘′ (∀𝑖, 𝑘, 𝑘′)0 otherwise
27
28
(f) Link-based variables 29
𝑥𝑎 = flow on link 𝑎 30
𝑡𝑎 = travel time on link 𝑎 31
𝑐𝑎 = fuel consumption on link 𝑎 32
33
TRB 2014 Annual Meeting Paper revised from original submittal.

Lee, Kim, Kho, and Lee 9
(g) Node/link/path-based variables 1
𝑓ℎ𝑖𝑗 = flow on path ℎ between O-D pair 𝑖 − 𝑗 2
𝛿𝑎ℎ𝑖𝑗 = indicator variable; 𝛿𝑎ℎ
𝑖𝑗 = �1 if link a is on path ℎ between O − D pair 𝑖 − 𝑗0 otherwise
3
4
The proposed model is a bi-level optimization model. The main problem is a location-allocation 5
problem to minimize the social cost, while the sub-problem is the trip assignment problem based on the 6
user-equilibrium principle. In the main problem, the EV trip failure ratio, the trip ratio via each station for 7
each origin-destination pair, and the location of charging station are determined. The equations were 8
formulated based on the general facility-location problem (25). In the sub-problem, link flow was 9
determined. The equations in the sub-problem are the modification of Beckmann’s mathematical 10
programming (26). The mathematical model is as follows. 11
12
Main Problem: 13
𝑚𝑖𝑛 �𝜔��𝑄𝑖𝑗𝑐𝑖𝑗𝑦�𝑖𝑗 + (1 − 𝜔)�𝑥𝑎𝑡𝑎(𝑥𝑎)𝑎𝑗𝑖
� 5)
Subject to:
�𝑧𝑘𝑘
= 𝑃 6)
𝑦�𝑖𝑗𝑘 ≤ 𝑧𝑘 ∀ 𝑖, 𝑗, 𝑘 7)
𝑣𝑖𝑘 ≥�𝜉𝑖𝑘𝑘′𝑧𝑘′ + 𝑧𝑘𝑘′
− 𝑃 ∀ 𝑖, 𝑘 8)
𝑦�𝑖𝑗 ≥ 𝑣𝑖𝑘�𝐺�𝑖𝑘𝜉𝑖𝑘𝑗 + 𝐺�𝑖𝑗(1 − 𝜉𝑖𝑘𝑗)� ∀ 𝑖, 𝑗, 𝑘 9)
𝑦�𝑖𝑗 + �𝑦�𝑖𝑗𝑘 =𝑘
𝐺�𝑖𝑗 ∀ 𝑖, 𝑗 10)
𝑦�𝑖𝑗 + �𝑦�𝑖𝑗ℎ𝜉𝑖𝑘′𝑘(1 − 𝜉𝑖𝑘𝑘′)𝑘′
≥ 𝐺�𝑖𝑘𝜉𝑖𝑘𝑗 + 𝐺�𝑖𝑗𝜉𝑖𝑗𝑘(1 − 𝜉𝑖𝑘𝑗) ∀ 𝑖, 𝑗, 𝑘 11)
𝑦�𝑖𝑗𝑘 ≥ 0 ∀ 𝑖, 𝑗, 𝑘 12)
𝑧𝑘 , 𝑣𝑖𝑘 = 0, 1 ∀ 𝑖, 𝑘 13)
𝑥𝑎 satisfies the sub-problem. ∀ 𝑎 14)
Sub-Problem:
TRB 2014 Annual Meeting Paper revised from original submittal.

Lee, Kim, Kho, and Lee 10
𝑚𝑖𝑛�� 𝑡𝑎(𝜒)𝑑𝜒𝑥𝑎
0𝑎
15)
Subject to:
�𝑓ℎ𝑖𝑗
ℎ
= 𝑄�𝑖𝑗 + 𝑄�𝑖𝑗 ∀ 𝑖, 𝑗 16)
�𝑓ℎ𝑖𝑘
ℎ
= �𝑄𝑖𝑗𝑦�𝑖𝑗𝑘𝑗
∀ 𝑖, 𝑘 17)
�𝑓ℎ𝑘𝑗
ℎ
= �𝑄𝑖𝑗𝑦�𝑖𝑗𝑘𝑖
∀ 𝑘, 𝑗 18)
𝑥𝑎 = ���𝑓ℎ𝑖𝑗 ∙ 𝛿𝑎ℎ
𝑖𝑗
ℎ𝑗𝑖
+ ���𝑓ℎ𝑖𝑘 ∙ 𝛿𝑎ℎ𝑖𝑘
ℎ𝑘𝑖
+ ���𝑓ℎ𝑘𝑗 ∙ 𝛿𝑎ℎ
𝑘𝑗
ℎ𝑗𝑘
∀ 𝑎 19)
𝑡𝑎(𝜒) = 𝑡0 ∙ �1 + 𝛼 �𝜒𝑐𝑎𝑝
�𝛽� 20)
1
The objective function (eq. 5) of the main problem is to minimize the weighted average of the 2
network travel time and EV trip failure penalty. The constraint (eq. 6) stipulates that 𝑃 stations should be 3
located. The constraints (eq. 7) state that any user traveling from origin 𝑖 to destination 𝑗 cannot be 4
charged at station 𝑘 unless a charging station is located at node 𝑘. Constraints (eq. 8) are established for 5
finding the nearest station 𝑘 from origin node 𝑖. If station 𝑘 is the nearest station from origin 𝑖, the 6
number of stations that are at the same distance from node 𝑖 or farther is 𝑃. Thus, if the value of 7
equation ∑ 𝜉𝑖𝑘k′𝑧k′ + 𝑧𝑘𝑘′ is 𝑃 + 1, station 𝑘 is the nearest station from origin 𝑖, and 𝑣𝑖𝑘 becomes 1. 8
Constraints (eq. 9) define the travel failure ratio 𝑦�𝑖𝑗. If the nearest station from the origin is at the same 9
distance or closer than the destination, the travel failure ratio is the probability that RFR is shorter than 10
the distance between the origin and the nearest station. If the nearest station from the origin is farther than 11
the destination, the travel failure ratio is the probability that RFR is shorter than the distance between the 12
origin and the destination. Constraints (eq. 10) state that the sum of the travel failure ratio and the travel 13
success ratio with charging at any of the stations is the same as 𝐺�𝑖𝑗, which is the ratio that EVs cannot 14
travel without charging from the origin to the destination. Constraints (eq. 11) state that the probability of 15
being unable to go from origin 𝑖 to station 𝑘 is equal to or smaller than the sum of the travel failure 16
ratio and the travel success ratio with charging at any closer stations. Constraints (eq. 12) state that the 17
travel ratio has a non-negative value. Constraints (eq. 13) are the integrality constraints. Link flows are 18
determined at the sub-problem. 19
TRB 2014 Annual Meeting Paper revised from original submittal.

Lee, Kim, Kho, and Lee 11
The sub-problem is the traffic assignment model with user equilibrium (eq. 15-20). To simulate 1
the charging behavior, OD flow is split into two groups; one group consists of those who travel from 2
origin to destination directly (eq. 16), and the other group consists of those who travel and use charging 3
stations (eqs. 17-18). A travel with charging can be divided into two individual trips; one from origin to 4
station (eq. 17), and another from station to destination (eq. 18). As a result, OD flow with charging is 5
double counted. The split ratio is determined at the main problem. It is related to the user’s charging 6
behavior. If link travel time is not a function of link flow, but a constant, all the decision variables can be 7
determined without sub-problem. 8
The objective function is formulated as a multi-objective function based on EV trip failure 9
penalty and total travel time. Two objective functions are combined with weighting factor 𝜔. An EV 10
traveler tends to give up her or his trip with the EV if the detour cost is greater than the trip failure penalty. 11
When 𝜔 approaches 0, EV travelers decide their trip depending on travel cost. However, when 𝜔 12
approaches 1, more travelers travel with their EV. If 𝜔 is 1, the objective functions become the same as 13
the performance indices of Upchurch et al. Figure 3 shows the assignment results by varying 𝜔. 14
15
𝜔 0.0 0.1 0.2~0.9 1.0
Assignment result
Flow ratio
Failure (𝑦�18) 0.65 0.40 0.35 0.35
Charging at node 3 (𝑦�183)
0.00 0.00 0.05 0.30
Charging at node 4 (𝑦�184)
0.00 0.20 0.25 0.00
Travel without charging (𝑦�18)
0.35 0.35 0.35 0.35
Travel failure cost 549 338 296 296
Total travel cost 845 845 855 904
FIGURE 3 Assignment results by weight 𝝎. 16
17
TRB 2014 Annual Meeting Paper revised from original submittal.

Lee, Kim, Kho, and Lee 12
Since it is a combinatorial, optimization problem, the location problem can be solved only 1
through an enumeration technique. The computation complexity of an enumeration technique tends to 2
increase exponentially as the feasible regions become larger. Therefore, many heuristic methods have 3
been developed for solving location problems effectively, but they cannot be applied directly to the 4
proposed model. The reason is that the gradient function or descent direction of the objective function 5
cannot be calculated easily because the proposed model contains a sub-problem that has an objective 6
function that is different from that of the main problem. 7
The objective function for each solution of location can be evaluated in polynomial time by the 8
following steps. At the first time, the nearest station is calculated using the given 𝑧𝑘 and 𝑃 by equation 9
18. 10
𝑣𝑖𝑘 = �1 𝑖𝑓 𝑧𝑘 − 𝑃 + �𝜉𝑖𝑘𝑘′𝑧𝑘′
𝑘′= 1
0 𝑒𝑙𝑠𝑒 21)
11
Then, trip ratio (𝑦�𝑖𝑗 ,𝑦�𝑖𝑗𝑘) can be determined by solving a simple linear programming problem, as 12
shown in equations 22-27. The link flows, which are used for evaluating the objective function, can be 13
derived from the sub-problem (equations 15-20). The user equilibrium assignment problem is a convex, 14
non-linear programming problem, and it can be solved by using the Frank-Wolfe algorithm (26). 15
𝑚𝑖𝑛 �𝜔��𝑄𝑖𝑗𝑐𝑖𝑗𝑦�𝑖𝑗 + (1 − 𝜔)���𝑄𝑖𝑗𝜋𝑖𝑗𝑘𝑦�𝑖𝑗𝑘𝑘𝑗𝑖𝑗𝑖
� 22)
Subject to:
𝑦�𝑖𝑗𝑘 ≤ 𝑧𝑘∗ ∀ 𝑖, 𝑗, 𝑘 23)
𝑦�𝑖𝑗 ≥ 𝑣𝑖𝑘∗ �𝐺�𝑖𝑘𝜉𝑖𝑘𝑗 + 𝐺�𝑖𝑗(1 − 𝜉𝑖𝑘𝑗)� ∀ 𝑖, 𝑗, 𝑘 24)
𝑦�𝑖𝑗 + �𝑦�𝑖𝑗𝑘 =𝑘
𝐺�𝑖𝑗 ∀ 𝑖, 𝑗 25)
𝑦�𝑖𝑗 + �𝑦�𝑖𝑗ℎ𝜉𝑖𝑘`𝑘(1 − 𝜉𝑖𝑘𝑘`)𝑘`
≥ 𝐺�𝑖𝑘𝜉𝑖𝑘𝑗 + 𝐺�𝑖𝑗𝜉𝑖𝑗𝑘(1 − 𝜉𝑖𝑘𝑗) ∀ 𝑖, 𝑗, 𝑘 26)
𝑦�𝑖𝑗𝑘 ≥ 0 ∀ 𝑖, 𝑗, 𝑘 27)
where: 16
𝜋𝑖𝑗𝑘 = �𝑐𝑖𝑘 + 𝑐𝑘𝑗 − 𝑐𝑖𝑗 𝑖𝑓 𝑐𝑖𝑘 + 𝑐𝑘𝑗 > 𝑐𝑖𝑗0 𝑒𝑙𝑠𝑒
17
𝑧𝑘∗ is given 18
𝑣𝑖𝑘 = �1 𝑖𝑓 𝑧𝑘 − 𝑃 + ∑ 𝜉𝑖𝑘𝑘′𝑧𝑘′𝑘′ = 10 𝑒𝑙𝑠𝑒
19
TRB 2014 Annual Meeting Paper revised from original submittal.
Lee, Kim, Kho, and Lee 13
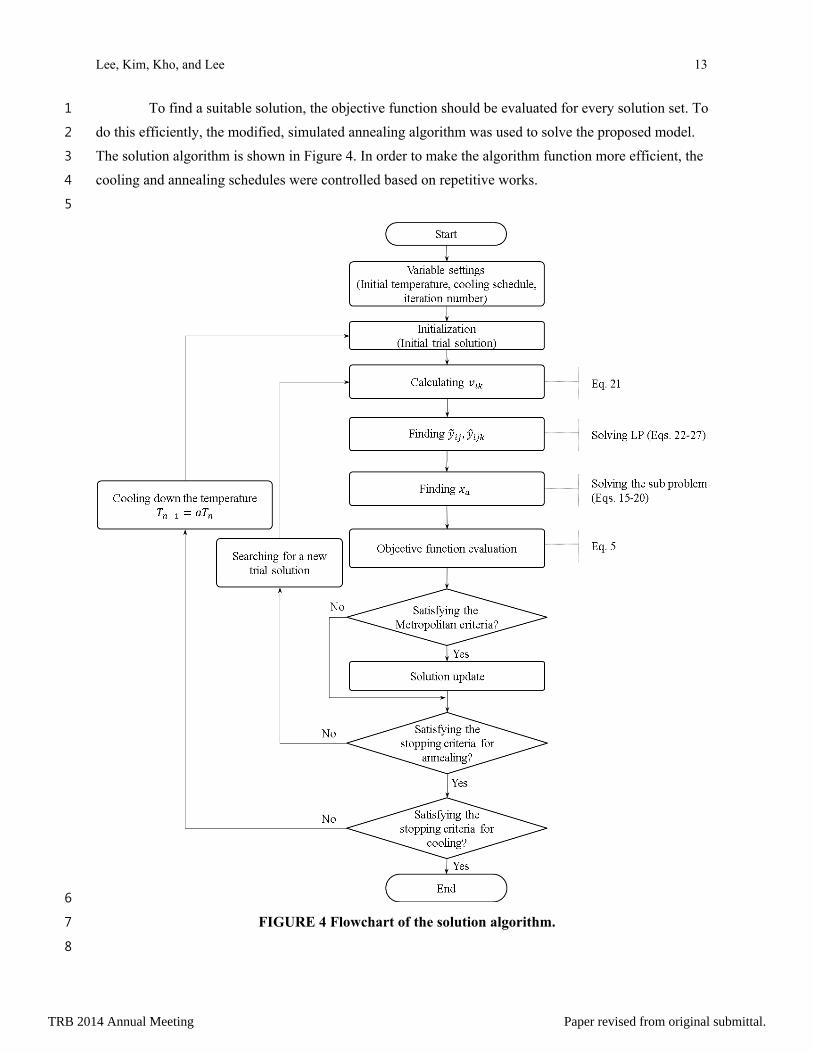
To find a suitable solution, the objective function should be evaluated for every solution set. To 1
do this efficiently, the modified, simulated annealing algorithm was used to solve the proposed model. 2
The solution algorithm is shown in Figure 4. In order to make the algorithm function more efficient, the 3
cooling and annealing schedules were controlled based on repetitive works. 4
5
6
FIGURE 4 Flowchart of the solution algorithm. 7
8
TRB 2014 Annual Meeting Paper revised from original submittal.

Lee, Kim, Kho, and Lee 14
APPLICATION AND RESULTS 1
We checked the validity and applicability of the proposed model on the modified Sioux-Falls 24-node 2
network, which was first used by LeBlanc (27). This network is not considered to be realistic, but it has 3
been used in many publications to debug code or examine the formats of data (28). The maximum 4
distance between the origin and the destination was 12.1 km in the original network data, so the test 5
network was enlarged to five times its original distance. Figure 5 summarizes the information on the base 6
condition. 7
8
(a) Network and OD
Number of nodes 24
Demand on peak (trip/hr) 360,600
Number of candidates 24
Maximum distance (km) 60
(b) Input parameter
Weight (𝜔) 0.5
(c) Travel time function
BPR function 𝛼 = 0.15, 𝛽 = 4.0
(d) RFR assumption
Vehicle Range (km) 60
Distribution function Probabilistic
note: The sizes of the circles indicate the departure volume from each node. The thicknesses of the lines indicate the capacity of each link.
FIGURE 5 Parameters and input data. 9
10
The main differences between the existing model and the proposed model were the RFR 11
assumption and the way in which the recharging station was chosen. In the existing model, every vehicle 12
had the same SOC and can be recharged only at the station on the shortest path. Only a few studies have 13
considered the possibility of taking a detour for recharging. The proposed model chooses the detour path 14
for travel via the recharging station endogenously. 15
First, we compared the solution of the existing model and the proposed model. Because the 16
former’s objective function was to minimize trip failure and the total travel cost was included in the 17
proposed model, the solutions can be different. However, it is difficult to determine whether one solution 18
is significantly better than the other. 19
When the RFR was assumed to be half of the vehicle range, RFR was 50 km in this application, 20
and the distances of most trips were shorter than the RFR (Figure 6). Thus, only one station should be 21
TRB 2014 Annual Meeting Paper revised from original submittal.

Lee, Kim, Kho, and Lee 15
constructed. Therefore, such an assumption cannot simulate the travel pattern of daily trips in an urban 1
area. This is the reason that we should use he probabilistic RFR distribution. We compared the proposed 2
model with the existing model under the assumption that the RFR distribution follows the uniform 3
distribution function. 4
5
6 FIGURE 6 EV travel failure by the assumption of RFR distribution function 7
8
We solved the problem using the proposed model and the existing model based on the 9
probabilistic RFR distribution function and compared their results. Model I is the existing model, in 10
which only the shortest paths were available. By adding constraints 𝜋𝑖𝑗𝑘 ∙ 𝑦�𝑖𝑗𝑘 = 0 for all 𝑖, 𝑗, 𝑘 to the 11
main problem, paths longer than the shortest paths must be used. If the reduced cost from origin node 𝑖 12
to destination node 𝑗 via station 𝑘 is greater than 0 (𝜋𝑖𝑗𝑘 > 0), station 𝑘 is not used (𝑦�𝑖𝑗𝑘 = 0). If 13
station 𝑘 is chosen (𝑦�𝑖𝑗𝑘 > 0), it means that station 𝑘 is on the shortest path from 𝑖 to 𝑗. Model II has 14
a detour available for recharging. 15
The number of trip failures and the cost of trip failures were decreased by increasing the number 16
of charging stations in both models. But no significant pattern of decreasing or increasing network costs 17
was found. The comparison of the two models indicated that, for the model that had a detour available, 18
trip failure and trip failure cost were worse than they were for the other model, but the total travel time 19
costs were better. This means that the proposed model can reflect travelers’ behaviors of making detours 20
to recharge so they can finish their trips in EV mode. 21
Finally, we analyzed the solution by the objective function. When the objective function is to 22
minimize the number of trip failures or the trip-failure costs, the total travel time of the network tended to 23
be larger. If the facilities were located based on the objective function, including only the trip-failure term, 24
they were likely to make the traffic condition worse. 25
TRB 2014 Annual Meeting Paper revised from original submittal.

Lee, Kim, Kho, and Lee 16
1 (a) EV trip failure (veh) 2
3
4 (b) EV trip failure cost (veh∙km) 5
6
7 (c) Total travel cost (veh∙hr) 8
FIGURE 7 Comparisons of performance indices by detour possibility. 9
TRB 2014 Annual Meeting Paper revised from original submittal.
Lee, Kim, Kho, and Lee 17
CONCLUSIONS AND FUTURE RESEARCH 1
In this paper, we reported the development of a model for locating rapid charging stations in urban areas. 2
The assumption made for RFR distribution helped to reflect the technology development or demand 3
variations. By using an assignment model that was user-based, charging and traveling behaviors could be 4
considered reasonably. The modified, simulated annealing algorithm was proposed to solve the problem 5
in polynomial time. According to the comparison with existing methods, the proposed model produced 6
more stable solutions for various inputs, while the other methods produced different solutions when the 7
number of stations or the vehicles’ ranges were changed. 8
From the results, we identified three significant implications. First, the present models used to 9
locate charging stations are only for slow-charging equipment, which can be installed in parking lots. But 10
to enhance the penetration of EVs, rapid charging stations are needed so they can be used during trips. 11
Therefore, we developed a location model for rapid-charging stations. Second, the location model with 12
constant RFR can produce different solutions when the vehicles’ ranges are changed. This makes it 13
difficult to determine definitively the best locations for EV charging stations when the technology is 14
advancing rapidly. Therefore, the location model that we developed can contribute to determining stable 15
locations for charging stations by using a probabilistic RFR distribution function, even though the 16
technology is being developed continuously. Third, the location model without the UE-based assignment 17
problem is not likely to consider the congested traffic condition of urban areas. When only a few charging 18
stations were installed during the EVs’ introduction stage, many detours occurred for charging during 19
trips, which can make traffic worse. This implies that the UE-based assignment should be included in the 20
charging station location problem. 21
The model developed in this study provides a suitable solution for the location of rapid charging 22
stations in an urban area because it reflects the probabilistic RFR distribution and the users’ practical 23
charging and traveling behaviors. To consider the viewpoint of decision makers, we can include 24
construction costs or operating costs in the objective function. Therefore, the model provides a theoretical 25
basis for determining suitable locations for rapid charging stations, and it can be applied directly to a real 26
network by using the modified algorithm developed in this study. 27
The proposed model can be improved in further research and assessment work. If the RFR 28
distribution function or battery consumption profile is surveyed in practice or predicted more reasonably, 29
the proposed model can provide a more accurate solution for the targeted area without any modifications 30
of the model. The optimal number of stations can be evaluated when the model is extended to include the 31
capacity of each station, charging speed, and the construction cost and operating cost of each station. By 32
combining this model with the location of slow-charging stations, or considering vehicle mixing, various 33
types of stations can be optimized, which is a subject for future research. 34
35
36
37
TRB 2014 Annual Meeting Paper revised from original submittal.

Lee, Kim, Kho, and Lee 18
ACKNOWLEDGEMENTS 1
The authors thank Dr. Dong-Kyu Kim at Seoul National University and the anonymous referees for their 2
constructive and helpful comments. The generous support from the Integrated Research Institute of 3
Construction and Environment at Seoul National University is also gratefully acknowledged. 4
5
REFERENCES 6
1. Boulanger, A. G., A. C. Chu, S. Maxx, and D. L. Waltz. Vehicle electrification: status and issues. 7
Proceedings of the IEEE, Vol. 99, No. 6, 2011, pp. 1116-1138. 8
2. Morrow, K., D. Karner and J. Francfort. Plug-in hybrid Electric Vehicle Charging Infrastructure., 9
Final Report Idaho National Laboratory. INL/EXT-08–15058, 2008. 10
3. Chan, C. C.. The state of the art of electric, hybrid, and fuel cell vehicles. Proceedings of the 11
IEEE, Vol. 95, No. 4, 2007, pp. 704-718. 12
4. Lin, Z., and D. L. Greene. Promoting the market for plug-in hybrid and battery electric vehicles. 13
Transportation Research Record: Journal of the Transportation Research Board, No. 2252, 14
2011, pp. 49–56. 15
5. Chen, T. D., K. M. Kockelman, and M. Khan. The electric vehicle charging station location 16
problem: a parking-based assignment method for Seattle. Proceedings of the 92nd Annual 17
Meeting of the Transportation Research Board, Washington DC, January 2013. 18
6. Frade, I., A. Ribeiro, G. A. Goncalves, and A. P. Antunes. Optimization model for location 19
electric vehicle charging stations in central urban areas. Transportation Research Record: 20
Journal of the Transportation Research Board, No. 2252, 2011, pp. 91-98. 21
7. Ge, S., L. Feng, and H. Liu. The planning of electric vehicle charging station based on Grid 22
partition method. International Conference on Electrical and Control Engineering (ICECE), 23
Yichang, China, September 16-18, 2011. 24
8. Hanabusa, H., and R. Horiguchi. Knowledge-Based and Intelligent Information and Engineering 25
Systems, 15th International Conference, Kaiserslautern, Germany, September 12-14, 2011. 26
9. Ip, A., S. Fong, and E. Liu. Optimization for allocating BEV recharging stations in urban areas 27
by using hierarchical clustering, 6th International Conference on Advanced Information 28
Management and Service (IMS), Seoul, Korea, November 30-December 2, 2010. 29
10. Wang, Y. Locating battery exchange stations to serve tourism transport: A note, Transportation 30
Research Part D, Vol. 13, 2008, pp. 193–197. 31
TRB 2014 Annual Meeting Paper revised from original submittal.

Lee, Kim, Kho, and Lee 19
11. Greater London Authority. London’s Electric Vehicle Infrastructure Strategy. Greater London 1
Authority, Greater London Authority City Hall The Queen’s Walk More London London SE1 2
2AA, Dec. 2009. 3
12. Wiederer, A., and R. Philip. Policy Options for Electric Vehicle Charging Infrastructure in C40 4
Cities. Report for Stephen Crolius Clinton Climate Initiative. Available from: 5
〈http://www.innovations.harvard.edu/ ache/documents/11089/1108934.pdf〉, 2010. 6
13. Berman, O., R. C. Larson, and N. Fouska. Optimal Location of Discretionary service Facilities. 7
Transportation Science, Vol. 26, No. 3, 1992, pp. 201-211. 8
14. Hodgson, M. J.. A flow-capturing location-allocation Model. Geographical Analysis, Vol. 22, 9
No. 3, 1990, pp. 270-279. 10
15. Kim, J. G. Location of Refueling Stations for Alternative Fuel Vehicles Considering Driver 11
Deviation Behavior and Uneven Consumer Demand: Model, Heuristics, and GIS, Unpublished 12
Ph.D. Dissertation, School of Geographical Sciences and Urban Planning, Arizona State 13
University, 2010. 14
16. Kim, J., and M. Kuby. The deviation-flow refueling location model for optimizing a network of 15
refueling stations. International Journal of Hydrogen Energy, Vol. 37, 2012, pp. 5406-5420. 16
17. Kuby, M., and S. Lim. The flow-refueling location problem for alternative-fuel vehicles. Socio-17
Economic Planning Sciences, Vol. 39, 2005, pp. 125–145. 18
18. Carpar, I., and M. Kuby. An efficient formulation of the flow refueling location model for 19
alternative-fuel stations. IIE Transactions, Vol. 44, No. 8, 2012, pp. 622-636 20
19. Kuby, M., and S. Lim. Location of alternative-fuel stations using the flow-refueling location 21
model and dispersion of candidate sites or arcs. Networks Spatial Economics, Vol. 7, 2007, pp. 22
129-152. 23
20. Kuby, M., L. Lines, R. Schultz, Z. Xie, J.G. Kim, and S. Lim. Optimization of hydrogen stations 24
in Florida using the flow-refueling location model, International Journal of Hydrogen Energy, 25
Vol. 34, No. 15, 2009, pp. 6045-6064. 26
21. Upchurch, C., M. Kuby, and S. Lim. A model for location of capacitated alternative-fuel stations. 27
Geographical Analysis, Vol. 41, 2009, pp. 85-106. 28
22. Wang, C., J. Yang, N. Liu, and Y. Mao. Study on siting and sizing of battery-switch station, 4th 29
International Conference on Electric Utility Deregulation and Restructuring and Power 30
Technologies (DRPT), Weihai, China, 2011, pp.657-662. 31
TRB 2014 Annual Meeting Paper revised from original submittal.

Lee, Kim, Kho, and Lee 20
23. Wang, Y., and C. Lin. Locating road-vehicle refueling stations. Transportation Research Part E: 1
Logistics and Transportation Review, Vol. 45, 2009, pp. 821–829. 2
24. Wang, Y., and C. Wang. Locating passenger vehicle refueling stations. Transportation Research 3
Part E: Logistics and Transportation Review, Vol. 46, 2010, pp. 791–801. 4
25. Daskin, M.S.. Network and Discrete Location: Models Algorithms and Applications, Wiley, 5
New York, 1995. 6
26. Sheffi, Y.. Urban Transportation Networks: Equilibrium Analysis with Mathematical 7
Programming Methods. Prentice-Hall, Inc., Englewood Cliffs, N.J., 1985. 8
27. LeBlanc, L., E. Morlok, W. Pierskalla. An efficient approach to solving the road network 9
equilibrium traffic assignment problem. Transportation Research, Vol. 9, 1975, pp. 309–318. 10
28. Bar-Gera Hillel, Transportation Network Test Problems, http://www.bgu.ac.il/~bargera/tntp/, 11
Accessed October 13, 2013. 12
13
TRB 2014 Annual Meeting Paper revised from original submittal.