ubisoft reports full-year 2016-17 sales and … · 2 paris, may 16, 2017 – today, ubisoft...
TRANSCRIPT

1
UBISOFT® REPORTS FULL-YEAR 2016-17
SALES AND EARNINGS FIGURES
Company posts third consecutive year-on-year rise in non-IFRS operating margin,
with record-high digital revenue and back-catalog sales,
reflecting the Group's transformation toward a more profitable and recurring model
2016-17: RECORD HIGH NON-IFRS OPERATING INCOME, UP 40.7% IN LINE WITH
TARGETS
Total annual sales of €1,459.9 million, up 4.7% year on year, in line with the target range of
between €1,455.0 million and €1,495.0 million
€729.3 million in digital revenue, representing 50.0% of total sales (32.0% in 2015-16)
- Sharp 26.7% increase in MAUs1
- 131.2% surge in Player Recurring Investment2 to 304.0 M€
€649.2 million in back-catalog sales, accounting for 44.5% of total sales (25.7% in 2015-16)
Solid performance in the fourth fiscal quarter:
- Number one publisher worldwide3 since the beginning of calendar 2017
- Tom Clancy’s Ghost Recon® Wildlands, the industry’s best-selling3 game since the
beginning of the year: the Ghost Recon community grew approximately 60%
- For Honor® – the industry’s second best-selling game3
Non-IFRS operating income up 40.7% to a record high €237.7 million, in line with the target
range of between €230.0 million and €250.0 million, and higher than the initial target of
€230.0 million
- Non-IFRS operating margin reaches a record 16.3% (12.1% in 2015-16)
TARGETS FOR 2017-184: FURTHER EARNINGS GROWTH
Sales of around €1,700.0 million
Non-IFRS operating income of around €270.0 million
STRATEGIC PLAN TARGETS FOR 2018-194 REVISED TO FACTOR IN THE POSITIVE
IMPACT OF THE GROUP’S NEW RECURRING MODEL. HIGHER NON-IFRS OPERATING
MARGIN
Sales of around €2,100.0 million (previous target of €2,200.0 million), with:
- 4 AAA releases for around 28 million units
- Digital revenue to represent more than 55% of total sales
- Increased games lifetime: significantly higher back catalog sales compared with
previous estimates
An increase in the operating margin target to 21.0% (20.0% previously), and non-IFRS
operating income target kept at around €440.0 million.
1 Monthly Active Users 2 Player Recurring Investment includes sales of digital items, DLC, season passes, subscriptions and advertising 3 Physical & digital sales of games, Jan-March 2017 – consoles/PC – EMEA/US/Japan/Australia (GfK/NPD/Famitsu/in-house estimates) 4 Targets calculated in accordance with currently applicable IFRS

2
Paris, May 16, 2017 – Today, Ubisoft released its sales and earnings figures for the fiscal year
ended March 31, 2017.
Yves Guillemot, Co-Founder and Chief Executive Officer, stated: “The execution of our strategic
plan fully paid off in 2016-17, with further very strong growth for the digital segment – which
now accounts for 50% of total sales – and an ever-more recurring profile.”
“With 44 million unique registered players, the size of the Tom Clancy community has increased
by almost 150% in less than 18 months. This impressive performance for a brand created almost
20 years ago clearly illustrates the strong popularity of Ghost Recon Wildlands, Rainbow Six Siege
and The Division. Our Live titles continue to beat records for player engagement and have seen
a sharp rise in player recurring investment. Our results for 2016-17 demonstrate the success of
our new model, with record high operating income and outperforming the target announced a
year ago, and operating margin up for the third consecutive year."
“Over the last three fiscal years, Ubisoft has – with remarkable success – created numerous new
brands and rebooted Rainbow Six and Ghost Recon. These successes have strengthened our
visibility for the coming two fiscal years, with a line-up of releases principally comprised of
established franchises. In 2017-18 we will see the exciting returns of Assassin’s Creed, Far Cry,
The Crew and South Park.
In 2018-19 we intend to pursue our digital transformation and consolidate our new business
model, which is much more recurring and more profitable and is now significantly less exposed
to new releases. This revision of our assumptions gives greater visibility for meeting our targets.”
"Our dynamic trajectory is being led by the growing footprint of video games in the entertainment
industry. Ubisoft is playing a leading role in this respect thanks to the creativity of our teams, the
power of our owned brands, the digital transformation that has generated direct relationships
with our communities, and our numerous growth drivers, particularly in terms of geographic
markets. Beyond 2018-19 we will continue to catch up with our competitors in terms of player
recurring investment, which represents huge value creation potential for our shareholders."
3
Note
All of the figures in this press release correspond to non-IFRS data adjusted to exclude non-operating items, unless stated
otherwise. The Group presents these indicators – which are not prepared strictly in accordance with IFRS – as it considers
that they are the best reflection of its operating and financial performance. The definitions of the non-IFRS indicators with
a description of the applicable adjustments, as well as a reconciliation table between the IFRS consolidated income
statement and the non-IFRS consolidated income statement are provided in an appendix to this press release.
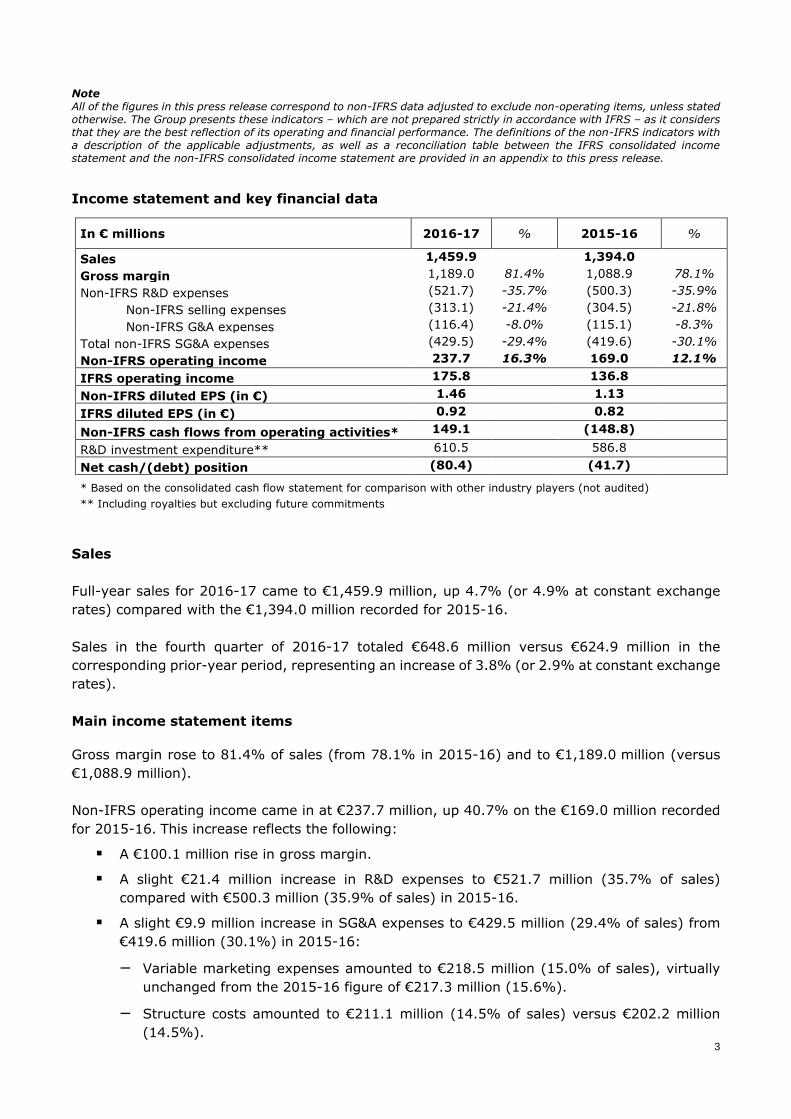
Income statement and key financial data
In € millions 2016-17 % 2015-16 %
Sales 1,459.9 1,394.0 Gross margin 1,189.0 81.4% 1,088.9 78.1% Non-IFRS R&D expenses (521.7) -35.7% (500.3) -35.9%
Non-IFRS selling expenses (313.1) -21.4% (304.5) -21.8% Non-IFRS G&A expenses (116.4) -8.0% (115.1) -8.3%
Total non-IFRS SG&A expenses (429.5) -29.4% (419.6) -30.1% Non-IFRS operating income 237.7 16.3% 169.0 12.1% IFRS operating income 175.8 136.8 Non-IFRS diluted EPS (in €) 1.46 1.13 IFRS diluted EPS (in €) 0.92 0.82
Non-IFRS cash flows from operating activities* 149.1 (148.8) R&D investment expenditure** 610.5 586.8 Net cash/(debt) position (80.4) (41.7)
* Based on the consolidated cash flow statement for comparison with other industry players (not audited) ** Including royalties but excluding future commitments
Sales
Full-year sales for 2016-17 came to €1,459.9 million, up 4.7% (or 4.9% at constant exchange
rates) compared with the €1,394.0 million recorded for 2015-16.
Sales in the fourth quarter of 2016-17 totaled €648.6 million versus €624.9 million in the
corresponding prior-year period, representing an increase of 3.8% (or 2.9% at constant exchange
rates).
Main income statement items
Gross margin rose to 81.4% of sales (from 78.1% in 2015-16) and to €1,189.0 million (versus
€1,088.9 million).
Non-IFRS operating income came in at €237.7 million, up 40.7% on the €169.0 million recorded
for 2015-16. This increase reflects the following:
A €100.1 million rise in gross margin.
A slight €21.4 million increase in R&D expenses to €521.7 million (35.7% of sales)
compared with €500.3 million (35.9% of sales) in 2015-16.
A slight €9.9 million increase in SG&A expenses to €429.5 million (29.4% of sales) from
€419.6 million (30.1%) in 2015-16:
− Variable marketing expenses amounted to €218.5 million (15.0% of sales), virtually
unchanged from the 2015-16 figure of €217.3 million (15.6%).
− Structure costs amounted to €211.1 million (14.5% of sales) versus €202.2 million
(14.5%).

4
Ubisoft ended 2016-17 with non-IFRS net income of €174.3million, representing non-IFRS diluted
earnings per share of €1.46, compared with non-IFRS net income of €129.0 million and non-IFRS
diluted earnings per share of €1.13 for 2015-16.
IFRS net income came to €107.8 million, representing IFRS diluted earnings per share of €0.92
versus IFRS net income of €93.4 million and IFRS diluted earnings per share of €0.82 in 2015-
16.
Main cash flow statement5 and balance sheet items
Non-IFRS cash flows from operating activities represented a net inflow of €149.1 million compared
with a €148.8 million net outflow in 2015-16. This positive swing reflects an improvement in non-
IFRS cash flow from operations which amounted to €110.2 million (versus €104.6 million in 2015-
16), and a €38.9 million decrease in non-IFRS working capital requirement (against a €253.3
million increase in 2015-16).
At March 31, 2017, Ubisoft had net debt of €80.4 million versus €41.7 million one year earlier.
This increase reflects the combined impact of the following:
- The €149.1 million in cash flows from operating activities
- A €63.4 million net cash outflow arising on acquisitions and disposals of intangible
assets and property, plant and equipment
- A €105.6 million cash outflow relating to acquisitions (including Ketchapp et
Growtopia™)
- A €9.5 million cash inflow on the exercise of stock options
- A €67.8 million cash outflow due to buybacks
- The recognition in equity of €39.6 million related to the value of the equity
component of the convertible bond issued on September 21, 2016
Outlook
Full-year 2017-18
Ubisoft’s initial targets for 2017-18, as announced today, are as follows: sales of around €1,700.0
million and non-IFRS operating income of around €270.0 million.
This growth will be fueled by: -
- A growth of our new releases, with 4 AAA franchises: Assassin’s Creed®, Far Cry®, The
Crew® and South Park™: The Fractured But Whole™. -
- Another rise in player recurring investment. The digital segment is expected to contribute
over 50% to total sales in 2017-18 and the back-catalog over 40%.
First quarter of 2017-18
The Group expects first-quarter 2017-18 sales to amount to approximately €170.0 million, up
22.0% on first-quarter 2016-17.
5 Based on the consolidated cash flow statement for comparison with other industry players (not audited)

5
Update of 2018-19 targets
The Company has revised its 2018-19 targets, which are now as follows:
- Sales of around €2,100.0 million, compared with the previous target of €2,200.0 million
- Non-IFRS operating income of €440.0 million, in line with the previous target, with an
increase in the non-IFRS operating margin target to 21.0% from 20.0% previously
- Free cash flow of around €300.0 million, in line with the previous target
This performance will be driven by:
- The release of four AAA titles with three established franchises and a new brand (compared
with five established franchises previously). The total number of units for these releases
is expected to be around 28 million, compared with the 40 million previously announced
- Digital revenue, which is expected to account for more than 55% of total sales (versus
around 45% previously) with player recurring investment representing more than 25%
(versus around 17% previously)
- Significantly higher Back-catalog compared with previous assumptions, both in absolute
value terms and as a percentage of sales
Recent significant events
Partnership with Tencent to launch Might and Magic® Heroes: Era of Chaos: This mobile game,
developed exclusively for China by Playcrab, will be published by Tencent, a leading provider of
Internet value added services in China.
Success of the mobile game, Ballz™: Released by Ketchapp on February 18, 2017, Ballz was
ranked in the top three most downloaded games on iOS in the US for 63 days (source: App Annie).
Ghost Recon Wildlands Beta phases make Ubisoft history: More than 6.8 million players
participated in these Beta phases. Over 60% of players have gathered their squads to play the
Open Beta in Co-op on PS4, Xbox One and PC.
Acquisition of Growtopia: Ubisoft has acquired this successful multiplayer and social game that gives players the framework and tools to create interactive game worlds. Launched in 2013,
Growtopia is a free-to-play game supported by a highly-engaged community of more than 20 million registered users. The acquisition of Growtopia has an immediate accretive effect on
Ubisoft's earnings.
Contact Investor relations
Jean-Benoît Roquette
SVP Investor Relations
+ 33 1 48 18 52 39
6
Disclaimer
This statement may contain estimated financial data, information on future projects and transactions and future
business results/performance. Such forward-looking data are provided for estimation purposes only. They are
subject to market risks and uncertainties and may vary significantly compared with the actual results that will be
published. The estimated financial data have been presented and approved by the Board of Directors on 05/16/17
and have not been audited by the Statutory Auditors. (Additional information is specified in the most recent Ubisoft
Registration Document filed on July 22, 2016 with the French Financial Markets Authority (l’Autorité des Marchés
Financiers)).
About Ubisoft
Ubisoft is a leading creator, publisher and distributor of interactive entertainment and services, with a rich portfolio
of world-renowned brands, including Assassin’s Creed, Just Dance, Watch_Dogs, Tom Clancy’s video game series,
Rayman and Far Cry. The teams throughout Ubisoft’s worldwide network of studios and business offices are
committed to delivering original and memorable gaming experiences across all popular platforms, including consoles,
mobile phones, tablets and PCs. For the 2016-17 fiscal year Ubisoft generated sales of €1,460 million. To learn more,
please visit www.ubisoftgroup.com.
© 2017 Ubisoft Entertainment. All rights Reserved. Ubisoft and the Ubisoft logo are trademarks of Ubisoft Entertainment in the US and/or other countries. © 2017 South Park Digital Studios LLC. All Rights Reserved. South Park and all elements thereof © 2017 Comedy Partners. All Rights Reserved. Comedy Central, South Park and all related titles, logos, and characters are trademarks of Comedy Partners. Game software © 2017 Ubisoft Entertainment. All Rights Reserved.

7
APPENDICES
Breakdown of sales by geographic region
% Sales % Sales % Sales % Sales
Q4 2016/17 Q4 2015/16 12 months 2016/17
12 months 2015/16
Europe 36% 43% 38% 40%
North America 48% 47% 47% 48%
Rest of world 16% 10% 15% 12%
TOTAL 100% 100% 100% 100%
Breakdown of sales by platform
Q4 2016/17 Q4 2015/16 12 months
2016/17 12 months 2015/16
PLAYSTATION®4 46% 49% 41% 42%
XBOX One™ 30% 31% 27% 26% PC 17% 14% 18% 14%
XBOX 360™, PS®3, Wii™, Wii U™ 2% 3% 7% 12%
Others* 5% 3% 7% 6%
TOTAL 100% 100% 100% 100%
*Mobile, ancillaries…

8
Title release schedule
1st quarter (April – June 2017)
PACKAGED DIGITAL
JUST DANCE® 2017 CHINA EDITION
PLAYSTATION®4, Xbox One™
DIGITAL ONLY
FOR HONOR® SEASON 2 SHADOW & MIGHT
PC, PLAYSTATION®4, Xbox One™
HUNGRY SHARK® VR
Daydream
STAR TREK™ BRIDGE CREW (VR)
HTC VIVE PC, Oculus Rift PC,
PS VR PLAYSTATION®4,
STEEP™ EXTREME
PC, PLAYSTATION®4, Xbox One™
STEEP™ WINTERFEST
PC, PLAYSTATION®4, Xbox One™
TOM CLANCY’S GHOST RECON® WILDLANDS FALLEN GHOSTS
PC, PLAYSTATION®4, Xbox One™
TOM CLANCY’S GHOST RECON® WILDLANDS NARCO ROAD
PC, PLAYSTATION®4, Xbox One™
TRACKMANIA® 2 LAGOON
PC
VIRTUAL RABBIDS® THE BIG PLAN (VR)
Daydream
WATCH DOGS® 2 NO COMPROMISE
PC, Xbox One™
9
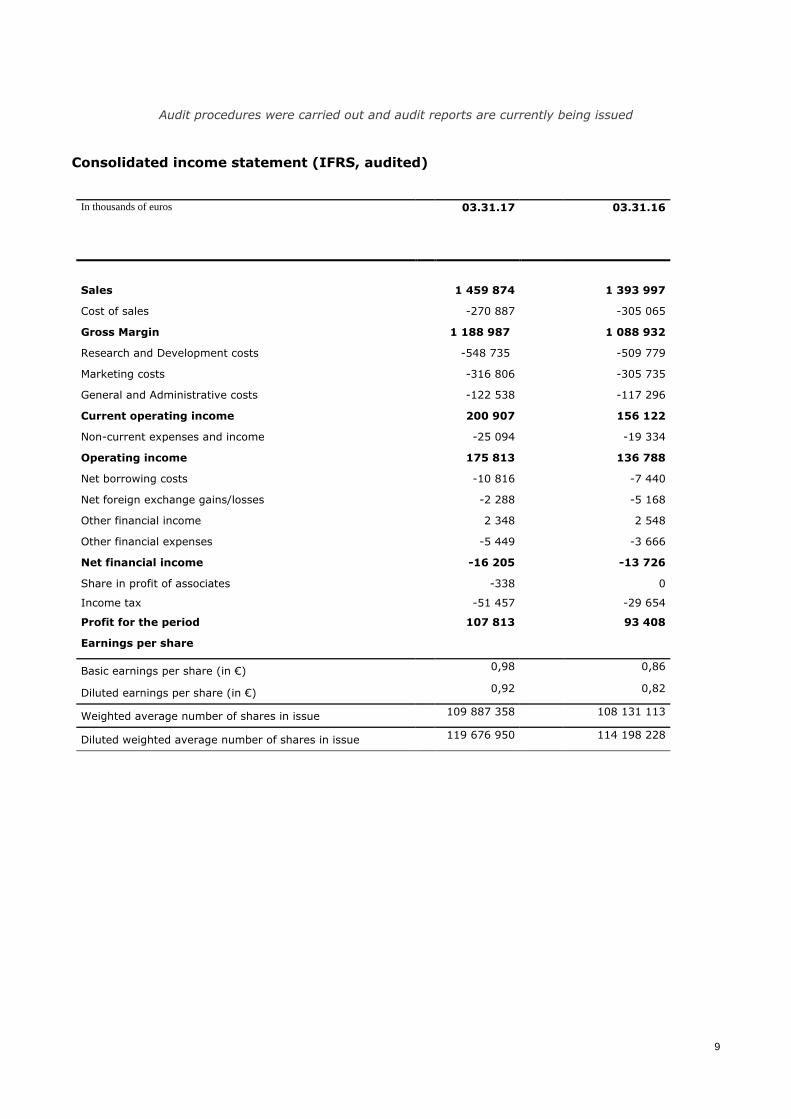
Audit procedures were carried out and audit reports are currently being issued
Consolidated income statement (IFRS, audited)
In thousands of euros
03.31.17 03.31.16
Sales 1 459 874 1 393 997
Cost of sales -270 887 -305 065
Gross Margin 1 188 987 1 088 932
Research and Development costs -548 735 -509 779
Marketing costs -316 806 -305 735
General and Administrative costs -122 538 -117 296
Current operating income 200 907 156 122
Non-current expenses and income -25 094 -19 334
Operating income 175 813 136 788
Net borrowing costs -10 816 -7 440
Net foreign exchange gains/losses -2 288 -5 168
Other financial income 2 348 2 548
Other financial expenses -5 449 -3 666
Net financial income -16 205 -13 726
Share in profit of associates -338 0
Income tax -51 457 -29 654
Profit for the period 107 813 93 408
Earnings per share
Basic earnings per share (in €) 0,98 0,86
Diluted earnings per share (in €) 0,92 0,82
Weighted average number of shares in issue 109 887 358 108 131 113
Diluted weighted average number of shares in issue 119 676 950 114 198 228
10
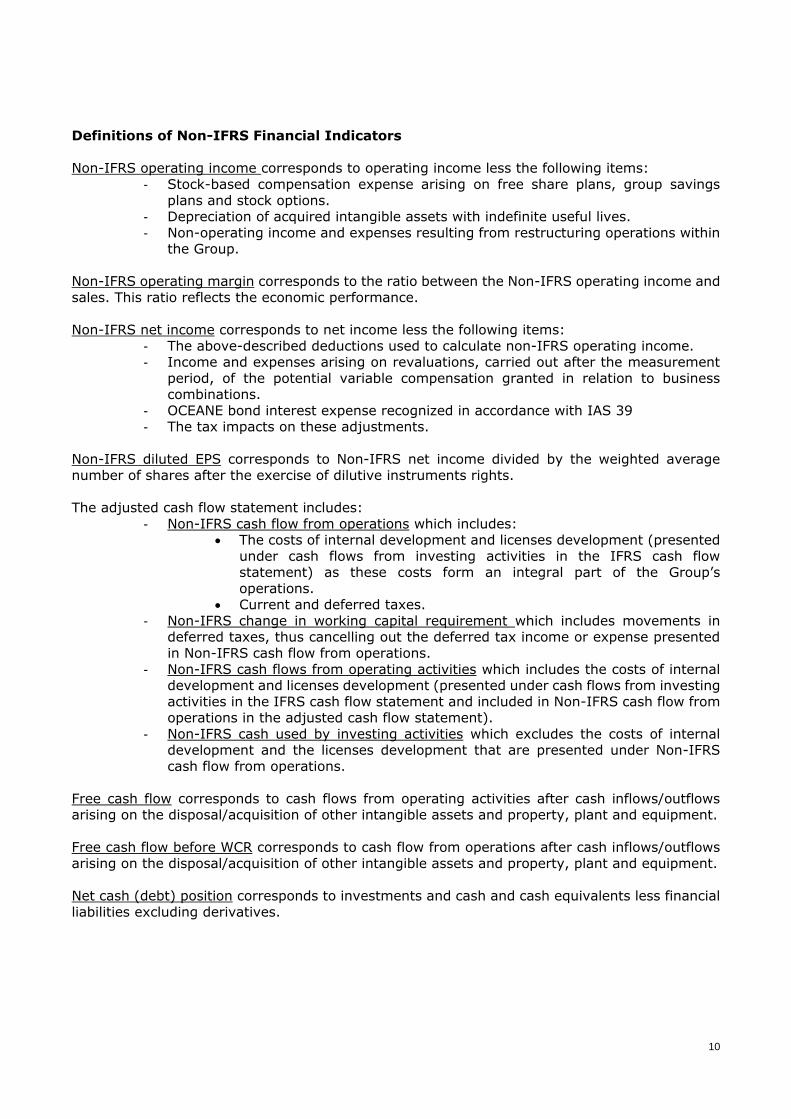
Definitions of Non-IFRS Financial Indicators
Non-IFRS operating income corresponds to operating income less the following items:
- Stock-based compensation expense arising on free share plans, group savings
plans and stock options. - Depreciation of acquired intangible assets with indefinite useful lives.
- Non-operating income and expenses resulting from restructuring operations within the Group.
Non-IFRS operating margin corresponds to the ratio between the Non-IFRS operating income and
sales. This ratio reflects the economic performance.
Non-IFRS net income corresponds to net income less the following items:
- The above-described deductions used to calculate non-IFRS operating income. - Income and expenses arising on revaluations, carried out after the measurement
period, of the potential variable compensation granted in relation to business combinations.
- OCEANE bond interest expense recognized in accordance with IAS 39 - The tax impacts on these adjustments.
Non-IFRS diluted EPS corresponds to Non-IFRS net income divided by the weighted average
number of shares after the exercise of dilutive instruments rights.
The adjusted cash flow statement includes:
- Non-IFRS cash flow from operations which includes: The costs of internal development and licenses development (presented
under cash flows from investing activities in the IFRS cash flow statement) as these costs form an integral part of the Group’s
operations. Current and deferred taxes.
- Non-IFRS change in working capital requirement which includes movements in deferred taxes, thus cancelling out the deferred tax income or expense presented
in Non-IFRS cash flow from operations.
- Non-IFRS cash flows from operating activities which includes the costs of internal development and licenses development (presented under cash flows from investing
activities in the IFRS cash flow statement and included in Non-IFRS cash flow from operations in the adjusted cash flow statement).
- Non-IFRS cash used by investing activities which excludes the costs of internal development and the licenses development that are presented under Non-IFRS
cash flow from operations.
Free cash flow corresponds to cash flows from operating activities after cash inflows/outflows arising on the disposal/acquisition of other intangible assets and property, plant and equipment.
Free cash flow before WCR corresponds to cash flow from operations after cash inflows/outflows
arising on the disposal/acquisition of other intangible assets and property, plant and equipment.
Net cash (debt) position corresponds to investments and cash and cash equivalents less financial
liabilities excluding derivatives.

11
Reconciliation of IFRS Net income and non-IFRS Net income
In million of euros, except for per share data
2016-17 2015-16
IFRS Ajustments Non-IFRS IFRS Ajustments Non-IFRS
Sales 1 459,9 1 459,9 1 394,0 1 394,0
Total Operating expenses (1 284,1) 61,9 (1 222,2) (1 257,2) 32,3 (1 225,0)
Stock-based compensation (36,8) 36,8 0,0 (12,9) 12,9 0,0
Non-current expenses and income (25,1) 25,1 0,0 (19,3) 19,3 0,0
Operating Income 175,8 61,9 237,7 136,8 32,3 169,0
Net Financial income (16,2) 7,2 (9,0) (13,7) 3,3 (10,4)
Share in profit of associates (0.3) - (0.3) - - -
Income tax (51,4) (2,6) (54,0) (29,7) 0,0 (29,7)
Net Income 107,8 66,5 174,3 93,4 35,6 129,0
Diluted earnings per share 0,92 0,54 1,46 0,82 0,31 1,13
12
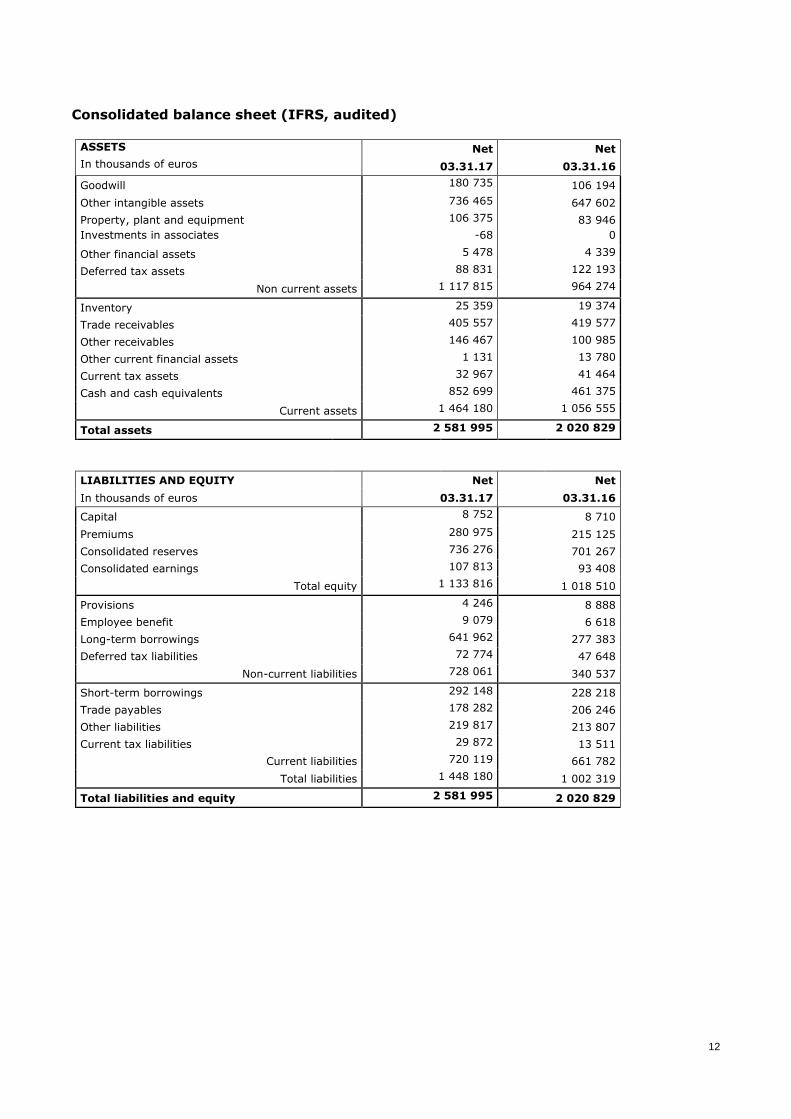
Consolidated balance sheet (IFRS, audited)
ASSETS Net Net
In thousands of euros 03.31.17 03.31.16
Goodwill 180 735 106 194
Other intangible assets 736 465 647 602
Property, plant and equipment 106 375 83 946
Investments in associates -68 0
Other financial assets 5 478 4 339
Deferred tax assets 88 831 122 193
Non current assets 1 117 815 964 274
Inventory 25 359 19 374
Trade receivables 405 557 419 577
Other receivables 146 467 100 985
Other current financial assets 1 131 13 780
Current tax assets 32 967 41 464
Cash and cash equivalents 852 699 461 375
Current assets 1 464 180 1 056 555
Total assets 2 581 995 2 020 829
LIABILITIES AND EQUITY Net Net
In thousands of euros 03.31.17 03.31.16
Capital 8 752 8 710
Premiums 280 975 215 125
Consolidated reserves 736 276 701 267
Consolidated earnings 107 813 93 408
Total equity 1 133 816 1 018 510
Provisions 4 246 8 888
Employee benefit 9 079 6 618
Long-term borrowings 641 962 277 383
Deferred tax liabilities 72 774 47 648
Non-current liabilities 728 061 340 537
Short-term borrowings 292 148 228 218
Trade payables 178 282 206 246
Other liabilities 219 817 213 807
Current tax liabilities 29 872 13 511
Current liabilities 720 119 661 782
Total liabilities 1 448 180 1 002 319
Total liabilities and equity 2 581 995 2 020 829

13
Consolidated cash flow statement for comparison with other industry players (non audited)
In thousands of euros 03.31.17 03.31.16
Cash flows from non-IFRS operating activities
Consolidated earnings 107 813 93 408
+/- Share in profit of associates 338 0
+/- Depreciation on internal & external games & movies 407 816 402 959
+/- Other depreciation 66 819 59 841
+/- Provisions -2 563 449
+/- Cost of share-based payments 36 836 12 918
+/- Gains / losses on disposals 408 104
+/- Other income and expenses calculated -10 655 24 335
+/- Cost of internal development and license development -496 588 -489 464
CASH FLOW FROM NON-IFRS OPERATION 110 223 104 550
Inventory -5 381 -11
Trade receivables 31 934 -402 877
Other assets 3 113 -29 918
Trade payables -45 082 116 466
Other liabilities 54 315 63 033
+/- Change in working capital from non-IFRS operating activities 38 899 -253 307
TOTAL CASH FLOW GENERATED BY NON-IFRS OPERATING ACTIVITIES 149 122 -148 757
- Payments for the acquisition of intangible assets and property, plant and equipment -62 914 -42 499
+ Proceeds from the disposal of intangible assets and property, plant and equipment 603 67
+/- Other cash flows from investing activities -44 374 -34 391
+ Repayment of loans and other financial assets 43 322 34 115
+/- Changes in scope (1) -105 642 358
CASH USED BY NON-IFRS INVESTING ACTIVITIES -169 005 -42 350
Cash flows from financing activities
+ New long term loans 669 147 234 554
+ New finance leases 1 416 0
- Repayment of finance leases -898 -891
- Repayment of borrowings -214 663 -230 216
+ Proceeds from shareholders in capital increases 9 465 21 924
+/- Sales / purchases of own shares -67 844 -77 272
+/- Partner current account 0 258
CASH GENERATED (USED) BY FINANCING ACTIVITIES 396 623 -51 643
Net change in cash and cash equivalents 376 740 -242 750
Cash and cash equivalents at the beginning of the fiscal year 255 688 505 215
Impact of translation adjustments -114 -6 777
Cash and cash equivalents at the end of the fiscal year(1) 632 314 255 688
(1) Including cash in companies acquired and disposed of 26 421 371
RECONCILIATION OF NET CASH POSITION
Cash and cash equivalents at the end of the period 632 314 255 688
Bank borrowings and from the restatement of finance leases -646 752 -282 372
Commercial papers -66 000 -15 000
NET CASH POSITION -80 438 -41 684

14
Consolidated cash flow statement IFRS (audited)
In thousand of euros 03.31.17 03.31.16
Cash flows from operating activities adjusted
Consolidated earnings 107 813 93 408
+/- Share in profit of associates 338 0
+/- Depreciation 474 635 462 800
+/- Provisions -2 563 449
+/- Cost of share-based payments 36 836 12 918
+/- Gains / losses on disposals 408 104
+/- Other income and expenses calculated -10 655 24 335
+/- Tax Expense 51 457 29 654
TOTAL CASH FLOW FROM OPERATIONS 658 269 623 668
Inventory -5 381 -11
Trade receivables 31 934 -402 877
Other assets 11 854 -30 588
Trade payables -45 082 116 466
Other liabilities 30 256 61 635
+/- Change in working capital from operating activities adjusted 23 582 -255 375
+/- Payable tax expense -36 140 -27 586
TOTAL CASH FLOW GENERATED BY OPERATING ACTIVITIES 645 711 340 707
- Payments for the acquisition of internal & external games -496 588 -489 464
- Payments for the acquisition of intangible assets and property, plant and equipment -62 914 -42 499
+ Proceeds from the disposal of intangible assets and property, plant and equipment 603 67
+/- Other cash flows from investing activities -44 374 -34 391
+ Repayment of loans and other financial assets 43 322 34 115
+/- Changes in scope (1) -105 642 358
CASH USED BY INVESTING ACTIVITIES ADJUSTED -665 594 -531 814
Cash flows from financing activities
+ New long term loans 669 147 234 554
+ New finance leases 1 416 0
- Repayment of finance leases -898 -891
- Repayment of borrowings -214 663 -230 216
+ Proceeds from shareholders in capital increases 9 465 21 924
+/- Sales / purchases of own shares -67 844 -77 272
+/- Partner current account 0 258
CASH GENERATED (USED) BY FINANCING ACTIVITIES 396 623 -51 643
Net change in cash and cash equivalents 376 740 -242 750
Cash and cash equivalents at the beginning of the fiscal year 255 688 505 215
Impact of translation adjustments -114 -6 777
Cash and cash equivalents at the end of the fiscal year(1) 632 314 255 688
(1) Including cash in companies acquired and disposed of 26 421 371