u se of swem a hep tmdl o versight g roup · pdf fileu se of swem to address hep tmdl o...
TRANSCRIPT

HYDRO QUAL, INC.
1200 M ACARTHUR, M AHWAH, N EW JERSEY 07430 T: 201-529-5151 F: 201-529-5728 WWW.HYDROQUAL.COM
USE OF SWEM TO ADDRESS HEP TMDL OVERSIGHT GROUP NUTRIENT
MANAGEMENT QUESTIONS
July, 2006
Background InformationThe NY/NJ Harbor Estuary Program (HEP) TMDL Oversight Group (OG) posed two initialmanagement questions:
• What are the current conditions as they relate to New York State’s version of the marinedissolved oxygen criteria and, in low salinity waters, the New Jersey dissolved oxygenstandard of never (24-hour average) less than 5 mg/L?
• If achievable, what would it take to meet these standards Harbor-wide, within a usefulmanagement framework (e.g., by management zones)?
Described below are answers to these questions developed using SWEM.
What are the current conditions?The marine dissolved oxygen criteria adopted by New York State include acute and chronic levels ofprotection: no 24-hour average less than 3.0 mg/L for protection of juvenile and adult survival (i.e.,acute) and allowable excursions between 3.0 and 4.8 mg/L for protection of larval recruitment (i.e.,chronic). In the low salinity portions of the Hackensack and Raritan Rivers, New Jersey SE1 (neverless than 4.0 mg/L and no 24-hour average less than 5.0 mg/L) dissolved oxygen standards areapplicable. In the low salinity portion of the Passaic River, New Jersey FW2-NT/SE2 (never lessthan 4.0 mg/L and no 24-hour average less than 5.0 mg/L when the salinity at mean high tide is lessthan 3.5 ppt) dissolved oxygen standards are applicable. Compliance with the New York State acute(i.e., no 24-hour average less than 3.0 mg/L) and chronic standard (i.e., allowable excursionsbetween 3.0 and 4.8 mg/L) and the New Jersey 24-hour average based standard (never less than 5.0mg/L), absent continuous dissolved oxygen measurements, can be assessed only through modelingcalculations. Accordingly, HydroQual’s approach for addressing the OG questions includedmodeling.
For purposes of addressing the OG questions, current conditions were defined by the NWG SWEMbaseline conditions (i.e., 1988 and 1989 hydrology with loadings based largely on 1994-95measurements and all facilities at full secondary treatment).
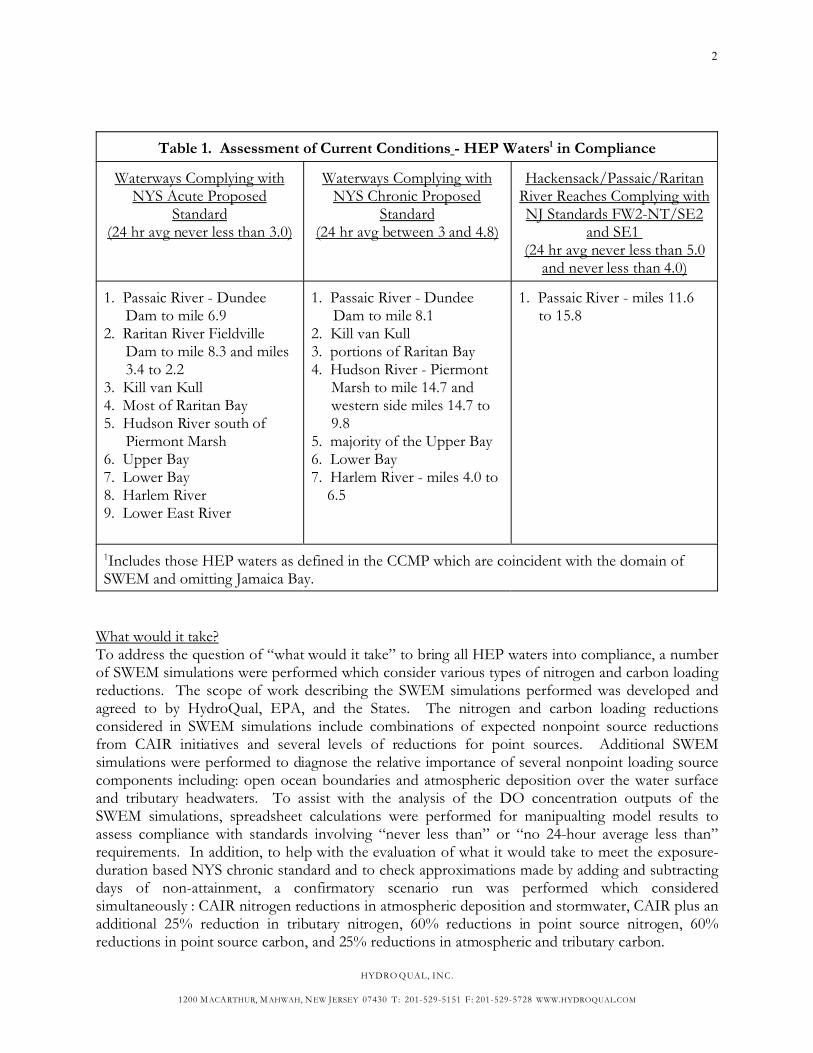
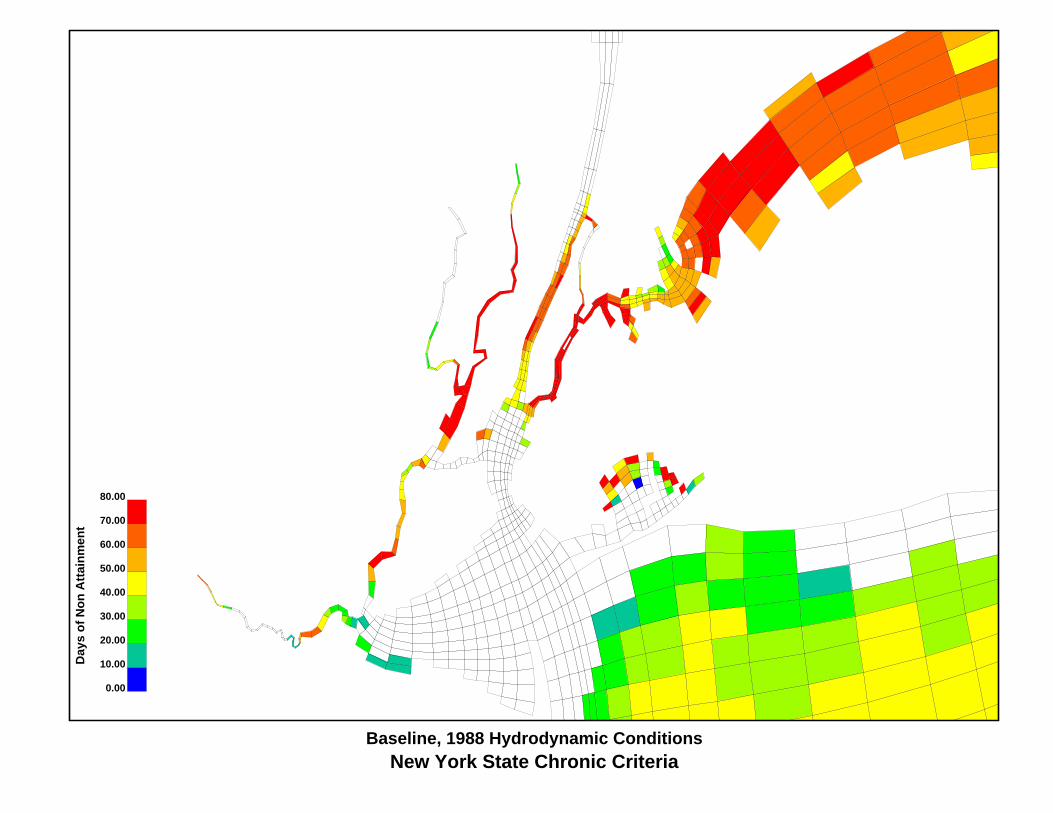
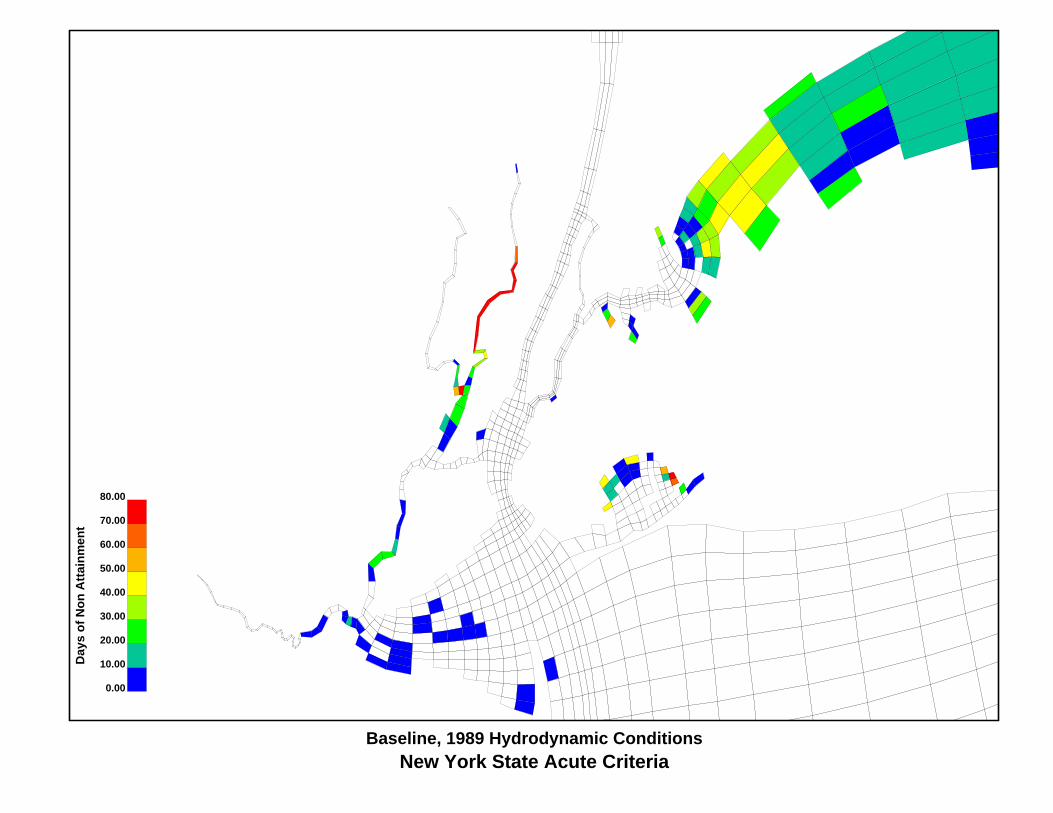
The assessment of current conditions relative to the identified regulatory endpoints is summarizedbelow in Table 1 and shown on color maps in Appendix A. As indicated in Table 1, the Kill vanKull and Lower Bay are fully compliant with the 24-hour averaged based NYS criteria. On this basisthese waterways do not need to be considered in the “what would it take” evaluation.
2
HYDRO QUAL, INC.
1200 M ACARTHUR, M AHWAH, N EW JERSEY 07430 T: 201-529-5151 F: 201-529-5728 WWW.HYDROQUAL.COM
Table 1. Assessment of Current Conditions - HEP Waters1 in Compliance
Waterways Complying withNYS Acute Proposed
Standard(24 hr avg never less than 3.0)
Waterways Complying withNYS Chronic Proposed
Standard(24 hr avg between 3 and 4.8)
Hackensack/Passaic/RaritanRiver Reaches Complying withNJ Standards FW2-NT/SE2
and SE1 (24 hr avg never less than 5.0
and never less than 4.0)
1. Passaic River - Dundee Dam to mile 6.9
2. Raritan River Fieldville Dam to mile 8.3 and miles 3.4 to 2.2
3. Kill van Kull4. Most of Raritan Bay5. Hudson River south of
Piermont Marsh6. Upper Bay7. Lower Bay8. Harlem River9. Lower East River
1. Passaic River - Dundee Dam to mile 8.1
2. Kill van Kull3. portions of Raritan Bay4. Hudson River - Piermont Marsh to mile 14.7 and western side miles 14.7 to 9.85. majority of the Upper Bay6. Lower Bay7. Harlem River - miles 4.0 to 6.5
1. Passaic River - miles 11.6 to 15.8
1Includes those HEP waters as defined in the CCMP which are coincident with the domain ofSWEM and omitting Jamaica Bay.
What would it take?To address the question of “what would it take” to bring all HEP waters into compliance, a numberof SWEM simulations were performed which consider various types of nitrogen and carbon loadingreductions. The scope of work describing the SWEM simulations performed was developed andagreed to by HydroQual, EPA, and the States. The nitrogen and carbon loading reductionsconsidered in SWEM simulations include combinations of expected nonpoint source reductionsfrom CAIR initiatives and several levels of reductions for point sources. Additional SWEMsimulations were performed to diagnose the relative importance of several nonpoint loading sourcecomponents including: open ocean boundaries and atmospheric deposition over the water surfaceand tributary headwaters. To assist with the analysis of the DO concentration outputs of theSWEM simulations, spreadsheet calculations were performed for manipualting model results toassess compliance with standards involving “never less than” or “no 24-hour average less than”requirements. In addition, to help with the evaluation of what it would take to meet the exposure-duration based NYS chronic standard and to check approximations made by adding and subtractingdays of non-attainment, a confirmatory scenario run was performed which consideredsimultaneously : CAIR nitrogen reductions in atmospheric deposition and stormwater, CAIR plus anadditional 25% reduction in tributary nitrogen, 60% reductions in point source nitrogen, 60%reductions in point source carbon, and 25% reductions in atmospheric and tributary carbon.

3
HYDRO QUAL, INC.
1200 M ACARTHUR, M AHWAH, N EW JERSEY 07430 T: 201-529-5151 F: 201-529-5728 WWW.HYDROQUAL.COM
HydroQual worked collaboratively with EPA to develop expected nonpoint source reductions fromCAIR. Specifically, both current and 2020 projections of atmospheric deposition of nitrogen wereavailable to EPA Region 2 staff from the CAIR program. Projected improvements were mappedover the SWEM domain and on average reflected a 25.3% reduction in atmospheric nitrogen.
In performing SWEM “what would it take” simulations, the 25.3% reduction expected from CAIRinitiatives was included for atmospheric deposition over the open water surface as well as for theportion of tributary headwaters and stormwater runoff influenced by the atmosphere. The portionof tributary headwaters influenced by the atmosphere was determined on a tributary specific basisu s i n g o u t p u t s o f t h e n a t i o n a l S P A R R O W m o d e l a v a i l a b l e a thttp://water.usgs.gov/nawqa/sparrow/wrr97. In general, the fraction of atmospheric influence ontributary headwaters ranged from 4% to 47% across tributaries with a logarithmic mean (median) of26%. The fraction of atmospheric influence on stormwater runoff was set equal to the tributarymedian. CAIR related adjustments to nitrogen loadings used in SWEM simulations for estimatingthe benefits achieveable through non-point source nitrogen reductions are summarized in Table 2.
Table 2. Nitrogen loading changes used for assessing benefits achieveable through non-point source nitrogen reductions. (Based on CAIR and SPARROW)
LOADING TYPE%
REDUCTION%
REMAINING
Atmospheric deposition over open water 25.3 74.7
Stormwater 6.6 93.4
Tributary headwaters (median): 6.6 93.4
Hudson River at Poughkeepsie, NY 11.9 88.1
Hackensack River 3.7 96.3
Saddle River 3.7 96.3
Passaic River 3.7 96.3
Raritan River 8.4 91.6
South River 8.4 91.6
Wappinger Creek 11.9 88.1
Croton River 3.1 96.9
Saw Mill River 3.1 96.9

4
HYDRO QUAL, INC.
1200 M ACARTHUR, M AHWAH, N EW JERSEY 07430 T: 201-529-5151 F: 201-529-5728 WWW.HYDROQUAL.COM
Table 2. Nitrogen loading changes used for assessing benefits achieveable through non-point source nitrogen reductions. (Based on CAIR and SPARROW) (Cont’d)
LOADING TYPE %REDUCTION
%REMAINING
Bronx River 3.1 96.9
Navesink/Shrewsbury Rivers 0.9 99.1
Norwalk River 7.9 92.1
Housatonic River 10.4 89.6
Quinnipiac River 7.0 93.1
Connecticut River 5.2 94.8
Thames River 6.5 93.5
Manasquan River 6.8 93.2
Metedeconk/Toms Rivers 6.8 93.2
Mullica/Westcunk Rivers 6.8 93.2
Tuckahoe/Great Egg Rivers 5.2 94.8
In addressing the “what would it take question” by considering various loading reduction conditions,each loading reduction is considered as a means of reducing the oxygen demanding material in thesystem. Typically, oxygen demanding material produces dissolved oxygen deficit, receiving watervalues of dissolved oxygen below dissolved oxygen saturation at a given location. Oxygendemanding material may also result in the production of hydrogen sulfide, H2S. H2S is producedwhen oxygen demand exceeds oxygen saturation at a given location. In such situations, althoughreducing nitrogen and carbon loadings reduces the oxygen demanding material, it does notnecessarily improve the dissolved oxygen, it merely reduces the amount of H2S produced.
Under the current conditions defined by the SWEM baseline, particularly during the 1988hydrodynamic conditions, there are several locations where elevated H2S production is beingcalculated. These locations include: portions of the Hackensack River, portions of Jamaica Bay, aportion of Raritan Bay near Middlesex County and the confluence with the Raritan River and theArthur Kill, the tip of Bowery Bay in the East River, and the landward edges of a few isolatedembayment areas in extreme western Long Island Sound.
Another source of dissolved oxygen deficit can be attributed to the dissolved oxygen entering themodel with loadings that are below saturation. This component of the dissolved oxygen deficit istypically small and is most significant local to large volume loadings. This component of thedissolved oxygen deficit in the model can not be ameloriated by reductions to carbon and nitrogenloadings.
5
HYDRO QUAL, INC.
1200 M ACARTHUR, M AHWAH, N EW JERSEY 07430 T: 201-529-5151 F: 201-529-5728 WWW.HYDROQUAL.COM
For all these reasons, it is possible that we may not be able to fully address “what would it take”strictly on the basis of considering various nitrogen and carbon reductions.
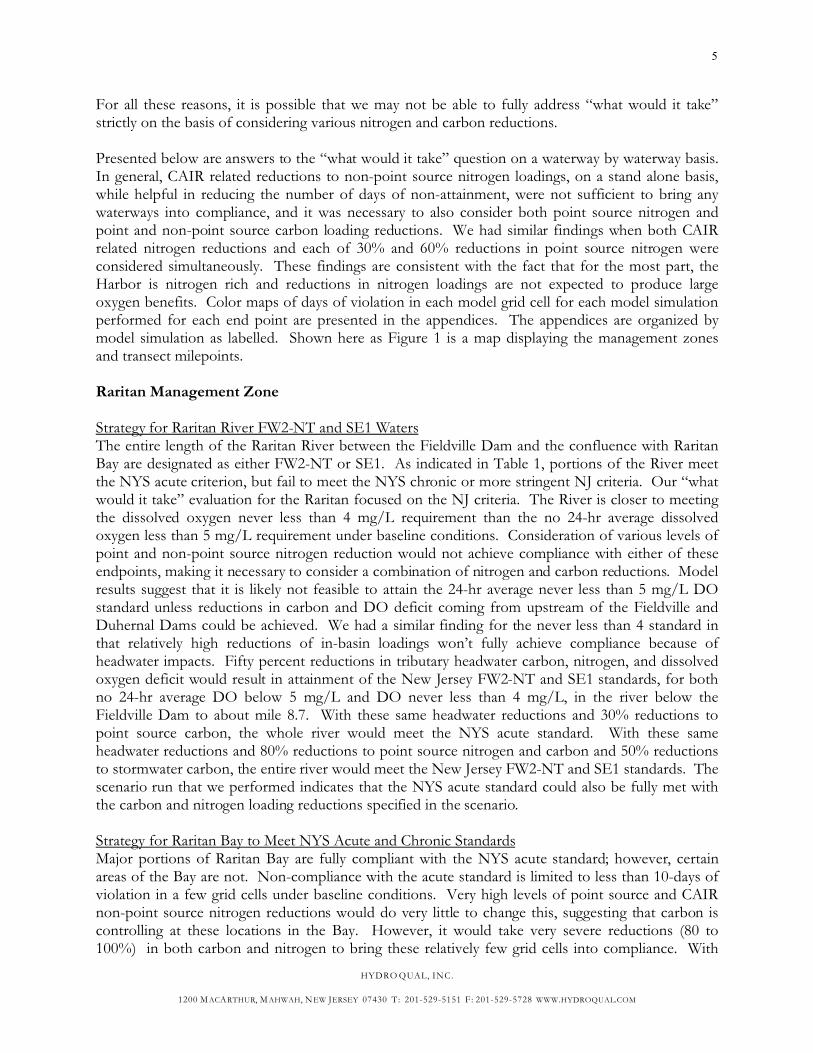
Presented below are answers to the “what would it take” question on a waterway by waterway basis.In general, CAIR related reductions to non-point source nitrogen loadings, on a stand alone basis,while helpful in reducing the number of days of non-attainment, were not sufficient to bring anywaterways into compliance, and it was necessary to also consider both point source nitrogen andpoint and non-point source carbon loading reductions. We had similar findings when both CAIRrelated nitrogen reductions and each of 30% and 60% reductions in point source nitrogen wereconsidered simultaneously. These findings are consistent with the fact that for the most part, theHarbor is nitrogen rich and reductions in nitrogen loadings are not expected to produce largeoxygen benefits. Color maps of days of violation in each model grid cell for each model simulationperformed for each end point are presented in the appendices. The appendices are organized bymodel simulation as labelled. Shown here as Figure 1 is a map displaying the management zonesand transect milepoints.
Raritan Management Zone
Strategy for Raritan River FW2-NT and SE1 WatersThe entire length of the Raritan River between the Fieldville Dam and the confluence with RaritanBay are designated as either FW2-NT or SE1. As indicated in Table 1, portions of the River meetthe NYS acute criterion, but fail to meet the NYS chronic or more stringent NJ criteria. Our “whatwould it take” evaluation for the Raritan focused on the NJ criteria. The River is closer to meetingthe dissolved oxygen never less than 4 mg/L requirement than the no 24-hr average dissolvedoxygen less than 5 mg/L requirement under baseline conditions. Consideration of various levels ofpoint and non-point source nitrogen reduction would not achieve compliance with either of theseendpoints, making it necessary to consider a combination of nitrogen and carbon reductions. Modelresults suggest that it is likely not feasible to attain the 24-hr average never less than 5 mg/L DOstandard unless reductions in carbon and DO deficit coming from upstream of the Fieldville andDuhernal Dams could be achieved. We had a similar finding for the never less than 4 standard inthat relatively high reductions of in-basin loadings won’t fully achieve compliance because ofheadwater impacts. Fifty percent reductions in tributary headwater carbon, nitrogen, and dissolvedoxygen deficit would result in attainment of the New Jersey FW2-NT and SE1 standards, for bothno 24-hr average DO below 5 mg/L and DO never less than 4 mg/L, in the river below theFieldville Dam to about mile 8.7. With these same headwater reductions and 30% reductions topoint source carbon, the whole river would meet the NYS acute standard. With these sameheadwater reductions and 80% reductions to point source nitrogen and carbon and 50% reductionsto stormwater carbon, the entire river would meet the New Jersey FW2-NT and SE1 standards. Thescenario run that we performed indicates that the NYS acute standard could also be fully met withthe carbon and nitrogen loading reductions specified in the scenario.
Strategy for Raritan Bay to Meet NYS Acute and Chronic StandardsMajor portions of Raritan Bay are fully compliant with the NYS acute standard; however, certainareas of the Bay are not. Non-compliance with the acute standard is limited to less than 10-days ofviolation in a few grid cells under baseline conditions. Very high levels of point source and CAIRnon-point source nitrogen reductions would do very little to change this, suggesting that carbon iscontrolling at these locations in the Bay. However, it would take very severe reductions (80 to100%) in both carbon and nitrogen to bring these relatively few grid cells into compliance. With
6
HYDRO QUAL, INC.
1200 M ACARTHUR, M AHWAH, N EW JERSEY 07430 T: 201-529-5151 F: 201-529-5728 WWW.HYDROQUAL.COM
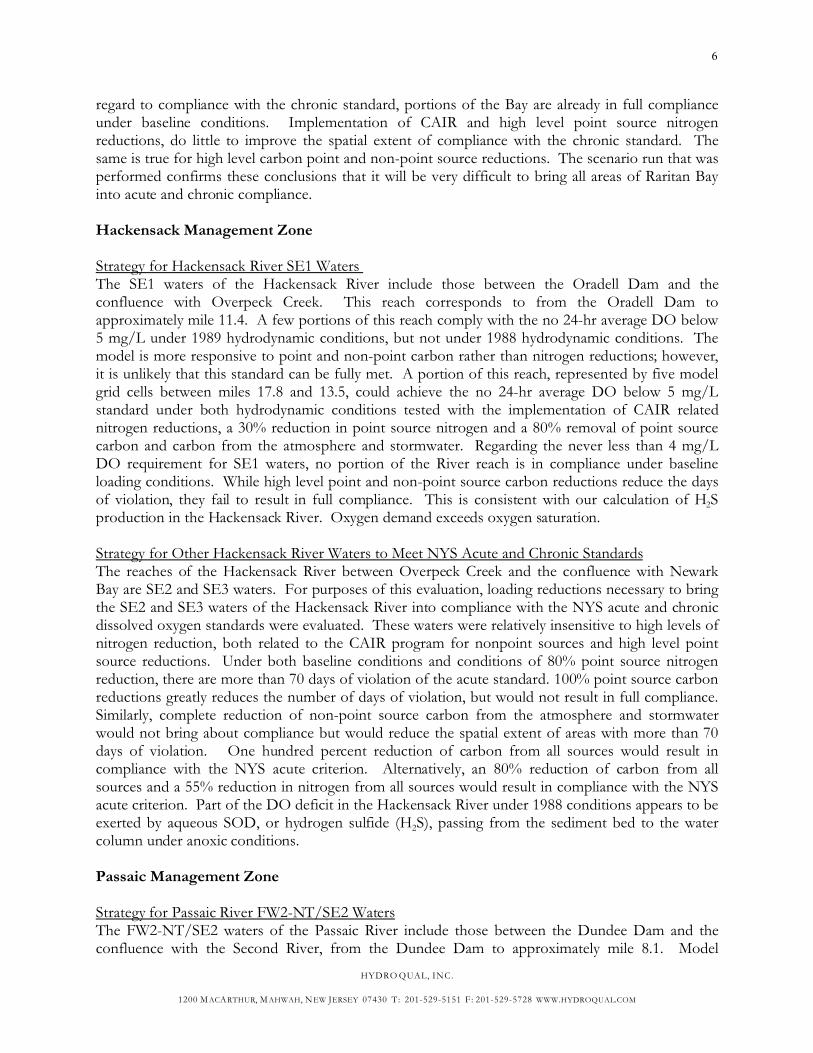
regard to compliance with the chronic standard, portions of the Bay are already in full complianceunder baseline conditions. Implementation of CAIR and high level point source nitrogenreductions, do little to improve the spatial extent of compliance with the chronic standard. Thesame is true for high level carbon point and non-point source reductions. The scenario run that wasperformed confirms these conclusions that it will be very difficult to bring all areas of Raritan Bayinto acute and chronic compliance.
Hackensack Management Zone
Strategy for Hackensack River SE1 Waters The SE1 waters of the Hackensack River include those between the Oradell Dam and theconfluence with Overpeck Creek. This reach corresponds to from the Oradell Dam toapproximately mile 11.4. A few portions of this reach comply with the no 24-hr average DO below5 mg/L under 1989 hydrodynamic conditions, but not under 1988 hydrodynamic conditions. Themodel is more responsive to point and non-point carbon rather than nitrogen reductions; however,it is unlikely that this standard can be fully met. A portion of this reach, represented by five modelgrid cells between miles 17.8 and 13.5, could achieve the no 24-hr average DO below 5 mg/Lstandard under both hydrodynamic conditions tested with the implementation of CAIR relatednitrogen reductions, a 30% reduction in point source nitrogen and a 80% removal of point sourcecarbon and carbon from the atmosphere and stormwater. Regarding the never less than 4 mg/LDO requirement for SE1 waters, no portion of the River reach is in compliance under baselineloading conditions. While high level point and non-point source carbon reductions reduce the daysof violation, they fail to result in full compliance. This is consistent with our calculation of H2Sproduction in the Hackensack River. Oxygen demand exceeds oxygen saturation.
Strategy for Other Hackensack River Waters to Meet NYS Acute and Chronic StandardsThe reaches of the Hackensack River between Overpeck Creek and the confluence with NewarkBay are SE2 and SE3 waters. For purposes of this evaluation, loading reductions necessary to bringthe SE2 and SE3 waters of the Hackensack River into compliance with the NYS acute and chronicdissolved oxygen standards were evaluated. These waters were relatively insensitive to high levels ofnitrogen reduction, both related to the CAIR program for nonpoint sources and high level pointsource reductions. Under both baseline conditions and conditions of 80% point source nitrogenreduction, there are more than 70 days of violation of the acute standard. 100% point source carbonreductions greatly reduces the number of days of violation, but would not result in full compliance.Similarly, complete reduction of non-point source carbon from the atmosphere and stormwaterwould not bring about compliance but would reduce the spatial extent of areas with more than 70days of violation. One hundred percent reduction of carbon from all sources would result incompliance with the NYS acute criterion. Alternatively, an 80% reduction of carbon from allsources and a 55% reduction in nitrogen from all sources would result in compliance with the NYSacute criterion. Part of the DO deficit in the Hackensack River under 1988 conditions appears to beexerted by aqueous SOD, or hydrogen sulfide (H2S), passing from the sediment bed to the watercolumn under anoxic conditions.
Passaic Management Zone
Strategy for Passaic River FW2-NT/SE2 WatersThe FW2-NT/SE2 waters of the Passaic River include those between the Dundee Dam and theconfluence with the Second River, from the Dundee Dam to approximately mile 8.1. Model
7
HYDRO QUAL, INC.
1200 M ACARTHUR, M AHWAH, N EW JERSEY 07430 T: 201-529-5151 F: 201-529-5728 WWW.HYDROQUAL.COM
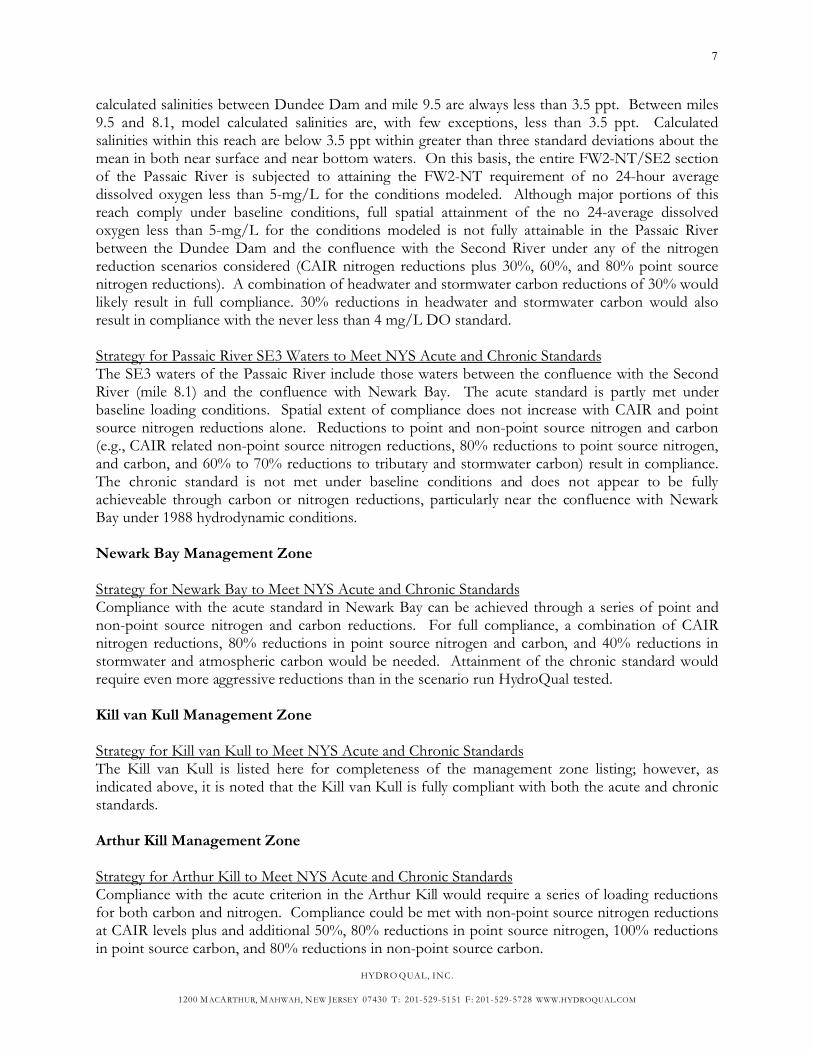
calculated salinities between Dundee Dam and mile 9.5 are always less than 3.5 ppt. Between miles9.5 and 8.1, model calculated salinities are, with few exceptions, less than 3.5 ppt. Calculatedsalinities within this reach are below 3.5 ppt within greater than three standard deviations about themean in both near surface and near bottom waters. On this basis, the entire FW2-NT/SE2 sectionof the Passaic River is subjected to attaining the FW2-NT requirement of no 24-hour averagedissolved oxygen less than 5-mg/L for the conditions modeled. Although major portions of thisreach comply under baseline conditions, full spatial attainment of the no 24-average dissolvedoxygen less than 5-mg/L for the conditions modeled is not fully attainable in the Passaic Riverbetween the Dundee Dam and the confluence with the Second River under any of the nitrogenreduction scenarios considered (CAIR nitrogen reductions plus 30%, 60%, and 80% point sourcenitrogen reductions). A combination of headwater and stormwater carbon reductions of 30% wouldlikely result in full compliance. 30% reductions in headwater and stormwater carbon would alsoresult in compliance with the never less than 4 mg/L DO standard.
Strategy for Passaic River SE3 Waters to Meet NYS Acute and Chronic StandardsThe SE3 waters of the Passaic River include those waters between the confluence with the SecondRiver (mile 8.1) and the confluence with Newark Bay. The acute standard is partly met underbaseline loading conditions. Spatial extent of compliance does not increase with CAIR and pointsource nitrogen reductions alone. Reductions to point and non-point source nitrogen and carbon(e.g., CAIR related non-point source nitrogen reductions, 80% reductions to point source nitrogen,and carbon, and 60% to 70% reductions to tributary and stormwater carbon) result in compliance.The chronic standard is not met under baseline conditions and does not appear to be fullyachieveable through carbon or nitrogen reductions, particularly near the confluence with NewarkBay under 1988 hydrodynamic conditions.
Newark Bay Management Zone
Strategy for Newark Bay to Meet NYS Acute and Chronic StandardsCompliance with the acute standard in Newark Bay can be achieved through a series of point andnon-point source nitrogen and carbon reductions. For full compliance, a combination of CAIRnitrogen reductions, 80% reductions in point source nitrogen and carbon, and 40% reductions instormwater and atmospheric carbon would be needed. Attainment of the chronic standard wouldrequire even more aggressive reductions than in the scenario run HydroQual tested.
Kill van Kull Management Zone
Strategy for Kill van Kull to Meet NYS Acute and Chronic StandardsThe Kill van Kull is listed here for completeness of the management zone listing; however, asindicated above, it is noted that the Kill van Kull is fully compliant with both the acute and chronicstandards.
Arthur Kill Management Zone
Strategy for Arthur Kill to Meet NYS Acute and Chronic StandardsCompliance with the acute criterion in the Arthur Kill would require a series of loading reductionsfor both carbon and nitrogen. Compliance could be met with non-point source nitrogen reductionsat CAIR levels plus and additional 50%, 80% reductions in point source nitrogen, 100% reductionsin point source carbon, and 80% reductions in non-point source carbon.

8
HYDRO QUAL, INC.
1200 M ACARTHUR, M AHWAH, N EW JERSEY 07430 T: 201-529-5151 F: 201-529-5728 WWW.HYDROQUAL.COM
Hudson Management Zone
Strategy for Hudson River to Meet NYS Chronic StandardsUnder baseline conditions, the Hudson River complies with the NYS acute standard. To achievethe chronic standard, an 80% reduction in point source nitrogen along with CAIR nitrogenreductions for non-point source nitrogen would be necessary. Alternatively, compliance could beachieved with no nitrogen reductions, but a 100% reduction of point source carbon instead.Backing off the point source nitrogen reduction to 60% would require some carbon reductions foroffset. Similarly, backing off from the full reduction of point source carbon would require othernitrogen and carbon reductions for offset. One possible scenario which we were able to test with afull model simulation demonstrates that the Hudson River would comply fully with the NYS chronicstandard under the following conditions: non-point source nitrogen reductions associated withCAIR, 60% point source reductions for both nitrogen and carbon, 25% reductions to tributarycarbon, 25% reductions to atmospheric carbon, and an additional 25% reduction to tributarynitrogen after CAIR implementation.
Upper Bay Management Zone
Strategy for Upper Bay to Meet NYS Chronic StandardsUnder baseline conditions, the Upper Bay complies with the NYS acute standard. Compliance withNYS chronic standard is nearly achieved (with the exception of a few near-shore grid cells), underCAIR reductions to nonpoint source nitrogen and a simultaneous 60% reduction in point sourcenitrogen. Alternatively, full compliance could be achieved with a full reduction of point sourcecarbon. Similarly, the loading conditions (described above) of the scenario run that we tested wouldalso result in chronic compliance in the Upper Bay.
Lower East River Management Zone
Strategy for the Lower East River to Meet NYS Acute and Chronic StandardsUnder baseline conditions, the Lower East River complies with the NYS acute standard.Compliance with the NYS chronic standard is not fully achieved in the Lower East River underbaseline conditions. The highest levels of nitrogen reduction that we tested did not bring thesewaters fully into compliance with the chronic criterion, suggesting that carbon reductions or acombination of carbon and nitrogen reductions will be required. With the exception of a single gridcell near Newtown Creek, full compliance with the chronic standard could be achieved with 100%removal of point source carbon. Chronic compliance is also achieved under the loading conditionsof the scenario that we tested.
Upper East River Management Zone
Stategy for Harlem River to Meet NYS Chronic StandardsUnder baseline conditions, the Harlem River complies with the NYS acute standard. With theexception of grid cells located at the confluences with the Hudson and East Rivers, the HarlemRiver would be fully compliant with the NYS chronic standard if CAIR reductions to nonpointnitrogen sources and a 30% reduction in point source nitrogen were inplemented. The edges of theHarlem River did not reach full compliance with nitrogen reductions. Full removal of point sourcecarbon would bring the Harlem River into full compliance with the chronic standard. The Harlem

9
HYDRO QUAL, INC.
1200 M ACARTHUR, M AHWAH, N EW JERSEY 07430 T: 201-529-5151 F: 201-529-5728 WWW.HYDROQUAL.COM
River would also reach full compliance with the chronic standard under the loading conditions ofthe scenario tested by HydroQual.
Strategy for the Upper East River to Meet NYS Acute and Chronic StandardsUnder baseline conditions, the Upper East River does not comply with the NYS acute standard.With CAIR reductions plus a 30% reduction of point source nitrogen, the open waters of the UpperEast River could be brought into compliance with the acute standard but embayment areas of theUpper East River would remain in non-compliance. With an 80% reduction of point sourcenitrogen with CAIR efforts on nonpoint source reductions exceeded by 10%, all embayment areasof the Upper East River would come very close to compliance with the acute standard.
Compliance with the NYS chronic standard is not fully achieved in the Upper East River underbaseline conditions and even the highest levels of nitrogen reduction that we tested did not bringthese waters fully into compliance with the chronic criterion, suggesting that carbon reductions or acombination of carbon and nitrogen reductions will be required. A 100% reduction of point sourcecarbon would not bring the Upper East River into compliance with the chronic standard. Under theloading conditions that HydroQual tested with a full model scenario, the Upper East River couldachieve chronic compliance with the exception of embayment areas.

10
HYDRO QUAL, INC.
1200 M ACARTHUR, M AHWAH, N EW JERSEY 07430 T: 201-529-5151 F: 201-529-5728 WWW.HYDROQUAL.COM
Table 3. “What Would It Take Analysis” - Summary of Required Loading Reductions
ZONE ENDPOINT SIMULTANEOUSLY REQUIRED REDUCTION LEVELS
NPS N PS N NPS C PS C
Hackensackto mp11.4
NJ SE1 can’t be met in all segments
Hackensackbelow mp11.4
NY Acute 55%1 55% 80%1 80%
Passaicto mp 8.1
NJ FW2-NT 0% 0% 30%1 0%
Passaic belowmp 8.1
NY Acute CAIR 80% 60-70%1 80%
Newark Bay NY Acute CAIR 80% 40% 80%
Arthur Kill NY Acute CAIR + 50% 80% 80% 100%
Hudson NY Chronic CAIR +additional
25% tributary
60% 25% 60%
Upper Bay NY Chronic CAIR 60% none none
Lower EastRiver
NY Chronic CAIR +additional
25% tributary
60% 25% 60%
Harlem River NY Chronic CAIR +additional
25% tributary
60% 25% 60%
Upper EastRiver
NY Chronic CAIR +additional
25% tributary
60% 25% 60%
Raritan River NJ FW2-NTand SE1
CAIR +additional
50% tributary
80% 50%1 80%
Raritan Bay NY Acute almost fully met without action; extreme action required tobring a few grid cells into compliance
Notes: 1Includes reductions above head of tide.

11
HYDRO QUAL, INC.
1200 M ACARTHUR, M AHWAH, N EW JERSEY 07430 T: 201-529-5151 F: 201-529-5728 WWW.HYDROQUAL.COM
Cost Benefit Analysis:Benefit curves (i.e. with dissolved oxygen improvement on the y-axis and nitrogen removals on thex-axis) have been prepared. Ultimately, the x-axis removals can be replaced with cost informationonce EPA and the States compile the cost information. Since the model was run with 100% carbonremovals and DO improvement outputs were scaled, similar graphs can be prepared for carbononce HydroQual is informed of the levels of carbon removal for which costs have been developed.The nitrogen curves are presented in Appendix N.
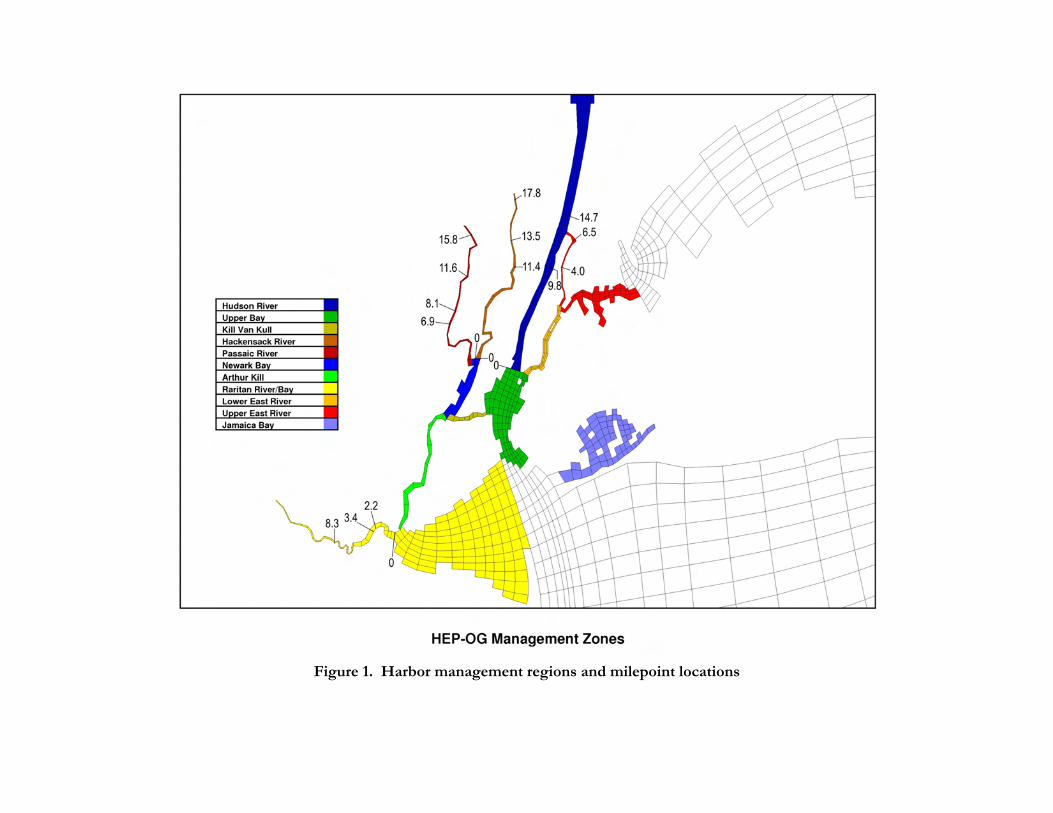
Figure 1. Harbor management regions and milepoint locations
HYDRO QUAL, INC.
1200 M ACARTHUR, M AHWAH, N EW JERSEY 07430 T: 201-529-5151 F: 201-529-5728 WWW.HYDROQUAL.COM
APPENDIX A
DO DAYS OF NON-ATTAINMENT MAPS
UNDER BASELINE CONDITIONS

0.00
10.00
20.00
30.00
40.00
50.00
60.00
70.00
80.00
Day
s o
f N
on
Att
ain
men
t
Dissolved Oxygen Never Less Than 4.0 (mg/L)Baseline, 1988 Hydrodynamic Conditions

0.00
10.00
20.00
30.00
40.00
50.00
60.00
70.00
80.00
Day
s o
f N
on
Att
ain
men
t
Dissolved Oxygen 24 Hour average Never Less Than 5.0 (mg/L)Baseline, 1988 Hydrodynamic Conditions
0.00
10.00
20.00
30.00
40.00
50.00
60.00
70.00
80.00
Day
s o
f N
on
Att
ain
men
t
New York State Chronic CriteriaBaseline, 1988 Hydrodynamic Conditions

0.00
10.00
20.00
30.00
40.00
50.00
60.00
70.00
80.00
Day
s o
f N
on
Att
ain
men
t
New York State Acute CriteriaBaseline, 1988 Hydrodynamic Conditions

0.00
10.00
20.00
30.00
40.00
50.00
60.00
70.00
80.00
Day
s o
f N
on
Att
ain
men
t
Dissolved Oxygen Never Less Than 4.0 (mg/L)Baseline, 1989 Hydrodynamic Conditions

0.00
10.00
20.00
30.00
40.00
50.00
60.00
70.00
80.00
Day
s o
f N
on
Att
ain
men
t
Dissolved Oxygen 24 Hour average Never Less Than 5.0 (mg/L)Baseline, 1989 Hydrodynamic Conditions

0.00
10.00
20.00
30.00
40.00
50.00
60.00
70.00
80.00
Day
s o
f N
on
Att
ain
men
t
New York State Chronic CriteriaBaseline, 1989 Hydrodynamic Conditions
0.00
10.00
20.00
30.00
40.00
50.00
60.00
70.00
80.00
Day
s o
f N
on
Att
ain
men
t
New York State Acute CriteriaBaseline, 1989 Hydrodynamic Conditions

HYDRO QUAL, INC.
1200 M ACARTHUR, M AHWAH, N EW JERSEY 07430 T: 201-529-5151 F: 201-529-5728 WWW.HYDROQUAL.COM
APPENDIX B
DO DAYS OF NON-ATTAINMENT MAPS
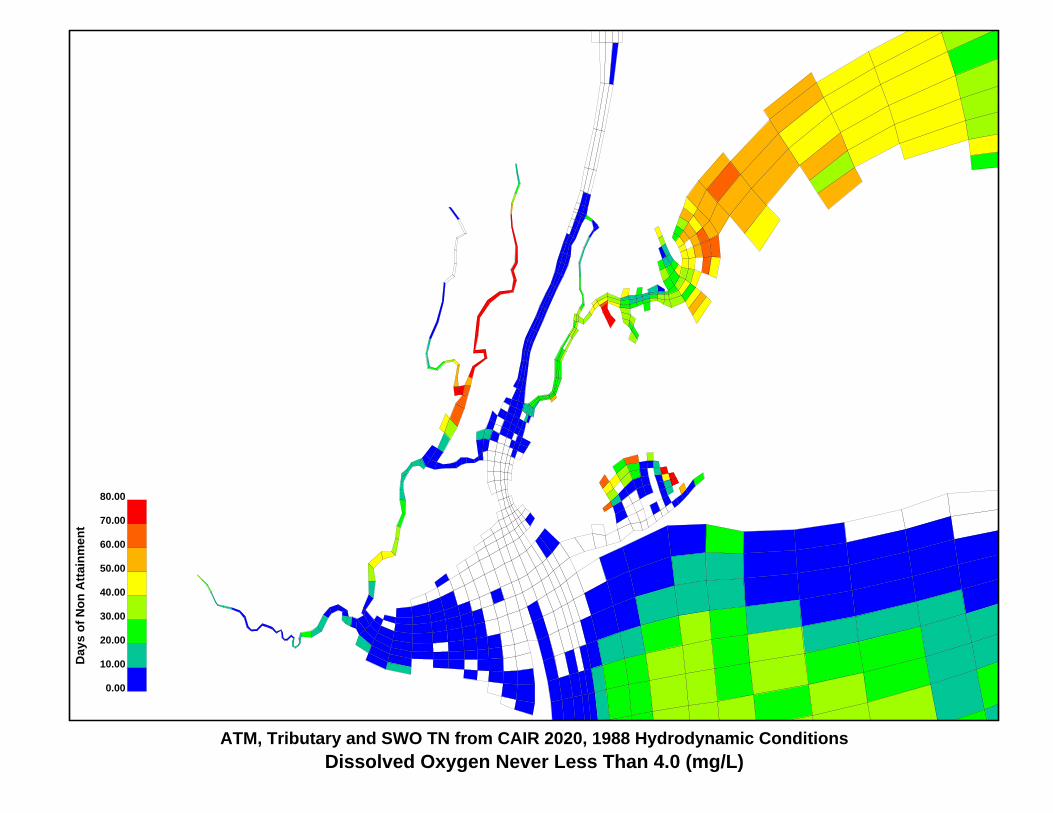
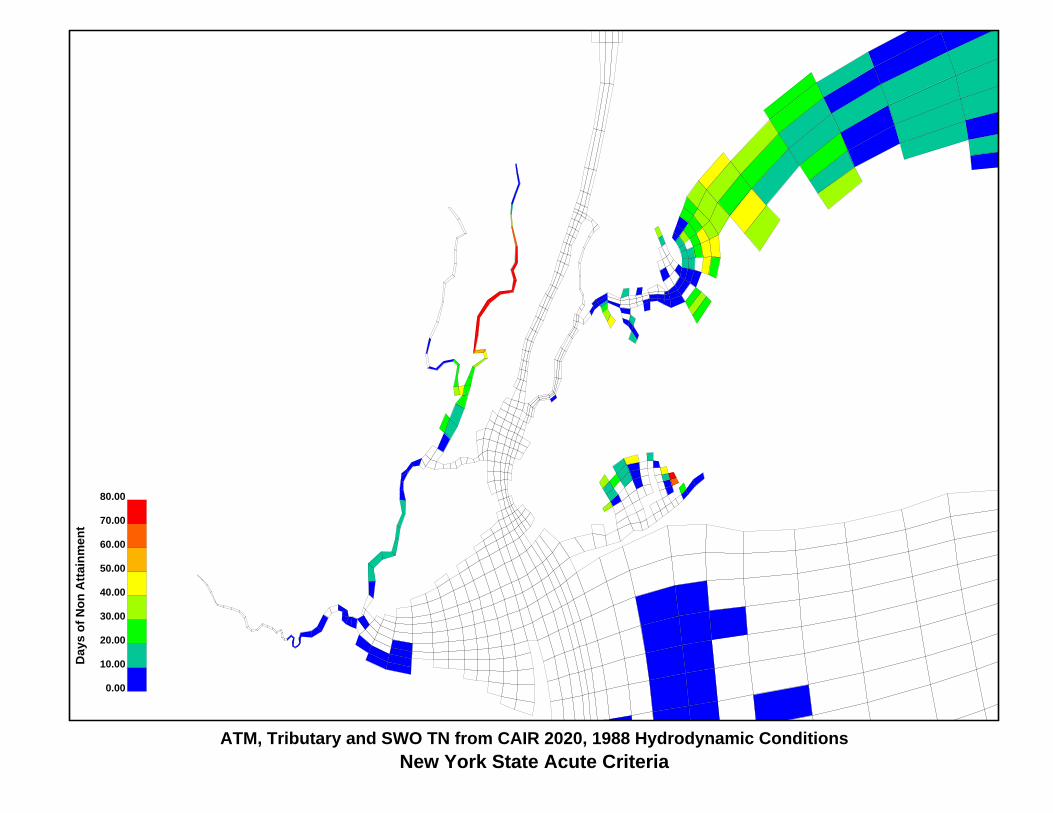
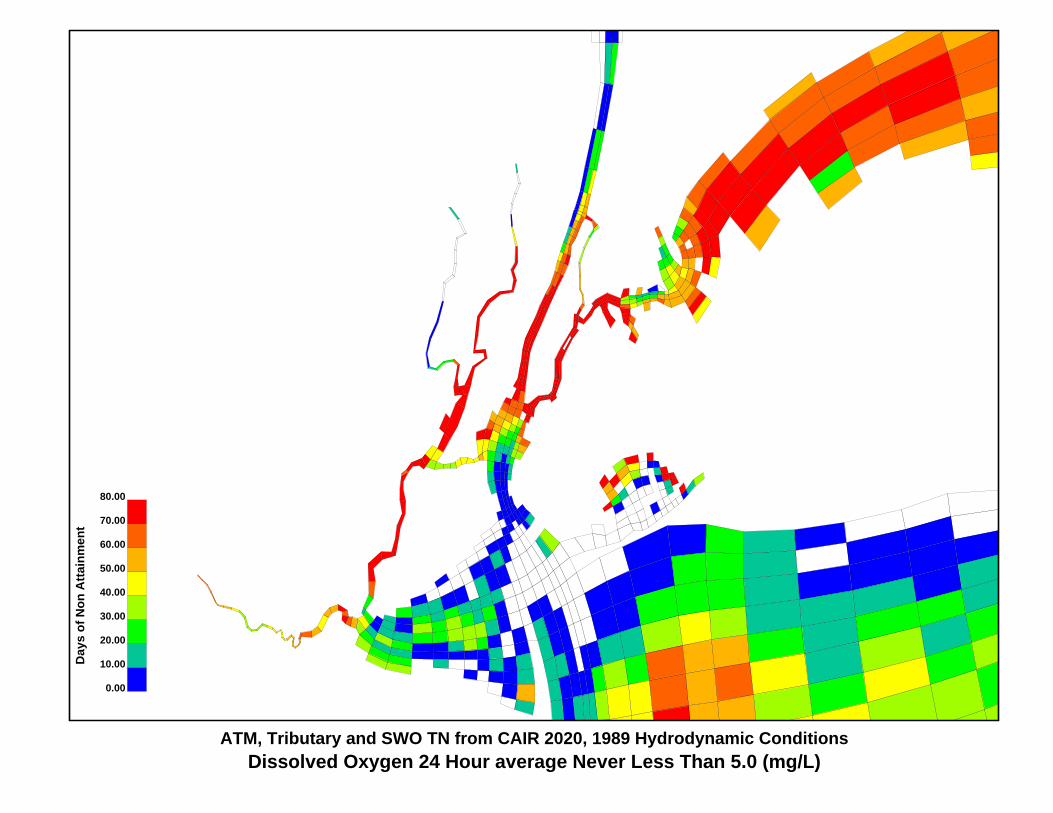
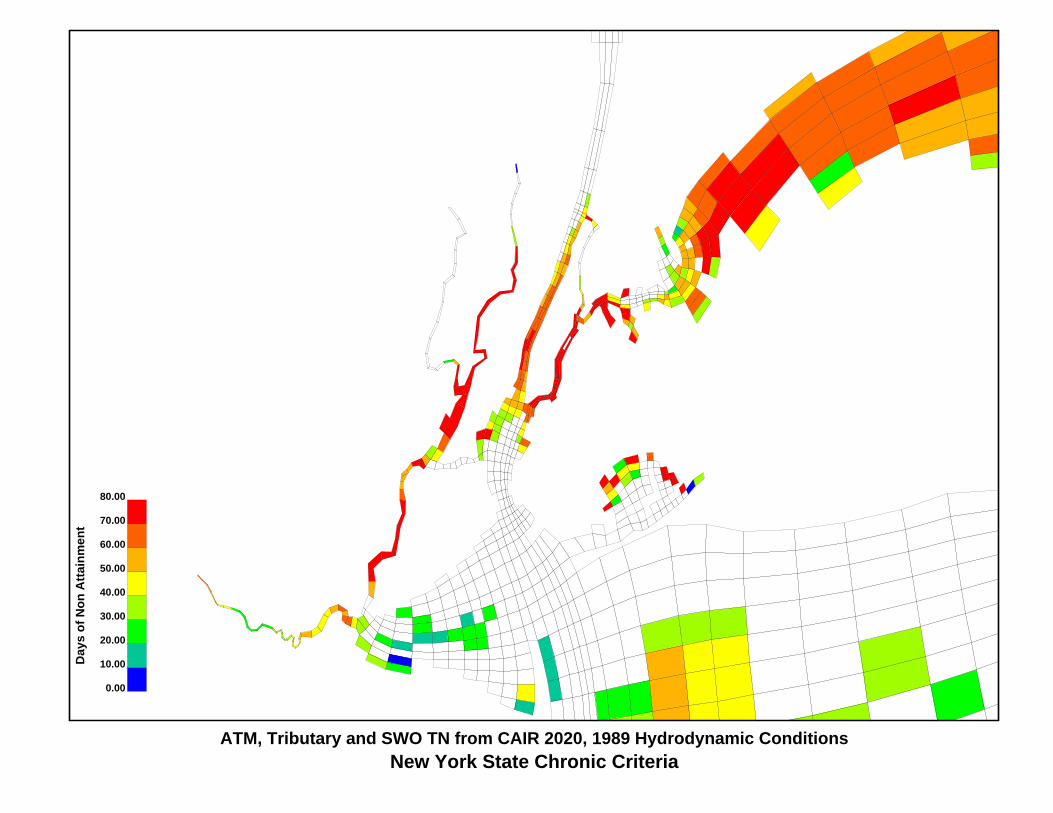
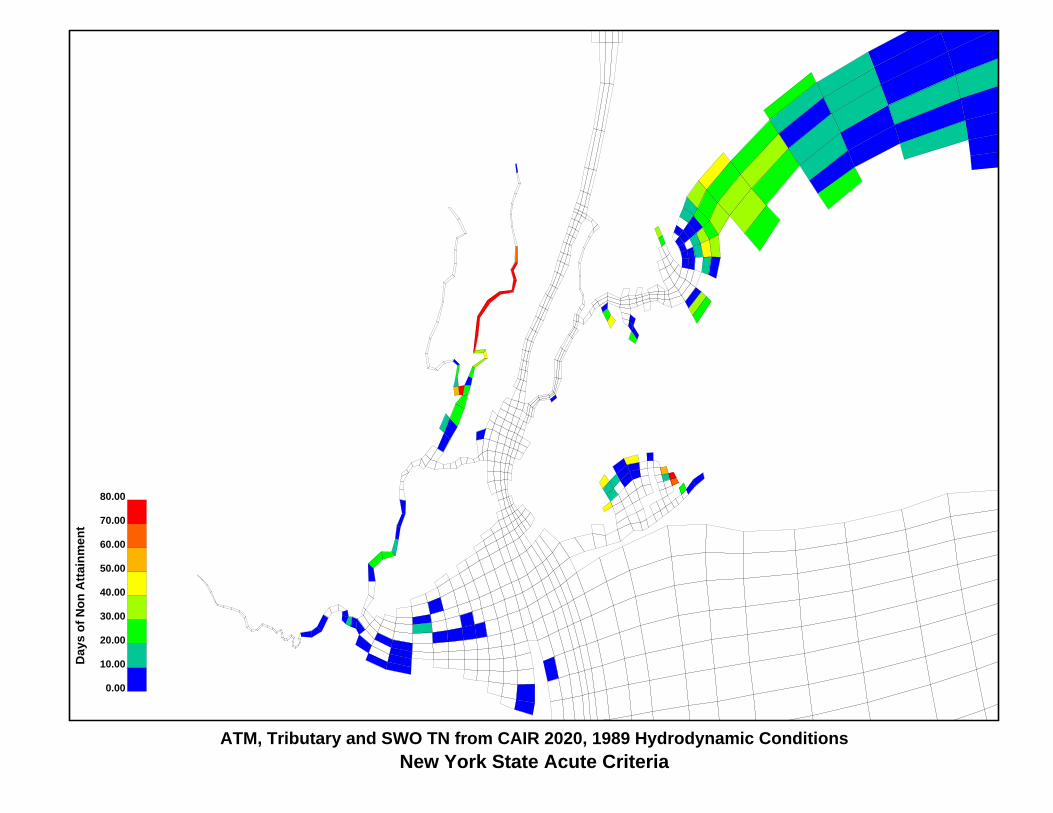
UNDER CAIR NPS N REDUCTIONS
0.00
10.00
20.00
30.00
40.00
50.00
60.00
70.00
80.00
Day
s o
f N
on
Att
ain
men
t
Dissolved Oxygen Never Less Than 4.0 (mg/L)ATM, Tributary and SWO TN from CAIR 2020, 1988 Hydrodynamic Conditions

0.00
10.00
20.00
30.00
40.00
50.00
60.00
70.00
80.00
Day
s o
f N
on
Att
ain
men
t
Dissolved Oxygen 24 Hour average Never Less Than 5.0 (mg/L)ATM, Tributary and SWO TN from CAIR 2020, 1988 Hydrodynamic Conditions

0.00
10.00
20.00
30.00
40.00
50.00
60.00
70.00
80.00
Day
s o
f N
on
Att
ain
men
t
New York State Chronic CriteriaATM, Tributary and SWO TN from CAIR 2020, 1988 Hydrodynamic Conditions
0.00
10.00
20.00
30.00
40.00
50.00
60.00
70.00
80.00
Day
s o
f N
on
Att
ain
men
t
New York State Acute CriteriaATM, Tributary and SWO TN from CAIR 2020, 1988 Hydrodynamic Conditions

0.00
10.00
20.00
30.00
40.00
50.00
60.00
70.00
80.00
Day
s o
f N
on
Att
ain
men
t
Dissolved Oxygen Never Less Than 4.0 (mg/L)ATM, Tributary and SWO TN from CAIR 2020, 1989 Hydrodynamic Conditions
0.00
10.00
20.00
30.00
40.00
50.00
60.00
70.00
80.00
Day
s o
f N
on
Att
ain
men
t
Dissolved Oxygen 24 Hour average Never Less Than 5.0 (mg/L)ATM, Tributary and SWO TN from CAIR 2020, 1989 Hydrodynamic Conditions
0.00
10.00
20.00
30.00
40.00
50.00
60.00
70.00
80.00
Day
s o
f N
on
Att
ain
men
t
New York State Chronic CriteriaATM, Tributary and SWO TN from CAIR 2020, 1989 Hydrodynamic Conditions
0.00
10.00
20.00
30.00
40.00
50.00
60.00
70.00
80.00
Day
s o
f N
on
Att
ain
men
t
New York State Acute CriteriaATM, Tributary and SWO TN from CAIR 2020, 1989 Hydrodynamic Conditions
HYDRO QUAL, INC.
1200 M ACARTHUR, M AHWAH, N EW JERSEY 07430 T: 201-529-5151 F: 201-529-5728 WWW.HYDROQUAL.COM
APPENDIX C
DO DAYS OF NON-ATTAINMENT MAPS
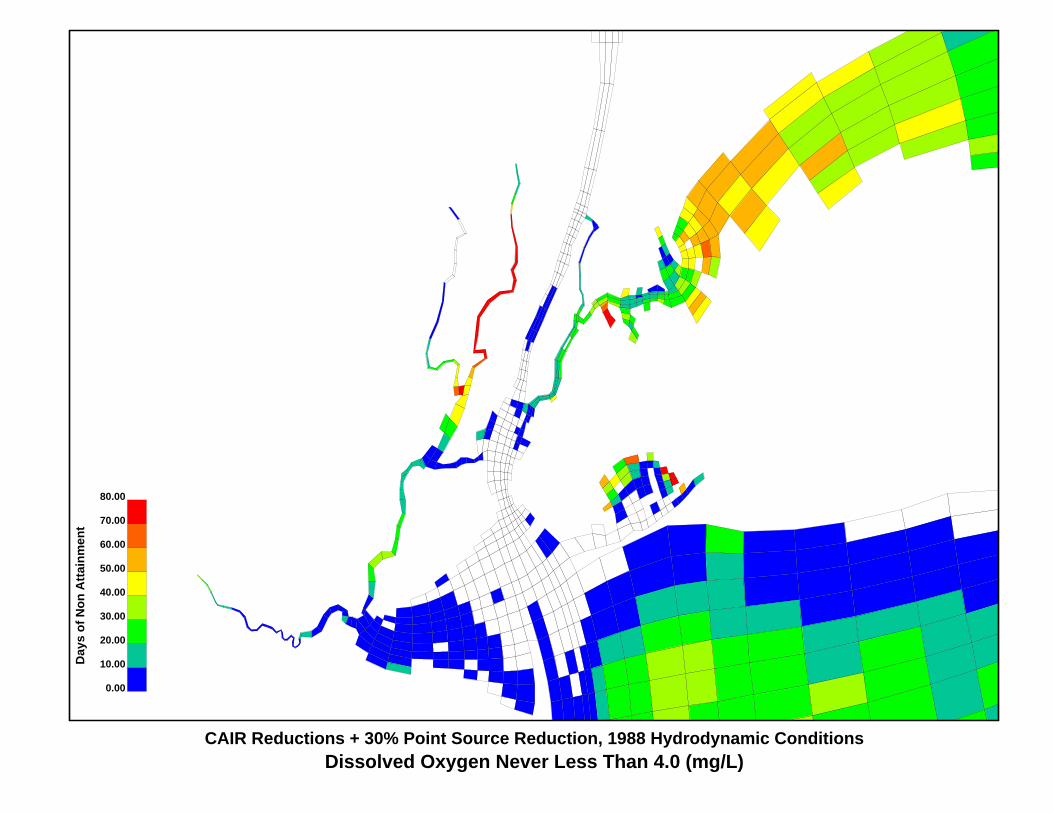
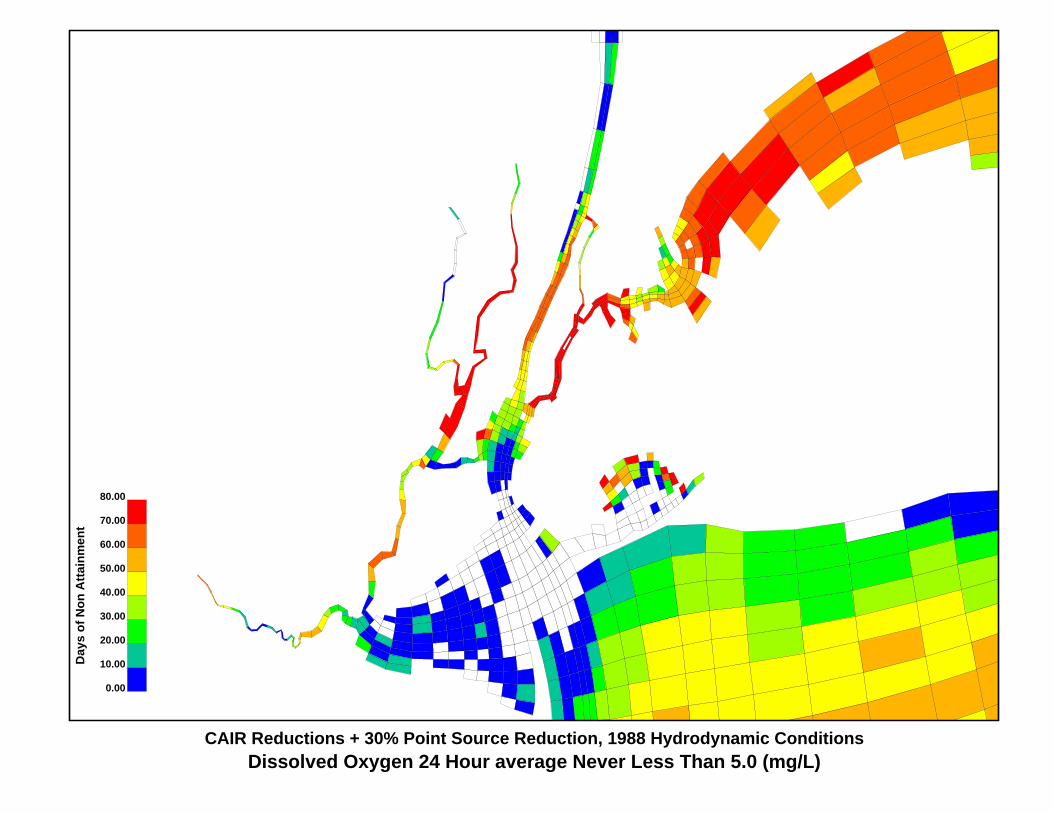
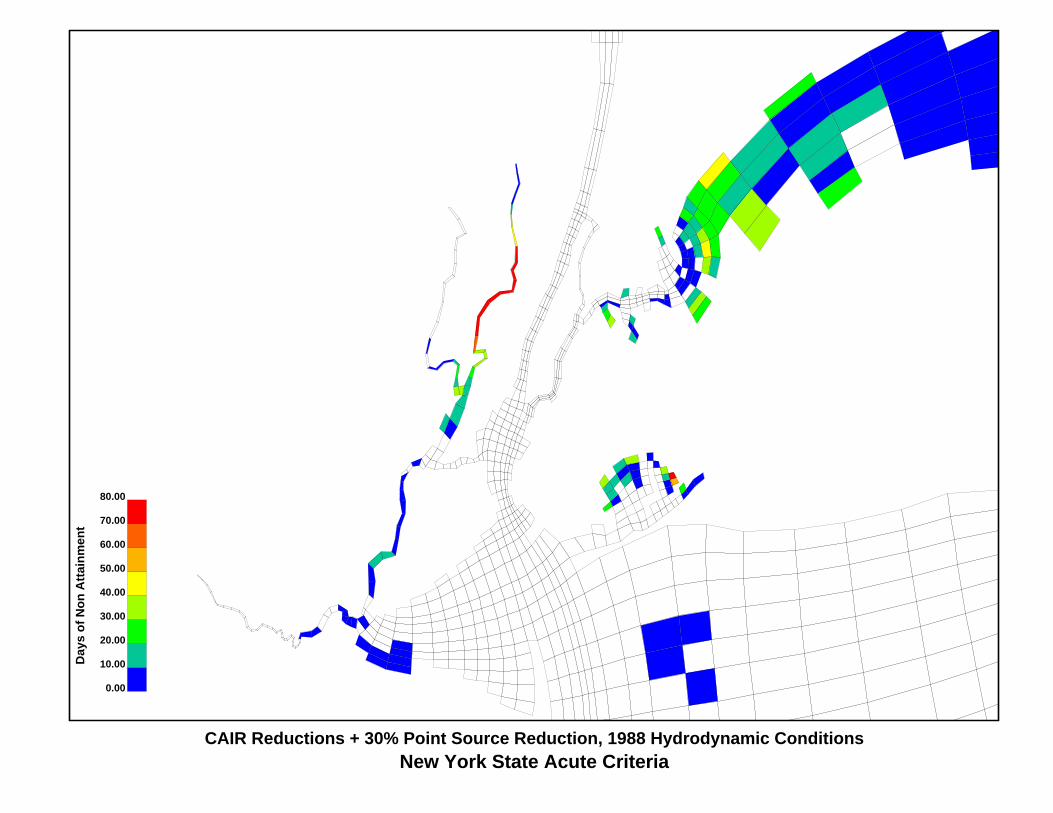
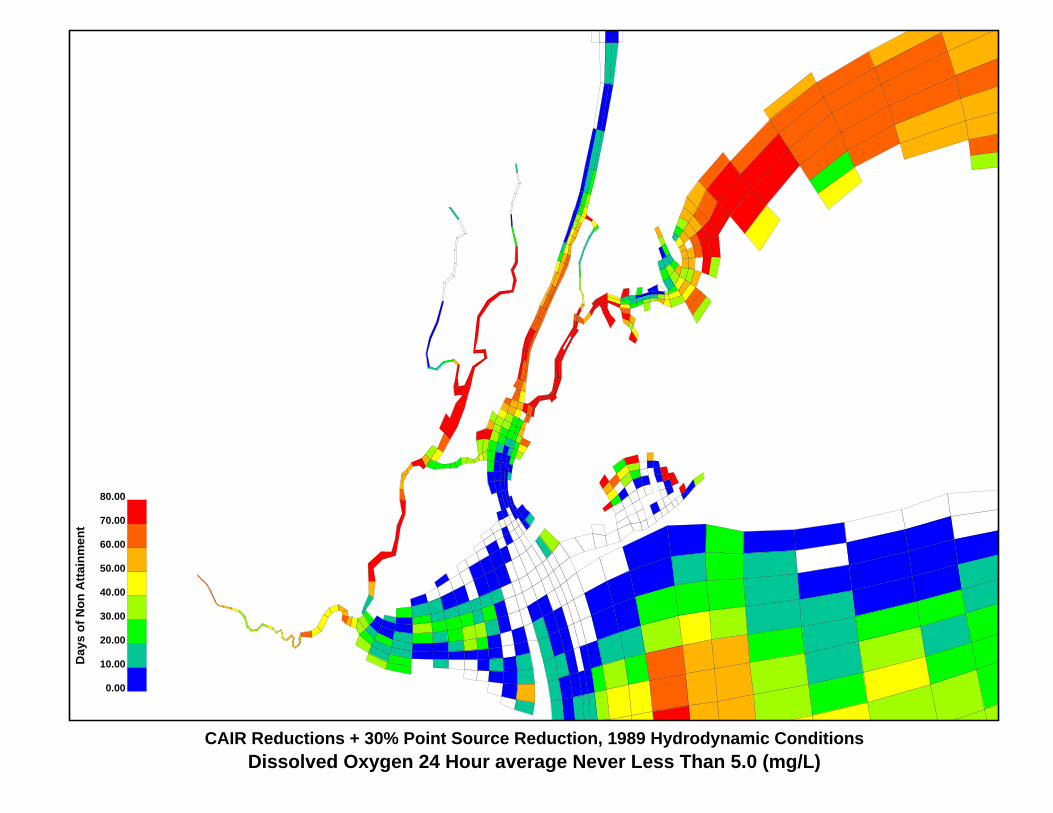
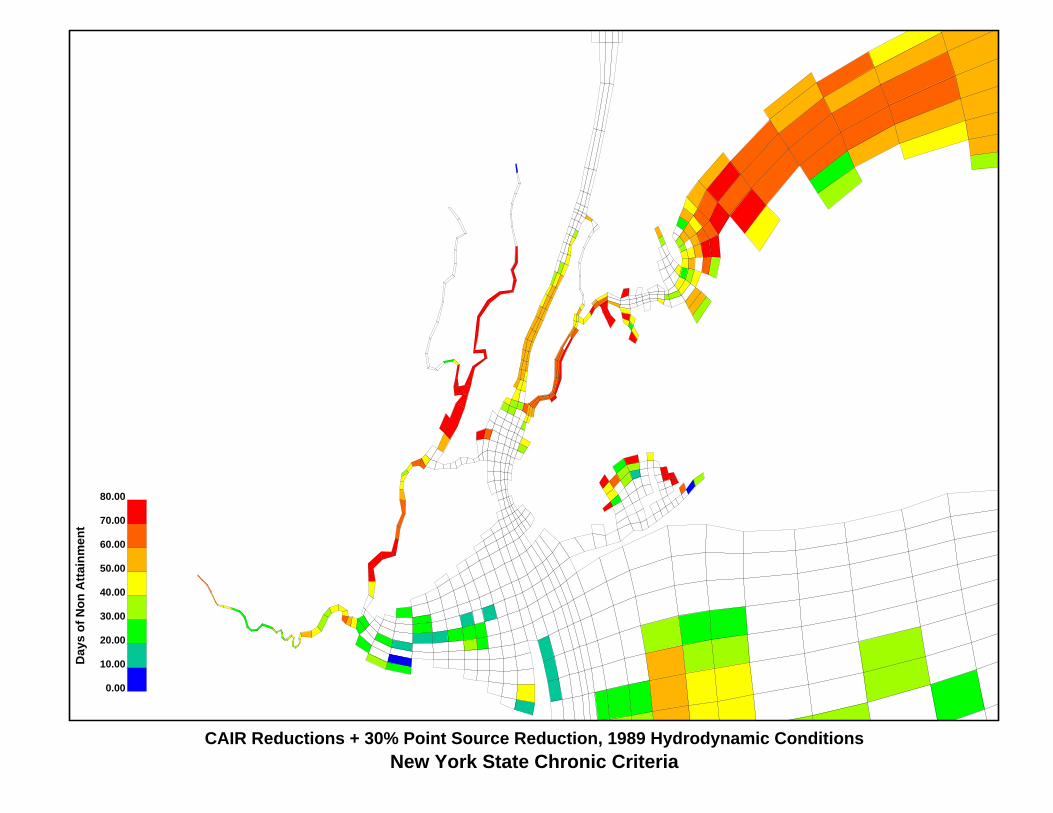
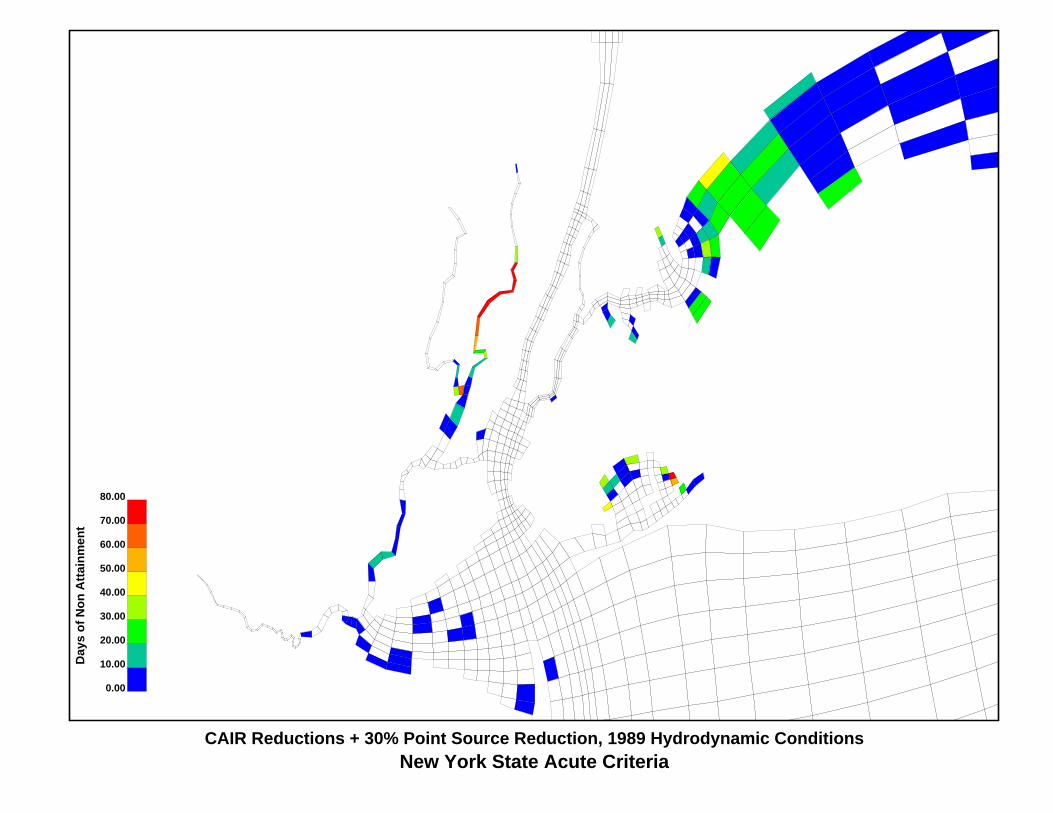
UNDER CAIR NPS + 30% STP N REDUCTIONS
0.00
10.00
20.00
30.00
40.00
50.00
60.00
70.00
80.00
Day
s o
f N
on
Att
ain
men
t
Dissolved Oxygen Never Less Than 4.0 (mg/L)CAIR Reductions + 30% Point Source Reduction, 1988 Hydrodynamic Conditions
0.00
10.00
20.00
30.00
40.00
50.00
60.00
70.00
80.00
Day
s o
f N
on
Att
ain
men
t
Dissolved Oxygen 24 Hour average Never Less Than 5.0 (mg/L)CAIR Reductions + 30% Point Source Reduction, 1988 Hydrodynamic Conditions

0.00
10.00
20.00
30.00
40.00
50.00
60.00
70.00
80.00
Day
s o
f N
on
Att
ain
men
t
New York State Chronic CriteriaCAIR Reductions + 30% Point Source Reduction, 1988 Hydrodynamic Conditions
0.00
10.00
20.00
30.00
40.00
50.00
60.00
70.00
80.00
Day
s o
f N
on
Att
ain
men
t
New York State Acute CriteriaCAIR Reductions + 30% Point Source Reduction, 1988 Hydrodynamic Conditions

0.00
10.00
20.00
30.00
40.00
50.00
60.00
70.00
80.00
Day
s o
f N
on
Att
ain
men
t
Dissolved Oxygen Never Less Than 4.0 (mg/L)CAIR Reductions + 30% Point Source Reduction, 1989 Hydrodynamic Conditions
0.00
10.00
20.00
30.00
40.00
50.00
60.00
70.00
80.00
Day
s o
f N
on
Att
ain
men
t
Dissolved Oxygen 24 Hour average Never Less Than 5.0 (mg/L)CAIR Reductions + 30% Point Source Reduction, 1989 Hydrodynamic Conditions
0.00
10.00
20.00
30.00
40.00
50.00
60.00
70.00
80.00
Day
s o
f N
on
Att
ain
men
t
New York State Chronic CriteriaCAIR Reductions + 30% Point Source Reduction, 1989 Hydrodynamic Conditions
0.00
10.00
20.00
30.00
40.00
50.00
60.00
70.00
80.00
Day
s o
f N
on
Att
ain
men
t
New York State Acute CriteriaCAIR Reductions + 30% Point Source Reduction, 1989 Hydrodynamic Conditions

HYDRO QUAL, INC.
1200 M ACARTHUR, M AHWAH, N EW JERSEY 07430 T: 201-529-5151 F: 201-529-5728 WWW.HYDROQUAL.COM
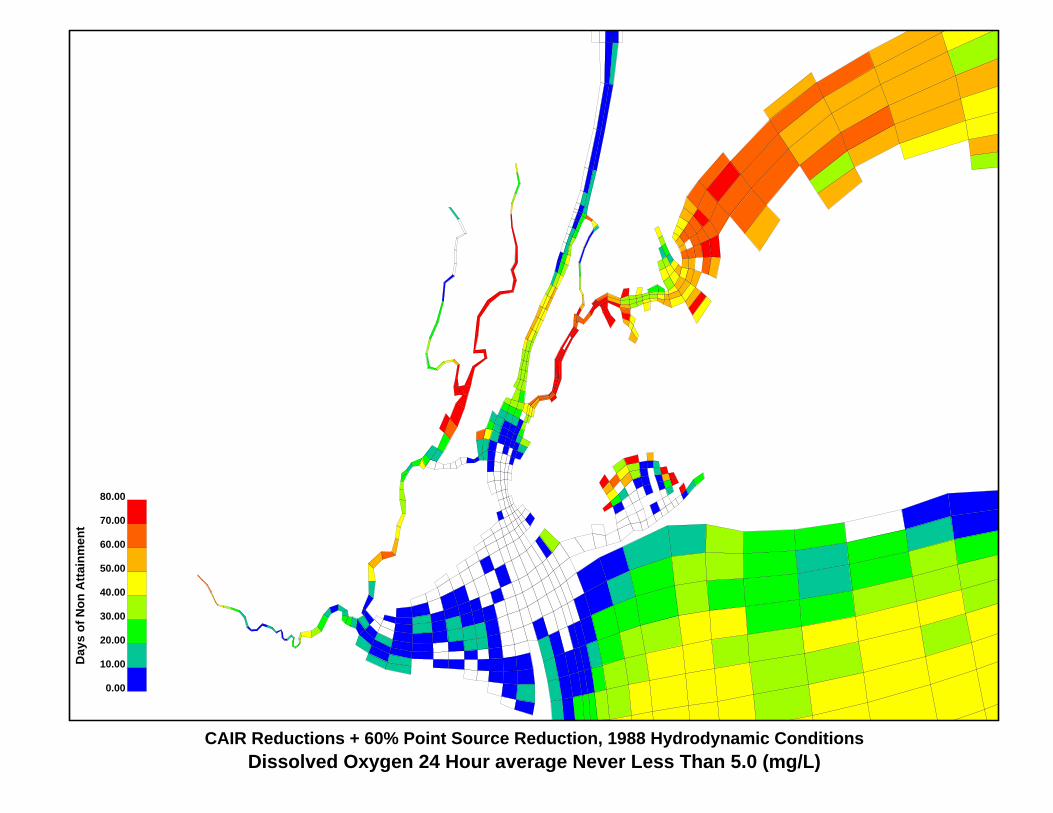
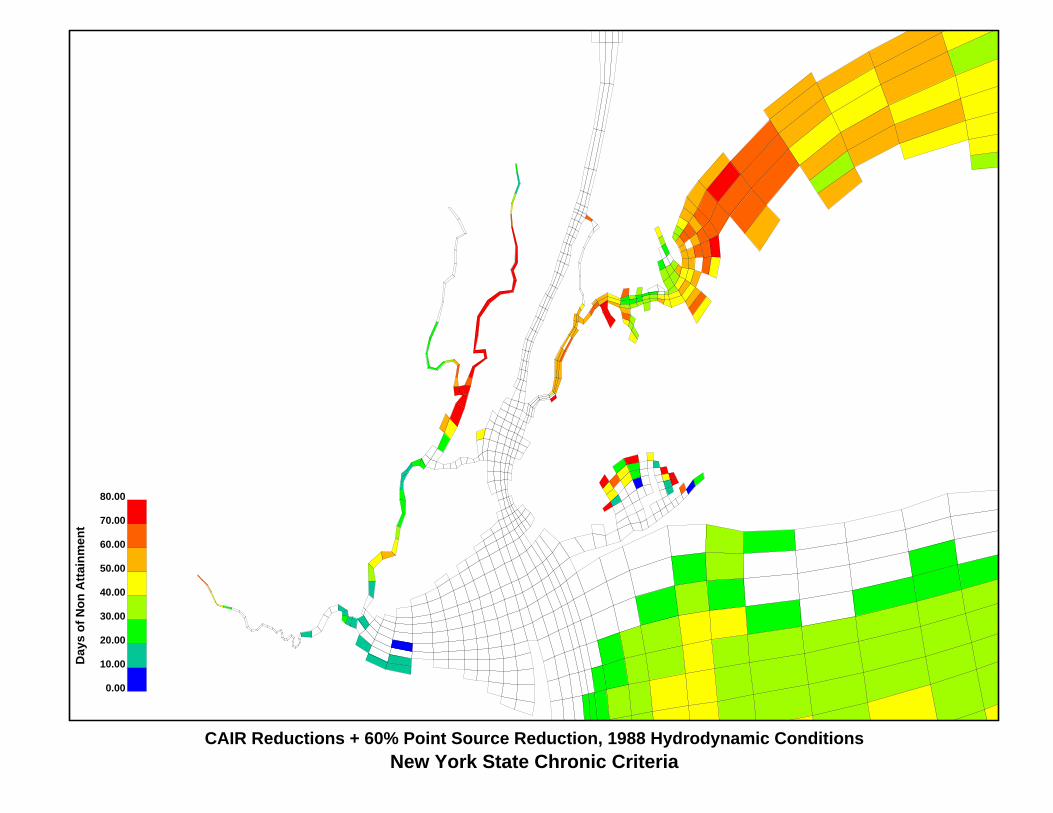
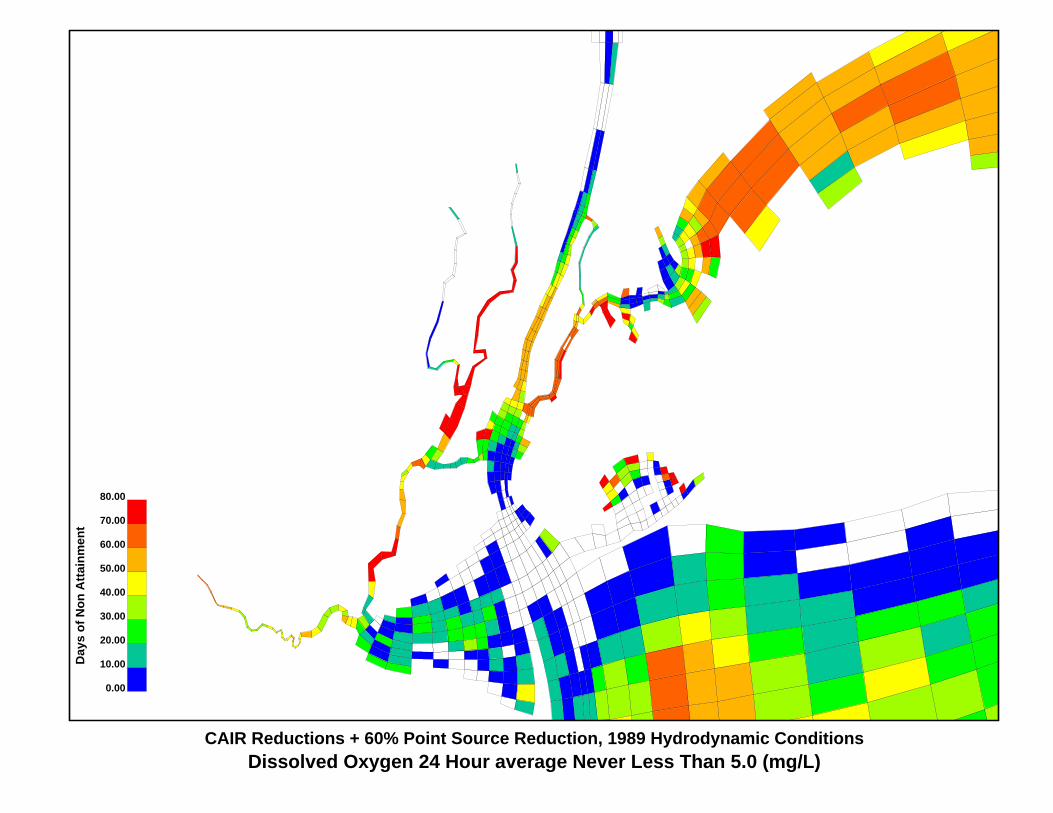
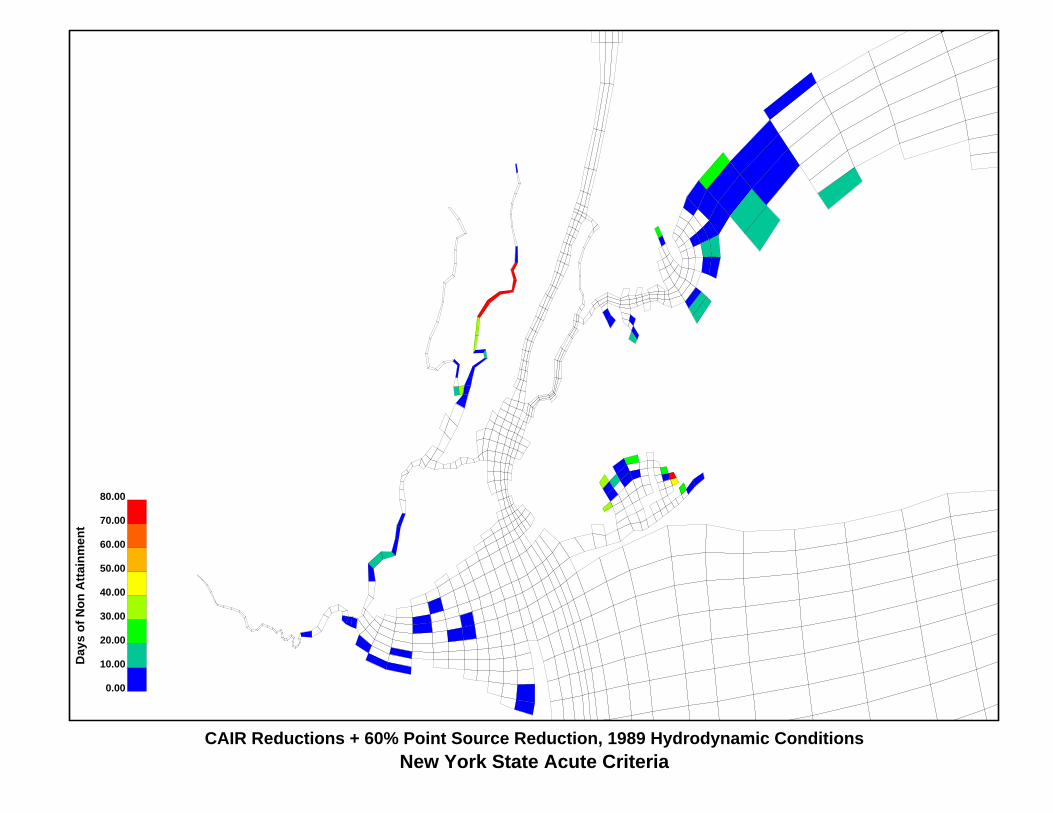
APPENDIX D
DO DAYS OF NON-ATTAINMENT MAPS
UNDER CAIR NPS N + 60% STP N REDUCTIONS

0.00
10.00
20.00
30.00
40.00
50.00
60.00
70.00
80.00
Day
s o
f N
on
Att
ain
men
t
Dissolved Oxygen Never Less Than 4.0 (mg/L)CAIR Reductions + 60% Point Source Reduction, 1988 Hydrodynamic Conditions
0.00
10.00
20.00
30.00
40.00
50.00
60.00
70.00
80.00
Day
s o
f N
on
Att
ain
men
t
Dissolved Oxygen 24 Hour average Never Less Than 5.0 (mg/L)CAIR Reductions + 60% Point Source Reduction, 1988 Hydrodynamic Conditions
0.00
10.00
20.00
30.00
40.00
50.00
60.00
70.00
80.00
Day
s o
f N
on
Att
ain
men
t
New York State Chronic CriteriaCAIR Reductions + 60% Point Source Reduction, 1988 Hydrodynamic Conditions

0.00
10.00
20.00
30.00
40.00
50.00
60.00
70.00
80.00
Day
s o
f N
on
Att
ain
men
t
New York State Acute CriteriaCAIR Reductions + 60% Point Source Reduction, 1988 Hydrodynamic Conditions

0.00
10.00
20.00
30.00
40.00
50.00
60.00
70.00
80.00
Day
s o
f N
on
Att
ain
men
t
Dissolved Oxygen Never Less Than 4.0 (mg/L)CAIR Reductions + 60% Point Source Reduction, 1989 Hydrodynamic Conditions
0.00
10.00
20.00
30.00
40.00
50.00
60.00
70.00
80.00
Day
s o
f N
on
Att
ain
men
t
Dissolved Oxygen 24 Hour average Never Less Than 5.0 (mg/L)CAIR Reductions + 60% Point Source Reduction, 1989 Hydrodynamic Conditions

0.00
10.00
20.00
30.00
40.00
50.00
60.00
70.00
80.00
Day
s o
f N
on
Att
ain
men
t
New York State Chronic CriteriaCAIR Reductions + 60% Point Source Reduction, 1989 Hydrodynamic Conditions
0.00
10.00
20.00
30.00
40.00
50.00
60.00
70.00
80.00
Day
s o
f N
on
Att
ain
men
t
New York State Acute CriteriaCAIR Reductions + 60% Point Source Reduction, 1989 Hydrodynamic Conditions

HYDRO QUAL, INC.
1200 M ACARTHUR, M AHWAH, N EW JERSEY 07430 T: 201-529-5151 F: 201-529-5728 WWW.HYDROQUAL.COM
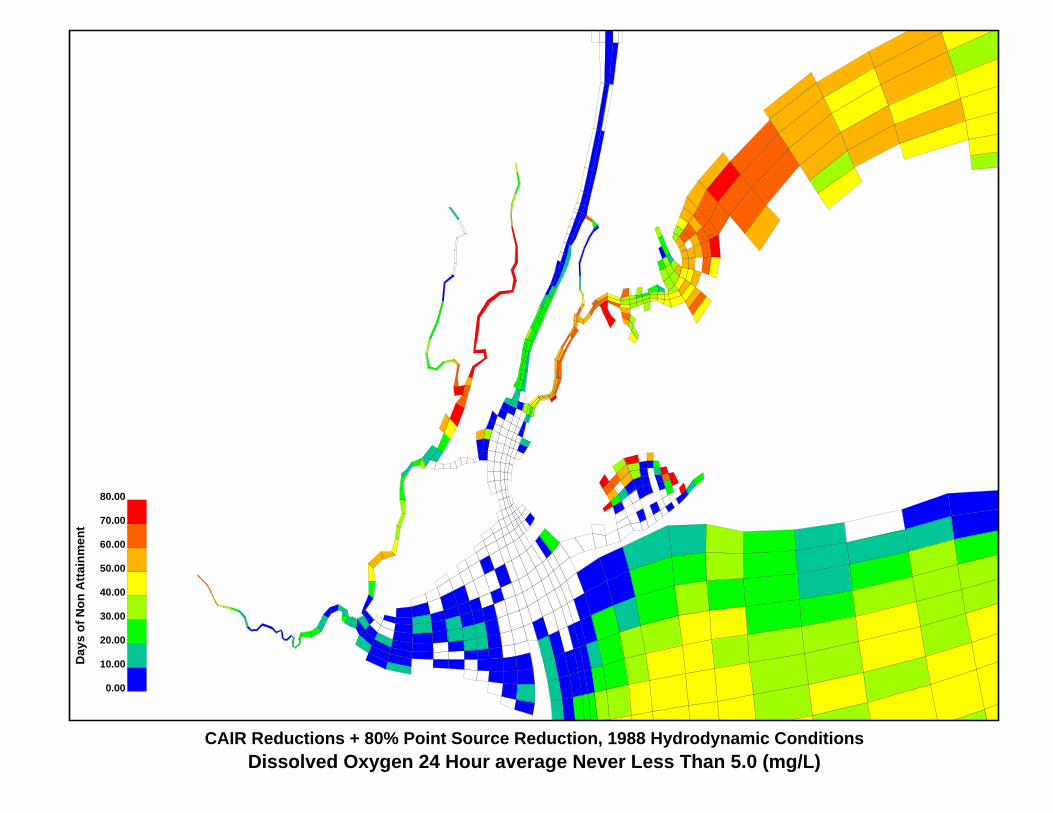
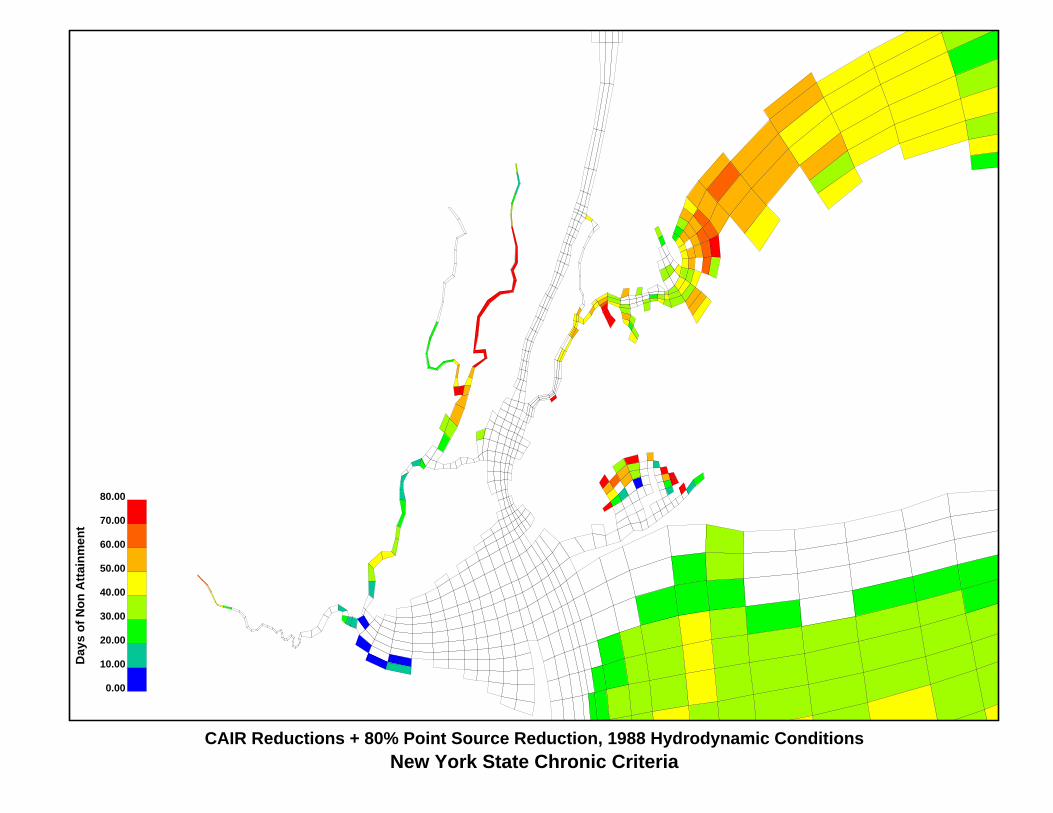
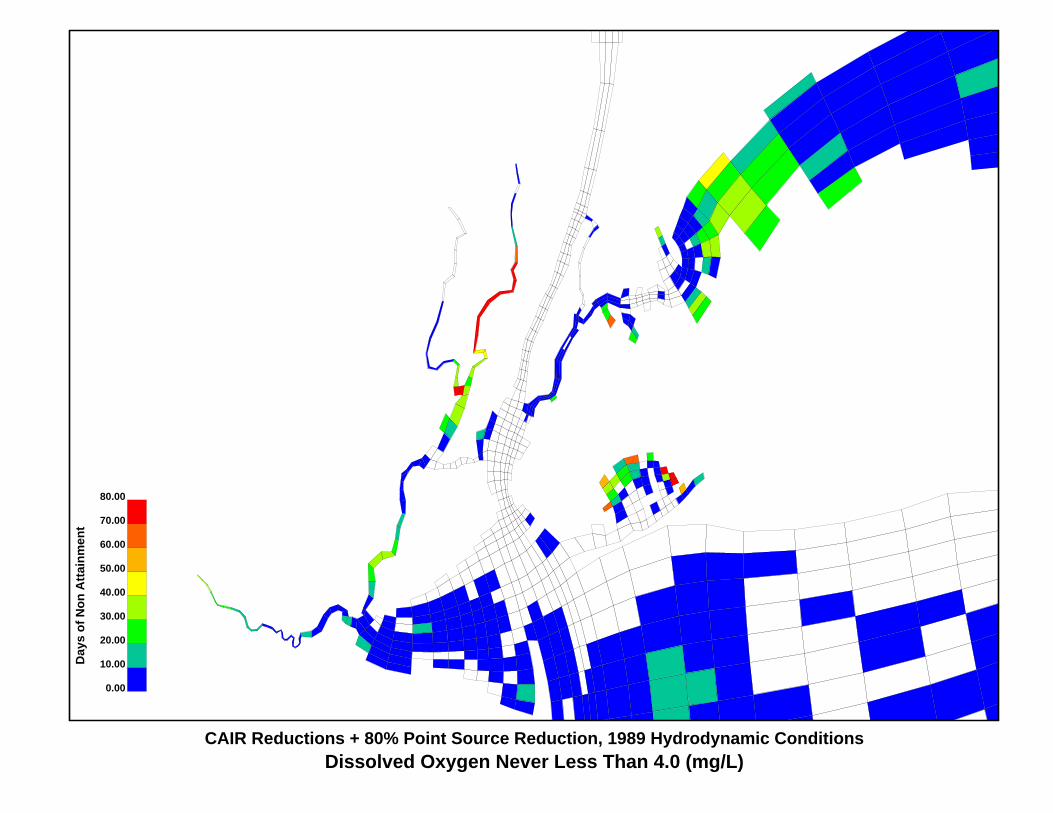
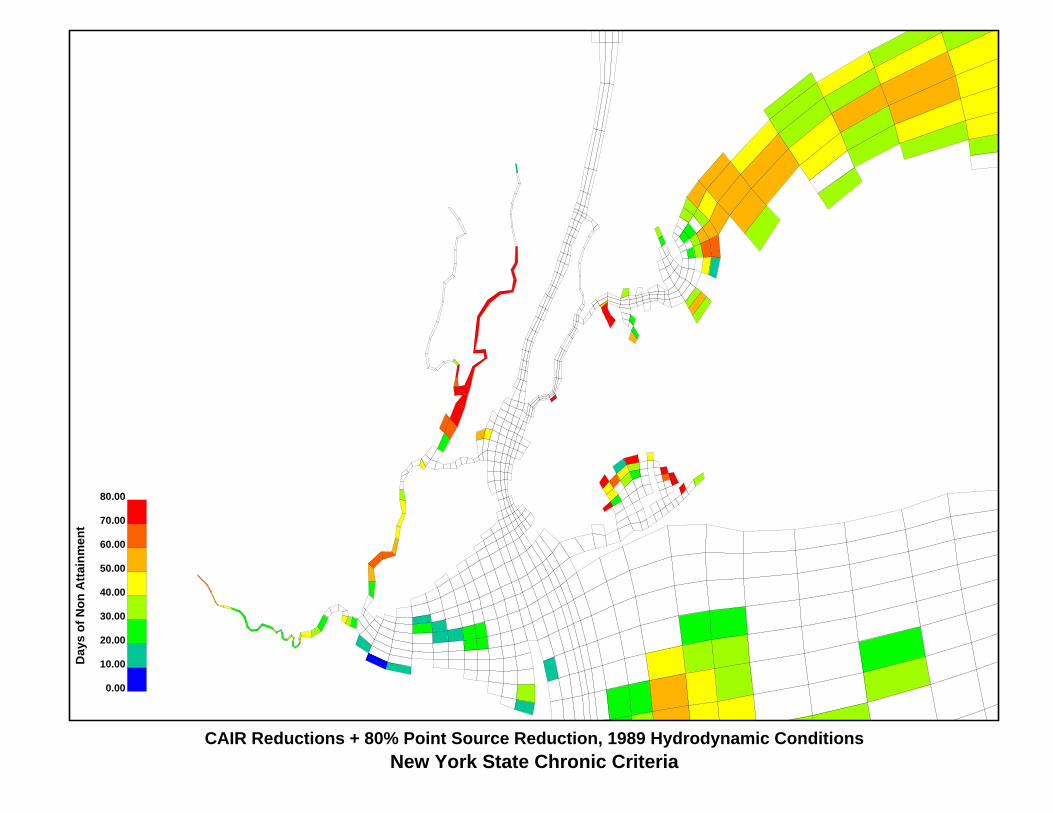
APPENDIX E
DO DAYS OF NON-ATTAINMENT MAPS
UNDER CAIR NPS N + 80% STP N REDUCTIONS

0.00
10.00
20.00
30.00
40.00
50.00
60.00
70.00
80.00
Day
s o
f N
on
Att
ain
men
t
Dissolved Oxygen Never Less Than 4.0 (mg/L)CAIR Reductions + 80% Point Source Reduction, 1988 Hydrodynamic Conditions
0.00
10.00
20.00
30.00
40.00
50.00
60.00
70.00
80.00
Day
s o
f N
on
Att
ain
men
t
Dissolved Oxygen 24 Hour average Never Less Than 5.0 (mg/L)CAIR Reductions + 80% Point Source Reduction, 1988 Hydrodynamic Conditions
0.00
10.00
20.00
30.00
40.00
50.00
60.00
70.00
80.00
Day
s o
f N
on
Att
ain
men
t
New York State Chronic CriteriaCAIR Reductions + 80% Point Source Reduction, 1988 Hydrodynamic Conditions

0.00
10.00
20.00
30.00
40.00
50.00
60.00
70.00
80.00
Day
s o
f N
on
Att
ain
men
t
New York State Acute CriteriaCAIR Reductions + 80% Point Source Reduction, 1988 Hydrodynamic Conditions
0.00
10.00
20.00
30.00
40.00
50.00
60.00
70.00
80.00
Day
s o
f N
on
Att
ain
men
t
Dissolved Oxygen Never Less Than 4.0 (mg/L)CAIR Reductions + 80% Point Source Reduction, 1989 Hydrodynamic Conditions

0.00
10.00
20.00
30.00
40.00
50.00
60.00
70.00
80.00
Day
s o
f N
on
Att
ain
men
t
Dissolved Oxygen 24 Hour average Never Less Than 5.0 (mg/L)CAIR Reductions + 80% Point Source Reduction, 1989 Hydrodynamic Conditions
0.00
10.00
20.00
30.00
40.00
50.00
60.00
70.00
80.00
Day
s o
f N
on
Att
ain
men
t
New York State Chronic CriteriaCAIR Reductions + 80% Point Source Reduction, 1989 Hydrodynamic Conditions

0.00
10.00
20.00
30.00
40.00
50.00
60.00
70.00
80.00
Day
s o
f N
on
Att
ain
men
t
New York State Acute CriteriaCAIR Reductions + 80% Point Source Reduction, 1989 Hydrodynamic Conditions
HYDRO QUAL, INC.
1200 M ACARTHUR, M AHWAH, N EW JERSEY 07430 T: 201-529-5151 F: 201-529-5728 WWW.HYDROQUAL.COM
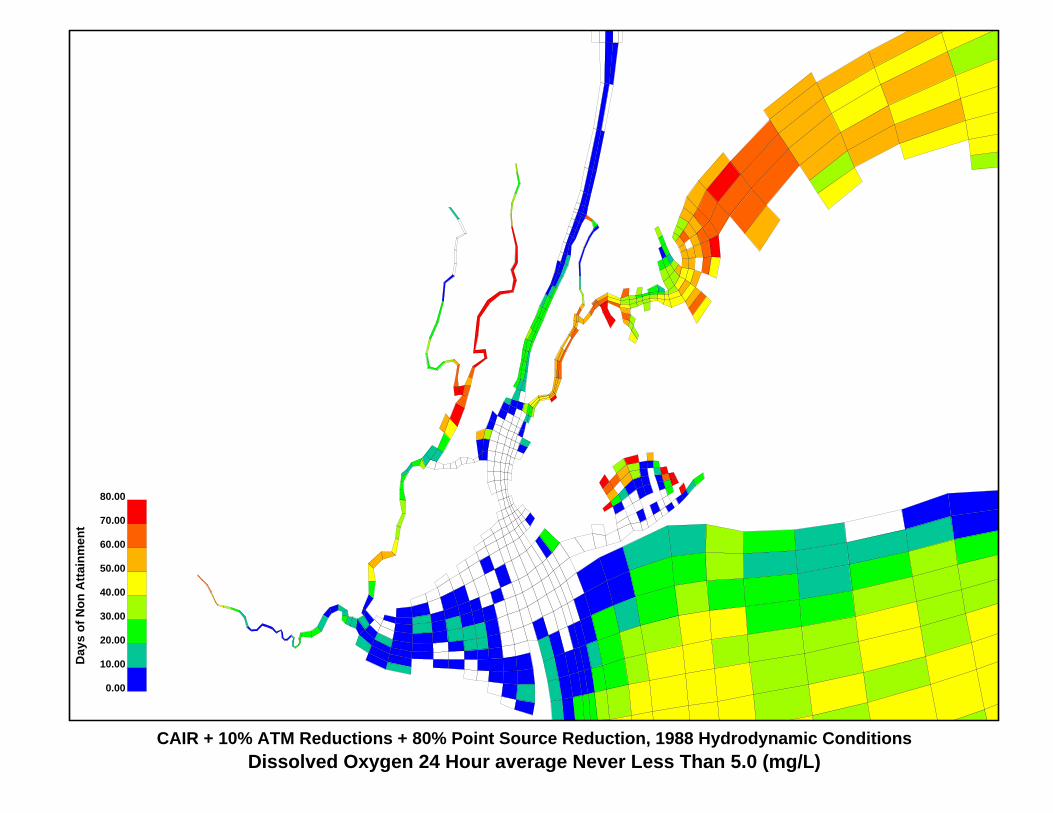
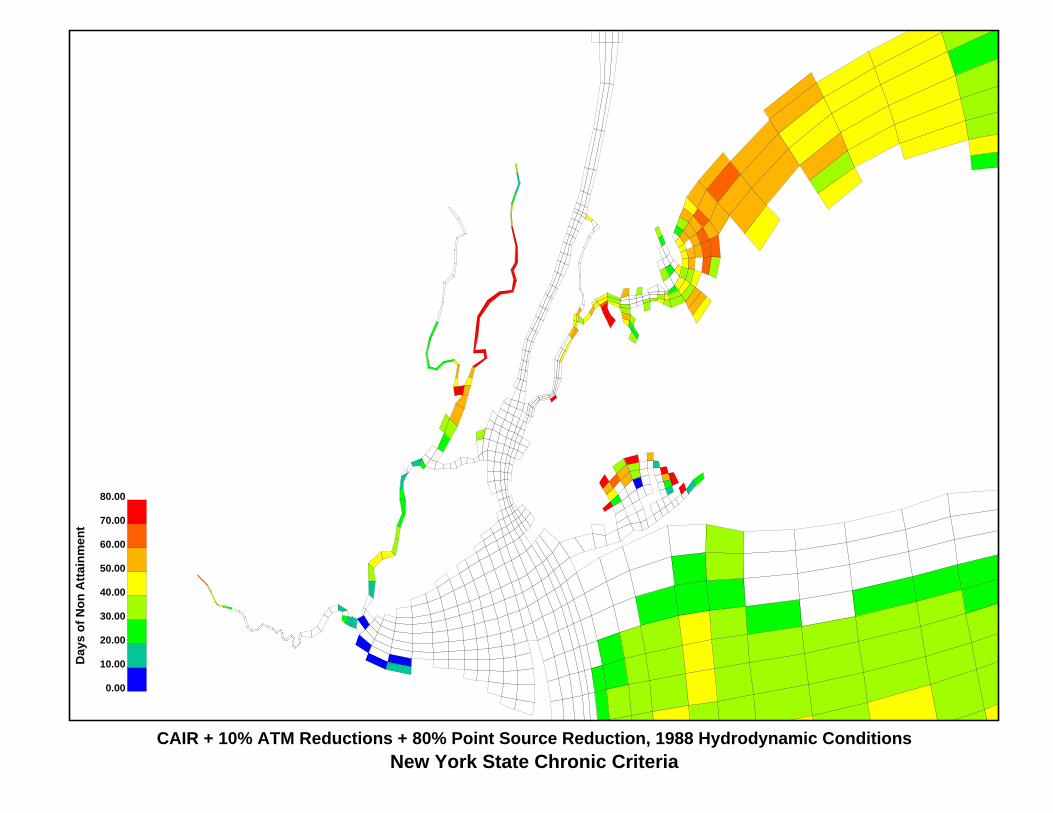
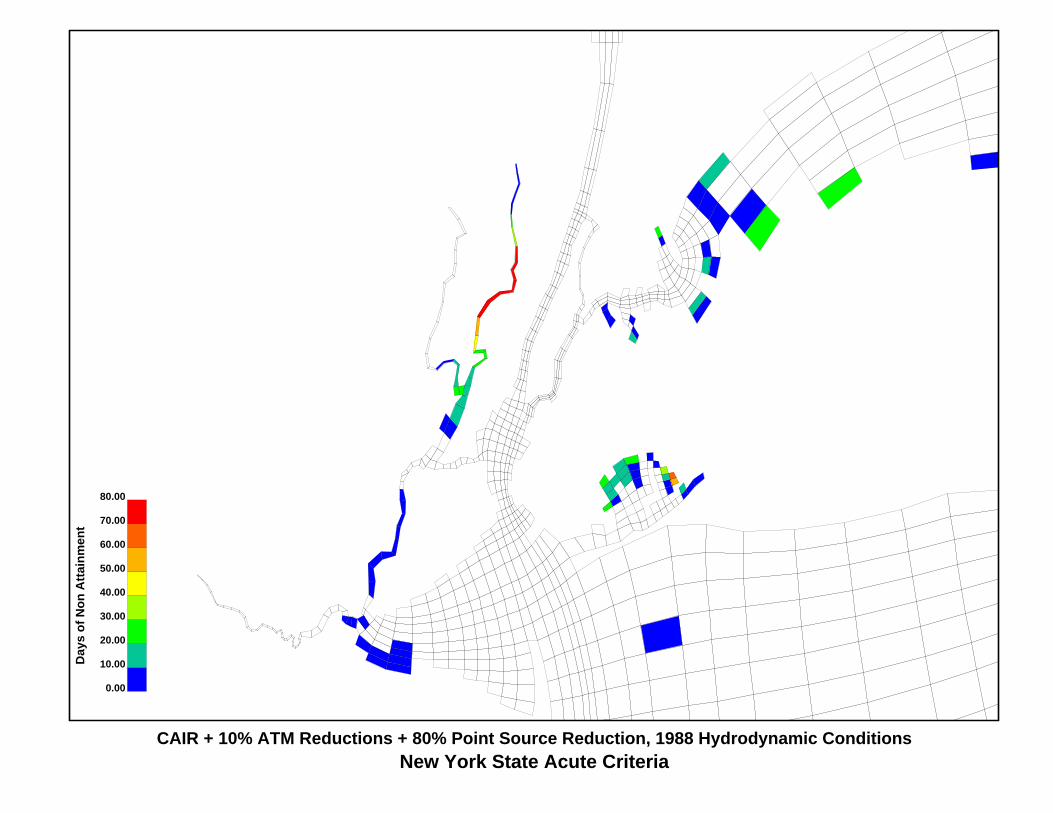
APPENDIX F
DO DAYS OF NON-ATTAINMENT MAPS
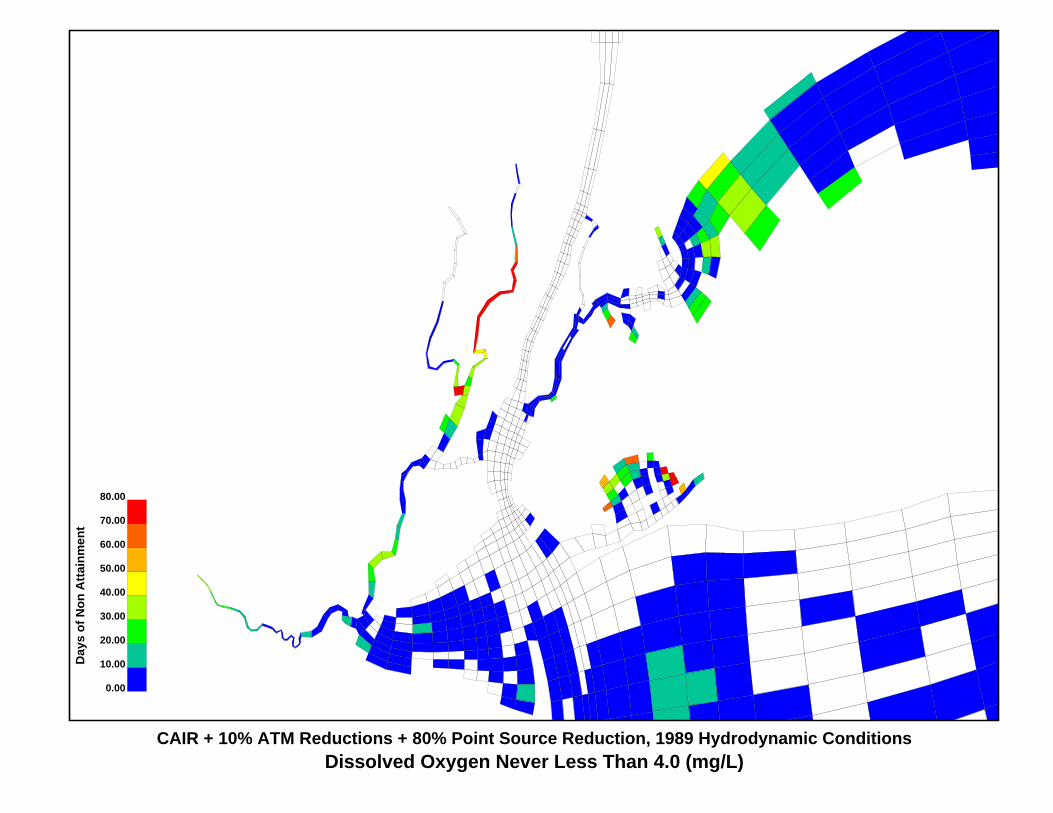
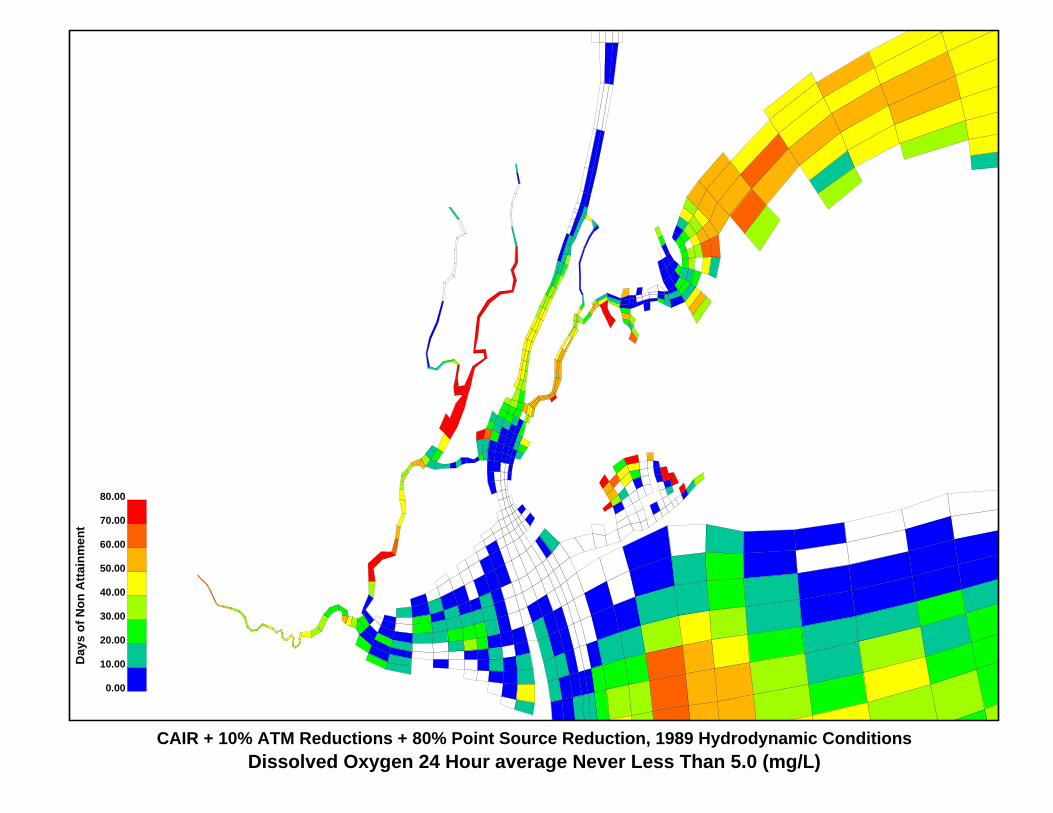
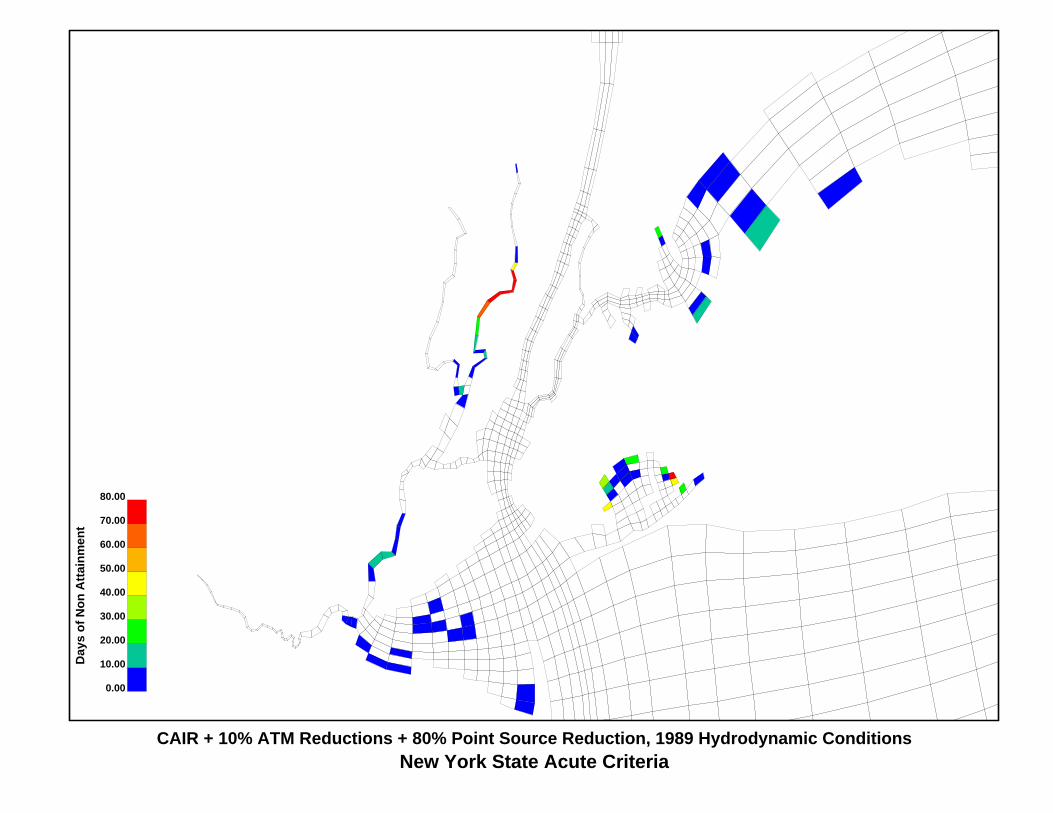
UNDER CAIR + 10% NPS N + 80% STP N REDUCTIONS

0.00
10.00
20.00
30.00
40.00
50.00
60.00
70.00
80.00
Day
s o
f N
on
Att
ain
men
t
Dissolved Oxygen Never Less Than 4.0 (mg/L)CAIR + 10% ATM Reductions + 80% Point Source Reduction, 1988 Hydrodynamic Conditions
0.00
10.00
20.00
30.00
40.00
50.00
60.00
70.00
80.00
Day
s o
f N
on
Att
ain
men
t
Dissolved Oxygen 24 Hour average Never Less Than 5.0 (mg/L)CAIR + 10% ATM Reductions + 80% Point Source Reduction, 1988 Hydrodynamic Conditions
0.00
10.00
20.00
30.00
40.00
50.00
60.00
70.00
80.00
Day
s o
f N
on
Att
ain
men
t
New York State Chronic CriteriaCAIR + 10% ATM Reductions + 80% Point Source Reduction, 1988 Hydrodynamic Conditions
0.00
10.00
20.00
30.00
40.00
50.00
60.00
70.00
80.00
Day
s o
f N
on
Att
ain
men
t
New York State Acute CriteriaCAIR + 10% ATM Reductions + 80% Point Source Reduction, 1988 Hydrodynamic Conditions
0.00
10.00
20.00
30.00
40.00
50.00
60.00
70.00
80.00
Day
s o
f N
on
Att
ain
men
t
Dissolved Oxygen Never Less Than 4.0 (mg/L)CAIR + 10% ATM Reductions + 80% Point Source Reduction, 1989 Hydrodynamic Conditions
0.00
10.00
20.00
30.00
40.00
50.00
60.00
70.00
80.00
Day
s o
f N
on
Att
ain
men
t
Dissolved Oxygen 24 Hour average Never Less Than 5.0 (mg/L)CAIR + 10% ATM Reductions + 80% Point Source Reduction, 1989 Hydrodynamic Conditions

0.00
10.00
20.00
30.00
40.00
50.00
60.00
70.00
80.00
Day
s o
f N
on
Att
ain
men
t
New York State Chronic CriteriaCAIR + 10% ATM Reductions + 80% Point Source Reduction, 1989 Hydrodynamic Conditions
0.00
10.00
20.00
30.00
40.00
50.00
60.00
70.00
80.00
Day
s o
f N
on
Att
ain
men
t
New York State Acute CriteriaCAIR + 10% ATM Reductions + 80% Point Source Reduction, 1989 Hydrodynamic Conditions

HYDRO QUAL, INC.
1200 M ACARTHUR, M AHWAH, N EW JERSEY 07430 T: 201-529-5151 F: 201-529-5728 WWW.HYDROQUAL.COM
APPENDIX G
DO DAYS OF NON-ATTAINMENT MAPS
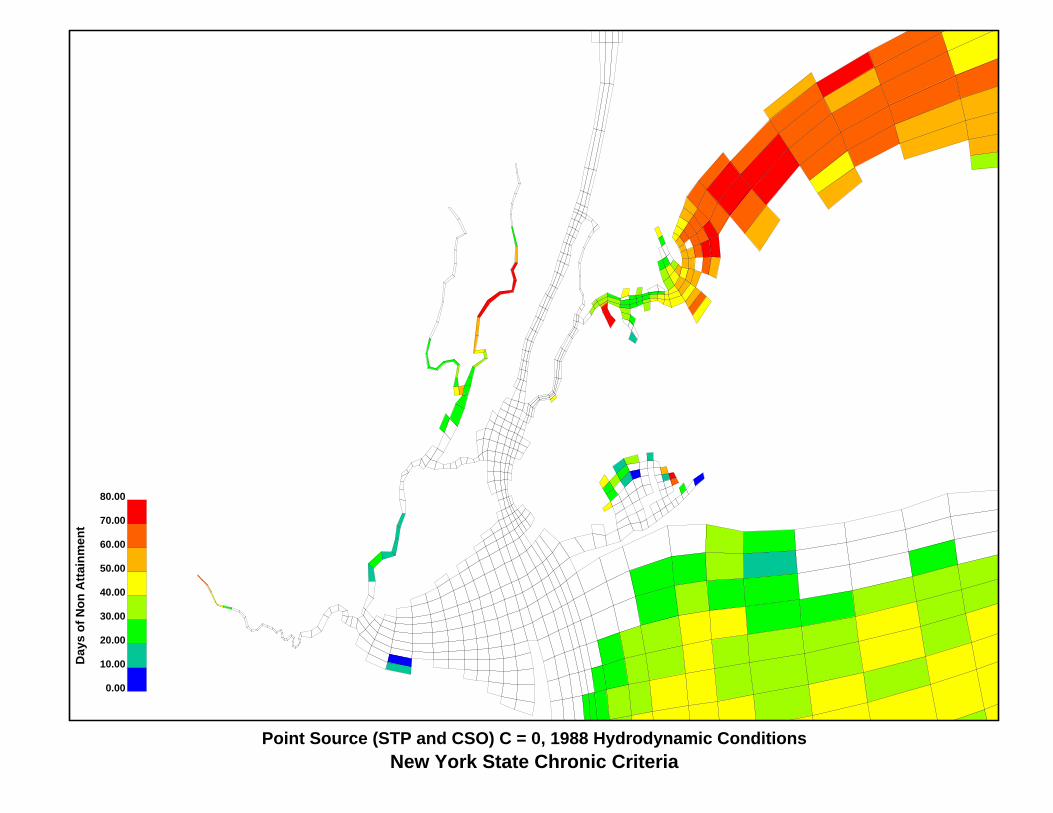
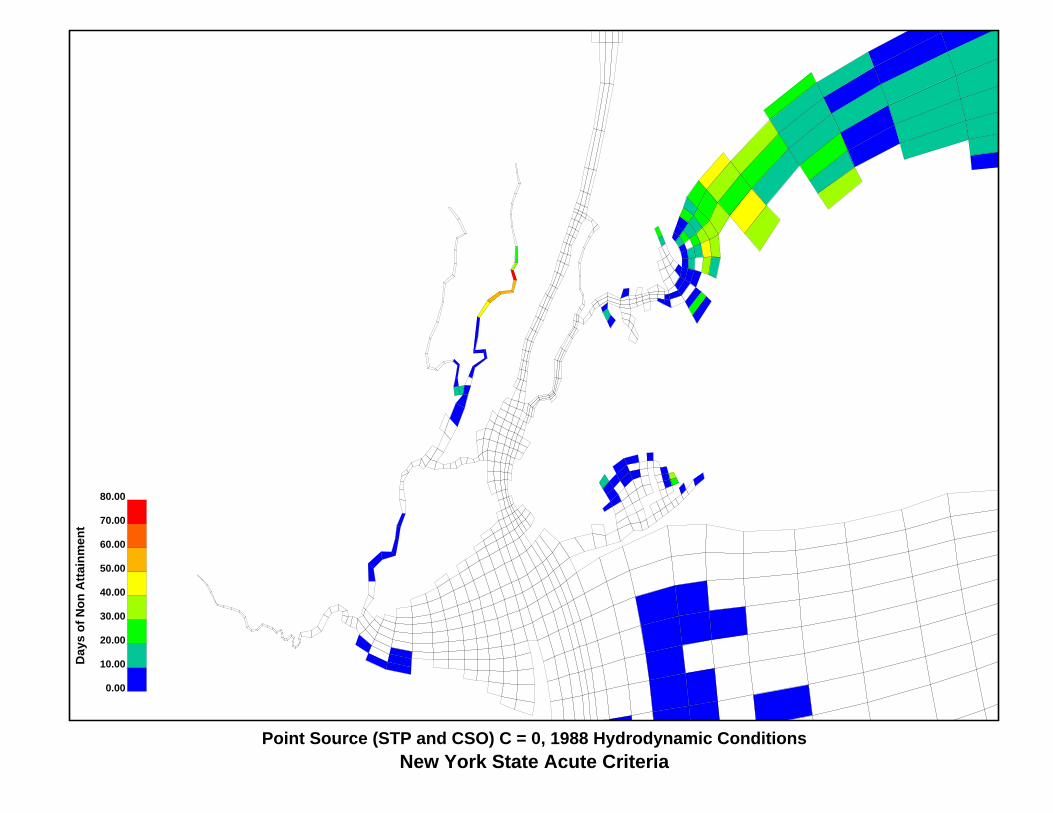
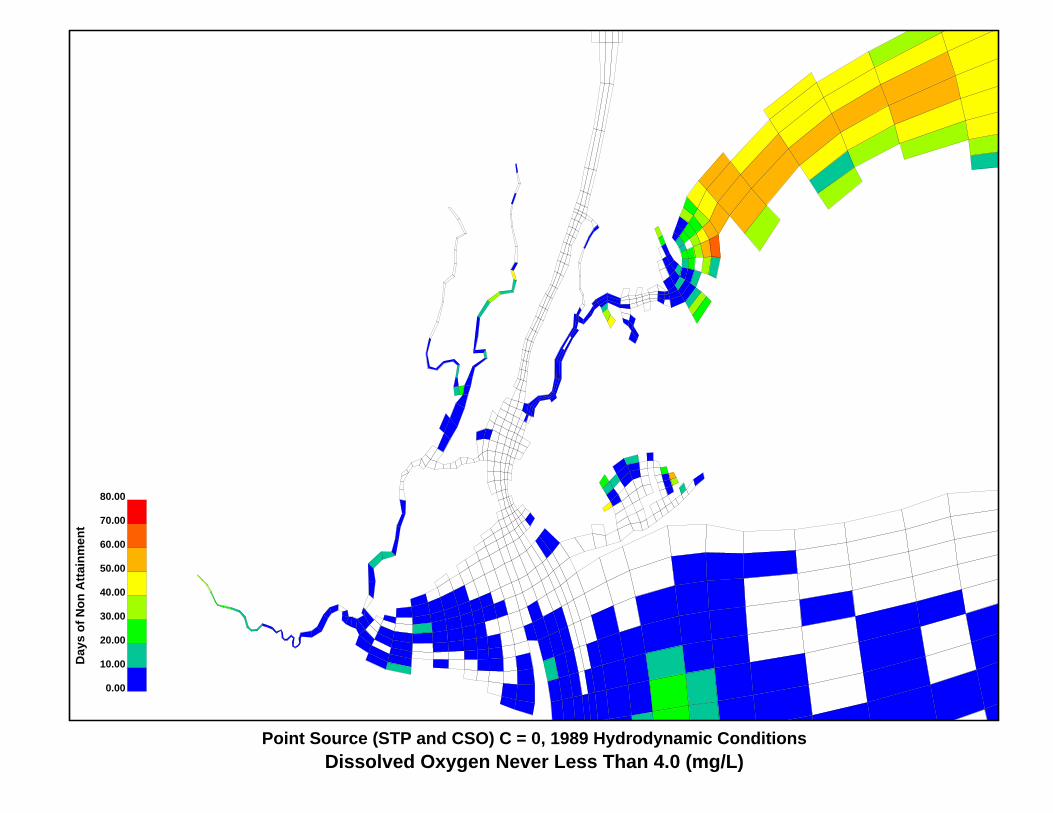
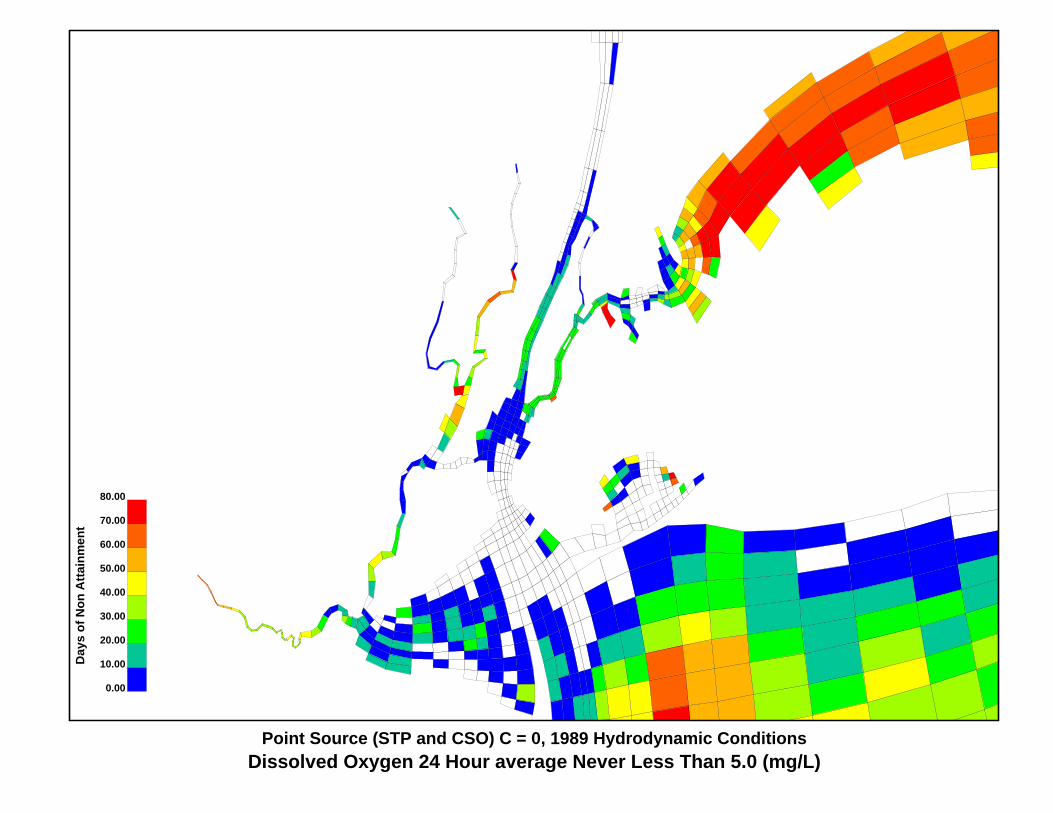
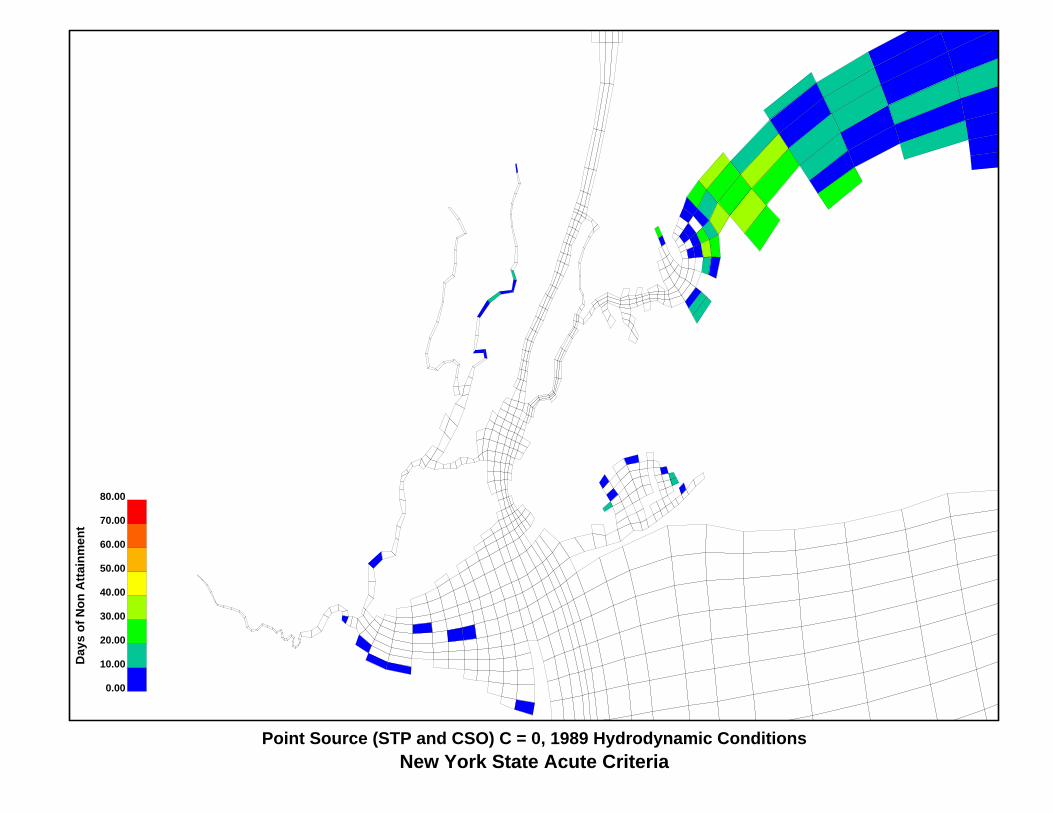
UNDER 100% POINT SOURCE CARBON REDUCTION

0.00
10.00
20.00
30.00
40.00
50.00
60.00
70.00
80.00
Day
s o
f N
on
Att
ain
men
t
Dissolved Oxygen Never Less Than 4.0 (mg/L)Point Source (STP and CSO) C = 0, 1988 Hydrodynamic Conditions

0.00
10.00
20.00
30.00
40.00
50.00
60.00
70.00
80.00
Day
s o
f N
on
Att
ain
men
t
Dissolved Oxygen 24 Hour average Never Less Than 5.0 (mg/L)Point Source (STP and CSO) C = 0, 1988 Hydrodynamic Conditions
0.00
10.00
20.00
30.00
40.00
50.00
60.00
70.00
80.00
Day
s o
f N
on
Att
ain
men
t
New York State Chronic CriteriaPoint Source (STP and CSO) C = 0, 1988 Hydrodynamic Conditions
0.00
10.00
20.00
30.00
40.00
50.00
60.00
70.00
80.00
Day
s o
f N
on
Att
ain
men
t
New York State Acute CriteriaPoint Source (STP and CSO) C = 0, 1988 Hydrodynamic Conditions
0.00
10.00
20.00
30.00
40.00
50.00
60.00
70.00
80.00
Day
s o
f N
on
Att
ain
men
t
Dissolved Oxygen Never Less Than 4.0 (mg/L)Point Source (STP and CSO) C = 0, 1989 Hydrodynamic Conditions
0.00
10.00
20.00
30.00
40.00
50.00
60.00
70.00
80.00
Day
s o
f N
on
Att
ain
men
t
Dissolved Oxygen 24 Hour average Never Less Than 5.0 (mg/L)Point Source (STP and CSO) C = 0, 1989 Hydrodynamic Conditions

0.00
10.00
20.00
30.00
40.00
50.00
60.00
70.00
80.00
Day
s o
f N
on
Att
ain
men
t
New York State Chronic CriteriaPoint Source (STP and CSO) C = 0, 1989 Hydrodynamic Conditions
0.00
10.00
20.00
30.00
40.00
50.00
60.00
70.00
80.00
Day
s o
f N
on
Att
ain
men
t
New York State Acute CriteriaPoint Source (STP and CSO) C = 0, 1989 Hydrodynamic Conditions
HYDRO QUAL, INC.
1200 M ACARTHUR, M AHWAH, N EW JERSEY 07430 T: 201-529-5151 F: 201-529-5728 WWW.HYDROQUAL.COM
APPENDIX H
DO DAYS OF NON-ATTAINMENT MAPS
UNDER 100% STORMWATER AND
ATMOSPHERIC CARBON REDUCTION
0.00
10.00
20.00
30.00
40.00
50.00
60.00
70.00
80.00
Day
s o
f N
on
Att
ain
men
t
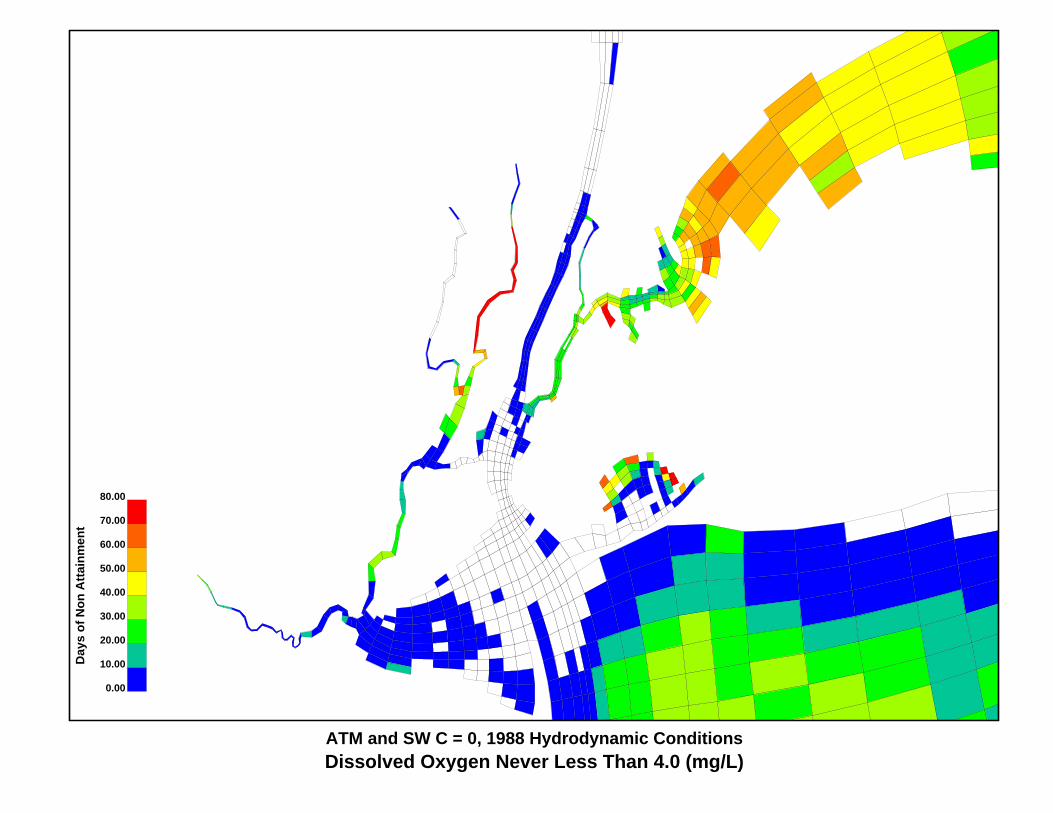
Dissolved Oxygen Never Less Than 4.0 (mg/L)ATM and SW C = 0, 1988 Hydrodynamic Conditions

0.00
10.00
20.00
30.00
40.00
50.00
60.00
70.00
80.00
Day
s o
f N
on
Att
ain
men
t
Dissolved Oxygen 24 Hour average Never Less Than 5.0 (mg/L)ATM and SW C = 0, 1988 Hydrodynamic Conditions
0.00
10.00
20.00
30.00
40.00
50.00
60.00
70.00
80.00
Day
s o
f N
on
Att
ain
men
t
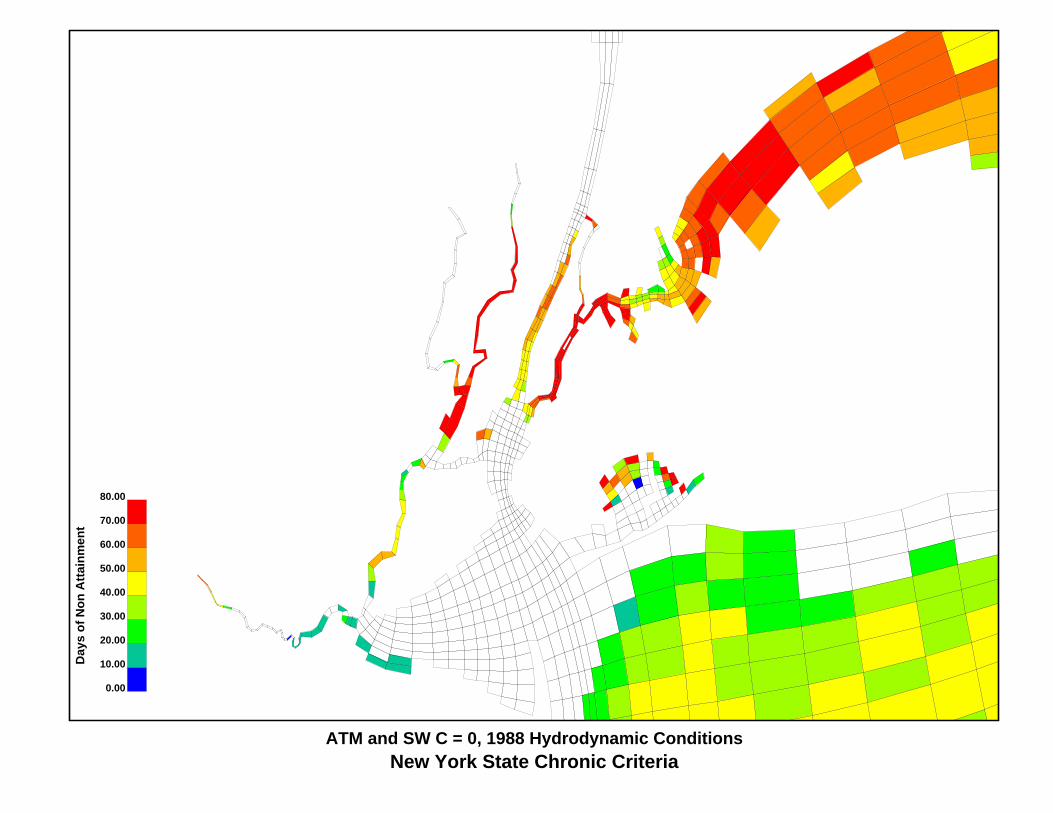
New York State Chronic CriteriaATM and SW C = 0, 1988 Hydrodynamic Conditions

0.00
10.00
20.00
30.00
40.00
50.00
60.00
70.00
80.00
Day
s o
f N
on
Att
ain
men
t
New York State Acute CriteriaATM and SW C = 0, 1988 Hydrodynamic Conditions

0.00
10.00
20.00
30.00
40.00
50.00
60.00
70.00
80.00
Day
s o
f N
on
Att
ain
men
t
Dissolved Oxygen Never Less Than 4.0 (mg/L)ATM and SW C = 0, 1989 Hydrodynamic Conditions

0.00
10.00
20.00
30.00
40.00
50.00
60.00
70.00
80.00
Day
s o
f N
on
Att
ain
men
t
Dissolved Oxygen 24 Hour average Never Less Than 5.0 (mg/L)ATM and SW C = 0, 1989 Hydrodynamic Conditions
0.00
10.00
20.00
30.00
40.00
50.00
60.00
70.00
80.00
Day
s o
f N
on
Att
ain
men
t
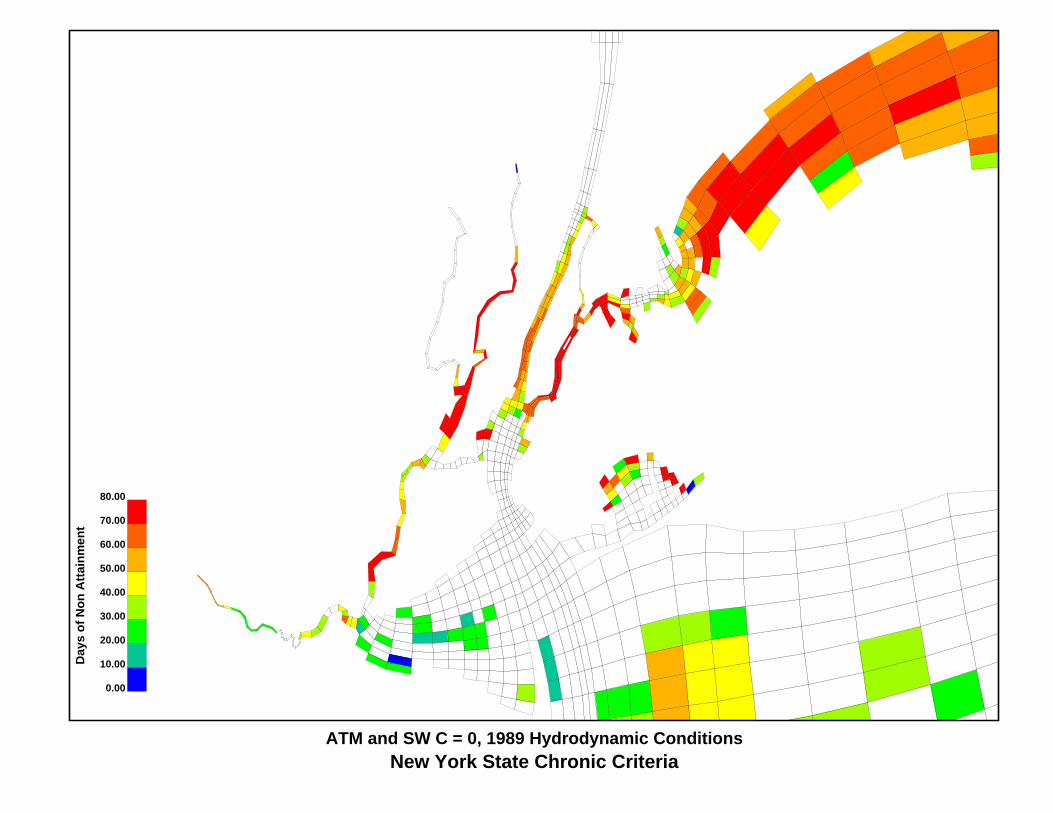
New York State Chronic CriteriaATM and SW C = 0, 1989 Hydrodynamic Conditions

0.00
10.00
20.00
30.00
40.00
50.00
60.00
70.00
80.00
Day
s o
f N
on
Att
ain
men
t
New York State Acute CriteriaATM and SW C = 0, 1989 Hydrodynamic Conditions

HYDRO QUAL, INC.
1200 M ACARTHUR, M AHWAH, N EW JERSEY 07430 T: 201-529-5151 F: 201-529-5728 WWW.HYDROQUAL.COM
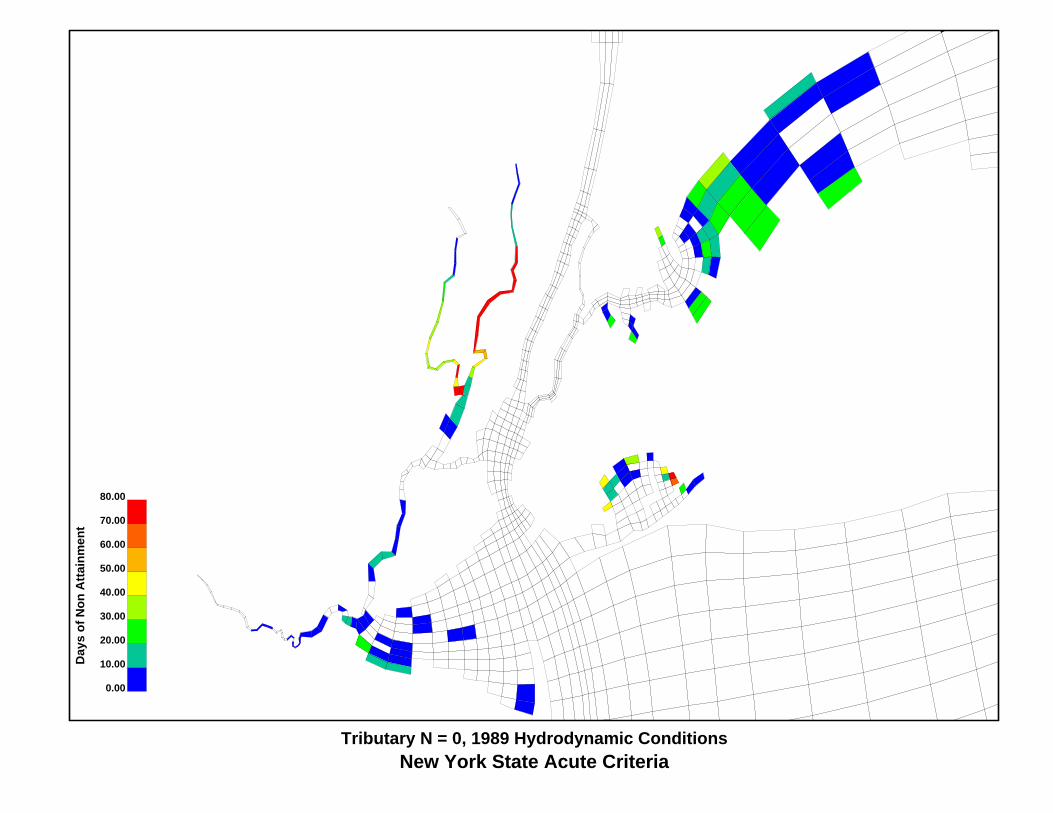
APPENDIX I
DO DAYS OF NON-ATTAINMENT MAPS
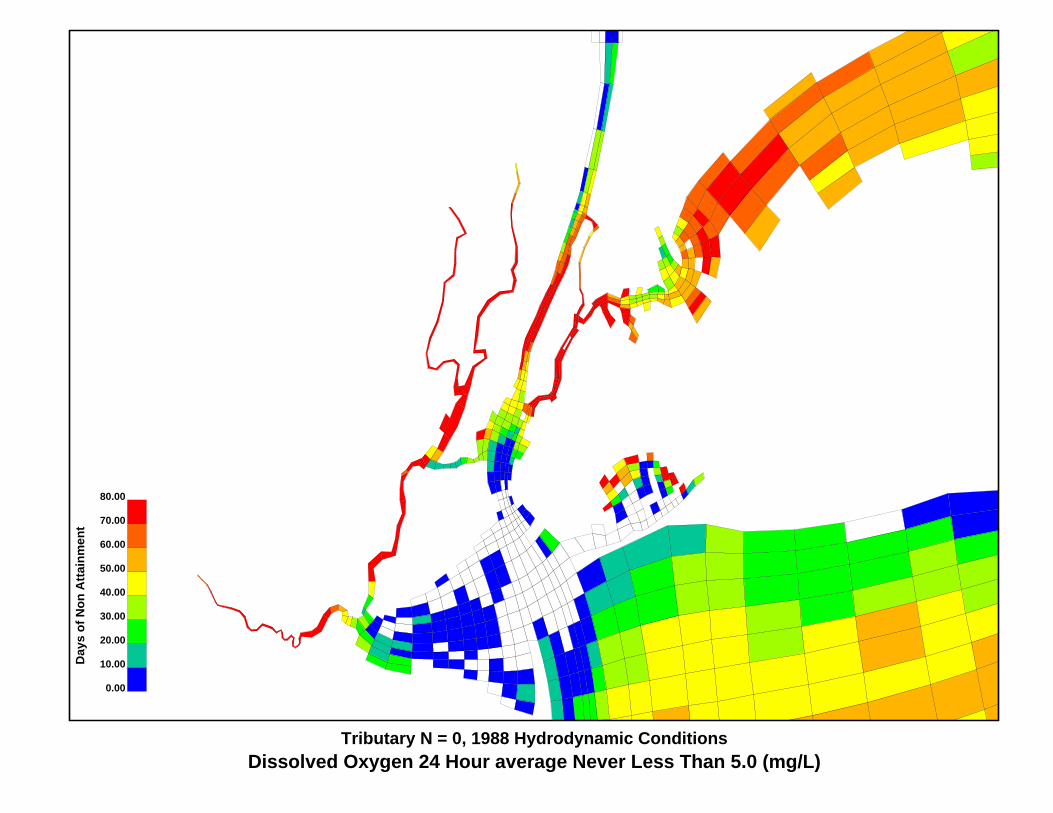
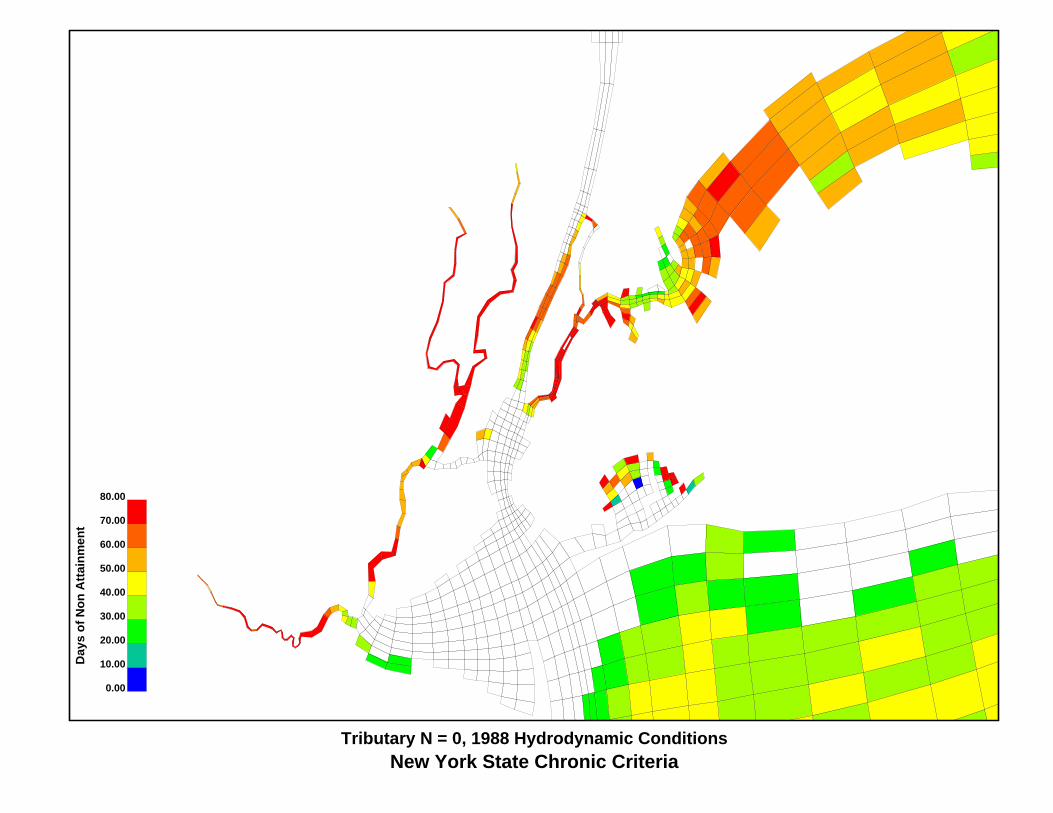
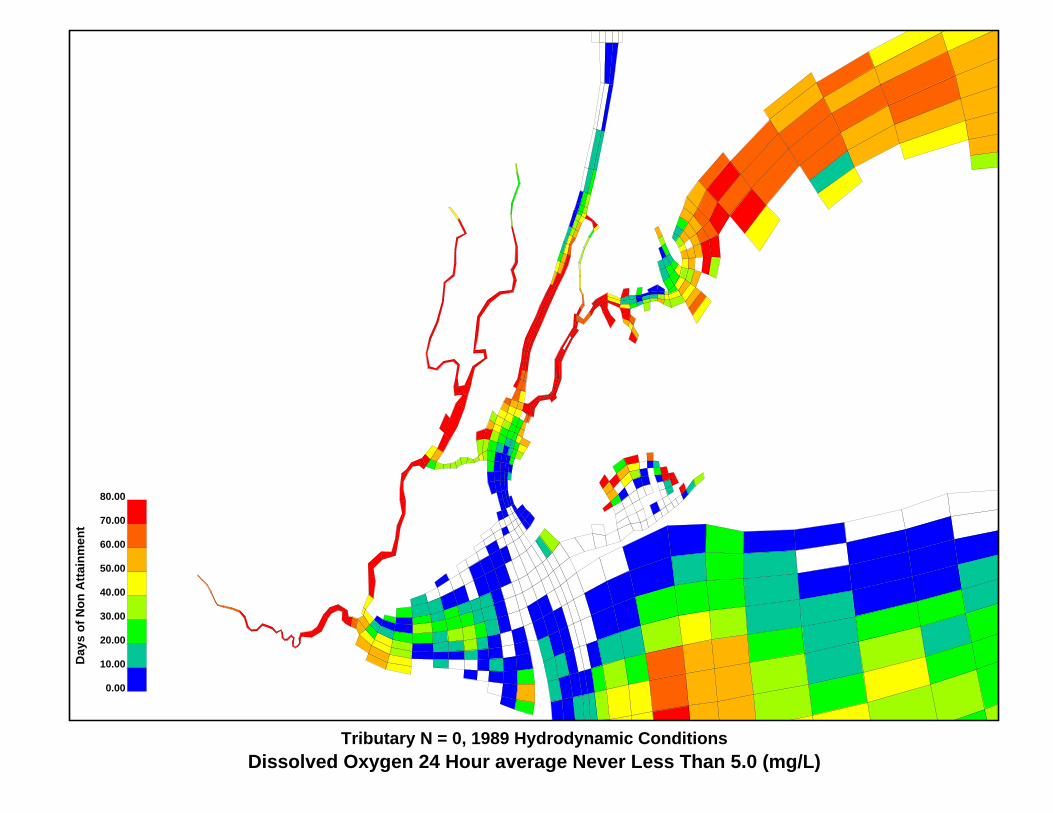
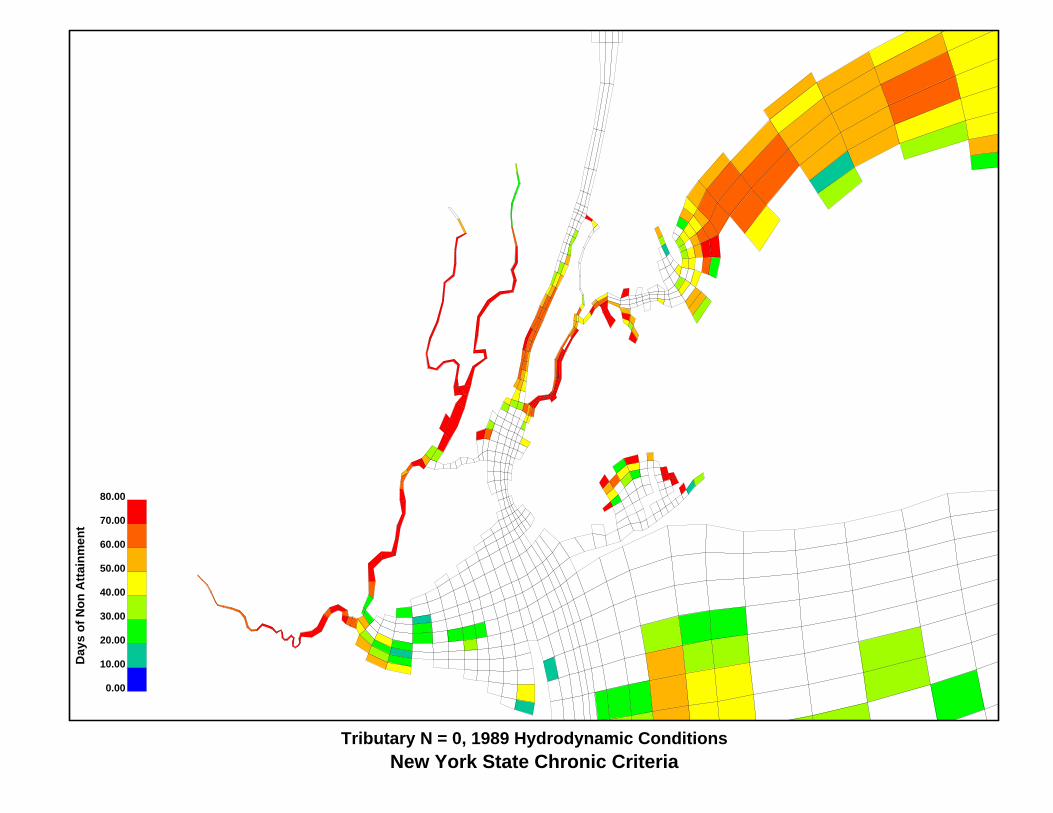
UNDER 100% TRIBUTARY NITROGEN REDUCTION

0.00
10.00
20.00
30.00
40.00
50.00
60.00
70.00
80.00
Day
s o
f N
on
Att
ain
men
t
Dissolved Oxygen Never Less Than 4.0 (mg/L)Tributary N = 0, 1988 Hydrodynamic Conditions
0.00
10.00
20.00
30.00
40.00
50.00
60.00
70.00
80.00
Day
s o
f N
on
Att
ain
men
t
Dissolved Oxygen 24 Hour average Never Less Than 5.0 (mg/L)Tributary N = 0, 1988 Hydrodynamic Conditions
0.00
10.00
20.00
30.00
40.00
50.00
60.00
70.00
80.00
Day
s o
f N
on
Att
ain
men
t
New York State Chronic CriteriaTributary N = 0, 1988 Hydrodynamic Conditions

0.00
10.00
20.00
30.00
40.00
50.00
60.00
70.00
80.00
Day
s o
f N
on
Att
ain
men
t
New York State Acute CriteriaTributary N = 0, 1988 Hydrodynamic Conditions

0.00
10.00
20.00
30.00
40.00
50.00
60.00
70.00
80.00
Day
s o
f N
on
Att
ain
men
t
Dissolved Oxygen Never Less Than 4.0 (mg/L)Tributary N = 0, 1989 Hydrodynamic Conditions
0.00
10.00
20.00
30.00
40.00
50.00
60.00
70.00
80.00
Day
s o
f N
on
Att
ain
men
t
Dissolved Oxygen 24 Hour average Never Less Than 5.0 (mg/L)Tributary N = 0, 1989 Hydrodynamic Conditions
0.00
10.00
20.00
30.00
40.00
50.00
60.00
70.00
80.00
Day
s o
f N
on
Att
ain
men
t
New York State Chronic CriteriaTributary N = 0, 1989 Hydrodynamic Conditions
0.00
10.00
20.00
30.00
40.00
50.00
60.00
70.00
80.00
Day
s o
f N
on
Att
ain
men
t
New York State Acute CriteriaTributary N = 0, 1989 Hydrodynamic Conditions

HYDRO QUAL, INC.
1200 M ACARTHUR, M AHWAH, N EW JERSEY 07430 T: 201-529-5151 F: 201-529-5728 WWW.HYDROQUAL.COM
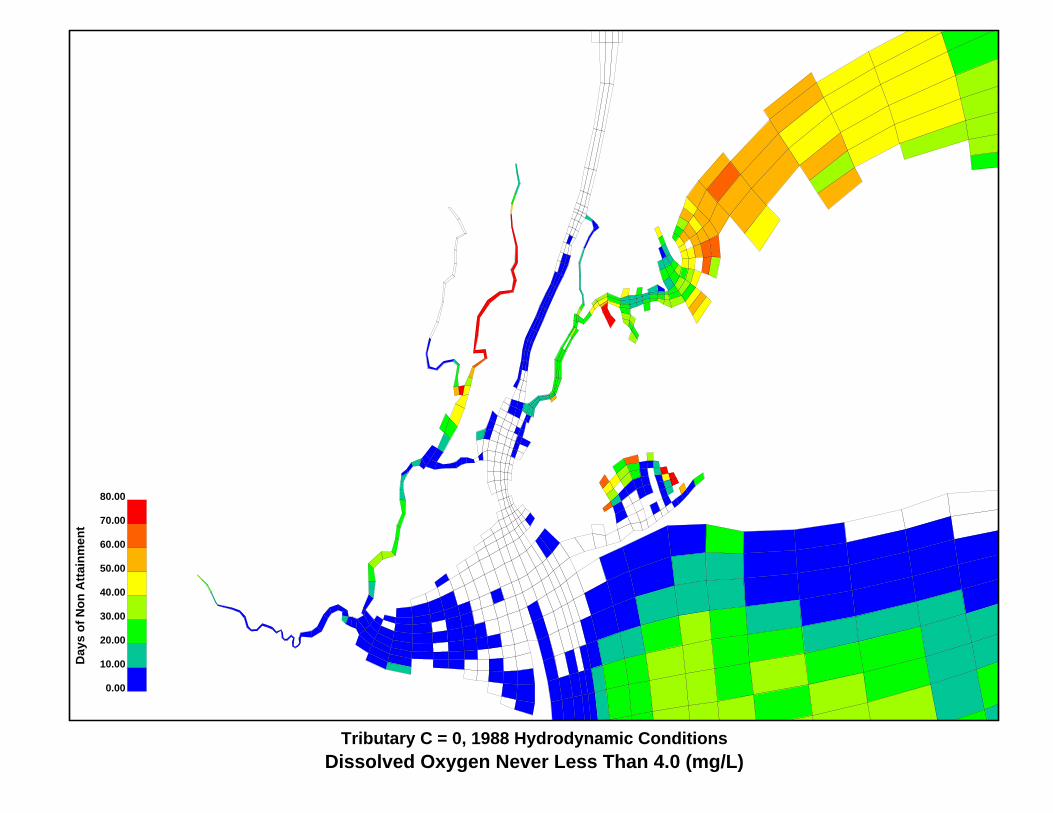
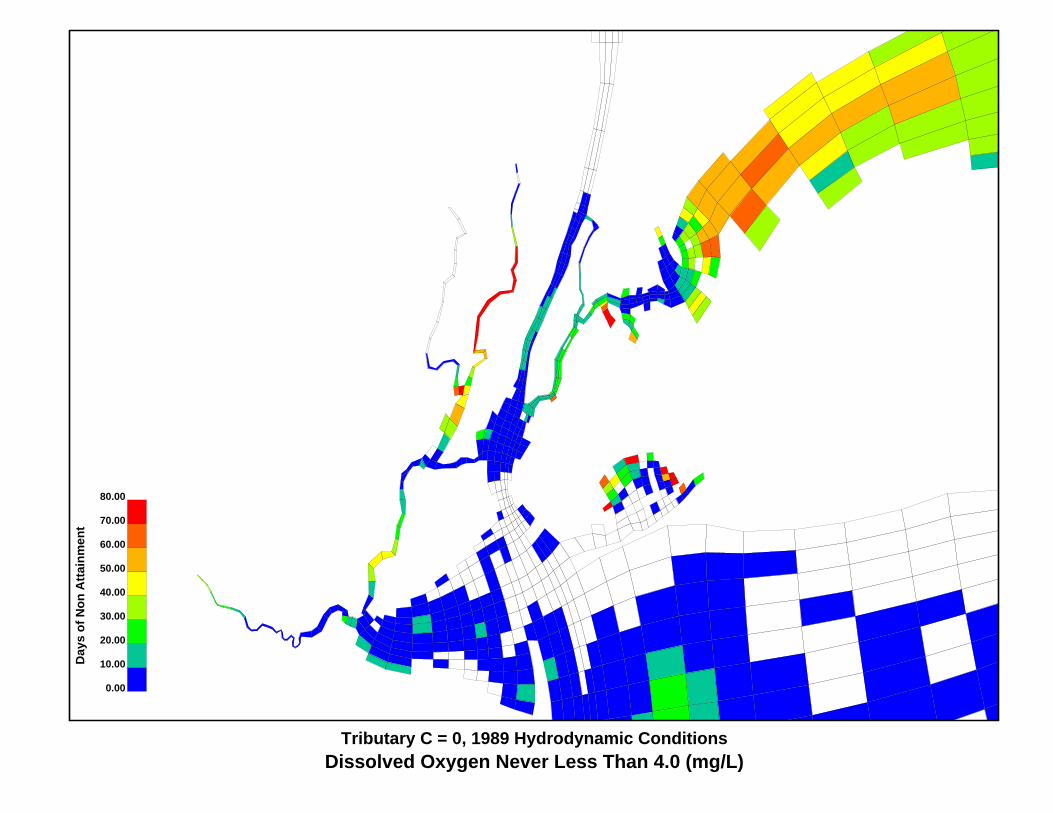
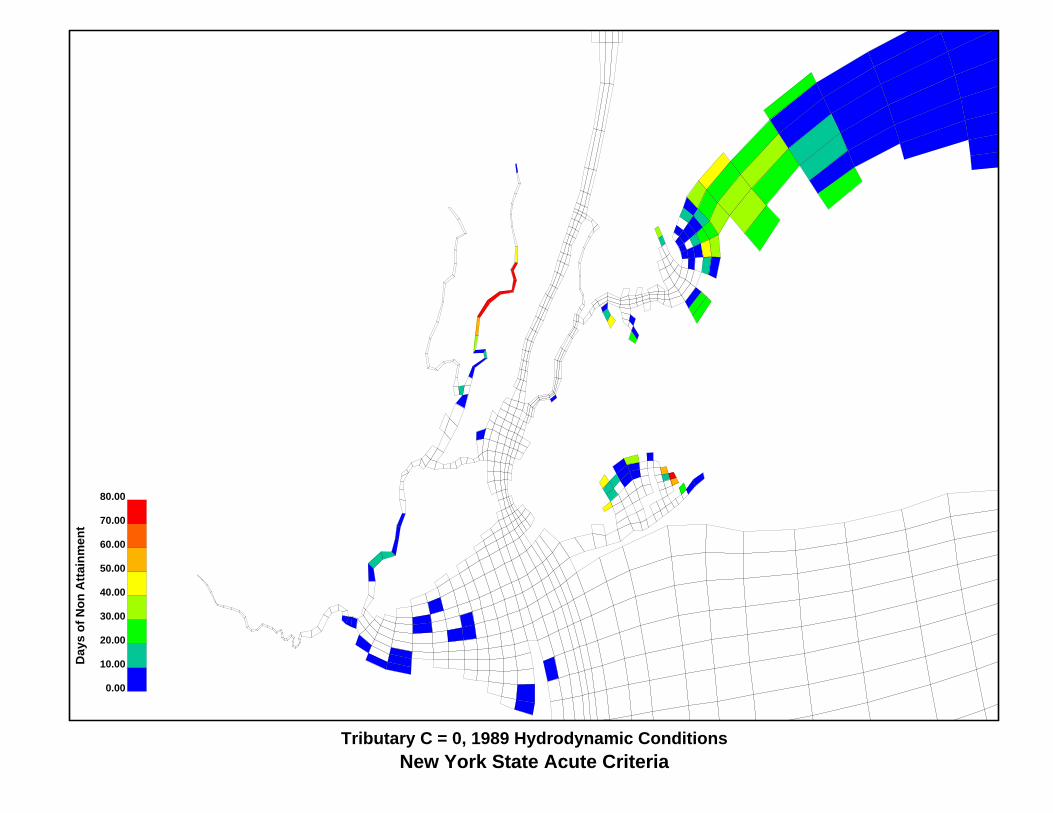
APPENDIX J
DO DAYS OF NON-ATTAINMENT MAPS
UNDER 100% TRIBUTARY CARBON REDUCTION
0.00
10.00
20.00
30.00
40.00
50.00
60.00
70.00
80.00
Day
s o
f N
on
Att
ain
men
t
Dissolved Oxygen Never Less Than 4.0 (mg/L)Tributary C = 0, 1988 Hydrodynamic Conditions

0.00
10.00
20.00
30.00
40.00
50.00
60.00
70.00
80.00
Day
s o
f N
on
Att
ain
men
t
Dissolved Oxygen 24 Hour average Never Less Than 5.0 (mg/L)Tributary C = 0, 1988 Hydrodynamic Conditions

0.00
10.00
20.00
30.00
40.00
50.00
60.00
70.00
80.00
Day
s o
f N
on
Att
ain
men
t
New York State Chronic CriteriaTributary C = 0, 1988 Hydrodynamic Conditions

0.00
10.00
20.00
30.00
40.00
50.00
60.00
70.00
80.00
Day
s o
f N
on
Att
ain
men
t
New York State Acute CriteriaTributary C = 0, 1988 Hydrodynamic Conditions
0.00
10.00
20.00
30.00
40.00
50.00
60.00
70.00
80.00
Day
s o
f N
on
Att
ain
men
t
Dissolved Oxygen Never Less Than 4.0 (mg/L)Tributary C = 0, 1989 Hydrodynamic Conditions

0.00
10.00
20.00
30.00
40.00
50.00
60.00
70.00
80.00
Day
s o
f N
on
Att
ain
men
t
Dissolved Oxygen 24 Hour average Never Less Than 5.0 (mg/L)Tributary C = 0, 1989 Hydrodynamic Conditions

0.00
10.00
20.00
30.00
40.00
50.00
60.00
70.00
80.00
Day
s o
f N
on
Att
ain
men
t
New York State Chronic CriteriaTributary C = 0, 1989 Hydrodynamic Conditions
0.00
10.00
20.00
30.00
40.00
50.00
60.00
70.00
80.00
Day
s o
f N
on
Att
ain
men
t
New York State Acute CriteriaTributary C = 0, 1989 Hydrodynamic Conditions
HYDRO QUAL, INC.
1200 M ACARTHUR, M AHWAH, N EW JERSEY 07430 T: 201-529-5151 F: 201-529-5728 WWW.HYDROQUAL.COM
APPENDIX K
DO DAYS OF NON-ATTAINMENT MAPS
UNDER 100% OCEAN AND
ATMOSPHERIC NITROGEN REDUCTION

0.00
10.00
20.00
30.00
40.00
50.00
60.00
70.00
80.00
Day
s o
f N
on
Att
ain
men
t
Dissolved Oxygen Never Less Than 4.0 (mg/L)Ocean and ATM N = 0, 1988 Hydrodynamic Conditions

0.00
10.00
20.00
30.00
40.00
50.00
60.00
70.00
80.00
Day
s o
f N
on
Att
ain
men
t
Dissolved Oxygen 24 Hour average Never Less Than 5.0 (mg/L)Ocean and ATM N = 0, 1988 Hydrodynamic Conditions
0.00
10.00
20.00
30.00
40.00
50.00
60.00
70.00
80.00
Day
s o
f N
on
Att
ain
men
t
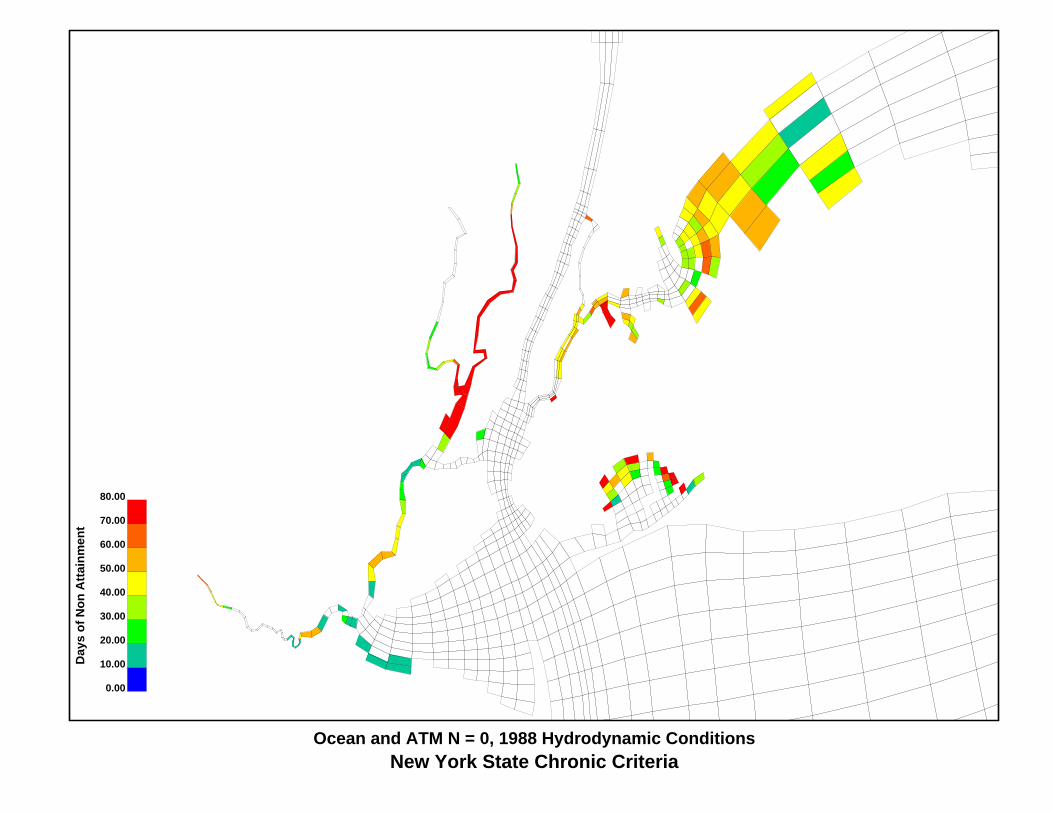
New York State Chronic CriteriaOcean and ATM N = 0, 1988 Hydrodynamic Conditions

0.00
10.00
20.00
30.00
40.00
50.00
60.00
70.00
80.00
Day
s o
f N
on
Att
ain
men
t
New York State Acute CriteriaOcean and ATM N = 0, 1988 Hydrodynamic Conditions
0.00
10.00
20.00
30.00
40.00
50.00
60.00
70.00
80.00
Day
s o
f N
on
Att
ain
men
t
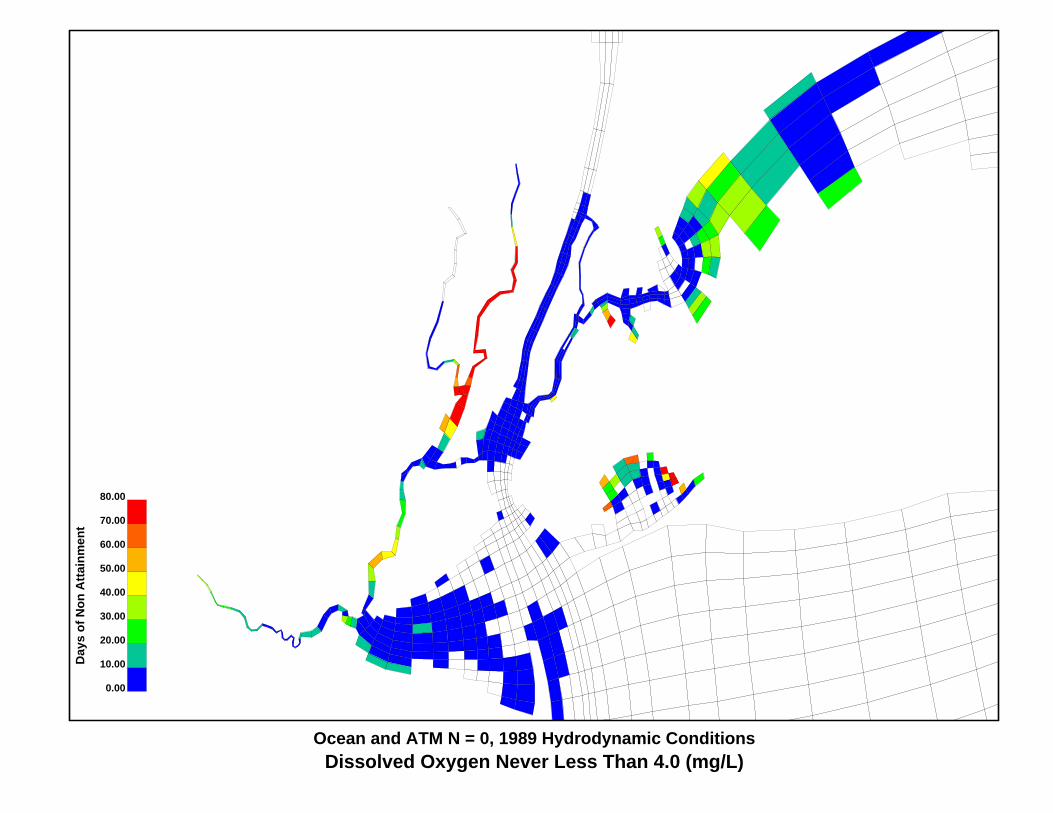
Dissolved Oxygen Never Less Than 4.0 (mg/L)Ocean and ATM N = 0, 1989 Hydrodynamic Conditions

0.00
10.00
20.00
30.00
40.00
50.00
60.00
70.00
80.00
Day
s o
f N
on
Att
ain
men
t
Dissolved Oxygen 24 Hour average Never Less Than 5.0 (mg/L)Ocean and ATM N = 0, 1989 Hydrodynamic Conditions

0.00
10.00
20.00
30.00
40.00
50.00
60.00
70.00
80.00
Day
s o
f N
on
Att
ain
men
t
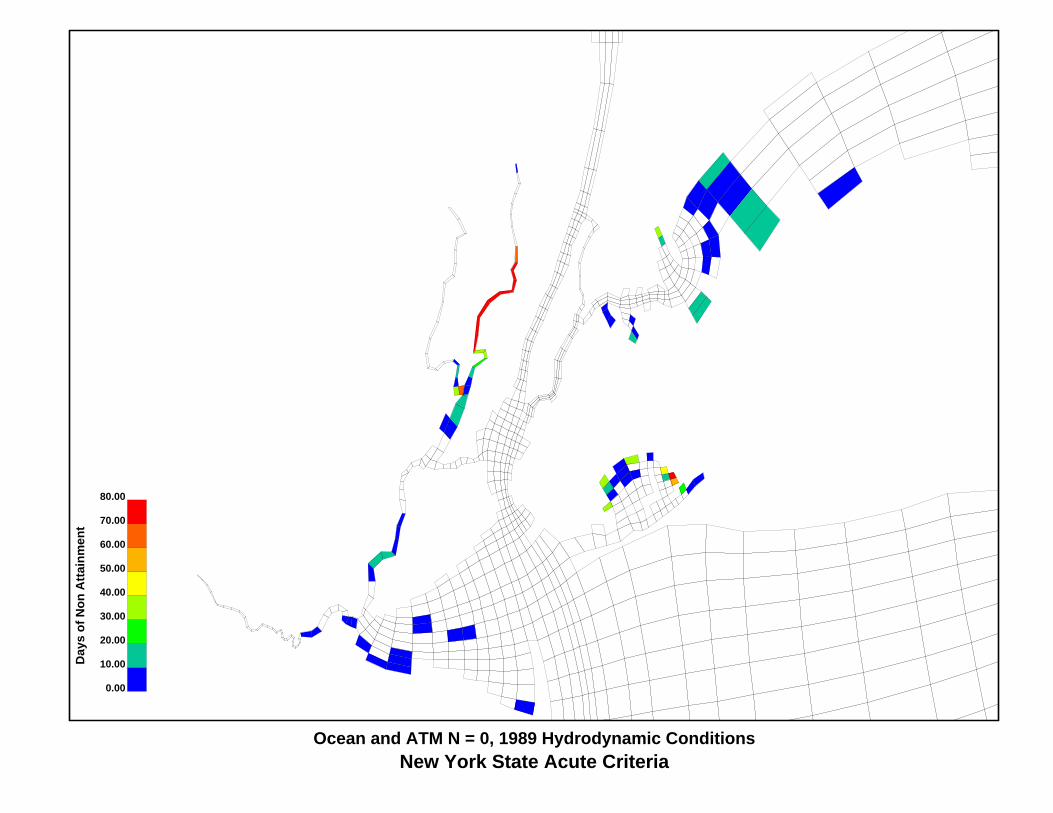
New York State Chronic CriteriaOcean and ATM N = 0, 1989 Hydrodynamic Conditions
0.00
10.00
20.00
30.00
40.00
50.00
60.00
70.00
80.00
Day
s o
f N
on
Att
ain
men
t
New York State Acute CriteriaOcean and ATM N = 0, 1989 Hydrodynamic Conditions

HYDRO QUAL, INC.
1200 M ACARTHUR, M AHWAH, N EW JERSEY 07430 T: 201-529-5151 F: 201-529-5728 WWW.HYDROQUAL.COM
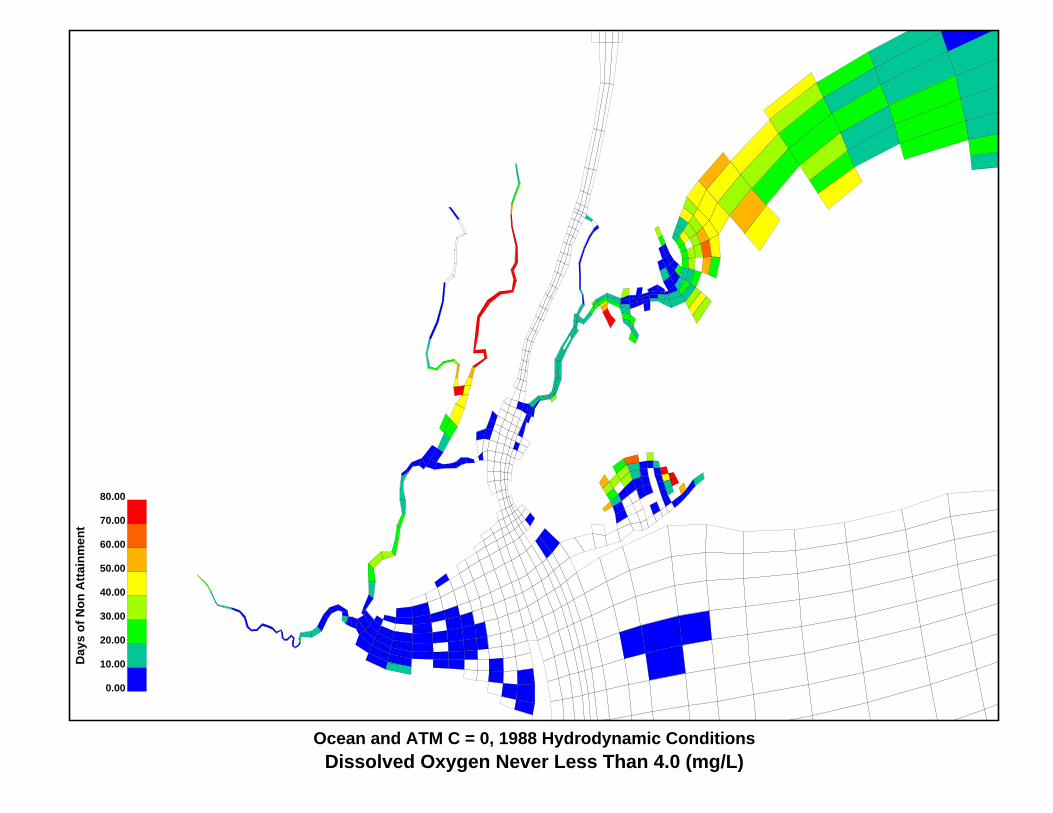
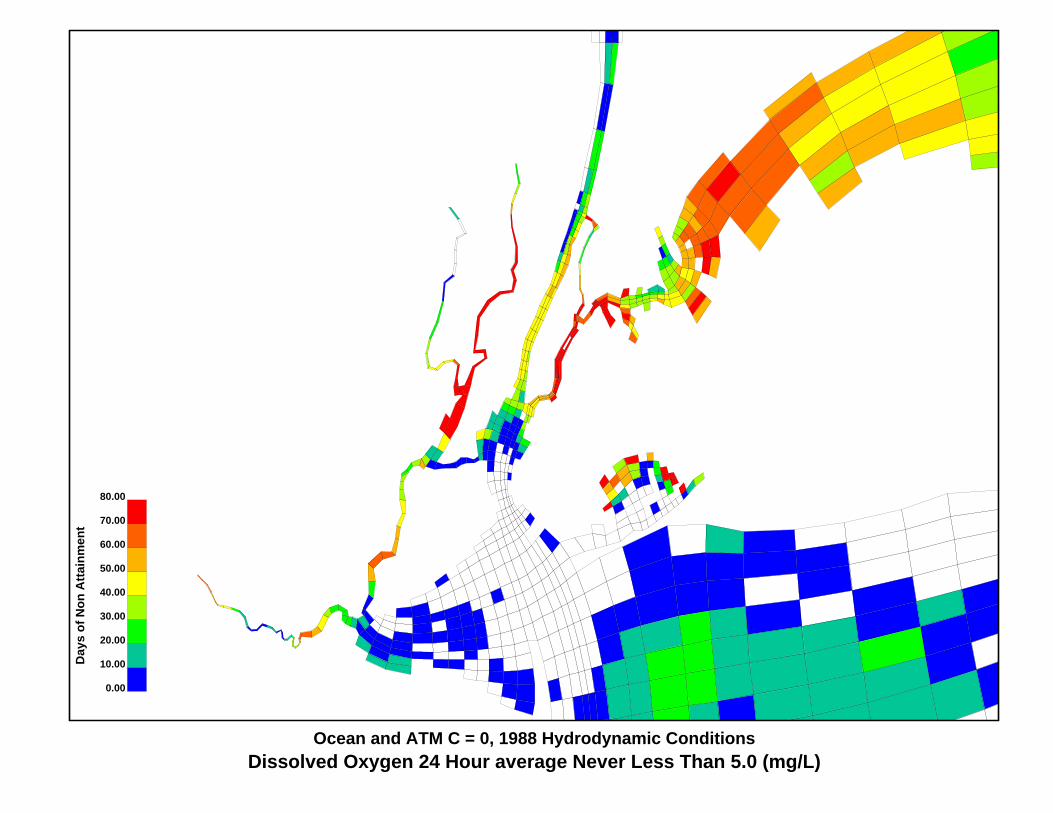
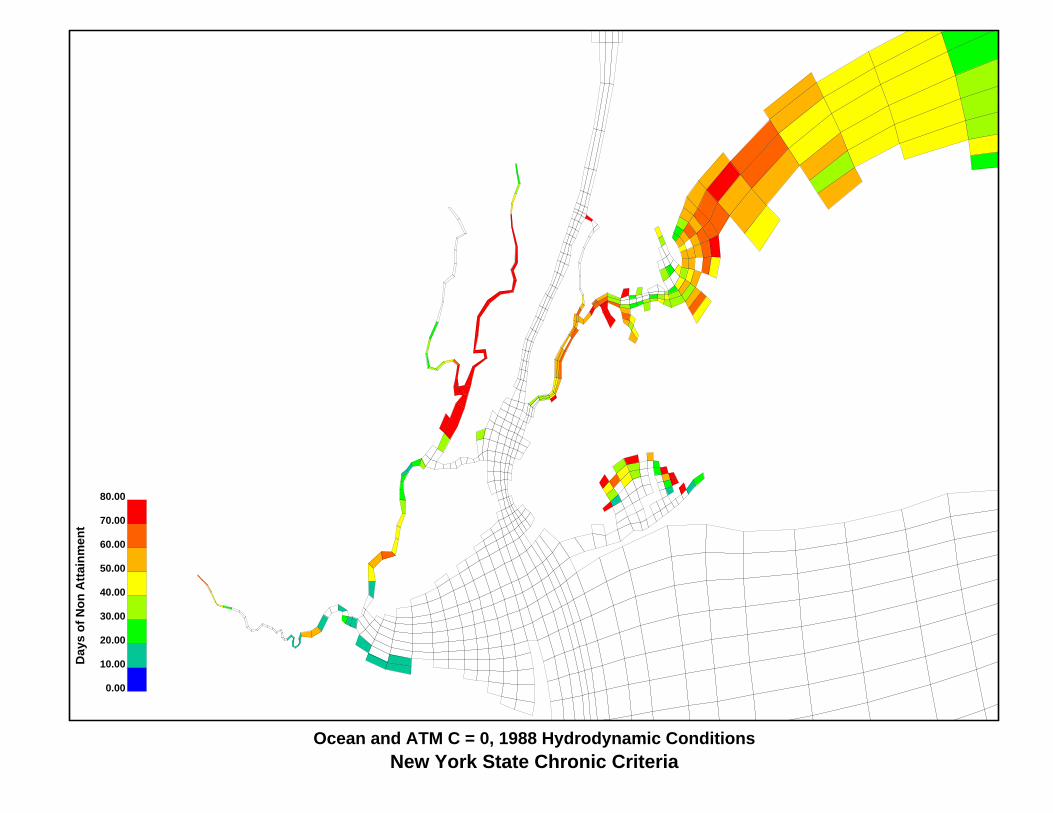
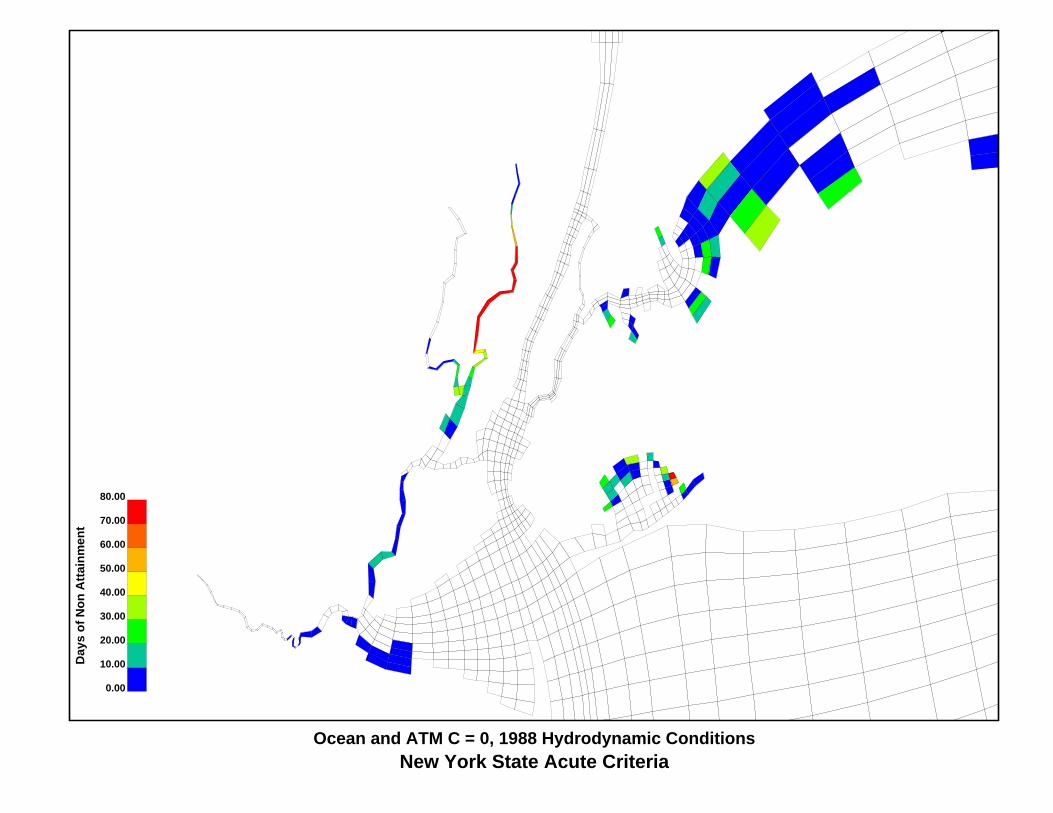
APPENDIX L
DO DAYS OF NON-ATTAINMENT MAPS
UNDER 100% OCEAN AND
ATMOSPHERIC CARBON REDUCTION
0.00
10.00
20.00
30.00
40.00
50.00
60.00
70.00
80.00
Day
s o
f N
on
Att
ain
men
t
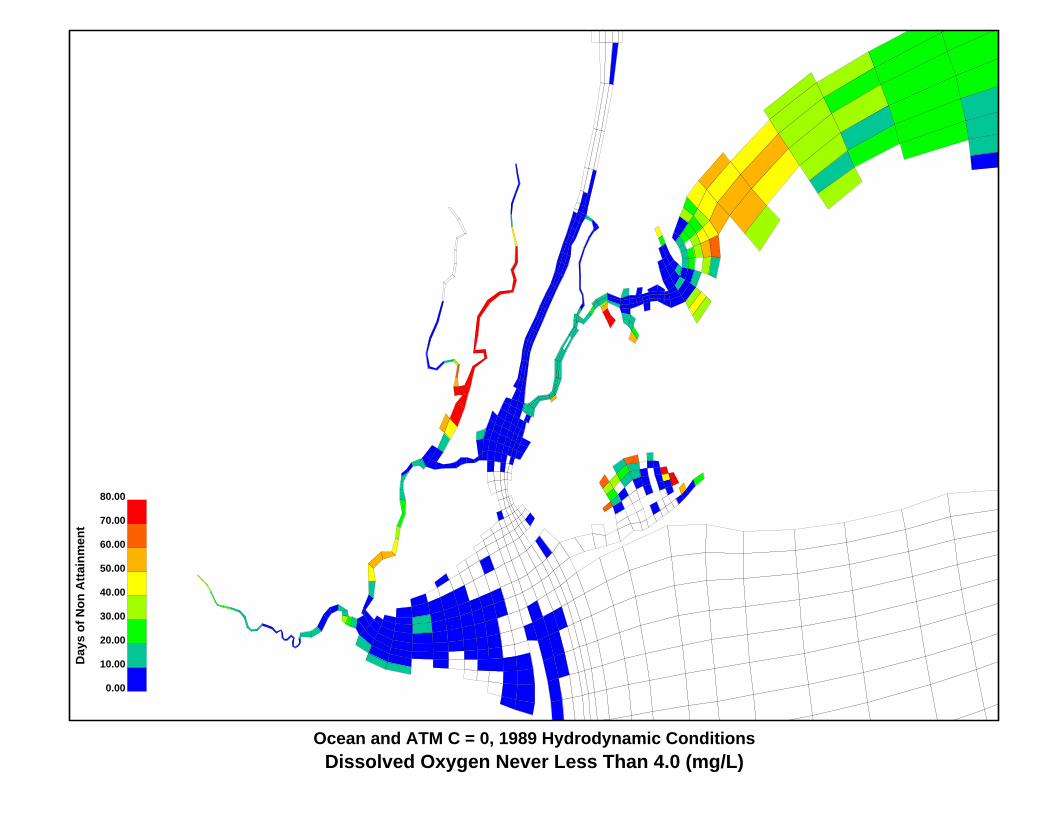
Dissolved Oxygen Never Less Than 4.0 (mg/L)Ocean and ATM C = 0, 1988 Hydrodynamic Conditions
0.00
10.00
20.00
30.00
40.00
50.00
60.00
70.00
80.00
Day
s o
f N
on
Att
ain
men
t
Dissolved Oxygen 24 Hour average Never Less Than 5.0 (mg/L)Ocean and ATM C = 0, 1988 Hydrodynamic Conditions
0.00
10.00
20.00
30.00
40.00
50.00
60.00
70.00
80.00
Day
s o
f N
on
Att
ain
men
t
New York State Chronic CriteriaOcean and ATM C = 0, 1988 Hydrodynamic Conditions
0.00
10.00
20.00
30.00
40.00
50.00
60.00
70.00
80.00
Day
s o
f N
on
Att
ain
men
t
New York State Acute CriteriaOcean and ATM C = 0, 1988 Hydrodynamic Conditions
0.00
10.00
20.00
30.00
40.00
50.00
60.00
70.00
80.00
Day
s o
f N
on
Att
ain
men
t
Dissolved Oxygen Never Less Than 4.0 (mg/L)Ocean and ATM C = 0, 1989 Hydrodynamic Conditions
0.00
10.00
20.00
30.00
40.00
50.00
60.00
70.00
80.00
Day
s o
f N
on
Att
ain
men
t
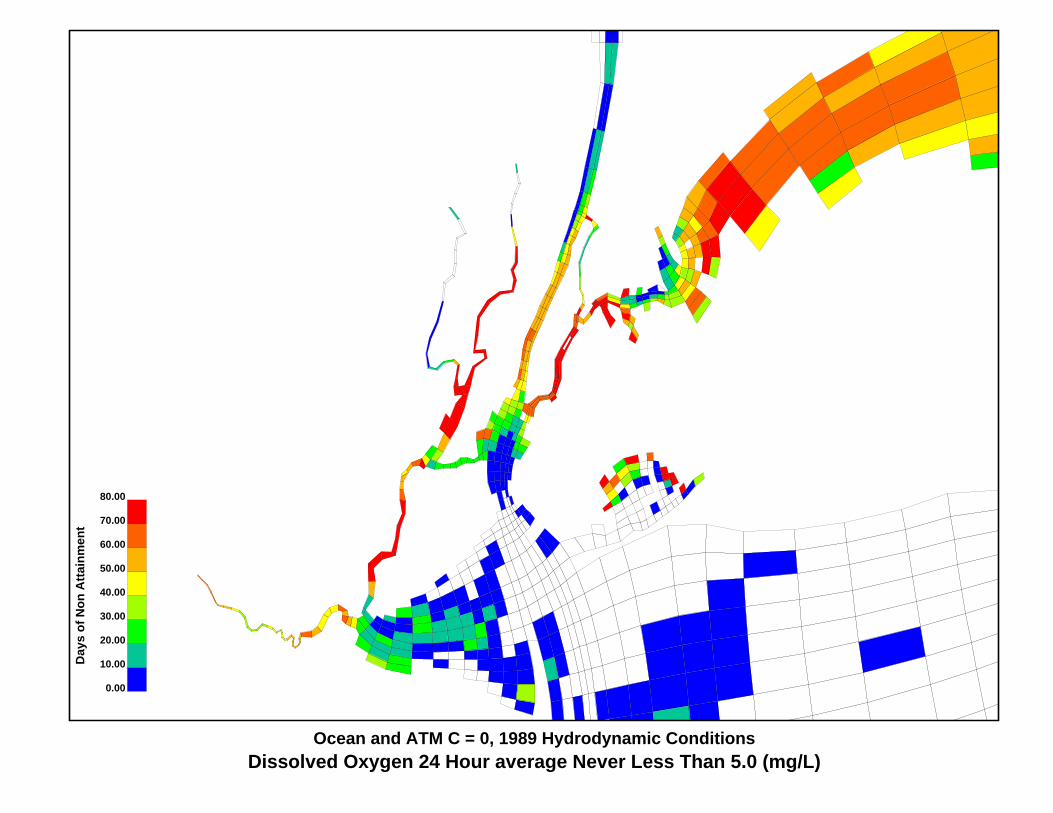
Dissolved Oxygen 24 Hour average Never Less Than 5.0 (mg/L)Ocean and ATM C = 0, 1989 Hydrodynamic Conditions
0.00
10.00
20.00
30.00
40.00
50.00
60.00
70.00
80.00
Day
s o
f N
on
Att
ain
men
t
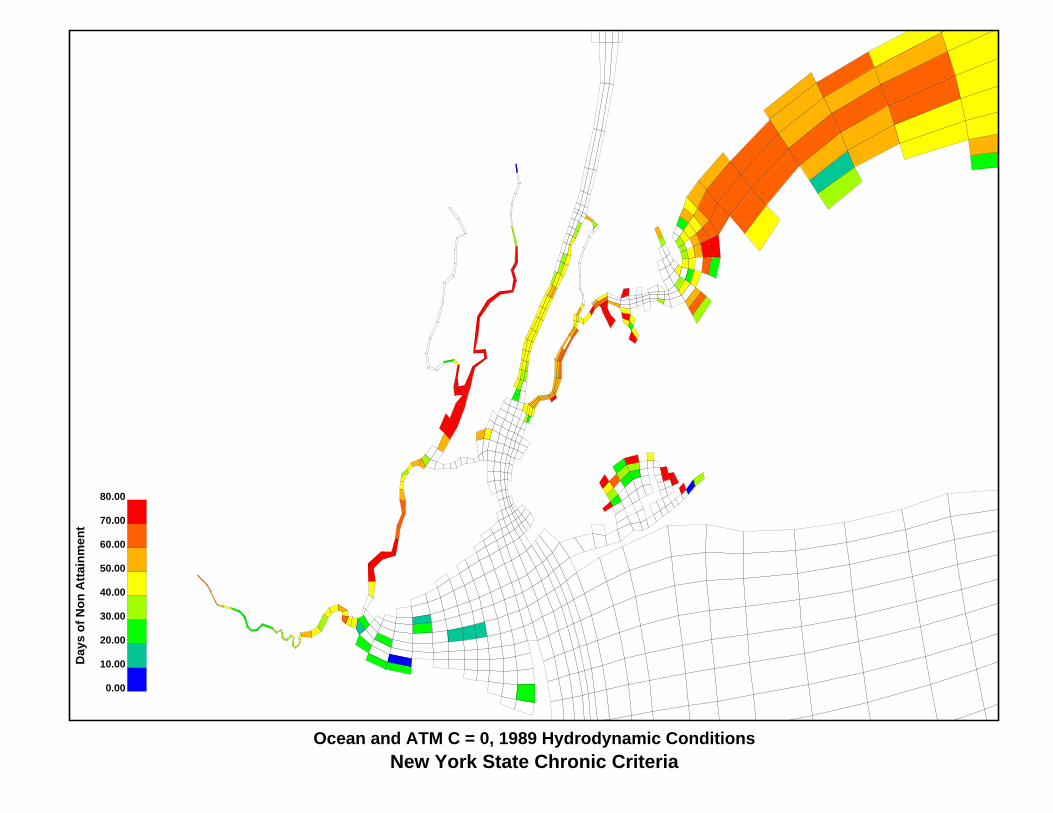
New York State Chronic CriteriaOcean and ATM C = 0, 1989 Hydrodynamic Conditions

0.00
10.00
20.00
30.00
40.00
50.00
60.00
70.00
80.00
Day
s o
f N
on
Att
ain
men
t
New York State Acute CriteriaOcean and ATM C = 0, 1989 Hydrodynamic Conditions

HYDRO QUAL, INC.
1200 M ACARTHUR, M AHWAH, N EW JERSEY 07430 T: 201-529-5151 F: 201-529-5728 WWW.HYDROQUAL.COM
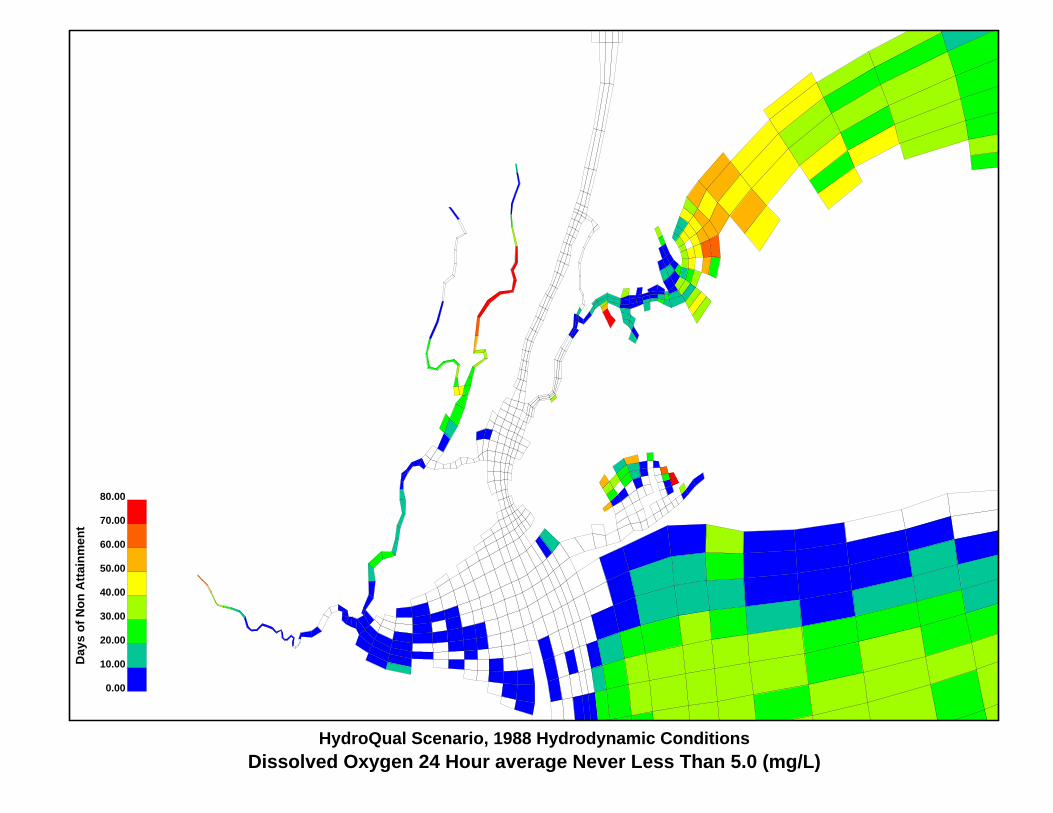
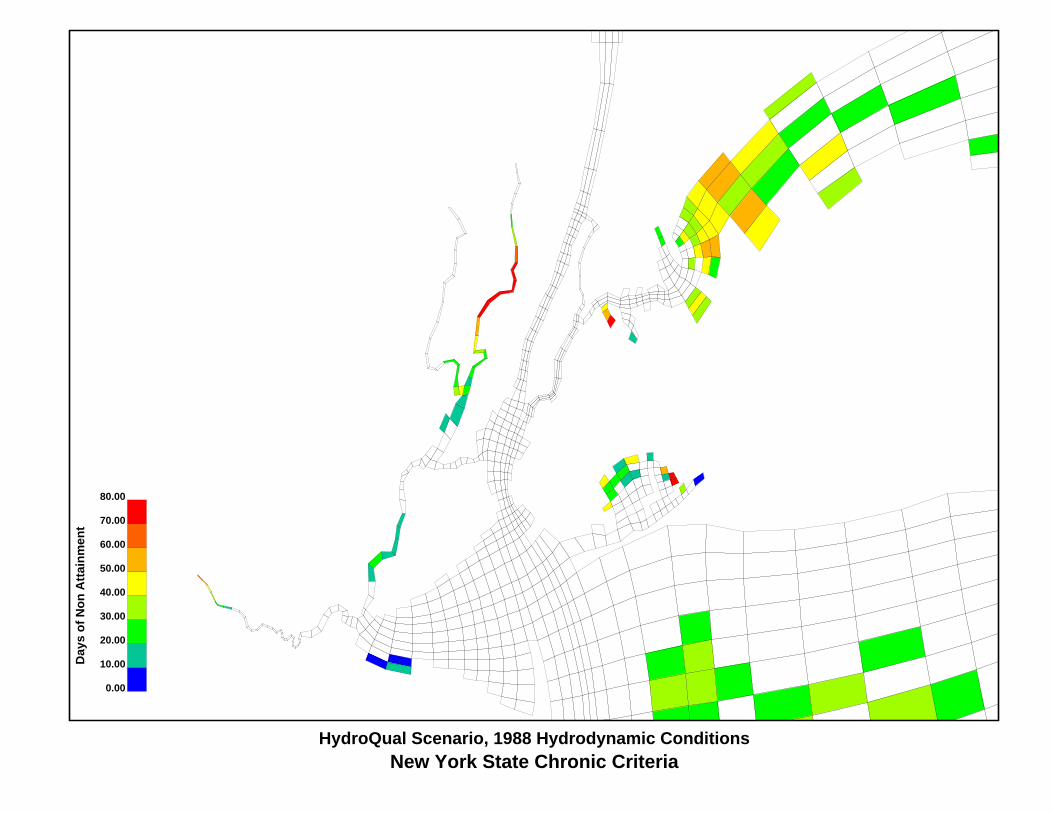
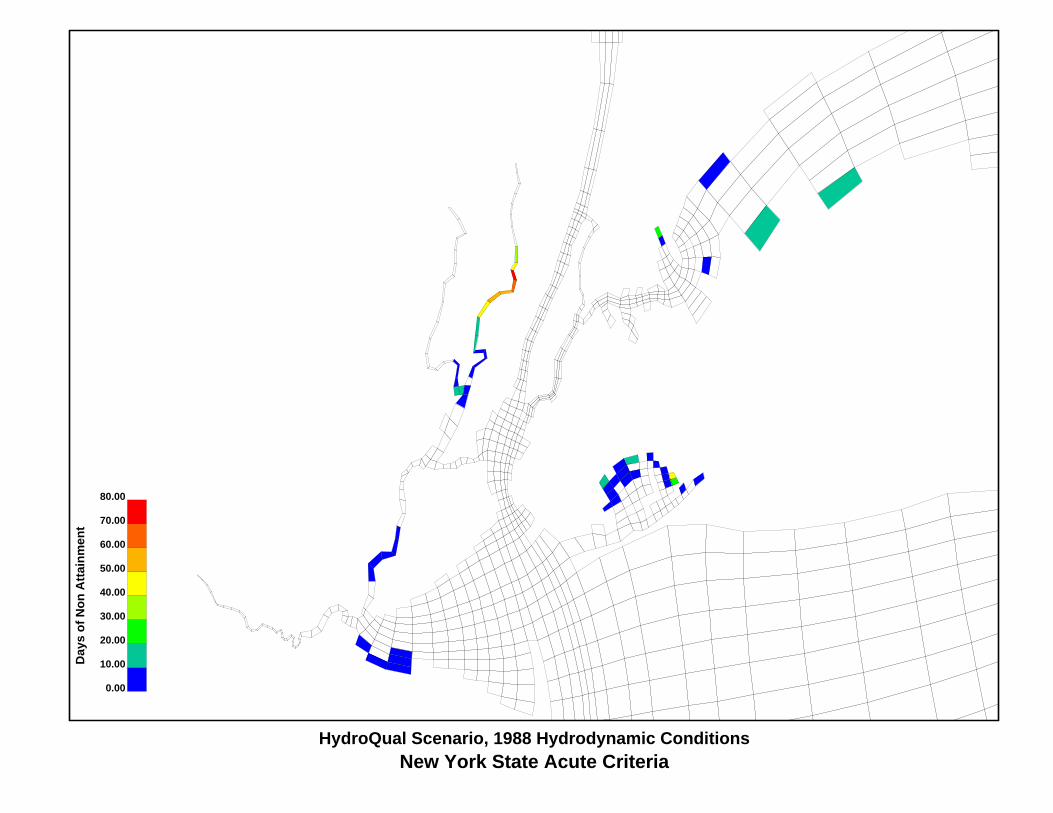
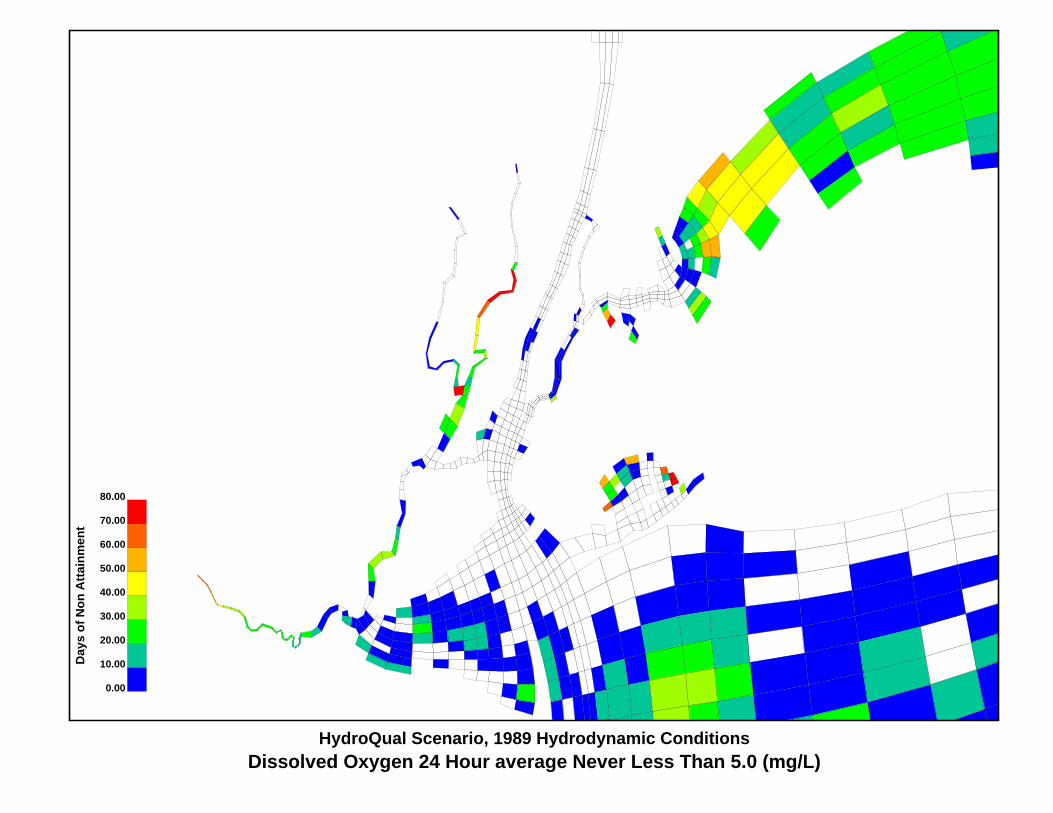
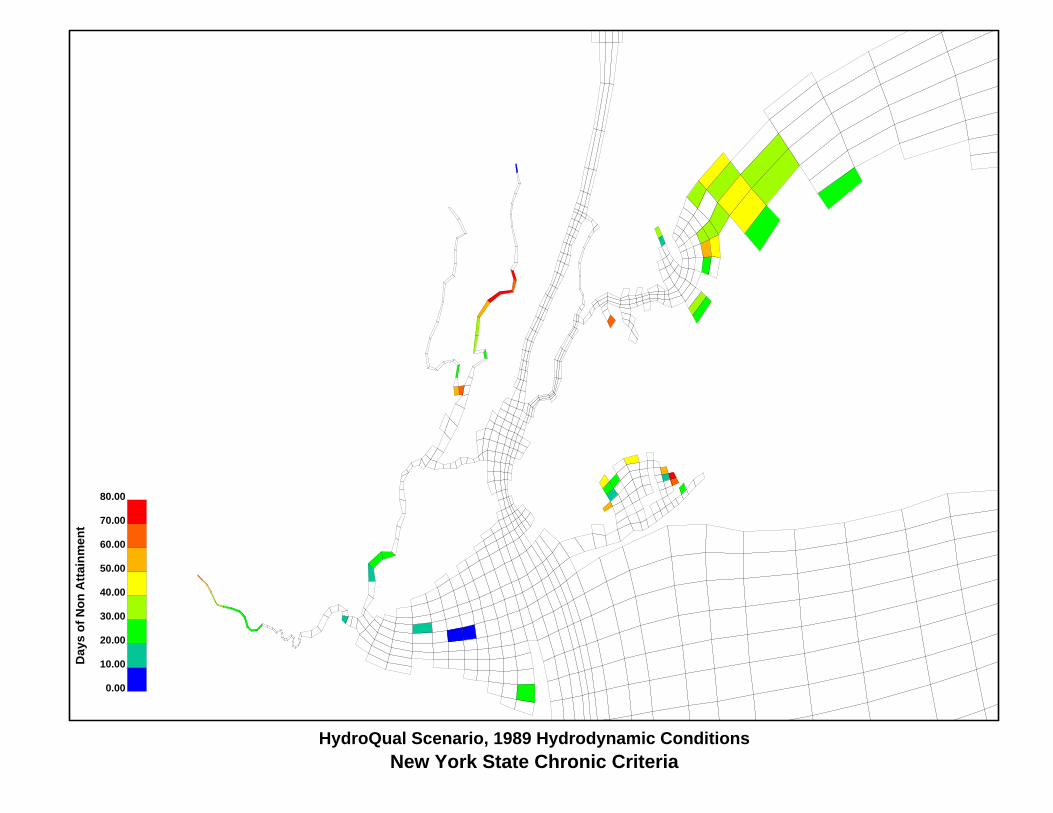
APPENDIX M
DO DAYS OF NON-ATTAINMENT MAPS
UNDER SCENARIO NITROGEN AND CARBON REDUCTIONS
0.00
10.00
20.00
30.00
40.00
50.00
60.00
70.00
80.00
Day
s o
f N
on
Att
ain
men
t
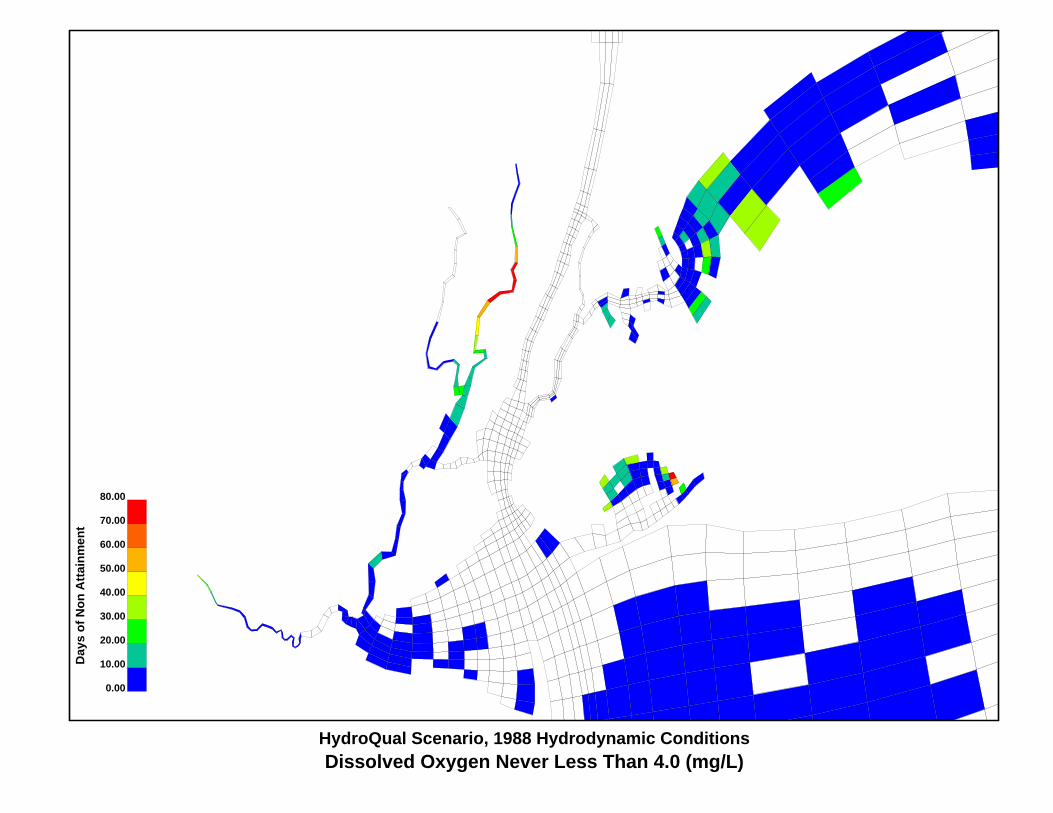
Dissolved Oxygen Never Less Than 4.0 (mg/L)HydroQual Scenario, 1988 Hydrodynamic Conditions
0.00
10.00
20.00
30.00
40.00
50.00
60.00
70.00
80.00
Day
s o
f N
on
Att
ain
men
t
Dissolved Oxygen 24 Hour average Never Less Than 5.0 (mg/L)HydroQual Scenario, 1988 Hydrodynamic Conditions
0.00
10.00
20.00
30.00
40.00
50.00
60.00
70.00
80.00
Day
s o
f N
on
Att
ain
men
t
New York State Chronic CriteriaHydroQual Scenario, 1988 Hydrodynamic Conditions
0.00
10.00
20.00
30.00
40.00
50.00
60.00
70.00
80.00
Day
s o
f N
on
Att
ain
men
t
New York State Acute CriteriaHydroQual Scenario, 1988 Hydrodynamic Conditions

0.00
10.00
20.00
30.00
40.00
50.00
60.00
70.00
80.00
Day
s o
f N
on
Att
ain
men
t
Dissolved Oxygen Never Less Than 4.0 (mg/L)HydroQual Scenario, 1989 Hydrodynamic Conditions
0.00
10.00
20.00
30.00
40.00
50.00
60.00
70.00
80.00
Day
s o
f N
on
Att
ain
men
t
Dissolved Oxygen 24 Hour average Never Less Than 5.0 (mg/L)HydroQual Scenario, 1989 Hydrodynamic Conditions
0.00
10.00
20.00
30.00
40.00
50.00
60.00
70.00
80.00
Day
s o
f N
on
Att
ain
men
t
New York State Chronic CriteriaHydroQual Scenario, 1989 Hydrodynamic Conditions

0.00
10.00
20.00
30.00
40.00
50.00
60.00
70.00
80.00
Day
s o
f N
on
Att
ain
men
t
New York State Acute CriteriaHydroQual Scenario, 1989 Hydrodynamic Conditions

HYDRO QUAL, INC.
1200 M ACARTHUR, M AHWAH, N EW JERSEY 07430 T: 201-529-5151 F: 201-529-5728 WWW.HYDROQUAL.COM
APPENDIX N
DO BENEFIT CURVES
FOR NITROGEN REDUCTIONS

Total Nitrogen Removal Cost Benefit for the Hudson River MZ
0.00
0.50
1.00
1.50
2.00
2.50
3.00
3.50
4.00
4.50
5.00
5.50
6.00
Min
imu
m 2
4-h
r A
vera
ge
DO
(m
g/L
)Regional Average
Basecase CAIR PS30% PS60% PS80% PS80% + CAIR+10%
0.00
0.50
1.00
1.50
2.00
2.50
3.00
3.50
4.00
4.50
5.00
5.50
6.00
Min
imu
m 2
4-h
r A
vera
ge
DO
(m
g/L
)
Worst Grid Cell
Basecase CAIR PS30% PS60% PS80% PS80% + CAIR+10%
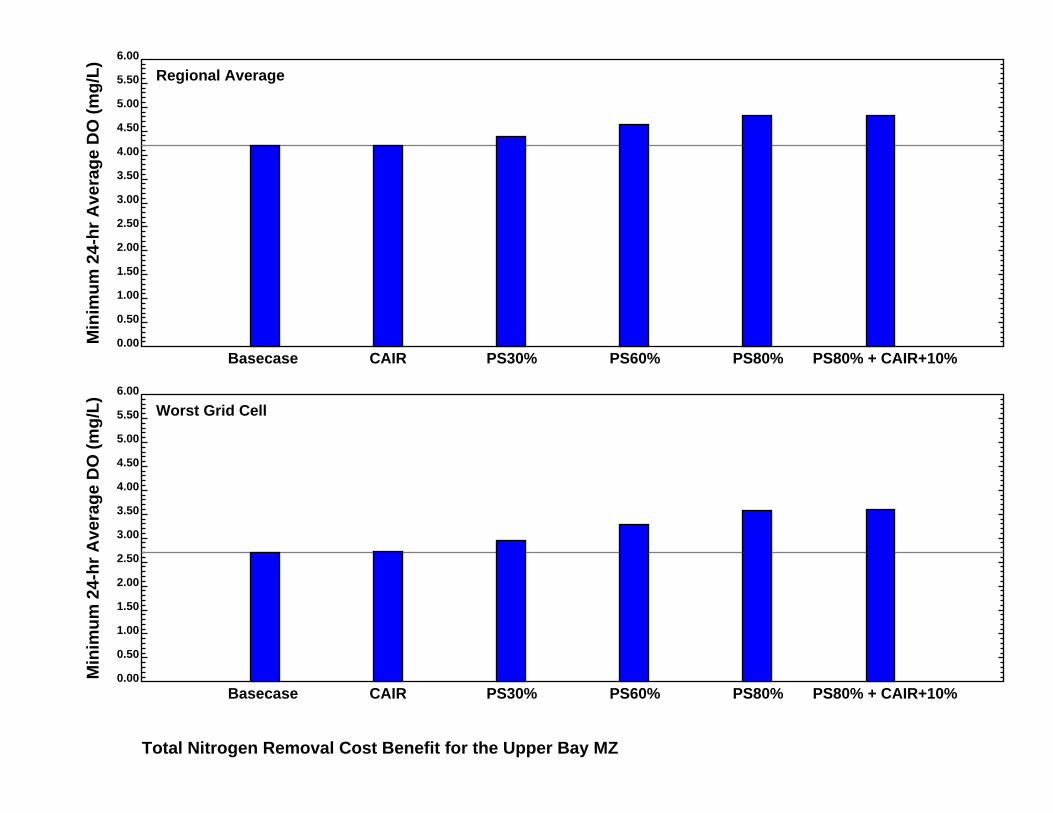
Total Nitrogen Removal Cost Benefit for the Upper Bay MZ
0.00
0.50
1.00
1.50
2.00
2.50
3.00
3.50
4.00
4.50
5.00
5.50
6.00
Min
imu
m 2
4-h
r A
vera
ge
DO
(m
g/L
)Regional Average
Basecase CAIR PS30% PS60% PS80% PS80% + CAIR+10%
0.00
0.50
1.00
1.50
2.00
2.50
3.00
3.50
4.00
4.50
5.00
5.50
6.00
Min
imu
m 2
4-h
r A
vera
ge
DO
(m
g/L
)
Worst Grid Cell
Basecase CAIR PS30% PS60% PS80% PS80% + CAIR+10%

Total Nitrogen Removal Cost Benefit for the Kill Van Kull MZ
0.00
0.50
1.00
1.50
2.00
2.50
3.00
3.50
4.00
4.50
5.00
5.50
6.00
Min
imu
m 2
4-h
r A
vera
ge
DO
(m
g/L
)Regional Average
Basecase CAIR PS30% PS60% PS80% PS80% + CAIR+10%
0.00
0.50
1.00
1.50
2.00
2.50
3.00
3.50
4.00
4.50
5.00
5.50
6.00
Min
imu
m 2
4-h
r A
vera
ge
DO
(m
g/L
)
Worst Grid Cell
Basecase CAIR PS30% PS60% PS80% PS80% + CAIR+10%

Total Nitrogen Removal Cost Benefit for the Hackensack River MZ
0.00
0.50
1.00
1.50
2.00
2.50
3.00
3.50
4.00
4.50
5.00
5.50
6.00
Min
imu
m 2
4-h
r A
vera
ge
DO
(m
g/L
)Regional Average
Basecase CAIR PS30% PS60% PS80% PS80% + CAIR+10%
0.00
0.50
1.00
1.50
2.00
2.50
3.00
3.50
4.00
4.50
5.00
5.50
6.00
Min
imu
m 2
4-h
r A
vera
ge
DO
(m
g/L
)
Worst Grid Cell
Basecase CAIR PS30% PS60% PS80% PS80% + CAIR+10%
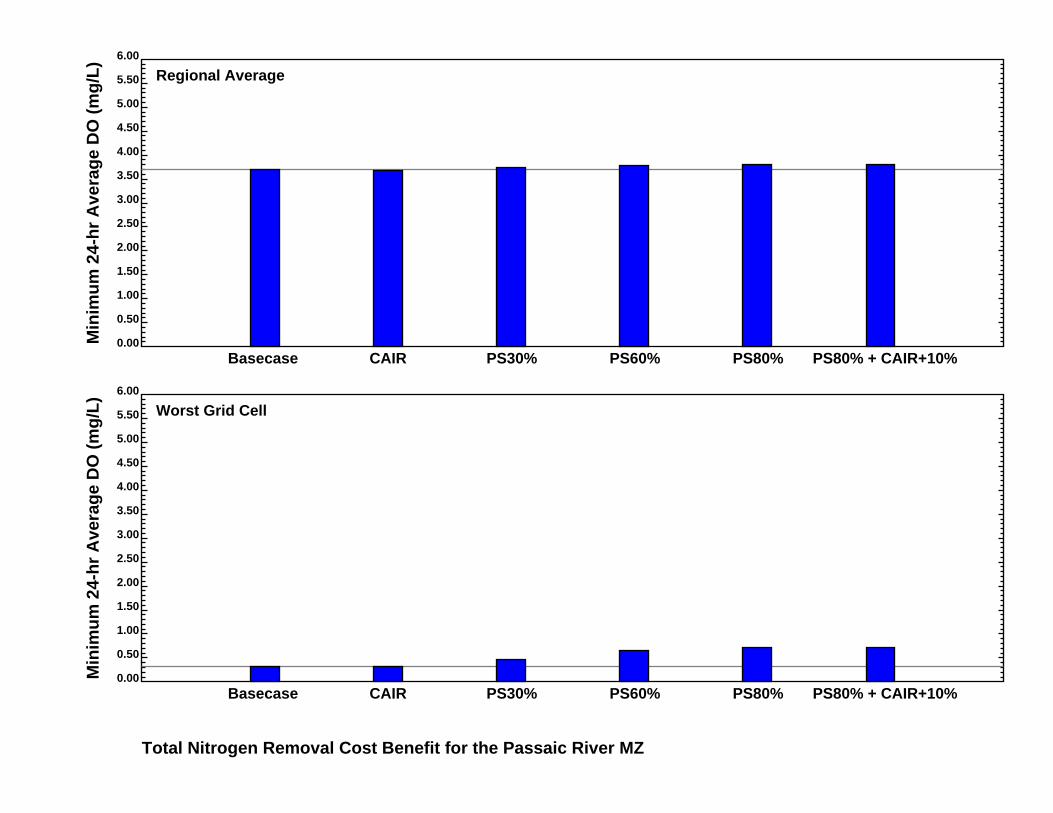
Total Nitrogen Removal Cost Benefit for the Passaic River MZ
0.00
0.50
1.00
1.50
2.00
2.50
3.00
3.50
4.00
4.50
5.00
5.50
6.00
Min
imu
m 2
4-h
r A
vera
ge
DO
(m
g/L
)Regional Average
Basecase CAIR PS30% PS60% PS80% PS80% + CAIR+10%
0.00
0.50
1.00
1.50
2.00
2.50
3.00
3.50
4.00
4.50
5.00
5.50
6.00
Min
imu
m 2
4-h
r A
vera
ge
DO
(m
g/L
)
Worst Grid Cell
Basecase CAIR PS30% PS60% PS80% PS80% + CAIR+10%
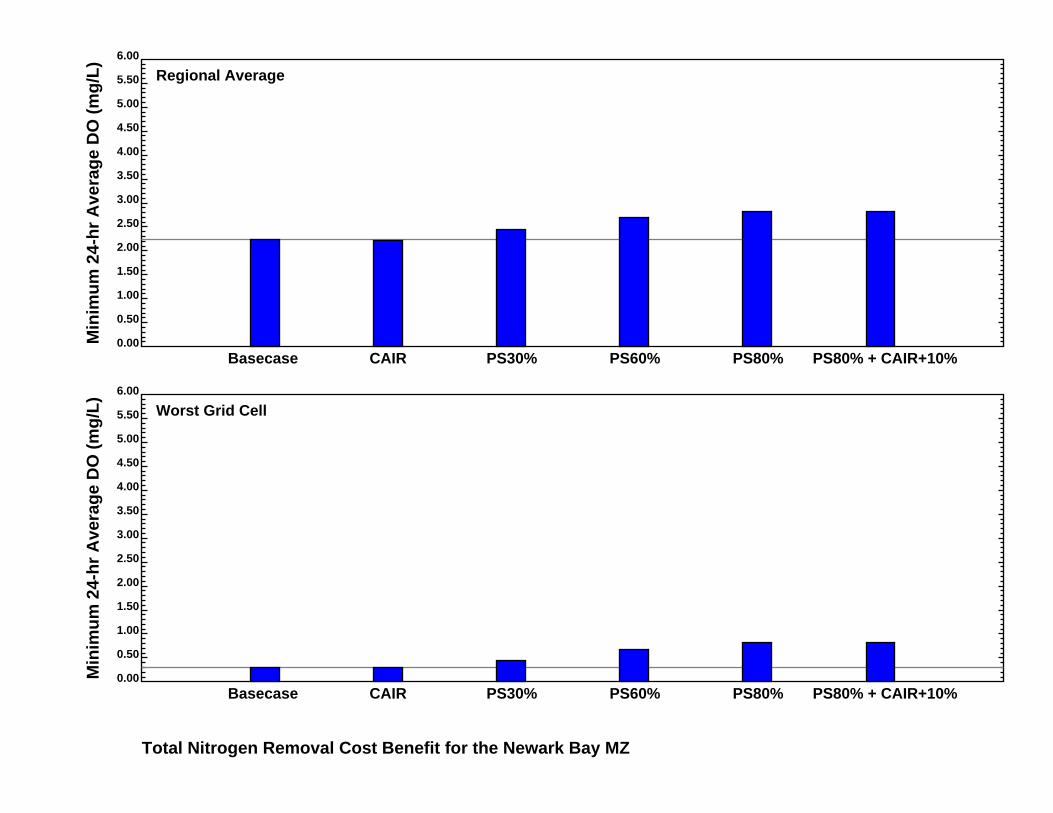
Total Nitrogen Removal Cost Benefit for the Newark Bay MZ
0.00
0.50
1.00
1.50
2.00
2.50
3.00
3.50
4.00
4.50
5.00
5.50
6.00
Min
imu
m 2
4-h
r A
vera
ge
DO
(m
g/L
)Regional Average
Basecase CAIR PS30% PS60% PS80% PS80% + CAIR+10%
0.00
0.50
1.00
1.50
2.00
2.50
3.00
3.50
4.00
4.50
5.00
5.50
6.00
Min
imu
m 2
4-h
r A
vera
ge
DO
(m
g/L
)
Worst Grid Cell
Basecase CAIR PS30% PS60% PS80% PS80% + CAIR+10%

Total Nitrogen Removal Cost Benefit for the Arthur Kill MZ
0.00
0.50
1.00
1.50
2.00
2.50
3.00
3.50
4.00
4.50
5.00
5.50
6.00
Min
imu
m 2
4-h
r A
vera
ge
DO
(m
g/L
)Regional Average
Basecase CAIR PS30% PS60% PS80% PS80% + CAIR+10%
0.00
0.50
1.00
1.50
2.00
2.50
3.00
3.50
4.00
4.50
5.00
5.50
6.00
Min
imu
m 2
4-h
r A
vera
ge
DO
(m
g/L
)
Worst Grid Cell
Basecase CAIR PS30% PS60% PS80% PS80% + CAIR+10%
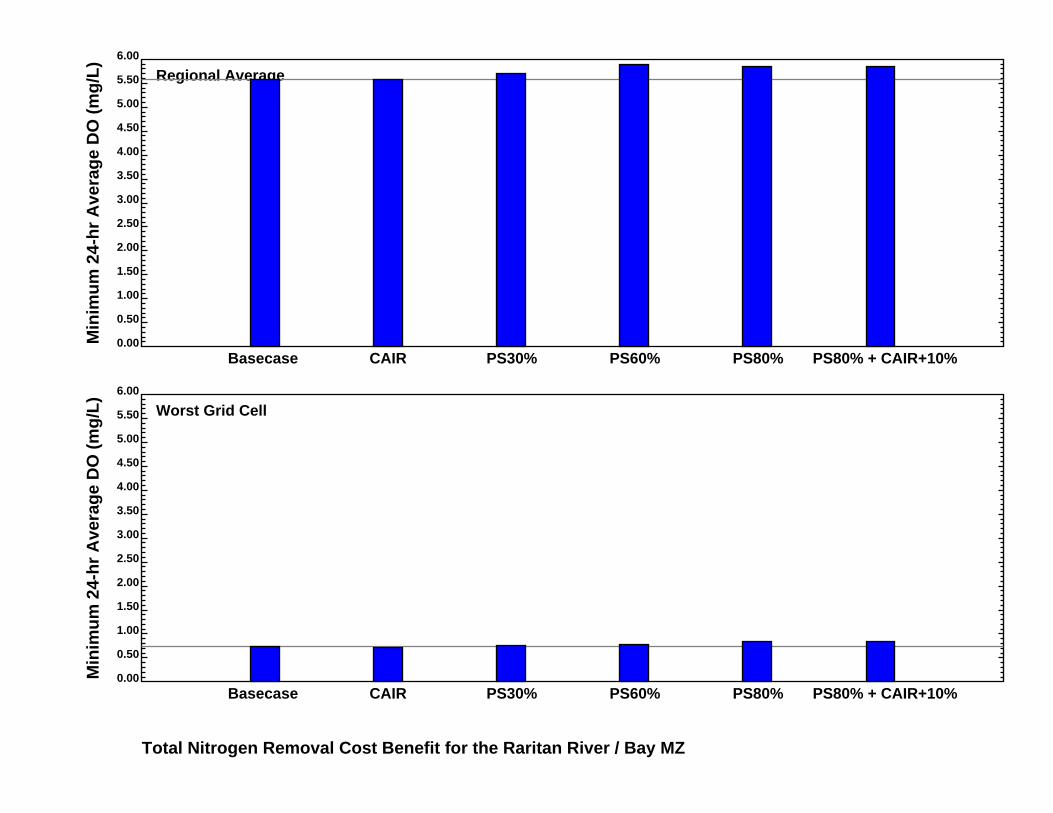
Total Nitrogen Removal Cost Benefit for the Raritan River / Bay MZ
0.00
0.50
1.00
1.50
2.00
2.50
3.00
3.50
4.00
4.50
5.00
5.50
6.00
Min
imu
m 2
4-h
r A
vera
ge
DO
(m
g/L
)Regional Average
Basecase CAIR PS30% PS60% PS80% PS80% + CAIR+10%
0.00
0.50
1.00
1.50
2.00
2.50
3.00
3.50
4.00
4.50
5.00
5.50
6.00
Min
imu
m 2
4-h
r A
vera
ge
DO
(m
g/L
)
Worst Grid Cell
Basecase CAIR PS30% PS60% PS80% PS80% + CAIR+10%
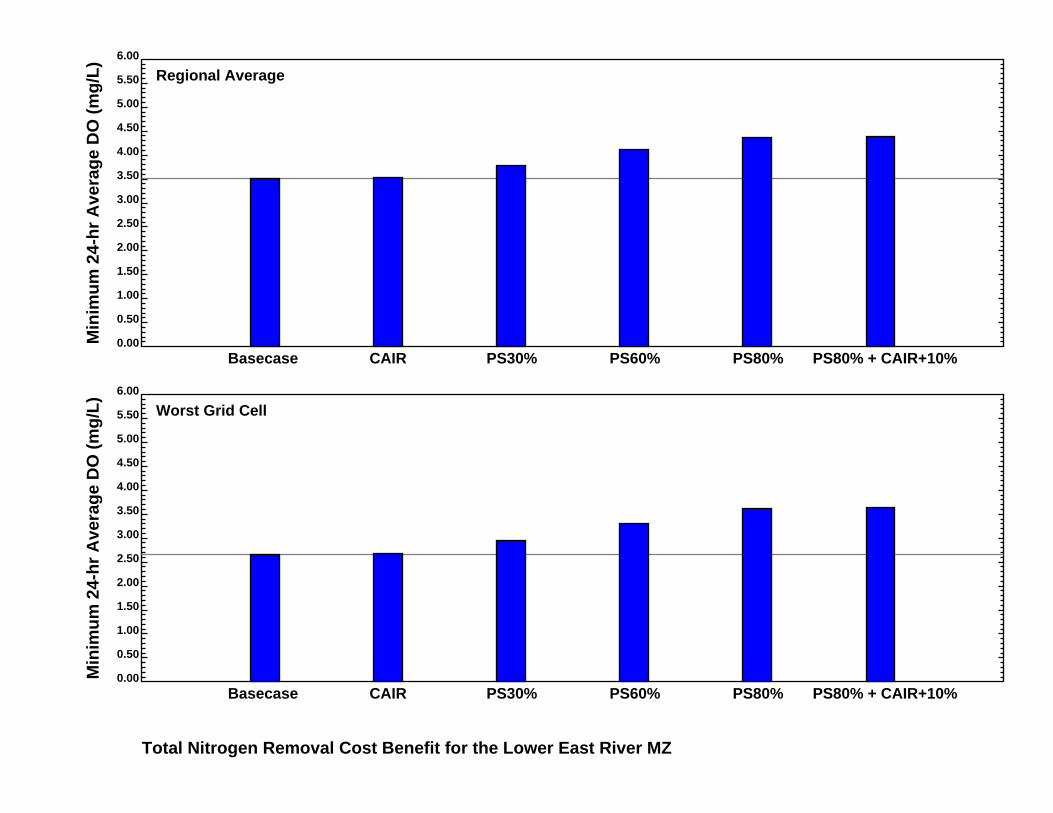
Total Nitrogen Removal Cost Benefit for the Lower East River MZ
0.00
0.50
1.00
1.50
2.00
2.50
3.00
3.50
4.00
4.50
5.00
5.50
6.00
Min
imu
m 2
4-h
r A
vera
ge
DO
(m
g/L
)Regional Average
Basecase CAIR PS30% PS60% PS80% PS80% + CAIR+10%
0.00
0.50
1.00
1.50
2.00
2.50
3.00
3.50
4.00
4.50
5.00
5.50
6.00
Min
imu
m 2
4-h
r A
vera
ge
DO
(m
g/L
)
Worst Grid Cell
Basecase CAIR PS30% PS60% PS80% PS80% + CAIR+10%

Total Nitrogen Removal Cost Benefit for the Upper East River + Harlem River MZ
0.00
0.50
1.00
1.50
2.00
2.50
3.00
3.50
4.00
4.50
5.00
5.50
6.00
Min
imu
m 2
4-h
r A
vera
ge
DO
(m
g/L
)Regional Average
Basecase CAIR PS30% PS60% PS80% PS80% + CAIR+10%
0.00
0.50
1.00
1.50
2.00
2.50
3.00
3.50
4.00
4.50
5.00
5.50
6.00
Min
imu
m 2
4-h
r A
vera
ge
DO
(m
g/L
)
Worst Grid Cell
Basecase CAIR PS30% PS60% PS80% PS80% + CAIR+10%

Total Nitrogen Removal Cost Benefit for the Jamaica Bay MZ
0.00
0.50
1.00
1.50
2.00
2.50
3.00
3.50
4.00
4.50
5.00
5.50
6.00
Min
imu
m 2
4-h
r A
vera
ge
DO
(m
g/L
)Regional Average
Basecase CAIR PS30% PS60% PS80% PS80% + CAIR+10%
0.00
0.50
1.00
1.50
2.00
2.50
3.00
3.50
4.00
4.50
5.00
5.50
6.00
Min
imu
m 2
4-h
r A
vera
ge
DO
(m
g/L
)
Worst Grid Cell
Basecase CAIR PS30% PS60% PS80% PS80% + CAIR+10%