u ltrav iolet degradation study - nasa€¦ · xe lamp was an osram 2500 watt compact arc lamp...
TRANSCRIPT

I
\
I , - I .
! ,' r
U LTRAV IOLET , DEGRADATION
STUDY
GPO PRICE $
CFSTI PRICE@) $ ,
Hard copy (HC)
Microfiche ( M F) ,52) ff 653 July 65
. I
-. SEPTEMBER 1965
I \ -
GODDARD SPACE FLIGHT CENTER GREENBELT, MARYLAND
r
.
https://ntrs.nasa.gov/search.jsp?R=19660001937 2020-07-13T20:11:01+00:00Z

&\ r '
ULTRAVIOLET DEGRADATION STUDY
William T. Bottoms* Malcolm A. Lillywhite*
James J. Webb
Radiometry Group Thermal Systems Branch
Spacecraft Technology Branch
September 19 65
*Taag Designs, Inc. employees a t GSFC - Cont rac t NAS5-2382.
X-713-65-365

ABSTRACT
The effect of irradiation from spectrally differ- ent sources on the optical properties of specimens of coating in atmospheric conditions has been studied. A Hy-Cal* black on aluminum and an evaporated alu- minum on glass were irradiated by a HgXe compact a rc lamp; a Hy-Cal black on aluminum, an evapo- rated aluminum on glass and a platinum neutral den- sity filter , with a protective layer of Si Ox, on glass were exposed to a Xe compact arc lamp. Total en- ergy incident on both groups was approximately the same. Different changes in spectral absorptance were noted on the Hy-Cal samples particularly in the infrared region, and a minor difference in reflectance of the aluminum samples was noted at approximately 250nm. The platinum showed a markedly decrease in transmittance during the first 24 hours in the visi- ble and infrared regions. Thereafter the degradation rate slowed.
The test was conducted over a period of seven weeks and the total exposure time of samples was 1101 hours.
*Hy-Cal Eng ineer ing - Santa Fe Spr ings , C a l i f o r n i a .
iii

. . e.. CONTENTS
Page
I . INTRODUCTION . . . . . . . . . . . . . . . . . . . . . . . . 1
11 . APPARATUS AND METHOD . . . . . . . . . . . . . . . . . . . 1 . 111 . RESULTS . . . . . . . . . . . . . . . . . . . . . . . . . . . 3
IV . DISCUSSION . . . . . . . . . . . . . . . . . . . . . . . . . . 10
V . CONCLUSIONS . . . . . . . . . . . . . . . . . . . . . . . . . 13
Figure
1
2
3
4
5
6
7
8
9
10
11
ILLUSTRATIONS
Degradation Test Set-up . . . . . . . . . . . . . . . . . . . 2 Beckman DK-1 Spectrophotometer Optical Schematic . . . . . . 3
4
5
Absorptance vs . Wavelength Hy-Cal Black (Sample No . 2) . . . . Absorptance vs . Wavelength Hy-Cal Black (Sample No . 3) . . . . Percentage Change (Absorptance) of Hy-Cal Samples . . . . . . 6
Reflectance vs . Wavelength Aluminum (Sample No . 2) . . . . . . Reflectance vs . Wavelength Aluminum (Sample No . 3) . . . . . . Percentage Change (Reflectance) of Aluminum Samples . . . . . 9
Transmittance vs . Wavelength Platinum Sample . . . . . . . . 11
7
8
Reflectance vs . Wavelength Platinum Sample . . . . . . . . . . Photograph of Degradated Hy-Cal Samples . . . . . . . . . . . 13
12
V

, Y
. ULTRAVIOLET DEGRADATION STUDY
I. INTRODUCTION
This experiment was designed to study the degradation characteristics of paints and coatings used in a Spectrolab A-1200 solar simulator* and solar simulation support studies. The solar simulator operates at atmospheric pres- sure. For this reason the testing was conducted in atmospheric conditions closely simulating the conditions experienced in the solar simulator silo. Fur- ther testing will be done in a i r and in vacuum to study the effects of solar sim- ulation anomalies such as spectral distribution and temporal variation in test beam irradiance on spacecraft coatings and thermal models.
11. APPARATUS AND METHOD
The sources were mounted in a large hood partitioned into two parts. The Xe lamp was an Osram 2500 watt compact a rc lamp which was powered by a Westinghouse WS arc lamp power supply; the lamp operated at 30 volts and 85 amps. The HgXe lamp was a Westinghouse 2500 watt compact a r c lamp which was excited by a Christie 3300 watt arc lamp power supply and it operated at 50 volts and 50 amps. The samples were mounted in slide holders on the inside of the front panel approximately 13.inches from the lamp "fireball." Figure 1 shows the physical layout of the test set-up.
.
All reflectance and absorptance measurements were made with a Beckman DK-1 Spectrophotometer, including the reflectance attachment, over the range of 250nm to 2500nm using freshly smoked Mg 0 as a reference. The DK-1 is a single prism double-beam photoelectric ratio recording instrument. The re- flectance attachment uses an integrating sphere coated with Mg 0 in conjunction with a lead sulfide detector or a 1P28 photomultiplier detector. Er ror is *2% for relative measurements. The instrument's optical schematic is shown in Figure 2.
Energy measurements were made with an Eppley model 15 normal incidence pyrheliometer with an estimated accuracy of *3% of calibrated value. It was calibrated with an Angstrom compensated pyrheliometer at Table Mountain, California in 1964. Energy in the ultraviolet region was determined by using
*Thermal Vacuum Solar Simulator, L i 1 lywh i t e , Murray, Lester: GSFC Document X-633-65-332, August 1965.
1

+--- 33-3/4”
-I I
T 13”
MERCURY-XENON LAMP
33-3/4“
XENON LAMP HOUSING 2 EA
12 x 12 IN. LAMP \ /
HOOD UNDER TEST \ ~- SAMPLES
I I
r I I I I
1 1
PYRHELIOMETER ON LATHE BED
Figure 1 . Degradation Test Set-up
2

J
I .- I
\ LIGHT SOURCE
MONOCHROMATOR REFLECTANCE UNlT
MONOCHROMATIC ILLUMINATION LIGHT PATH REPRINTED FROM BECKMAN INSTRUCTION MANUAL 553-A ON THE 24500 REFLECTANCE ATTACHMENT (DK SPECTROPHOTOMETER)
Figure 2. Beckman DK-1 Spectrophotometer Optical Schematic
Corning cutoff filters: number 9-54 with transmission of 93% and cutoff wave- length of 2 3 4 0 i , and number 0-52 with transmission of 92% and a cutoff wave- length of 3575 A. *
The experiment ran continuously although the samples were removed 3 to 4 hours for reflectance measurements every 24 hours.
111. RESULTS
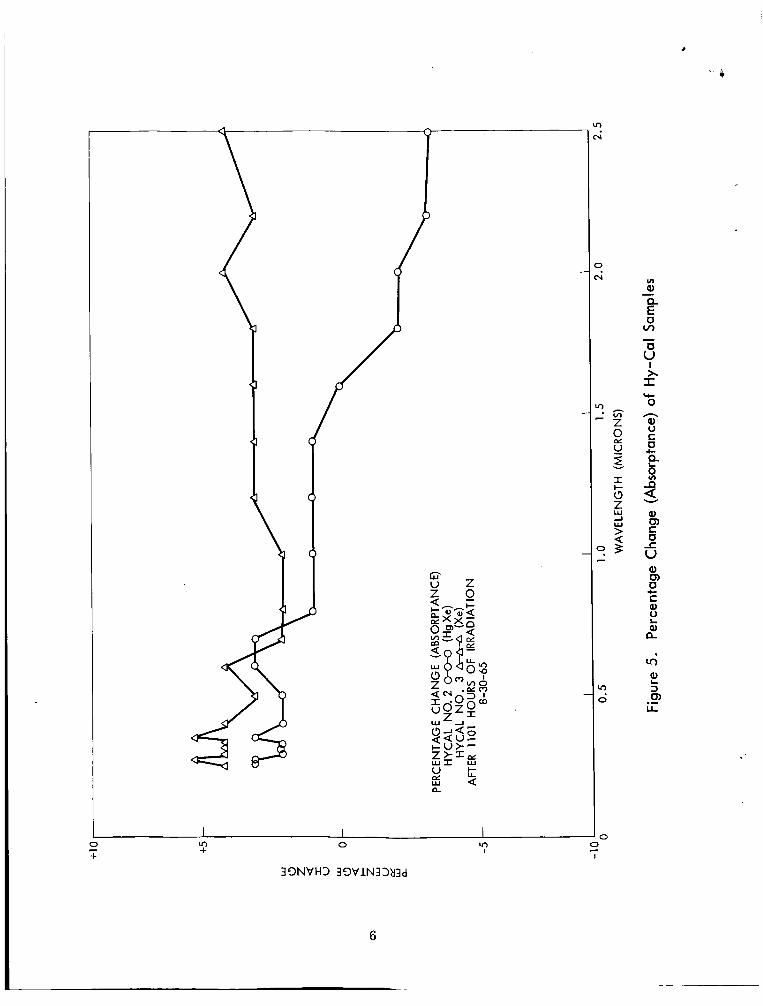
The Hy-Cal block exposed to HgXe showed an overall increase in spectral absorptance as illustrated in Figure 3, while the Hy-Cal exposed to Xe showed a decrease in absorptance in the infrared and an increase in the visible and ultraviolet which is illustrated in Figure 4. The difference in degradation of the two samples is shown in Figure 5. It represents the percentage change from the original values of absorptance.
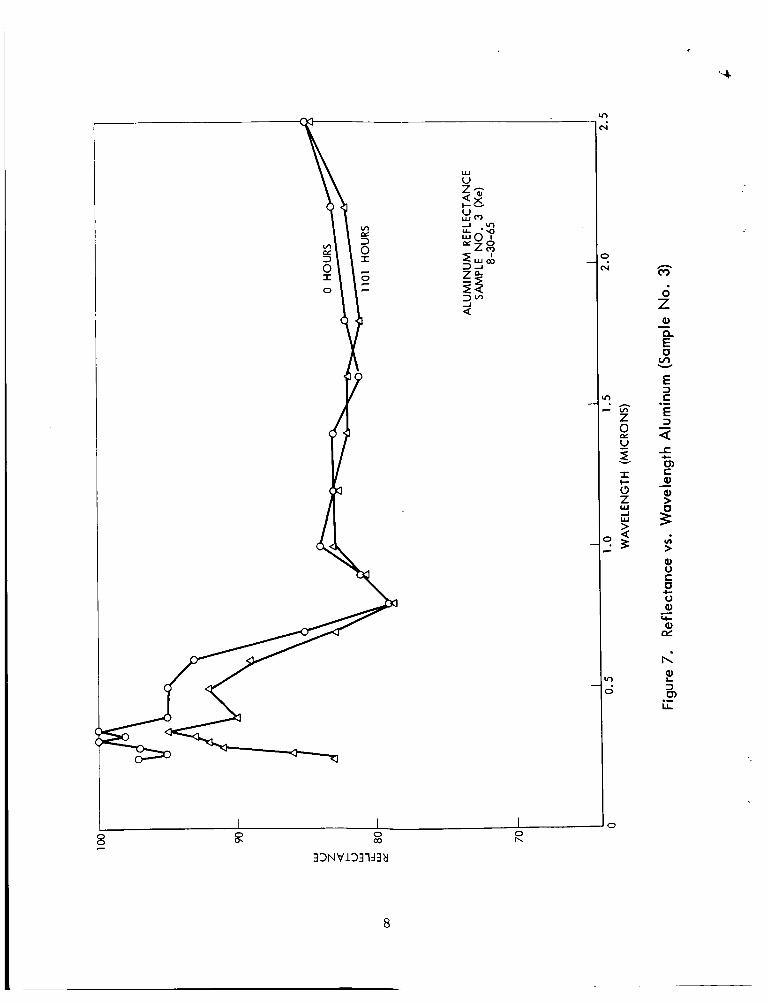
The original values of reflectance for the two aluminum samples are shown in Figures 6 and 7. The greatest change in reflectance i s in the region between 250 nm and 500 nm. The normalized percentages of change a re shown in Fig- ure 8. The only significant difference occurred at 250 nm.
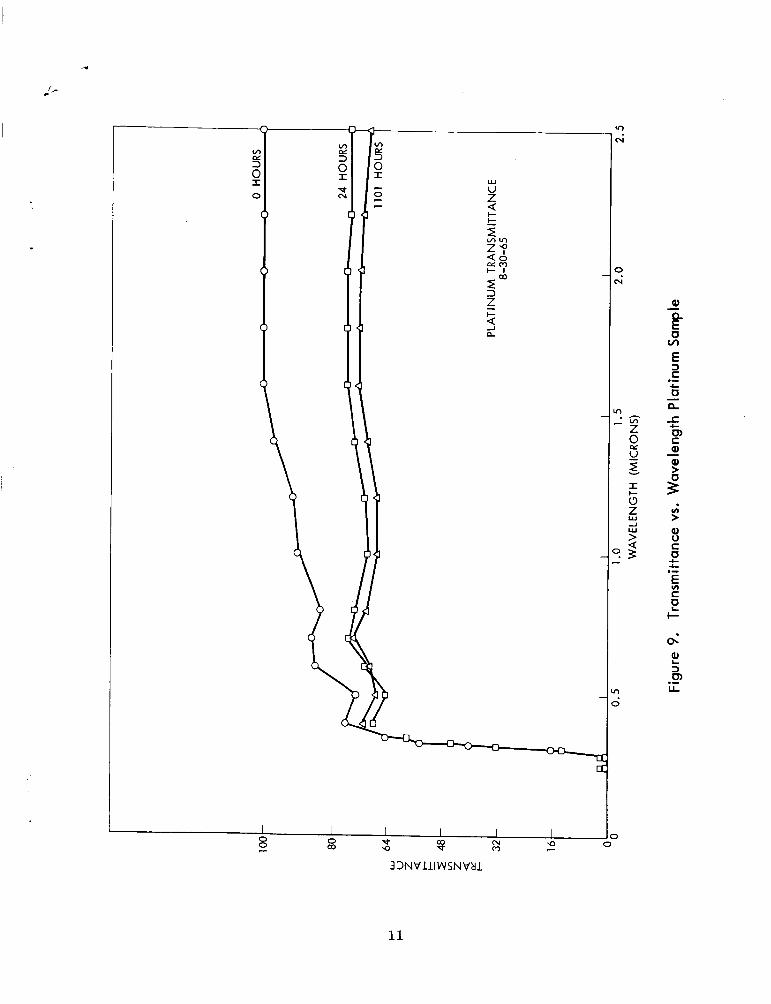
Platinum transmission had a sharp decrease during the first 24 hours of irradiation. During this time a 20 to 25 percent drop in transmission occurred
*James J. Webb, "Ul t rav io let Measurements of Several Light Sources;" GSFC Document X-633-65-332, August 1965.
3

m 4
2 P c
c vi
v)
.i
? Y
? c
9 c
0
4

5
I I I u, 0 u, +
3 9NVH3 3 3 V l N 3 313 d
6

7
I I I i? 0 8 8 co -
8
0
h c3
I a, - E" 0 v) Y
E
E 3 C
3
.- 3 f 0) C Q Q > - s In > Q, V C 0 V Q
Q &
h
3 u) L
c
Y
2 .-

9
in the infrared region as shown in Figure 9. The reflectance of the platinum sample experienced a similar change during the first hours of exposure (Fig- ure 10). The resulting transmission curve was spectrally flat and experienced a slow temporal uniform degradation after the initial drop.
Typical energy values were obtained by taking 5 readings a day on several days throughout the experiment. The values varied by as much as 15% over a period of 13 days. Variation was due to the manual current control of the power supplies and the aging of the lamps. The solar constant ( s . c . ) figures given were calculated using 140 mw/cm2 as 1 s . c . and 6 mw/cm2 or a uv s . c . in the region between 2340 and 3575 A. The values of energy measured at the sample surface location were:
HgXe source: 55 mw/cm2 or 0.39 S . C .
11 mw/cm* o r 1.9 uv S . C .
Xe source: 59 mw/cm2 or 0.42 S . C .
4 .5 mw/cm2 or 0.75 uv s . c .
The temperatures of the samples were measured on 5 different days with an Atkins Co. surface thermometer. Readings were taken after the samples reached equilibrium temperature. Typical values a re given below computed from the average of the 5 readings taken.
Aluminum (Xe) 129O F
Hy-Cal We) 184O F
Platinum (Xe) 137' F
It should be noted that all the graphs were made from data taken on individual Irrunsf1 on the spectrophotometer.
IV. DISCUSSION
A good indication of the degradation rate of the platinum filter was ob- served as shown in Figures 9 and 10. The data indicate that when platinum is
1 0
I 1 I I I I hl '0 3 (3 - 0 w 8 c W '0
33NVl l IWSNVtl l
11

12
4' used as a neutral density filter, an aging process should be employed to reach a stable transmission state.
was learned about the degradation in the uv region. platinum on quartz blanks.
This particular filter exhibited a sharp cutoff in I transmission below 400 nm because the coating was on glass; consequently little
Future studies will include
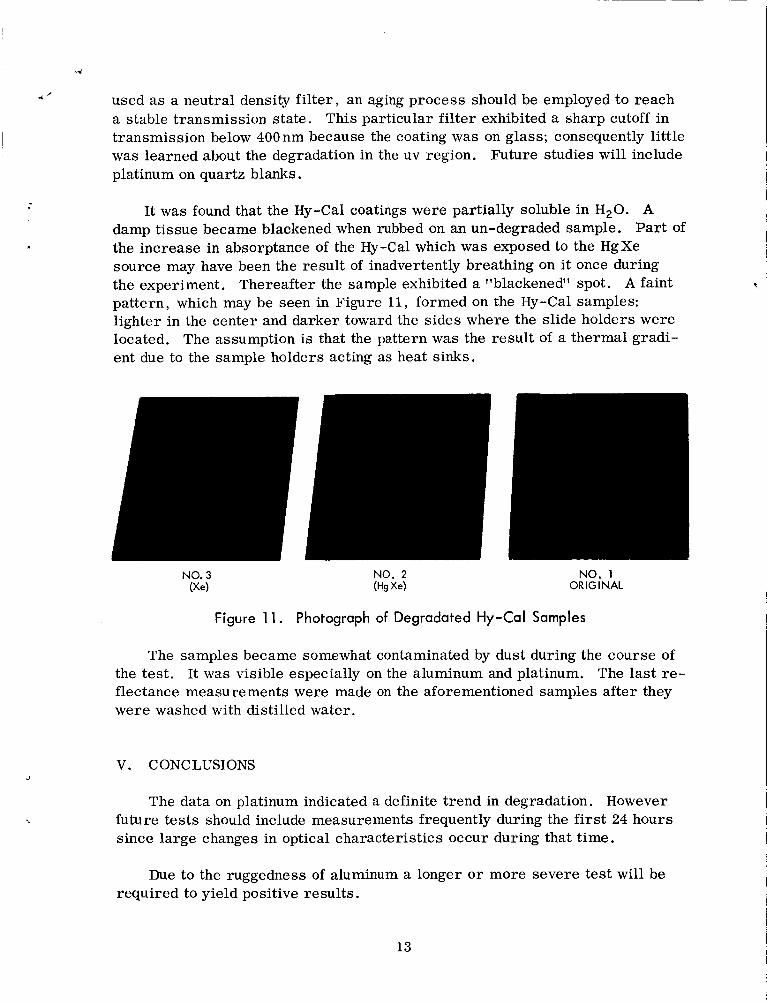
It was found that the Hy-Cal coatings were partially soluble in H,O. A damp tissue became blackened when rubbed on an un-degraded sample. Part of the increase in absorptance of the Hy-Cal which was exposed to the HgXe source may have been the result of inadvertently breathing on it once during the experiment. Thereafter the sample exhibited a "blackened" spot. A faint pattern, which may be seen in Figure 11, formed on the Hy-Cal samples: lighter in the center and darker toward the sides where the slide holders were located. The assumption is that the pattern was the result of a thermal gradi- ent due to the sample holders acting as heat sinks.
NO. 3 NO. 2 NO. 1 (Xe) (Hg Xe) ORIGINAL
Figure 11. Photograph of Degradated Hy-Cal Samples
The samples became somewhat contaminated by dust during the course of the test. It was visible especially on the aluminum and platinum. The last re - flectance measurements were made on the aforementioned samples after they were washed with distilled water.
V. CONCLUSIONS
The data on platinum indicated a definite trend in degradation. However future tests should include measurements frequently during the first 24 hours since large changes in optical characteristics occur during that time.
Due to the ruggedness of aluminum a longer or more severe test will be required to yield positive results.
13

The Hy-Cal stood up remarkably well throughout the 1101 hour test although the effects of different spectra cannot be ascertained due to the small changes in absorptance and the fact that only 2 samples were tested.
14