u-blox slide deck - full year 2014 financials
TRANSCRIPT

Annual results 2014
u-blox Holding AG
March 19, 2015
Thomas Seiler, CEO
Roland Jud, CFO
locate, communicate, accelerate

© u-blox Holding AG, March 19, 2015
Disclaimer
Slide 2
This presentation contains certain forward-looking statements. Such forward-looking
statements reflect the current views of management and are subject to known and
unknown risks, uncertainties, assumptions and other factors that may cause actual results, performance or achievements of the Group to differ materially from those
expressed or implied herein.
Should such risks or uncertainties materialize, or should underlying assumptions prove
incorrect, actual results may vary materially from those described in this presentation.
u-blox is providing the information in this presentation as of this date and does not
undertake any obligation to update any forward-looking statements contained in it as a
result of new information, future events or otherwise.

© u-blox Holding AG, March 19, 2015
Agenda
• Introduction
• Operational highlights 2014
• Financial results 2014
• Business review
• Outlook
• Q&A
Slide 3

Operational highlights 2014
• Strong business growth driven by the increased demand for mobility
solutions and Internet of Things
• Expanded positions in our target markets
• Strategic new product category short range radio through acquisitions
• Bluetooth and Bluetooth low energy
• Wi-Fi
• Strengthened organization
• Strong growth in personnel – 614 FTE at year end
• Addition of R&D facilities – u-blox had operations in 17 countries
• Continued adaptation of organizational framework
© u-blox Holding AG, March 19, 2015 Slide 4

u-blox group
© u-blox Holding AG, March 19, 2015 Slide 5
Change 2014
to 2013
Revenue 270.0m - 22.9%
Gross profit 122.7m 45.4% 21.3%
EBITDA 58.6m 21.7% 26.9%
Operating profit (EBIT ) 39.1m 14.5% 30.0%
Net profit, attributable to owners of
the parent 34.4m 12.7% 39.6%
Net cash generated from
operating activities 53.7m 19.9% 39.5%
Payout of a dividend of CHF 1.60 per share from capital reserves proposed
Key figures Amount CHF In relation to
revenue

Revenue and EBITDA
© u-blox Holding AG, March 19, 2015 Slide 6
• Solid revenue growth of 22.9% compared to 2013
• Organic growth of 19.6%
• Acquisition related growth of 3.3%
• At constant exchange rate: Revenue growth of 34.8%
• Growth of EBITDA of 26.9% compared to 2013
Comments Revenue and EBITDA
112.8 124.7
173.1
219.8
270.0
27.7 29.1 35.2 46.2
58.6
0
50
100
150
200
250
300
2010 2011 2012 2013 2014
Revenue EBITDA
(million CHF)
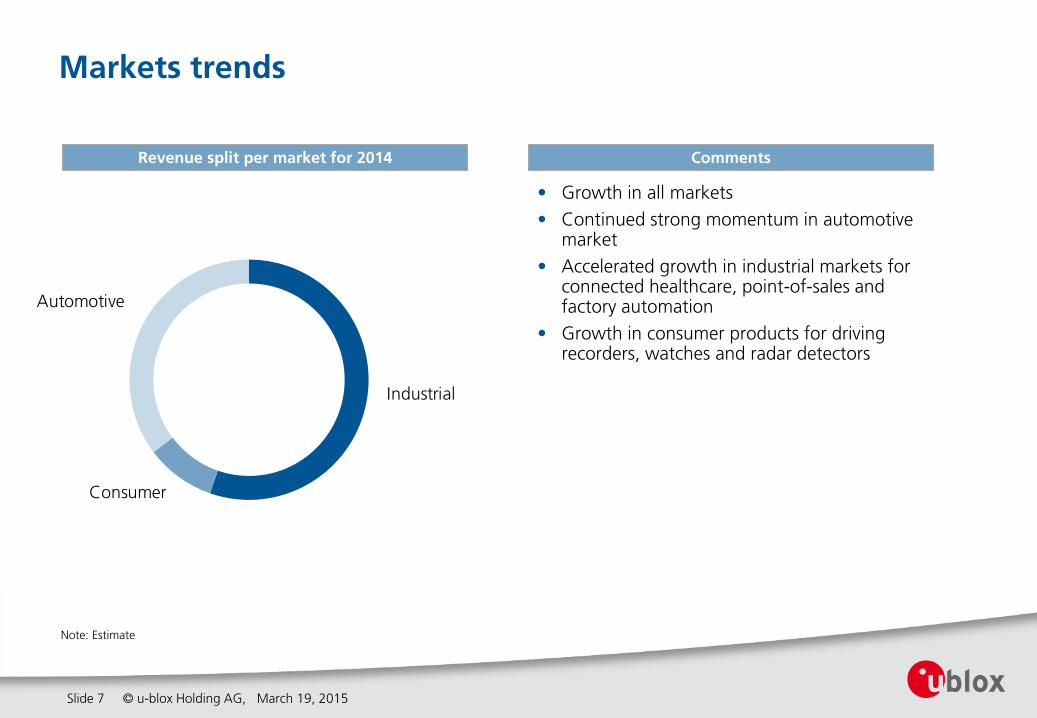
Industrial
Consumer
Automotive
Markets trends
© u-blox Holding AG, March 19, 2015 Slide 7
Note: Estimate
• Growth in all markets
• Continued strong momentum in automotive market
• Accelerated growth in industrial markets for connected healthcare, point-of-sales and factory automation
• Growth in consumer products for driving recorders, watches and radar detectors
Comments Revenue split per market for 2014

0
50
100
150
200
250
300
2010 2011 2012 2013 2014
Americas EMEA APAC
(million CHF)
48%
25%
27%
46%
25%
28%
35%
24%
41%
45%
26%
29%
48%
27%
25%
Revenues by geography
© u-blox Holding AG, March 19, 2015 Slide 8
Note: based on customers’ billing location
Growth of business in all regions
Revenue development according to billing location:
• Strong increase of 26.7 % in APAC
• Strong growth of 19.9% in EMEA
• Continued growth of 19.1% in the Americas
Comments Revenues by geographic region
+ 22.9%

58.9 62.881.2
101.2
122.7
34.5%
47.2% 50.3%46.0%
45.4%
0%
10%
20%
30%
40%
50%
60%
0
20
40
60
80
100
120
140
2010 2011 2012 2013 2014
Gross Profit % of revenue
(million CHF) (in % of revenue)
Gross profit
© u-blox Holding AG, March 19, 2015 Slide 9
• Increase in gross profit to CHF 122.7m in 2014
• Strong growth of gross profit of 21.3% compared to 2013
• Gross profit margin in 2014 of 45.4%, slightly declined due to product mix containing more wireless products
Comments Gross profit / Gross profit margin
+ 21.3%

0
1
2
3
4
5
6
0
5
10
15
20
25
30
2010 2011 2012 2013 2014
Antaris u-blox 5 u-blox 6
u-blox 7 u-blox M8 ASP
(million units) (CHF)
0
2
4
6
8
10
12
14
16
0
5
10
15
20
25
2010 2011 2012 2013 2014
Shipments modules ASP
(million units) (CHF)
Shipments and ASP development
© u-blox Holding AG, March 19, 2015 Slide 10
• Continued growth of chips and modules volume
• First shipments of u-blox M8 chip
GPS/GNSS chips Modules
Note: incl. Atmel-Chipset sales
+ 17.9% + 51.7%

Global customer base
© u-blox Holding AG, March 19, 2015 Slide 11
• Strong and stable customer base
• More than 5’000 customers worldwide
• Good spread over different applications and geographical regions
• Largest customer accounts for less than 7% of total revenue
• 10 biggest customers account for 36.6% of total revenue
• No bad debtors
• Strong market and technology position with further potential for profitable growth
Comments Number of customers totaling 80% of revenue
68 65 57
67 69
0
10
20
30
40
50
60
70
2010 2011 2012 2013 2014

Distribution & marketing / Research & development
© u-blox Holding AG, March 19, 2015 Slide 12
Research & development expenses Distribution & marketing expenses
14.6 14.2 17.8
21.2 24.5
12.9%
11.4%10.3%
9.7%9.1%
0%
2%
4%
6%
8%
10%
12%
14%
0
5
10
15
20
25
30
2010 2011 2012 2013 2014
D&M % of revenues
(million CHF) (in % of revenue)
21.3 22.1
32.7 38.9
49.9
18.9%17.7%
18.9%17.7% 18.5%
0%
2%
4%
6%
8%
10%
12%
14%
16%
18%
20%
0
10
20
30
40
50
60
2010 2011 2012 2013 2014
R&D % of revenues
(million CHF) (in % of revenue)

Research & development
70%
Sales, marketing,
support
19%
Logistics, admin 11%
Total = 614 FTE
428
117
69
Employees
© u-blox Holding AG, March 19, 2015 Slide 13
Average employee level (2010 – 2014, FTE based) Employee breakdown (end of 2014, FTE based)
Note: 74.8% of employees based outside Switzerland (spread over 17 countries) Note: Average number of employees (FTE = full time equivalent)
196 215 294
408
538
0
100
200
300
400
500
600
2010 2011 2012 2013 2014
(Average FTE)

Income statement
© u-blox Holding AG, March 19, 2015 Slide 14
• Revenue increase mainly organic
• Increased gross profit by 21.3%
• Higher absolute OPEX due to expansion of activities; decrease of relative OPEX to revenue
• EBITDA margin of 21.7%
• EBIT margin of 14.5%
• Share based payment cost in the amount of CHF 3.3m
• Finance costs contains unrealized/realized foreign exchange gains of CHF 3.5m
• Tax rate of 19.9%
Comments Consolidated income statement (condensed)
*) Management calculates EBITDA (earnings before interest, taxes, depreciation and amortization) by adding back depreciation and amortization to operating profit (EBIT), in each case determined in accordance with IFRS.
for the year ended December 31, June 30,
(in CHF 000s) 2014 2013 2014
(audited) (audited) (unaudited)
Revenue 270'045 219'813 121'625
Cost of sales -147'323 -118'654 -64'031
Gross profit 122'722 101'159 57'594
Operating expenses -84'515 -71'192 -38'897
Other income 868 83 101
Operating profit (EBIT) 39'075 30'050 18'798
Finance income 4'546 1'013 1'090
Finance costs -658 -2'193 -385
Profit before income tax (EBT) 42'963 28'870 19'503
Income tax expense -8'566 -4'227 -5'100
34'397 24'643 14'403
Operating profit (EBIT) 39'075 30'050 18'798
Depreciation and amortization 19'529 16'138 8'489
EBITDA*) 58'604 46'188 27'287
Net profit, attributable to owners
of the parent

Segment information
© u-blox Holding AG, March 19, 2015 Slide 15
(in CHF 000s) 2014 2013 2014 2013 2014 2013 2014 2013 2014 2013
Revenue third 269'799 218'888 246 925 270'045 219'813 270'045 219'813
Revenue intragroup 23'827 17'988 23'827 17'988 -23'827 -17'988 0 0
Total revenue 269'799 218'888 24'073 18'913 293'872 237'801 -23'827 -17'988 270'045 219'813
EBITDA*) 54'889 43'526 4'436 3'612 59'325 47'138 -721 -950 58'604 46'188
Depreciation -4'602 -3'018 -1'670 -1'123 -6'272 -4'141 -6'272 -4'141
Amortization -12'238 -10'359 -1'019 -1'638 -13'257 -11'997 -13'257 -11'997
Operating profit (EBIT)
Finance income 4'546 1'013 4'546 1'013
Finance costs -658 -2'193 -658 -2'193
EBT 3'167 -2'130 42'963 28'870
Dec. 31, Dec. 31, Dec. 31, Dec. 31, Dec. 31, Dec. 31, Dec. 31, Dec. 31, Dec. 31, Dec. 31,
2014 2013 2014 2013 2014 2013 2014 2013 2014 2013
Assets 223'485 142'431 13'460 15'521 236'945 157'952 64'802 68'557 301'747 226'509
Liabilities 79'835 34'776 4'931 8'374 84'766 43'150 4'105 2'923 88'871 46'073
additions to
non-current assets 45'434 29'826 1'099 3'890 46'533 33'716 - - 46'533 33'716
38'049 30'149 1'747 851
January - December January - December
31'00039'796 -721 -950 39'075 30'050
January - December January - December January - December
Positioning and
wireless products
Wireless services Total segments Non-allocated/
eliminations
Group
*) Management calculates EBITDA (earnings before interest, taxes, depreciation and amortization) by adding back depreciation and amortization to operating profit (EBIT), in each case determined in accordance with IFRS.

Statement of financial position (1)
© u-blox Holding AG, March 19, 2015 Slide 16
• Very strong financial position with a liquidity (incl. marketable securities) of CHF 59.4m
• Inventory CHF 33.3m (thereof WIP CHF 10.2m)
• Goodwill increased due to acquisitions
• Increase of intangible assets due to capitalization of R&D expenses
Comments Statement of financial position (condensed)
Dec. 31, Dec. 31, June 30,
(in CHF 000s) 2014 2013 2014
(audited) (audited) (unaudited)
ASSETS
Current assets
Cash and cash equivalents 37'662 33'163 30'390
Marketable securities 21'730 27'395 24'920
Trade accounts receivable 38'842 29'204 35'179
Other current assets 54'862 32'589 38'558
Total current assets 153'096 122'351 129'047
Non-current assets
Property, plant and equipment 14'836 13'764 13'824
Goodwill 57'903 37'825 53'512
Other Intangible assets 70'502 44'570 58'864
Financial assets 584 1'222 480
Deferred tax assets 4'826 6'777 6'104
Total non-current assets 148'651 104'158 132'784
Total assets 301'747 226'509 261'831

Statement of financial position (2)
© u-blox Holding AG, March 19, 2015 Slide 17
• Current liabilities contains short-term bank borrowing of CHF 20m used for acquisitions
• Trade accounts payable of CHF 28.6m, in line with increasing business
• Non-current liabilities contains provisions, deferred tax liabilities and pension liabilities
• Share capital increase due to exercise of options
Comments Statement of financial position (condensed)
Dec. 31, Dec. 31, June 30,
(in CHF 000s) 2014 2013 2014
(audited) (audited) (unaudited)
LIABILITIES AND EQUITY
Current liabilities 70'860 35'974 56'017
Non-current liabilities 18'011 10'099 14'615
Total liabilities 88'871 46'073 70'632
Shareholders’ equity
Share capital 5'930 5'810 5'899
Share premium 89'531 92'556 88'340
Retained earnings 117'415 82'070 96'960
212'876 180'436 191'199
Total liabilities and equity 301'747 226'509 261'831
Total equity, attributable to
owners of the parent

Statement of financial position
© u-blox Holding AG, March 19, 2015 Slide 18
• Strong equity ratio with 70.5%
• Payout of a dividend of CHF 1.60 per share proposed to the Annual General Meeting
• Increase of 23% to 2013
• Dividend payout ratio of 30.6% of net profit
Comments Total equity and equity ratio
120138 151
180213
87.5%84.2%
78.7% 79.7%
70.5%
0%
10%
20%
30%
40%
50%
60%
70%
80%
90%
100%
0
50
100
150
200
250
2010 2011 2012 2013 2014
Equity Equity ratio
(million CHF) (% of total assets)

Statement of cash flows
© u-blox Holding AG, March 19, 2015 Slide 19
Comments Consolidated cash flow Statement (condensed)
• Strong operational cash flow with 19.9% of revenues (increase by 39.5% to 2013)
• Investing activities:
• CHF 30.1m investments into acquisitions (connectBlue and Antcor)
• CHF 7.5m prepayment for acquisition of Lesswire assets in 2015
• CHF 26.7m investments into intangible assets, mainly capitalized R&D expenses and intellectual property
• CHF 7.0m investments into fixed assets
• CHF 5.4m net proceeds from marketable securities
• CHF 0.5m interest received
• Financing activities:
• CHF 8.5m Dividend 2013 payment
• CHF 5.6m Proceeds from issuance of ordinary shares
• CHF 20.0m Short-term borrowings of
• CHF 2.0m Purchase of treasury shares
(in CHF 000s) 2014 2013
Net cash generated from operating activities 53'686 38'483
Net cash used in investing activities -65'400 -33'638
Net cash provided by / used in financing activities 14'991 -4'784
Net increase in cash and cash equivalents 3'277 61
Cash and cash equivalents at beginning of year 33'163 33'416
Exchange gains/(losses) on cash and cash equivalents 1'222 -314
Cash and cash equivalents at end of year 37'662 33'163
For the year ended
December 31,

Business review

Technology for life
© u-blox Holding AG, March 19, 2015 Slide 21
• Medical care industry faces
growing demand for better
and faster handling patients
and related information
• u-blox wireless and
positioning technologies
boost hospital and healthcare
efficiency

Ambulances
• Ambulances are high-tech,
mobile hospitals
• Integrated GPS determine
the exact location of
vehicle
• Wireless communication
advise care givers for better
patient‘s condition and
optimum hand-over
© u-blox Holding AG, March 19, 2015 Slide 22

Hospital staff efficiency
© u-blox Holding AG, March 19, 2015 Slide 23
• Short-range radio
technology provides
mobile connectivity to
any infrastructure and
equipment
• Short-range radio technology enables
hospital staff reading
analytics data from
instruments

Managing medical and surgical inventories
• Volatile drugs and blood
supplies require continuous
monitoring
• Cellular and short range
technology enables ongoing
monitoring and logging of
storage conditions
• Cellular and short range
technology identifies the
location, levels and
expiration dates of medical
stocks
© u-blox Holding AG, March 19, 2015 Slide 24

Mobile health monitoring
• Wireless communication
provides connectivity for
medical equipment and
eliminates cabling
• With wireless technology,
patients with multiple
sensors attached to the
body can be wheeled
swiftly from ambulance to
emergency room
• Handover of heartbeat,
blood pressure, respiratory
and body temperature data
is seamless
© u-blox Holding AG, March 19, 2015 Slide 25

Infusion pumps
• Infusion pumps are smart
devices that deliver a
precise and controlled mix
of nutrients and
medication to patients
• When medication bags need replacement, nurses
use a Bluetooth-enabled
barcode scanner to record
details of the patient, room
and bag
• Wi-Fi supports that the
correct fluids and
mediation are administered to the right patient
© u-blox Holding AG, March 19, 2015 Slide 26
Click here for video

Remote monitoring of sleep apnea
• Portable monitors with
cellular connectivity assures
uninterrupted monitoring at
home
• Cellular technology enable
hospitals or care givers to
administer treatment as
appropriate
© u-blox Holding AG, March 19, 2015 Slide 27

Providing safety and security for the elderly
• People live longer, and
want to remain in the own
homes
• Wearable medical and
location monitoring
devices with a fall-alert
and panic button use
short range and cellular
communication combined
with positioning
technology
© u-blox Holding AG, March 19, 2015 Slide 28

Product launch highlights
© u-blox Holding AG, March 19, 2015 Slide 29
TOBY-L2
World‘s fastet 4G LTE module
LISA-C210
Excellent building penetration and wide-area coverage
ODIN-W160
Our first combined Bluetooth/Wi-Fi module for „Internet of Things“ applications
NEO-M8&, LEA-M8T
Precision timing modules
EVA-M8M
World‘s smallest multi-GNNS module
CAM-M8Q
Positioning module with integrated antenna
UBX-M8030-Kx-DR
3D automotive dead reckoning
UBX-M8030-Kx-FT
Simultaneously decoding GNSS signals from all constellations
SARA-G340
low-cost 2G modem supporting M2M applications in Europe and Asia

Expanded relationships with 5000 customers
Trax, Sweden
Personal tracking device
© u-blox Holding AG, March 19, 2015 Slide 30
Holux, Taiwan
Bike computer
Large diversification by application, geography and end market
PUSH, Italy
Multi-sport smart gauge

Expanded relationships with 5000 customers
© u-blox Holding AG, March 19, 2015 Slide 31
Ctrack, South Africa
Fleet management
Arvento, Turkey
Vehicle tracking &
diagnostics
Cohda Wireless, Australia
Advanced V2X solution
BARTEC PIXAVI, Norway
Safe smartphone

Continued high customer satisfaction
• Cobra Telematics (Vodafone Group) develops telematics components and services
for the automotive industry and the insurance business
• Major vehicle manufacturer has chosen Cobra as its partner for tracking systems
• Cobra’s needs
• Excellent product features such as fast time to first fix, high accuracy and low power consumption
• Exceptional quality. Auto manufacturers and auto buyers expect the absolute best
• How did u-blox enable Cobra to achieve growth?
• State-of-the art technology
• Cost effective solutions
• Extensive engineering support
• Automotive quality and reliability
© u-blox Holding AG, March 19, 2015 Slide 32

Innovation
Chip know-how
• We have full control of the technology behind our products. Chips integrate
the entirety of our know-how and form the essence of our value for the
customer
• By managing all our chipset and software technology, we can address perfectly the requirements demanded by our customers.
Module expertise
• Modules deliver our technology in a quickly adoptable format to our
customer with perfect performance: They just connect power and antenna.
Synergies lead to particularly attractive products
• By combining our three technologies, we are producing assemblies that
make it easier than ever to create complete solutions. This enhances our position as a supplier of core technology.
© u-blox Holding AG, March 19, 2015 Slide 33

locate, communicate, accelerate
Strategy

Acquisition for accelerating business growth
2009 2011
• NeonSeven
• Geotate
• Fusion Wireless
• SigNav assets
2012
• 4M Wireless
• Cognovo
• Fastrax
2014
• connectBlue
• Antcor
connectBlue
• Manufacturer of modules for BT and Wi-Fi connectivity
• Acquisition of 100% of the shares of connectBlue
• Acquisition price SEK 185 million (CHF 26.3 million)
• Fully paid-up in cash, Closing date: May 19, 2014
Antcor
• Provider of core IP for Wi-Fi connectivity
• Acquisition of 100% of the shares of Antcor
• EUR 5.2 million (CHF 6.3 million), excluding an earn-out
• Fully paid-up in cash, Closing date: August 6, 2014
© u-blox Holding AG, March 19, 2015 Slide 35
lesswire
• Acquisition of assets as of 1 Jan 2015: BT and Wi-Fi products, designs and staff
• Not part of annual results 2014
2015
• lesswire assets
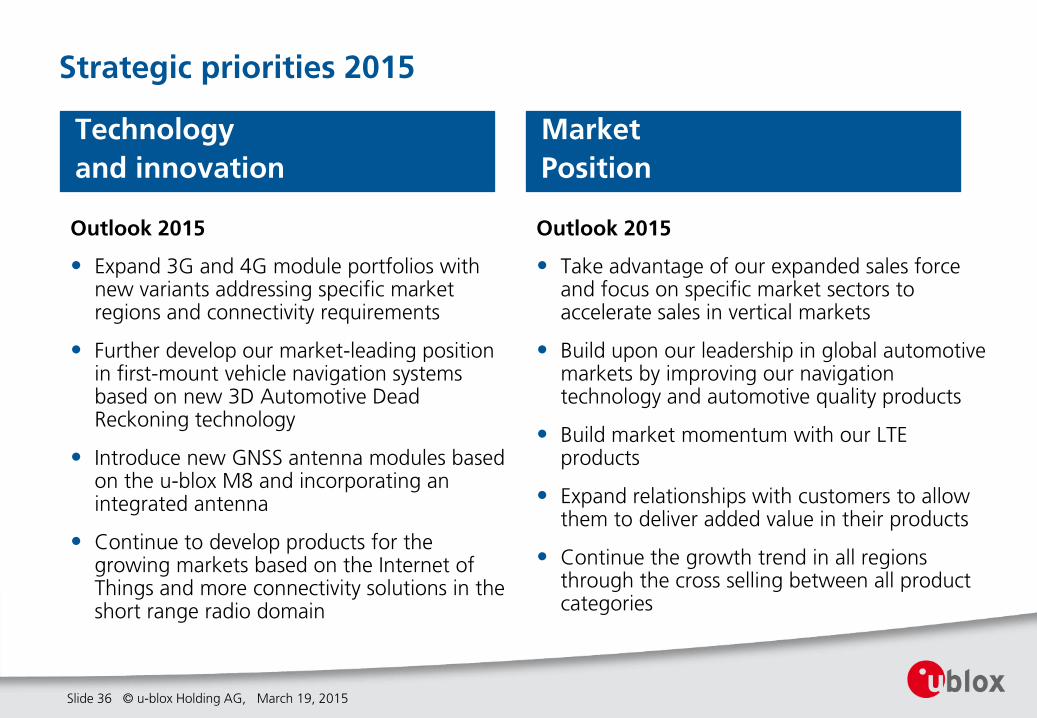
Strategic priorities 2015
Slide 36
Outlook 2015
• Expand 3G and 4G module portfolios with new variants addressing specific market regions and connectivity requirements
• Further develop our market-leading position in first-mount vehicle navigation systems based on new 3D Automotive Dead Reckoning technology
• Introduce new GNSS antenna modules based on the u-blox M8 and incorporating an integrated antenna
• Continue to develop products for the growing markets based on the Internet of Things and more connectivity solutions in the short range radio domain
© u-blox Holding AG, March 19, 2015
Outlook 2015
• Take advantage of our expanded sales force and focus on specific market sectors to accelerate sales in vertical markets
• Build upon our leadership in global automotive markets by improving our navigation technology and automotive quality products
• Build market momentum with our LTE products
• Expand relationships with customers to allow them to deliver added value in their products
• Continue the growth trend in all regions through the cross selling between all product categories
Technology
and innovation
Market
Position

Strategic priorities 2015: Internet of Things (IoT)
© u-blox Holding AG, March 19, 2015 Slide 37

Strategic priorities 2015 (2)
© u-blox Holding AG, March 19, 2015 Slide 38
Outlook 2015
• Optimize internal structures and processing capabilities
• Increase internal resources to support business growth
• Promote further innovation in all three technology categories
• Set and meet targets for higher operational efficiency
• Boost marketing capacity and expand marketing and sales tools
Outlook 2015
• Investigate new and complementary technologies that will allow us to maximize growth in both the positioning and wireless sectors
• Establish additional partnerships to give customers even easier access to our technologies
• Empower customers with improved design tools to speed time to market for attractive products
• Review new acquisition opportunities through which we can open up additional market segments
Operational
excellence
Strategic partnership and
acquisition opportunities

locate, communicate, accelerate
Outlook

Outlook
Goals
• Grow business with new products
• Wireless
o Expansion of module product line for 3G and 4G
• Positioning
o Business growth based on u-blox M8
o Expansion of module product line
• Short Range
o Expand business with acquired products
o Launch continually new products
• Continued focus on strategic development
• Evaluating the bond market for an inaugural transaction to take advantage of the attractive terms in the capital market
• Strengthening of the global presence
• Operational excellence for higher efficiency
Slide 40
• Continued strong business growth in 2015
• Impact by product mix on relative gross margin
• Natural hedging protects relative gross margin against foreign exchange variations
Exchange rate assumptions for 2015: EUR/CHF: 1.065 USD/CHF: 0.974 GBP/CHF: 1.500
• FX-sensitivity against CHF on Guidance 2015
Financial performance outlook 2015
© u-blox Holding AG, March 19, 2015
*) This guidance is based on the absence of unforeseen economic adversity and exchange rates assumed at budget level
+10% of USD EUR GBP
Revenue + 8.4% + 1.5% 0%
EBIT + 21.4% + 0.8% - 1.3%
Actual
FY 2013
Actual
FY 2014
Guidance 2015*)
Revenue 219.8m 270.0m 335m…345m
EBIT 30.1m 38.3m 48m… 53m
CHF CHF CHF

© u-blox Holding AG, March 19, 2015
Upcoming events
• Latest registration date for AGM: April 19, 2015
• Annual General Meeting: April 28, 2015
• Shares traded ex dividend: April 30, 2015
• Dividend payout: May 5, 2015
• Half-year results 2015: September 4, 2015
Slide 41

Thank you!
locate, communicate, accelerate