tyre industry of japan - jatma · i. history of the japanese tyre industry 1. ... with the collapse...
TRANSCRIPT

2007
TYRE INDUSTRYOF JAPAN
ww w. ja t m a .o r. jp
Contents
I. History of the Japanese Tyre Industry1. Brief History of the Japanese Tyre Industry ................................................................................... 2
2. Changes in the Tyre and Automobile Production........................................................................... 3
II. The Japanese Tyre Industry Today1. Overview ........................................................................................................................................ 4
2. Production Trends by Tyre Category ............................................................................................. 5
3. Trends in Sales of Original Equipment Tyres................................................................................. 5
4. Trends in Sales of Replacement Tyres .......................................................................................... 6
Trends in Sales of summer tyres and winter tyres for replacement (for four-wheeled vehicles).....6
5. Trends in Sales of Export Tyres..................................................................................................... 7
6. Exports by Region of Destination................................................................................................... 8
7. Imports by Region of Origin ........................................................................................................... 8
III. Measures for Tyre Safety1. Safety Standards for Automobile Tyres ......................................................................................... 9
2. Tyre Standards............................................................................................................................... 9
3. Legal Limits on Tread Wear ......................................................................................................... 10
4. Product Inspection ....................................................................................................................... 10
IV. Consideration for Environment1. Approach to “Reduce” ...................................................................................................................11
2. Recycling Situation....................................................................................................................... 12
3. Situation in Illegal Piling & Dumping of Scrapped Tyres ...............................................................14
V. Reference1. Automobiles and Tyres ................................................................................................................ 15
2. Distribution Channels ................................................................................................................... 16
3. Raw Materials .............................................................................................................................. 17
4. Tyre Production Worldwide .......................................................................................................... 18
The Japan Automobile Tyre Manufacturers Association, Inc. ................................... 19
JATMA Member Firms .................................................................................................................. 20
Distribution of Member Firms’ Automobile Tyre Plants................................................ 21
TYRE INDUSTRY OF JAPAN 2007

2
(1) 1940s-1950sThe industry restructured after World War II, following the destruction of facilities and equipment. In the early 1950s, after
the long-term government regulation and during the Korean War, the industry enjoyed special procurement and
improved tyre demand. However, after the Korean War, deflationary pressures affected the Japanese economy.
Demand for tyres decreased sharply, and the tyre market experienced considerable difficulty.
(2) 1960sAround 1960, full-fledged motorization, including increased automobiles on the road and the advent of expressways, spurred
the industry toward a technological revolution, including expansion and automation of equipment, as well as changes in the
raw materials for tyres, and enjoyed a high-growth phase.
(3) 1970sFrom 1970, the industry suffered demand downturns temporarily as a result of the first oil crisis. However, exports led the
growing Japanese economy. Tyre production expanded, as a result of an increase in the number of vehicles produced and
registered, and product diversification spurred demand.
(4) 1980sLow economic growth under the worldwide recession following the second oil crisis (1979) combined with the progress of
radial tyres, which caused demand downturns, forcing the Japanese tyre industry into a period of extreme difficulty. In 1983,
however, a turnaround was seen owing to economic recovery in Japan and in principal nations worldwide. In September 1985,
however, tyre demand dropped, influenced by the strong yen. Then in December 1986, the Japanese economy started to
grow steadily, backed by solid consumer spending and capital investment. As a result, the volume of rubber
consumption reached the 1-million-ton mark in 1989.
(5) 1990sWith the collapse of Japan’s “bubble economy,” the stock market crashed, corporate profits declined, the job
environment became uncertain, consumer spending and capital investment slowed, and the yen appreciated causing further
deepening of economic stagnation. Signs of recovery were seen in 1995, but in 1997 Japan entered a recession. In 1998
and 1999, large-scale restructuring in the financial sector and the introduction of foreign capital into the automotive
industry arose as serious concerns. On the other hand, the global economy in general remained steady despite
economic difficulties in Southeast Asia, supported by the robust U.S. economy. In this environment, the Japanese tyre industry
grew overall, although rubber consumption fell below the 1-million-ton mark in 1993. Supported by brisk exports,
Japanese tyre production volume increased to 1.13 million tons in 1999, a record high.
(6) 2000-2006The Japanese economy was on a trend of gentle recovering, practically completed writing off of bad loans although it was
still suffering from 1990s problems. In such situation, the year of 2006, although there were some problems such as continuing
high prices of raw materials, enjoyed the term of the biggest economic growth after the second world war owing to
improved corporate earnings and increased capital investments. On the other hand, the global economy as a whole
continued to grow supported by the steady Europian economy and the expanding BRICs although U.S. economy
showed a decline. In these situations, the demand for tyres in Japan in 2006 on a rubber consumption basis reached over
1.35 million tons, renewing the record high for five consecutive years.
History of the Japanese Tyre Industry
1. Brief History of the Japanese Tyre IndustryThe production scale of the automobile tyre industry of Japan steadily increased from the second half of 1990s to 2000,
supported by generally firm demand in the domestic market and active export. Demand slowed for a period in 2001 due to
the decline in export mainly for U.S., but afterward the production generally increased steadily. In 2006, while exports
remained at the same level with the previous year on a rubber consumption basis, domestic demands increased, which
resulted in the rubber consumption of 1.35 million tons (record high), the number of tyres and the value of 185.63 million
units and 1,177.9 billion yen, respectively. The rubber consumption accounts for over 80% of the rubber industry of Japan.
Those situations in the past can be surveyed with some steps as follows:
Ⅰ

3
2. Changes in the Tyre and Automobile Production
100
0 1950 1955 1960 1965 1970 1975 1980 1985 1990 1995 2000 2006
200
300
400
500
600
700
800
900
1,000
1,200
1,100
1,000
2,000
3,000
4,000
5,000
6,000
7,000
8,000
9,000
10,000
11,000
12,000
13,000
14,000
Automobile production
Automobile tyre production (rubber)
1,300
1,400
Automobile tyre production(×1000 tons)
Automobile production (×1000 units)
Table 1: Changes in the Tyre and Automobile Production
Figure 1: Changes in the Tyre and Automobile Production
1950 1960 1970 1980 1990 2000 2001 2002 2003 2004 2005 2006
Automobile Tyre Production (1000 tons of rubber) 14 83 369 784 1,031 1,153 1,119 1,190 1,240 1,285 1,331 1,352
Automobile Production (1000 units) 32 482 5,289 11,043 13,487 10,141 9,777 10,257 10,286 10,512 10,800 11,484
Source: JATMA

4
Ⅱ1. Overview
(1) The production of automobile tyres in 2006 on a rubber consumption basis enjoyed the fifth year of renewing consecutive
record high supported by the increases in original equipment and replacement tyres although tyres for exports remained
at the same level with the previous year.
The production ratio of the tyre industry within the rubber product industry (figures 2 and 3) lowered in rubber
consumption and expanded in fiscal value from the previous year, to 81.4% with 0.8 percentage points down and to
50.5% with 1.2 points up, respectively. (Ministry of Economy, Trade and Industry’s dynamic statistics)
(2) The Japanese tyre industry, has been promoting in Japan the establishment of appropriate disposal of scrapped tyres
from 3R (Reduce, Reuse and Recycle) activities point of view and the reinforcement of various educational activities for
safety, and in the world, taking part in discussions aiming for CO2 reduction as a measure for environment issue and also
tackling other matters such as developing activities for early realization of global harmonization of safety standards.
The production ratio of the tyre industry, within the rubber product industry in 2006(excluding cart tyres, tubes and flaps)
Figure 2: Rubber consumption Figure 3: Production value
Figure 4: Changes in production of Japan’s rubber products - rubber consumption and value
300×103 tons(18.6%)
Non-tyre:
1,340×103 tons(81.4%)
Tyre:
1,144.9×109 yen(49.5%)
Non-tyre:
1,166.9×109 yen(50.5%)
Tyre:
Total : 2,311.7×109 yen
Total :1.64×10⁶ tons
140
130
120
110
100
90
80
70
60
50
40
30
20
10
0
14,000
12,000
10,000
8,000
6,000
4,000
2,000
01997 1998 1999 2000 2001 2002 2003 2004 2005 2006
Non-tyre : Value
Rubber consumption (tons×104) Value (yen×108)
Tyre : Rubber consumption
Tyre : Value
Non-tyre : Rubber consumption
The Japanese Tyre Industry Today
Source: Ministry of Economy, Trade and Industry dynamic statistics
Source: Ministry of Economy, Trade and Industry dynamic statistics

5
2. Production Trends by Tyre CategoryThe total production of each category of automobile tyres in 2006 remained broadly flat from the previous year (185.63
million units, down 0.5%). By tyre category for four-wheeled vehicles, while truck and bus tyres increased 1.4% from the
previous year, light truck tyres and passenger car tyres slightly decreased, down 1.1%, down 0.2%, respectively.
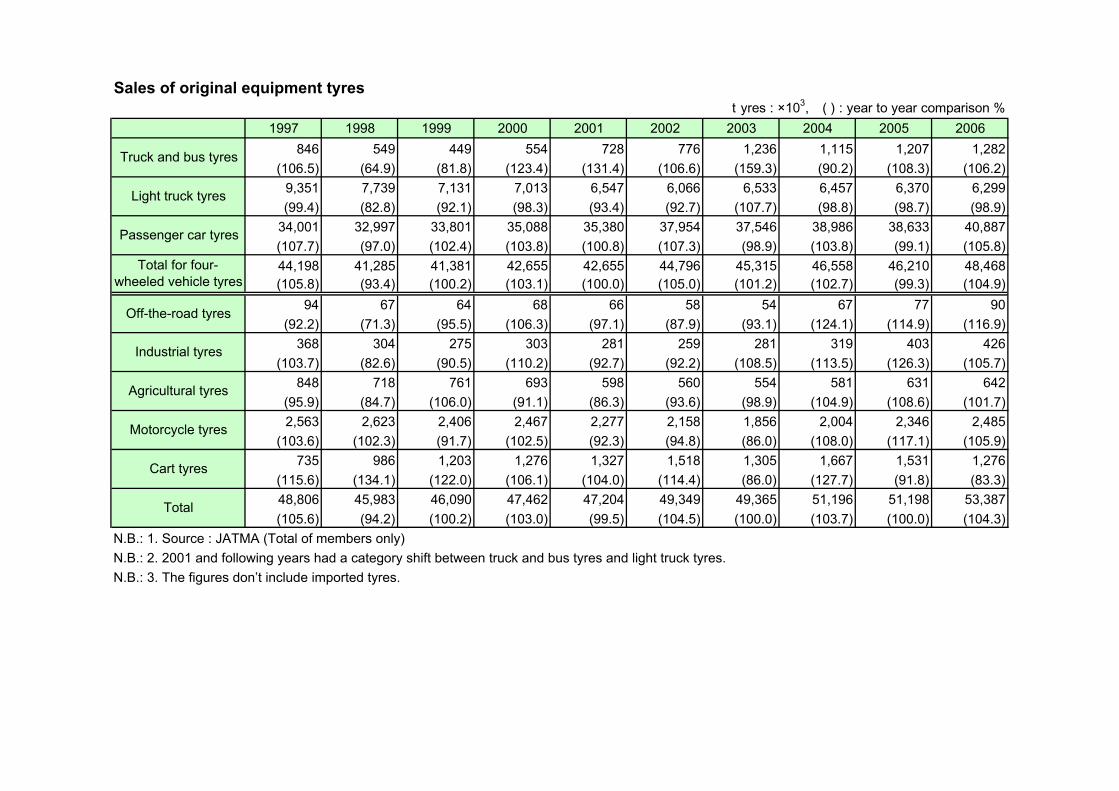
3. Trends in Sales of Original Equipment TyresThe sales of original equipment tyres in 2006 substantially exceeded the previous year to 54.01 million units, up 4.2%. Truck
and bus tyres increased 6.2% from the previous year due to the expansion of target vehicles of regulation for NOx and
PM(particulate materials) emitted by vehicles, but light truck tyres decreased 1.1%, and passenger car tyres increased 5.8%
caused by the rise in the number of vehicles for export.
Table 2: Automobile tyre production in 2006 Figure 5: Trends in automobile tyre production
Table 3: Sales of original equipment tyres in 2006
Production
Units(×103) 2006/2005(%)
Truck and bus tyres 14,837 101.4
Light truck tyres 26,485 98.9
Passenger car tyres 134,594 99.8
Special vehicle tyres 3,311 83.5
Motorcycle tyres 6,405 101.1
Total 185,632 99.5
N.B.: 1. Special vehicle tyres’ includes off-the-road, industrial,
agricultural, and cart tyres.
2. The figures above are the total of only JATMA members.
Source: JATMA
Sales
Units(×103) 2006/2005(%)
Truck and bus tyres 1,282 106.2
Light truck tyres 6,299 98.9
Passenger car tyres 40,887 105.8
Special vehicle tyres 2,434 92.1
Motorcycle tyres 3,106 104.3
Total 54,008 104.2
N.B.: 1. Special vehicle tyres’ includes off-the-road, industrial,
agricultural, and cart tyres.
2. The figures above include other domestic
manufacturers than JATMA members.
3. Exported tyres are excluded.
Source: JATMA
0
20
40
60
80
100
120
140
160
180
200
Units×106
1997 1998 1999 2000 2001 2002 2003 2004 2005 2006
Total
PC
LT
TB
Others
Figure 6: Trends in sales of original equipment tyres
0
10
20
30
40
50
60
1997 1998 1999 2000 2001 2002 2003 2004 2005 2006
Units×106
Total
PC
LT
TB
Others

Summer tyres Winter tyres
Units(×103) 2006/2005(%) Share of summertyres in total Units(×103) 2006/2005(%) Share of winter
tyres in total
3,401 98.2 60.6 2,207 108.8 39.4
9,858 96.2 68.2 4,604 111.1 31.8
34,417 97.4 66.3 17,514 109.8 33.7
47,675 97.2 66.2 24,326 109.9 33.8
Truck and bus tyres
Light truck tyres
Passenger car tyres
Total
6
Table 5: Sales of summer tyres and winter tyres for replacement in 2006 (for four-wheeled vehicles)
N.B.: The shares of summer and winter tyres indicate the respective percentages in total number of replacement sales. Source: JATMA
4. Trends in Sales of Replacement TyresIn 2006, replacement tyre sales in Japan remained broadly flat from the previous year (75.91 million units, up 0.9%). Whiletruck and bus tyres increased 2.1% owing to the moderate economic recovery, light truck tyres and passenger car tyresremained broadly flat, which resulted in the above total situation.
Trends in sales of summer tyres and winter tyres for replacement (for four-wheeled vehicles)In 2006, summer tyre (i.e. ordinary tyres excluding winter tyres) sales was 47.68 million units, down 2.8% from the previousyear, and the ratio of the summer tyre sales to the total decreased from the previous year. By tyre category, truck and bustyres, light truck tyres and passenger car tyres, all of them decreased from the previous year, 1.8%, 3.8% and 2.6%,respectively. The situation was induced by prolonged tenure of use of tyres, rise in tyres imported by non-members, andincrease in winter tyres. Winter tyre sales in 2006 was 24.33 million units, up 9.9% from the previous year, reaching the record high with threeconsecutive years of increase. And the ratio of winter tyre sales to the total exceeded the previous year by 2.7 points to33.8%. Truck and bus tyres increased 8.8% due to the influence of increased studless tyres to be used even after theseason until worn-out, and light truck tyres and passenger car tyres also increased, 11.1% and 9.8%, respectively due toincreased deliveries for insufficient stock induced by the previous year’s heavy snowfall.
Table 4: Sales of replacement tyres in 2006 Figure 7: Trends in sales of replacement tyres
Sales
Units(×103) 2006/2005(%)
Truck and bus tyres 5,608 102.1
Light truck tyres 14,462 100.5
Passenger car tyres 51,931 101.2
Special vehicle tyres 1,094 96.0
Motorcycle tyres 2,816 96.1
Total 75,911 100.9
N.B.: 1. Special vehicle tyres’ includes off-the-road, industrial,
agricultural, and cart tyres.
2. The figures above include other domestic
manufacturers than JATMA members.
Source: JATMA
0
10
20
30
40
50
60
70
80
90
1997 1998 1999 2000 2001 2002 2003 2004 2005 2006
Units×106
Total
PC
LT
TB Others
7
II. The Japanese Tyre Industry Today
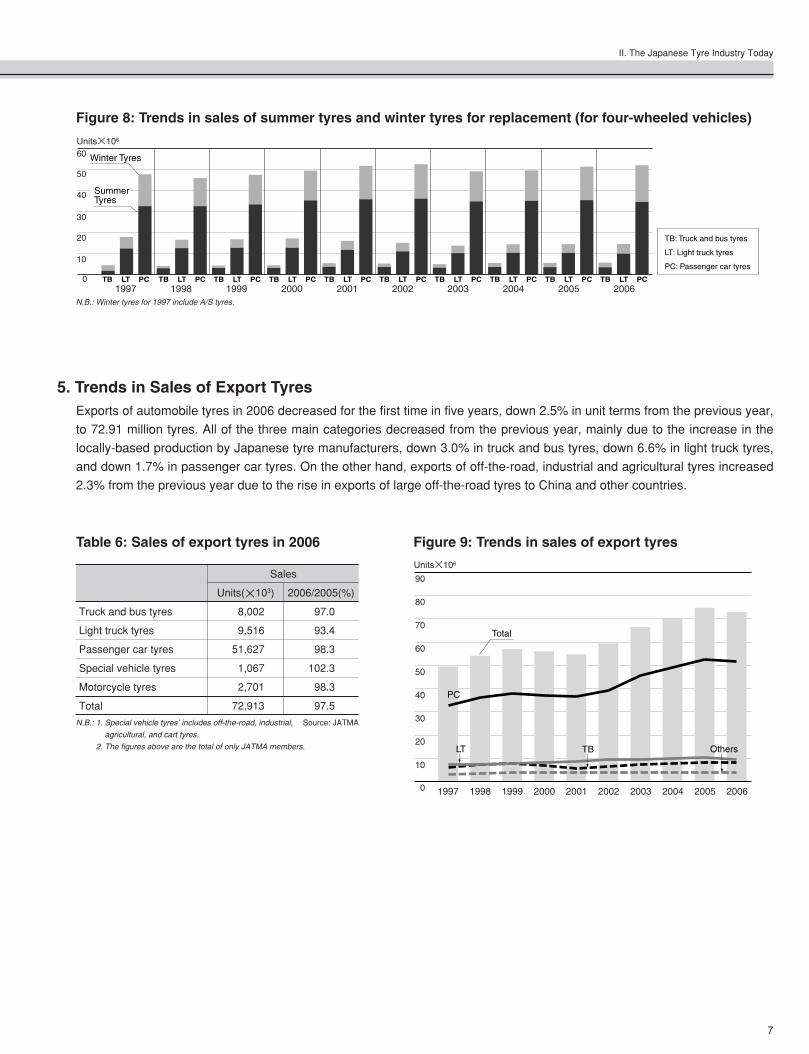
N.B.: Winter tyres for 1997 include A/S tyres.
Figure 8: Trends in sales of summer tyres and winter tyres for replacement (for four-wheeled vehicles)
1997 1998 1999 2000 2001 2002 2003 2004 2005 2006
Units×106
0
10
20
30
40
50
60 Winter Tyres
TB LT PC TB LT PC TB LT PC TB LT PC TB LT PC TB LT PC TB LT PC TB LT PC TB LT PC TB
TB: Truck and bus tyres
LT: Light truck tyres
PC: Passenger car tyres
LT PC
SummerTyres
5. Trends in Sales of Export TyresExports of automobile tyres in 2006 decreased for the first time in five years, down 2.5% in unit terms from the previous year,
to 72.91 million tyres. All of the three main categories decreased from the previous year, mainly due to the increase in the
locally-based production by Japanese tyre manufacturers, down 3.0% in truck and bus tyres, down 6.6% in light truck tyres,
and down 1.7% in passenger car tyres. On the other hand, exports of off-the-road, industrial and agricultural tyres increased
2.3% from the previous year due to the rise in exports of large off-the-road tyres to China and other countries.
Table 6: Sales of export tyres in 2006 Figure 9: Trends in sales of export tyres
Sales
Units(×103) 2006/2005(%)
Truck and bus tyres 8,002 97.0
Light truck tyres 9,516 93.4
Passenger car tyres 51,627 98.3
Special vehicle tyres 1,067 102.3
Motorcycle tyres 2,701 98.3
Total 72,913 97.5
N.B.: 1. Special vehicle tyres’ includes off-the-road, industrial,
agricultural, and cart tyres.
2. The figures above are the total of only JATMA members.
Source: JATMA
0
90
80
70
60
50
40
30
20
10
1997 1998 1999 2000 2001 2002 2003 2004 2005 2006
Units×106
Total
PC
LT TB Others
8
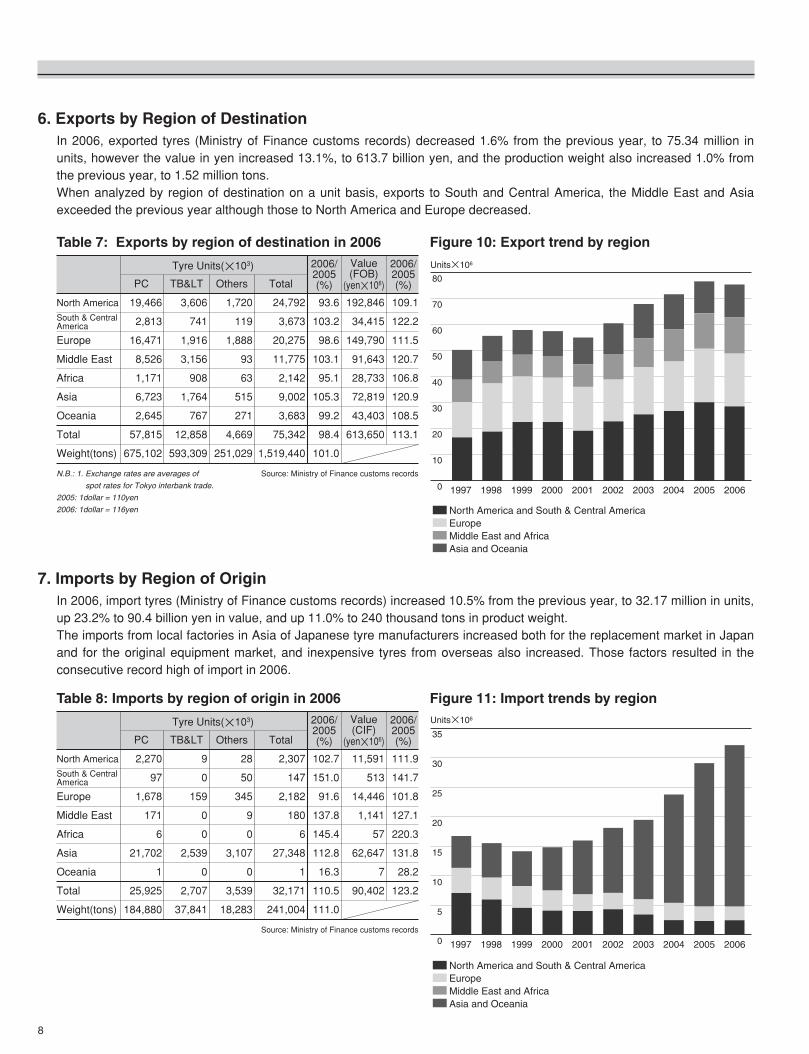
6. Exports by Region of DestinationIn 2006, exported tyres (Ministry of Finance customs records) decreased 1.6% from the previous year, to 75.34 million inunits, however the value in yen increased 13.1%, to 613.7 billion yen, and the production weight also increased 1.0% fromthe previous year, to 1.52 million tons. When analyzed by region of destination on a unit basis, exports to South and Central America, the Middle East and Asiaexceeded the previous year although those to North America and Europe decreased.
Table 7: Exports by region of destination in 2006 Figure 10: Export trend by region
N.B.: 1. Exchange rates are averages of
spot rates for Tokyo interbank trade.
2005: 1dollar = 110yen
2006: 1dollar = 116yen
Source: Ministry of Finance customs records
0
80
70
60
50
40
30
20
10
1997 1998 1999 2000 2001 2002 2003 2004 2005 2006
Units×106
North America and South & Central AmericaEuropeMiddle East and AfricaAsia and Oceania
North America
South & CentralAmerica
Europe
Middle East
Africa
Asia
Oceania
Total
Weight(tons)
19,466
PC TB< Others Total
2006/2005(%)
Value(FOB)
(yen×106)
2006/2005(%)
Tyre Units(×103)
2,813
16,471
8,526
1,171
6,723
2,645
57,815
675,102
3,606
741
1,916
3,156
908
1,764
767
12,858
593,309
1,720
119
1,888
93
63
515
271
4,669
251,029
24,792
3,673
20,275
11,775
2,142
9,002
3,683
75,342
1,519,440
93.6
103.2
98.6
103.1
95.1
105.3
99.2
98.4
101.0
192,846
34,415
149,790
91,643
28,733
72,819
43,403
613,650
109.1
122.2
111.5
120.7
106.8
120.9
108.5
113.1
7. Imports by Region of OriginIn 2006, import tyres (Ministry of Finance customs records) increased 10.5% from the previous year, to 32.17 million in units,up 23.2% to 90.4 billion yen in value, and up 11.0% to 240 thousand tons in product weight.The imports from local factories in Asia of Japanese tyre manufacturers increased both for the replacement market in Japanand for the original equipment market, and inexpensive tyres from overseas also increased. Those factors resulted in theconsecutive record high of import in 2006.
Table 8: Imports by region of origin in 2006 Figure 11: Import trends by region
Source: Ministry of Finance customs records0
35
30
25
20
15
10
5
1997 1998 1999 2000 2001 2002 2003 2004 2005 2006
Units×106
North America and South & Central AmericaEuropeMiddle East and AfricaAsia and Oceania
North America
South & CentralAmerica
Europe
Middle East
Africa
Asia
Oceania
Total
Weight(tons)
2,270
PC TB< Others Total
2006/2005(%)
Value(CIF)
(yen×106)
2006/2005(%)
Tyre Units(×103)
97
1,678
171
6
21,702
1
25,925
184,880
9
0
159
0
0
2,539
0
2,707
37,841
28
50
345
9
0
3,107
0
3,539
18,283
2,307
147
2,182
180
6
27,348
1
32,171
241,004
102.7
151.0
91.6
137.8
145.4
112.8
16.3
110.5
111.0
11,591
513
14,446
1,141
57
62,647
7
90,402
111.9
141.7
101.8
127.1
220.3
131.8
28.2
123.2

9
Ⅲ Measures for Tyre Safety
1. Safety Standards for Automobile TyresVarious standards have been specified regarding tyres from the viewpoint of automobile safety because tyres are
automobile’s important parts.
Each individual state has its own legislation specifying the standards and the tyres are requested to satisfy the standards of
the state where the tyres are to be used. In Japan we have the safety standards for road trucking vehicles and their detailed
items, enacted by the Ministry of National Land and Transportation.
In addition to these national standards, JATMA specifies guideline items for usage and maintenance in “Standards for
Selection, Usage and Maintenance” in an effort to enlighten those involved for securing safety.
2. Tyre StandardsIn addition to safety standards, JATMA publishes a definitive set of tyre standards in the annual JATMA Year Book. Setting
these standards is the responsibility of the Tyre Standards Committee, mainly comprised of representatives of tyre makers,
automakers, and related ministries and agencies in the Japanese government.
The standards cover tyres, rims and valves in seven categories: passenger cars, light trucks, trucks and buses, off-road
vehicles, agricultural equipment, industrial vehicles and motorcycles.
The Japanese Ministry of Land, Infrastructure and Transport has incorporated JATMA’s Tyre Standards in its vehicle
inspection procedures since 1982. Internationally, the standards rank as authoritative guidelines together with the ETRTO
standards of Europe and TRA standards of the United States. The JATMA standards are also mentioned in the U.S.
Department of Transportation’s Federal Motor Vehicle Safety Standards and are mutually recognized standards for tyres
exported from Japan to Canada and Australia.

10
3. Legal Limits on Tread WearBalding tyres are a threat to traffic safety, especially on wet roads. The Ministry of Land, Infrastructure and Transport
prescribes skidproof requirements in terms of minimum groove depth in its Safety Standards for Road Transportation
Vehicles. These requirements, which include wear limits for high-speed and ordinary driving (see table 9,10), proscribe the
use of tyres with a groove depth shallower than that specified. Inspection often catch tyres with improper air pressures,
uneven wear or insufficient grooves (see figure 13).
4. Product InspectionIn 1954, JATMA started its tyre inspection activity at its branch offices.
Defective or damaged tyres are now observed and checked at seven offices according to the requests from their consumers
to find causes of the damages and to provide advice to them regarding correct usage of tyres.
Groove depth (mm)
80㎞/h
0 6 4 2 08
10
20
30
40
50
60
70
80
(m)
60㎞/h
40㎞/h
Tyre size: 165 SR 13Groove pattern: ribAir pressure: 170kPa(1.7kgf/cm2)Weight: 425kgVehicle type: Passenger car, 1,800ccRoad: asphalt; wet
Dis
tanc
e (m
)
NE
W T
YR
E
Table 9: Wear limit for automobile tyres
Tyre type Groove depth limit
Passenger car tyres 1.6 mm
Light truck tyres 1.6 mm
Truck and bus tyres 1.6 mm
Motorcycle tyres 0.8 mm
Table 10: Wear limit for automobile tyres inhigh-speed driving
Tyre type Groove depth limit
Passenger car tyres 1.6 mm
Light truck tyres 2.4 mm
Truck and bus tyres 3.2 mm
Figure 12: Tyre groove depth and braking distance
Figure 13: Breakdown of tyre defects (Parentheses show defect rates)
Notes:
1. Multiple tyre defects per vehicle are possible, thus the number of tyre defects does not correspond to the number of vehicles with tyre defects.
2. The defect rate is the number of defects divided by the number of vehicles inspected.
3. Tyre inspections were carried out a total of 44 times (22 times on expressways and 22 times on ordinary roads) in 2005.
4. In the breakdown of tyre defects, the item “improper air pressure” includes insufficient pressure and excessive pressure.
Insufficient tyre grooves
Uneven wear
External cuts (reaching the cord)
Pins or alien matter
Improper air pressure
Others
72(3.4)76
(3.6)7
(0.3)9
(0.4)283
(13.5)105(5.0)

11
1. Approach to “Reduce”A new concept of “Reduce Index (Re Index)” focused on longer (wear) life and weight saving has been adopted. The
industry is making efforts aiming at an effect of 10% (expecting 3-5% of actual reduction).
Table 11: Monitoring of Re Achievement Rates
Source: JATMAN.B.: 1. Re Index = L÷M
Re Achievement Rate = Re Index×100where L=Wear Life Index (life index for the present model based on the previous model assumed as 100)
M=Weight Index (Weight index for the present model based on the previous model assumed as 100)
2. Tyres surveyed : Representative sizes selected in advance from replacement tyres for the domestic market.
Category
Passenger car tyres
Passenger car tyres
Passenger car tyres
Passenger car tyres
Light truck tyres
Light truck tyres
Light truck tyres
Light truck tyres
Truck and bus tyres
Truck and bus tyres
Monitored Size
155/65R13
175/65R14
195/65R15
215/45R17
145R12
185R14
205/70R16
7.50R16
225/80R17.5
11R22.5
Classification
Summer tyres
Studless tyres
Summer tyres
Studless tyres
Summer tyres
Studless tyres
Summer tyres
Studless tyres
Summer tyres
Studless tyres
Summer tyres
Studless tyres
Summer tyres
Studless tyres
Summer tyres
Studless tyres
Summer tyres
Studless tyres
Summer tyres
Studless tyres
2004
Re Achievement Rate
–
–
110
120
102
105
–
–
–
113
105
–
105
105
–
–
–
–
–
–
107
109
112
135
128
110
114
–
–
110
110
–
105
110
–
–
–
–
126
123
104
99
111
109
122
122
–
–
100
100
100
101
103
95
110
105
–
–
87
100
106
104
111
121
117
112
114
–
100
108
105
101
104
103
110
105
–
–
107
112
2005 2006 Average
Ⅳ Consideration for Environment

12
2. Recycling Situation
The volume of newly scrapped tyres in 2006 increased by 34 thousand tons in total from the previous year, with the increase
in “on scrapped automobiles” (up 30 thousand tons).
The situation seems to be induced by the great increase in the number of acceptance of scrapped automobiles with the
collection and processing system firmly fixed two years after the End-of-Life Vehicle Recycling Law became fully effective.
For several years the volume of newly scrapped tyres has remained at the level of one hundred million units and one million
tons. As a situation around scrapped tyres, the demand for alternative fuels such as wood shavings, RPF(new-type solid fuel
made from waste paper and scrapped plastics, abbreviation for Refuse Paper & Plastic Fuel) and scrapped tyres is heating
up due to the rise in crude oil prices in recent years. Especially in scrapped tyres, the balance between supply and demand
has been significantly disrupted, and the scrapped tyre market is now in confusion. Resultantly, the total recycling rate was
88%, less than the industry’s expectation, staying at the same level as the previous year. Therefore, taking hold of the
routes for collecting scrapped tyres more clearly and making every effort to raise the recycling rate will become important
challenges.
Regarding the situation of recycling, while Fuel for Cement calcining continued to decrease from the previous year, use of
scrapped tyres in Paper manufacturing greatly increased (up 30% from the previous year) due to active operations of
biomass boilers at paper mills. On the other hand, Exported statistics on customs clearance basis (Ministry of Finance)
indicates a slight decrease in used tyres and in rubber wastes from the previous year. This situation is considered to have
arisen because scrapped tyres to be cut into rubber wastes for exports were passed on to paper mills and other facilities.
Tyre dealers & retailers
Dischargers Commission of treatment Treatments at contractors Reutilization & disposal
(Authorized shops) (Cement, steel and paper makers)
Consumers Municipalities
Citizens
Contractors for discharge
(transportation companies or
the like)
Contractors for discharge (wreckers)
General wastes
Designated industrial
wastes
Industrial wastes
Contractors for collection &
transport
Contractors for intermediate
treatment
Contractors for collection, transport and intermediate
treatment
Contractors for reutilization &
disposal
Figure 14: Flow of scrapped tyres, from generation to treatment and recycling
Others 12%
Export 19%
Distributors’ stock 11%
Reclamation 1%
Chemical factories 1%
Paper manufacturing 26%
Reclaimed & powdered rubber 10%
Reuse 15%
Retreaded tyre bases 3%
Other uses 2%
Heat utilization 54%
Boilers 1%
Cement calcining 16%
Gasification furnace 3%
Steel manufacturing 4%
Metal refining 1%
Tyre manufacturing 2%2006(weight)
Figure 15: Recycling of used tyres in 2006

13
IV. Consideration for Environment
Table 12: Newly scrapped tyres (Tyres: millions; Tons: thousands; % of total)
On purchase of new tyres
On scrapped automobiles
Total
Tyres 82
2002
78
2003
80
2004
84
2005
84
2006
units and tons
82
distribution
100
2006/2005
Tyres 24 25 23 16 19 18 119
Tyres 106 103 103 100 103 100 103
Tons 1,040 1,030 1,043 1,022 1,056 100 103
Tons 205 224 216 151 181 17 120
Tons 835 806 827 871 875 83 100
Source: JATMA
Table 14: Changes in production of retreaded tyres (Tyres: thousands; Rubber consumption: ton)
Compound rubber consumption 9,345
1,203
2002
8,699
1,105
2003
8,184
1,042
2004
8,406
1,037
2005
8,596
1,078
2006
Number of tyres
Source: METI, JATMA
Table 13: Recycled tyres (Tons: thousands; % of total)
Kin
dof
recy
clin
g
Dom
estic
Reu
se
Hea
tutil
izat
ion
For
cem
ent,
stee
l
and
the
like
Bio
mas
spo
wer
gene
ratio
nan
dth
elik
e
Retreaded tyre bases 41
2002
36
2003
33
2004
35
2005
tonstonstonstons
36
2006
tons
3
distribution
103
2006/2005
Other uses 40 39 25 22 20 2 91
Paper manufacturing 86 70 130 210 274 26 130
Chemical factories
Subtotal (B)
Cement calcining
Steel manufacturing
Gasification furnace
Tyre manufacturing
Boilers
Metal refining
Subtotal (C)
Subtotal (B+C)
Export (D)
Total recycling (A+B+C+D)
Reclamation
Distributors’ stock
Subtotal (E)
Total used tyres (A+B+C+D+E)
6
92
284
55
-
56
66
26
487
579
148
901
31
108
139
1,040
8
78
240
48
-
42
23
20
373
451
268
891
37
102
139
1,030
9
139
213
52
8
30
15
11
329
468
270
916
34
93
127
1,043
9
219
181
51
27
24
12
10
305
524
213
897
32
93
125
1,022
9
283
168
49
34
22
11
8
292
575
196
934
11
111
122
1,056
1
27
16
4
3
2
1
1
27
54
19
88
1
11
12
100
100
129
93
96
126
92
92
80
96
110
92
104
34
119
98
103
Subtotal (A) 174 172 178 160 163 15 102
Reclaimed & powdered rubber 93 97 120 103 107 10 104
Source: JATMA
N.B.: Figures include imports of compound rubber.
Oth
ers

Total 163 8,588 85,880 155 7,429 74,290 –8 –1,159 –11,590 24 16 5,666 909 854
February 2006 February 2007
Numberof cases
Hokkaido 11 369 3,690 7 235 2,350 –4 –134 –1,340 5 1 59 176 0
Tohoku 56 1,757 17,570 51 1,580 15,800 –5 –177 –1,770 8 3 1,006 228 346
Kanto &Koshinetsu 38 2,971 29,710 33 2,473 24,730 –5 –498 –4,980 6 1 1,992 201 280
Metropolitanarea 18 787 7,870 17 637 6,370 –1 –150 –1,500 1 0 461 51 125
Chubu 5 655 6,550 6 762 7,620 1 107 1,070 0 1 750 0 12
Kinki 6 489 4,890 11 477 4,770 5 –12 –120 1 6 375 102 0
Chugoku 12 603 6,030 12 276 2,760 0 –327 –3,270 3 3 188 47 41
Shikoku 7 57 570 7 52 520 0 –5 –50 0 0 35 17 0
Kyushu 10 900 9,000 11 937 9,370 1 37 370 0 1 800 87 50
Units(×103)
Weight(ton)
Numberof cases
Units(×103)
Weight(ton)
Change from Feb.,2006 Number ofcases
properlyprocessed
Number ofcasesnewly
discovered
Break down
Illegal piling(units×103)
Illegal dumping(units×103)
Excessive piling(units×103)
Numberof cases
Units(×103)
Weight(ton)
14
3. Situation in illegal piling & dumping of scrapped tyresAs of February, 2007 the number of cases of illegal piling & dumping of scrapped tyres was 155, and the total number of
tyres was 7,429 thousand, down 8 cases (after 24 cases properly processed and 16 cases newly discovered) and 1,159
tyres from the same month of last year.
This situation is considered as a result of ⁄ strengthened penalties and increase in exposure of illegal piling & dumping, ¤
promotion activities by the tyre industry on proper processing of scrapped tyres, and ‹ application of JATMA’s system to
support restoring the original state.
[Remark]
1) The total was 7,429 tyres. Illegal piling, illegal dumping and excessive piling were 76%, 12% and 12%, respectively. The ratio of illegal piling
increased from last year (66➝76%), main reasons for which is considered to be a classification shift from illegal dumping to illegal piling,
and newly discovered cases.
�Illegal piling: The handling trader is in bankruptcy, under arrest or missing.
�Illegal dumping: The man or the group who dumped is not identified.
�Excessive piling: The piling exceeds the storage standard without any report.
2) The reduction of 8 cases and 1,159 tyres compared with the survey in February, 2006 is considered to be induced by ⁄ strengthened
penalties and raised social movement toward proper handling of waste materials such as the increase in exposure of illegal piling &
dumping ¤ promotion activities in the tyre industry on proper processing of scrapped tyres, and ‹ the full-scale operation of development
projects for a wide area and the promotion of recycle use.
3) Of the above 24 cases completed in proper handling, two cases shown below were implemented with the application in 2006 of the system
of JATMA to support restoring the original state.
Sano City, Tochigi Prefecture : 225 thousand tyres
Kobe City, Hyogo Prefecture : 47 thousand tyres
Table 15: Situation in illegal piling & dumping of scrapped tyres (as of Feb., 2007)
N.B.: 1. Weight is based on 10kg per tyre.
2. Cases having 1000 tyres are intended.
3. Any case with possibility of illegality is included.

15
N.B.: Imported tyres are not included in the original equipment tyres
1. Automobiles and Tyres⁄The number of automobiles registered as of year-end of 2006 was 75.53 million (increased 0.2% from the previous year),
and the tyre industry provided 72.01 million tyres (up 1.2% from the previous year), as replacement for those four-wheeled
automobiles.
¤Automobile production in Japan in 2006 was 11.48 million units (up 6.3% from the previous year) reflecting the continued
active demand for fuel-efficient Japanese cars in the overseas market suffering from the steep rise in the price of the crude
oil. The situation resulted in the increased sales of original equipment tyres (total for four-wheeled vehicles) to reach 48.47
million units (up 4.9% from the previous year).
Table 16: Automobile registrations and sales of replacement tyres in 2006
Figure 16: Trends in automobile registrations sales ofreplacement tyres
Automobile Registrations (×103) 2006/2005(%)
Passenger cars 57,521 100.8
Trucks and buses 18,011 98.6
Total 75,532 100.2
Replacement tyres Sales (×103) 2006/2005(%)
Passenger car tyres 51,931 101.2
Commercial vehicle tyres 20,070 100.9
Total 72,001 101.2
Source: Ministry of Land, Infrastructure and Transport, JATMA
0 0
10
20
30
40
50
60
70
80
90
10
20
30
40
50
60
70
80
90
1997 1998 1999 2000 2001 2002 2003 2004 2005 2006
Sales of replacement tyres(units×106)
Automobiles registration(units×106)
Automobiles registration
Sales of replacement tyres
Table 17: Automobile production and sales of original equipment tyres in 2006
Figure 17: Trends in automobile production and salesof original equipment tyres
Automobile Productions (×103) 2006/2005(%)
Passenger cars 9,756 108.2
Trucks and buses 1,728 96.9
Total 11,484 106.3
Original equipment tyres Sales (×103) 2006/2005(%)
Passenger car tyres 40,887 105.8
Commercial vehicle tyres 7,581 100.1
Total 48,468 104.9
Source: Japan Automobile Manufacturers Association, JATMA
0 0
10
20
30
40
50
60
70
80
90
10
20
30
40
50
60
70
80
90
1997 1998 1999 2000 2001 2002 2003 2004 2005 2006
Sales of original equipment tyres(units×106)
Automobile production(units×106)
Automobile production
Sales of original equipment tyres
Ⅴ Reference
16
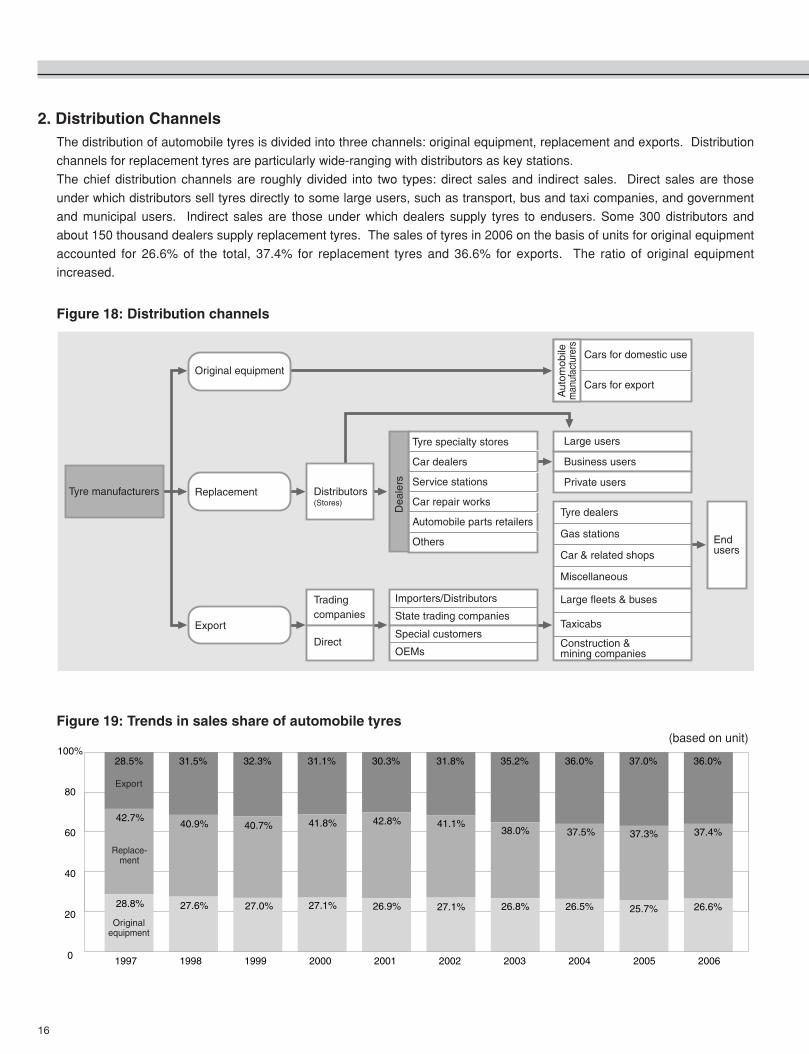
2. Distribution ChannelsThe distribution of automobile tyres is divided into three channels: original equipment, replacement and exports. Distribution
channels for replacement tyres are particularly wide-ranging with distributors as key stations.
The chief distribution channels are roughly divided into two types: direct sales and indirect sales. Direct sales are those
under which distributors sell tyres directly to some large users, such as transport, bus and taxi companies, and government
and municipal users. Indirect sales are those under which dealers supply tyres to endusers. Some 300 distributors and
about 150 thousand dealers supply replacement tyres. The sales of tyres in 2006 on the basis of units for original equipment
accounted for 26.6% of the total, 37.4% for replacement tyres and 36.6% for exports. The ratio of original equipment
increased.
Figure 18: Distribution channels
Tyre manufacturers
Original equipment
Replacement Distributors(Stores)
Export
Importers/Distributors
State trading companies
Special customers
OEMs
Endusers
Tradingcompanies
Direct
Tyre specialty stores
Car dealers
Service stations
Car repair works
Automobile parts retailers
Others
Large users
Business users
Private users
Dea
lers
Aut
omob
ilem
anuf
actu
rers
Cars for domestic use
Cars for export
Tyre dealers
Gas stations
Car & related shops
Miscellaneous
Large fleets & buses
Taxicabs
Construction &mining companies
Figure 19: Trends in sales share of automobile tyres (based on unit)
20062005
20
0
40
60
80
100%
20042003200220012000199919981997
26.6%
37.4%
36.0%
25.7%
37.3%
37.0%
26.5%
37.5%
36.0%
26.8%
38.0%
35.2%
27.1%
41.1%
31.8%
26.9%
42.8%
30.3%
27.1%
41.8%
31.1%
27.0%
40.7%
32.3%
27.6%
40.9%
31.5%
28.8%
42.7%
28.5%
Originalequipment
Export
Replace-ment

17
3. Raw MaterialsMore than 100 raw materials are used in the production of automobile tyres, including raw rubber, tyre cord, carbon black,
bead wire and compounding ingredients. Approximately 60% of these materials are based on petroleum products, principally
naphtha. As a result, the tyre industry is highly dependent on petroleum.
The percent distribution of raw materials used in tyres in 2006 was approximately the same as the previous year, rubber
constituting about half of a tyre (natural rubber 29% and synthetic rubber 22%), next comes reinforcing agent 26%, and then
tyre cord 13%.
Table 18: Basic composition
Figure 20: Tyre raw material weight composition
Composition Examples
Rubber Natural rubber, Synthetic rubber
Vulcanizing agent,
Compounding Vulcanizing accelerator,
ingredients Vulcanizing accelerator aid,
Antioxidant, Filler, Softener
Reinforcing agent Carbon black, Silica
Tyre cord Steel cord, Textile cord
Table 19: Consumption of main raw materials used inautomobile tyres in 2006
Raw Materials Consumption (tons) 2006/2005(%)
Steel 269,970 102.9
Nylon 24,843 102.2
Tyre cordPolyester 50,758 98.3
Rayon 3,909 108.9
Others 871 104.9
Total 350,351 102.3
Natural rubber 761,028 102.7
Rubber Synthetic rubber 563,200 102.6
Total 1,324,228 102.7
Reinforcing agent 669,799 101.1
Source: JATMA
Tyre cord 13.4%
Steel cord 10.3%Textile cord 3.1%
Rubber 50.5%
Natural rubber 29.0%Synthetic rubber 21.5%
Compounding ingredients 5.9%
Reinforcing agent 25.5%
Bead wire 4.7%
2006100%
V. Reference
18
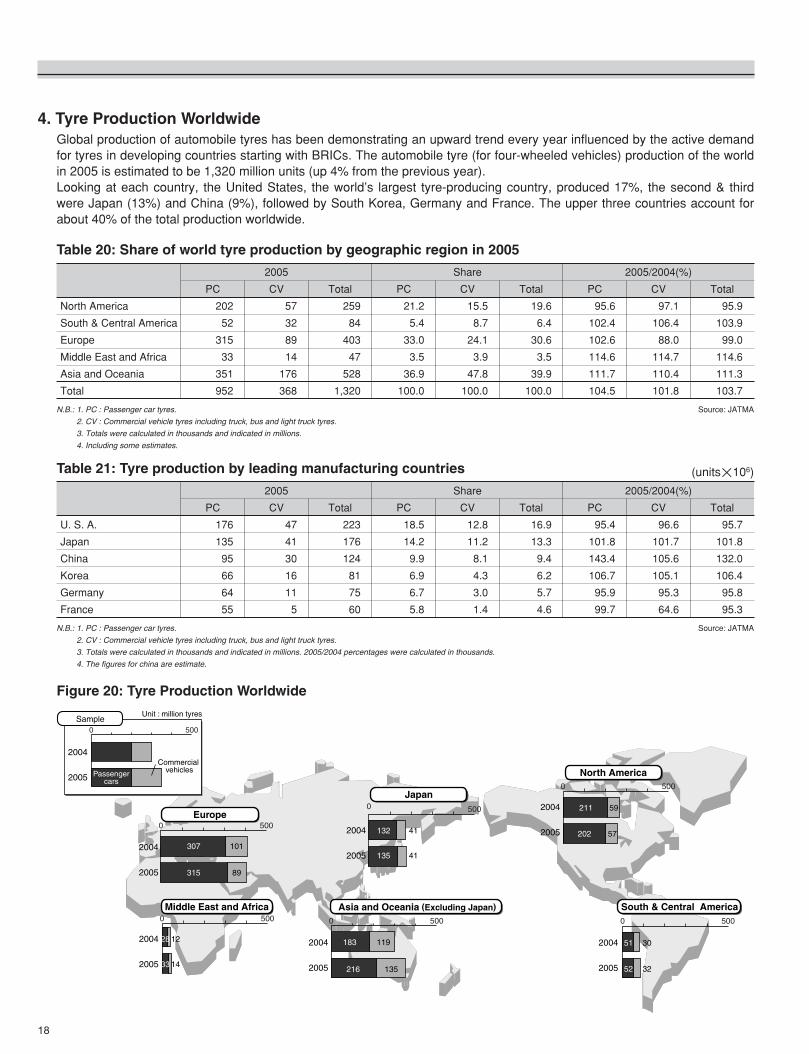
4. Tyre Production WorldwideGlobal production of automobile tyres has been demonstrating an upward trend every year influenced by the active demandfor tyres in developing countries starting with BRICs. The automobile tyre (for four-wheeled vehicles) production of the worldin 2005 is estimated to be 1,320 million units (up 4% from the previous year). Looking at each country, the United States, the world’s largest tyre-producing country, produced 17%, the second & thirdwere Japan (13%) and China (9%), followed by South Korea, Germany and France. The upper three countries account forabout 40% of the total production worldwide.
Table 20: Share of world tyre production by geographic region in 2005
Figure 20: Tyre Production Worldwide
N.B.: 1. PC : Passenger car tyres.
2. CV : Commercial vehicle tyres including truck, bus and light truck tyres.
3. Totals were calculated in thousands and indicated in millions.
4. Including some estimates.
5000
5000
50005000
Unit : million tyres
Passengercars
Commercial vehicles
307 101
12
14
315 89
28
33
183 119
132 41
211 59
51
52
30
32
202 57
135 41
216 135
5000
5000
5000
Europe
Sample
Japan
North America
South & Central AmericaMiddle East and Africa Asia and Oceania (Excluding Japan)
2004
2005
2004
2005
2004
2005
2004
2005
2004
2005
2004
2005
2004
2005
North America
2005 Share 2005/2004(%)
South & Central America
Europe
Middle East and Africa
Asia and Oceania
Total
PC CV Total PC CV Total PC CV Total
202 57 259 21.2 15.5 19.6 95.6 97.1 95.9
52 32 84 5.4 8.7 6.4 102.4 106.4 103.9
315 89 403 33.0 24.1 30.6 102.6 88.0 99.0
33 14 47 3.5 3.9 3.5 114.6 114.7 114.6
351 176 528 36.9 47.8 39.9 111.7 110.4 111.3
952 368 1,320 100.0 100.0 100.0 104.5 101.8 103.7
Source: JATMA
Table 21: Tyre production by leading manufacturing countries (units×106)
N.B.: 1. PC : Passenger car tyres.
2. CV : Commercial vehicle tyres including truck, bus and light truck tyres.
3. Totals were calculated in thousands and indicated in millions. 2005/2004 percentages were calculated in thousands.
4. The figures for china are estimate.
U. S. A.
2005 Share 2005/2004(%)
Japan
China
Korea
Germany
France
PC CV Total PC CV Total PC CV Total
176 47 223 18.5 12.8 16.9 95.4 96.6 95.7
135 41 176 14.2 11.2 13.3 101.8 101.7 101.8
95 30 124 9.9 8.1 9.4 143.4 105.6 132.0
66 16 81 6.9 4.3 6.2 106.7 105.1 106.4
64 11 75 6.7 3.0 5.7 95.9 95.3 95.8
55 5 60 5.8 1.4 4.6 99.7 64.6 95.3
Source: JATMA

19
Chairman: Tadanobu Nagumo, President, The Yokohama Rubber Co., Ltd.Vice-Chairman: Tetsuji Mino, President, Sumitomo Rubber Industries, Ltd.Executive Director: Ichiro Shimizu Established: September 1947 (incorporated in December 1968)Head Office: Toranomon No. 33 Mori Bldg., 8F, 8-21, Toranomon 3-chome, Minato-ku, Tokyo 105-0001, Japan
Tel.: 03 (3435) 9091 Fax: 03 (3435) 9097Bridgestone Corporation
Members: Sumitomo Rubber Industries, Ltd.The Yokohama Rubber Co., Ltd.Toyo Tire & Rubber Co., Ltd.Nihon Michelin Tire Co., Ltd.
OrganizationUnder General Assembly and Board of Directors, four committees are established; Executive, Technical, Export, and 3RPromotion. The committees have relevant subcommittees which promoting their activities such as surveys and studies.
GeneralAssembly
Board ofDirectors
Board ofInspectors
Executive Committee
Technical Committee
Export Committee
3R Promotion Committee
Replace Market Subcommittee
Research & Statistics Subcommittee
Public Relations Subcommittee
Logistics & Packaging Subcommittee
Intellectual Property Subcommittee
Design Subcommittee
Tyre Standards Verification Subcommittee
Tyre Road Noise andPerformance Testing Subcommittee
Material Technical Subcommittee
Environment Subcommittee
Tyre Inspection &Technical Service Subcommittee
Tyre Standards Committee
Export Affairs Subcommittee
3R- Subcommittee 1
3R- Subcommittee 2
3R- Subcommittee 3
3R- Pavement Subcommittee
3R- Powdered Rubber Subcommittee
The Japan Automobile Tyre Manufacturers Association, Inc.
20
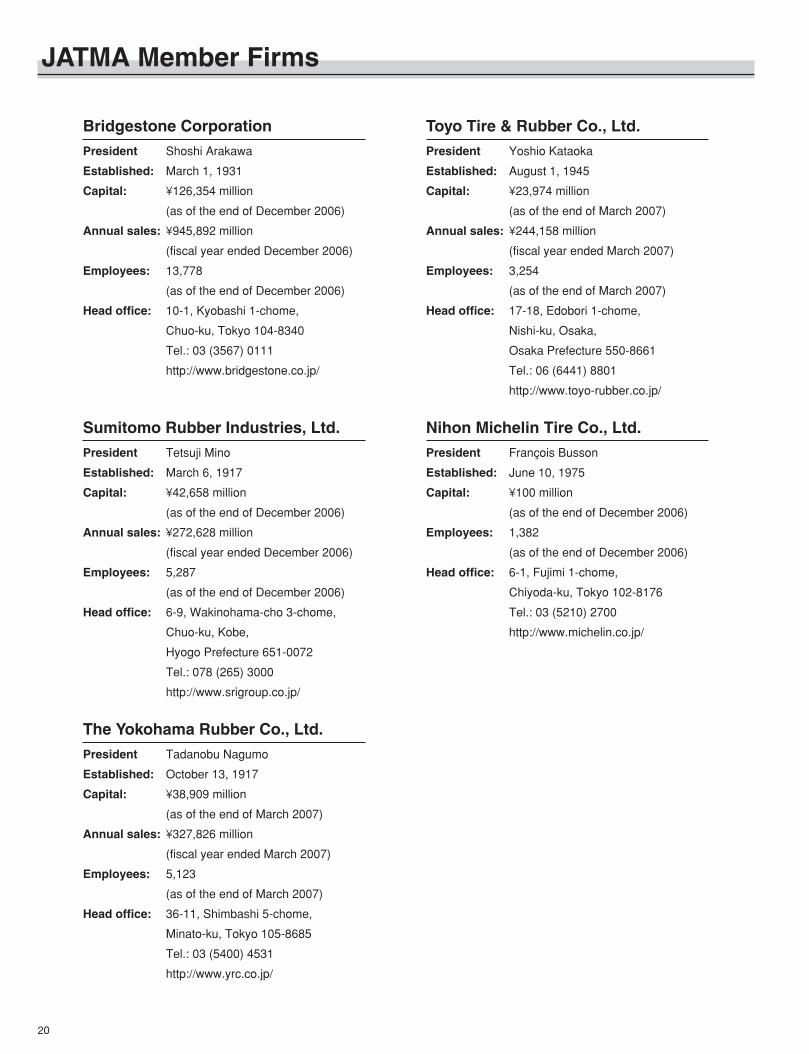
Bridgestone CorporationPresident Shoshi Arakawa
Established: March 1, 1931
Capital: ¥126,354 million
(as of the end of December 2006)
Annual sales: ¥945,892 million
(fiscal year ended December 2006)
Employees: 13,778
(as of the end of December 2006)
Head office: 10-1, Kyobashi 1-chome,
Chuo-ku, Tokyo 104-8340
Tel.: 03 (3567) 0111
http://www.bridgestone.co.jp/
Toyo Tire & Rubber Co., Ltd.President Yoshio Kataoka
Established: August 1, 1945
Capital: ¥23,974 million
(as of the end of March 2007)
Annual sales: ¥244,158 million
(fiscal year ended March 2007)
Employees: 3,254
(as of the end of March 2007)
Head office: 17-18, Edobori 1-chome,
Nishi-ku, Osaka,
Osaka Prefecture 550-8661
Tel.: 06 (6441) 8801
http://www.toyo-rubber.co.jp/
Sumitomo Rubber Industries, Ltd.President Tetsuji Mino
Established: March 6, 1917
Capital: ¥42,658 million
(as of the end of December 2006)
Annual sales: ¥272,628 million
(fiscal year ended December 2006)
Employees: 5,287
(as of the end of December 2006)
Head office: 6-9, Wakinohama-cho 3-chome,
Chuo-ku, Kobe,
Hyogo Prefecture 651-0072
Tel.: 078 (265) 3000
http://www.srigroup.co.jp/
Nihon Michelin Tire Co., Ltd.President François Busson
Established: June 10, 1975
Capital: ¥100 million
(as of the end of December 2006)
Employees: 1,382
(as of the end of December 2006)
Head office: 6-1, Fujimi 1-chome,
Chiyoda-ku, Tokyo 102-8176
Tel.: 03 (5210) 2700
http://www.michelin.co.jp/
The Yokohama Rubber Co., Ltd.President Tadanobu Nagumo
Established: October 13, 1917
Capital: ¥38,909 million
(as of the end of March 2007)
Annual sales: ¥327,826 million
(fiscal year ended March 2007)
Employees: 5,123
(as of the end of March 2007)
Head office: 36-11, Shimbashi 5-chome,
Minato-ku, Tokyo 105-8685
Tel.: 03 (5400) 4531
http://www.yrc.co.jp/
JATMA Member Firms

Shinshiro Plant (Yokohama)
Shinshirominami Plant (Yokohama)
Nagoya Plant (Sumitomo)
Mie Plant (Yokohama)
Kuwana Plant (Toyo)
Hikone Plant (Bridgestone)
Izumiohtsu Plant (Sumitomo)
Onomichi Plant (Yokohama)
Hofu Plant (Bridgestone)
Shimonoseki Plant (Bridgestone)
Amagi Plant (Bridgestone)
Kurume Plant (Bridgestone)
Tosu Plant (Bridgestone)
Sendai Plant (Toyo)
Shirakawa Plant (Sumitomo)
Nasu Plant (Bridgestone)
Tochigi Plant (Bridgestone)
Ohta Plant (Nihon Michelin)
Tokyo Plant (Bridgestone)
Mishima Plant (Yokohama)
Miyazaki Plant (Sumitomo)
Jul. 2007
2-13 Higashi, Ohdori, Chuo-ku, Sapporo, Hokkaido, JAPAN 060-0041 1-7-8 Ichiban-cho, Aoba-ku, Sendai, Miyagi, JAPAN 980-08111-9-6 Higashiueno, Taito-ku, Tokyo, JAPAN 110-001528-15 Takebashi-cho, Nakamura-ku, Nagoya, Aichi, JAPAN 453-0016 1-9-20 Dohshin, Kita-ku, Osaka, Osaka, JAPAN 530-00358-18 Fukuro-machi, Naka-ku, Hiroshima, Hiroshima, JAPAN 730-00362-20-4 Higashihie, Hakata-Ku, Fukuoka, Fukuoka, JAPAN 812-0007
Hokkaido BranchTohoku BranchKanto BranchChubu BranchKinki BranchChugoku BranchKyushu Branch
BranchesPhone. 011-281-3671 Fax. 011-241-4889Phone. 022-227-8118 Fax. 022-222-6979Phone. 03-3832-8661 Fax. 03-3832-8663Phone. 052-452-3907 Fax. 052-452-3908Phone. 06-6351-6747 Fax. 06-6351-2519Phone. 082-247-1524 Fax. 082-247-9541Phone. 092-411-3536 Fax. 092-411-7781
The Japan Automobile Tyre Manufacturers Association, Inc.http: / /www.jatma.or. jp
Head Office No.33 Mori Bldg. 8Floor3-8-21 Toranomon, Minato-ku, Tokyo, JAPAN 105-0001
General Affairs Department (General Affairs, Accounting) Phone. 03-3435-9091 Fax. 03-3435-9097(Public Relations) Phone. 03-3435-9092 Fax. 03-3435-9097
Technical Department Phone. 03-3435-9094 Fax. 03-3435-9097(Inspection • Accident Prevention) Phone. 03-3435-9092 Fax. 03-3435-9097
Business Affairs Department Phone. 03-3435-9095 Fax. 03-3435-9097Recycling Division Phone. 03-5408-5051 Fax. 03-5408-5053
Distribution of Member Firms’ Automobile Tyre Plants(May 2007)

THE JAPAN AUTOMOBILE TYRE MANUFACTURERS ASSOCIATION,INC.
History Tables of Statistics【Contents 】
1.
2.
3.
4.
5.
6.
7.
8.
Production of automobile tyres and tubes
Export shipment of automobile tyres and tubes
Sales of summer tyres and winter tyres for replacement (for four-wheeled vehicles)
Imports of tyres and tubes based on Ministry of Finance customs statistics
Domestics shipment of automobile tyres and tubes
Sales of original equipment tyres
Sales of replacement tyres
Exports of tyres and tubes based on Ministry of Finance customs statistics

Production of automobile tyres and tubestyres : ×103, rubber : tons, ( ) : year to year comparison %
1997 1998 1999 2000 2001 2002 2003 2004 2005 200611,067 11,528 12,276 11,801 11,324 12,184 13,256 14,020 14,639 14,837(99.5) (104.2) (106.5) (96.1) (96.0) (107.6) (108.8) (105.8) (104.4) (101.4)
287,380 302,575 323,307 306,806 286,237 310,704 341,463 358,109 371,681 380,344(98.0) (105.3) (106.9) (94.9) (93.3) (108.5) (109.9) (104.9) (103.8) (102.3)
34,136 30,632 30,444 30,906 29,130 28,386 26,628 26,681 26,771 26,485(101.5) (89.7) (99.4) (101.5) (94.3) (97.4) (93.8) (100.2) (100.3) (98.9)
207,352 187,984 185,883 189,080 175,918 178,442 171,628 176,267 178,709 176,636(102.9) (90.7) (98.9) (101.7) (93.0) (101.4) (96.2) (102.7) (101.4) (98.8)
115,162 114,607 118,697 121,725 122,449 127,441 130,328 132,386 134,806 134,594(104.2) (99.5) (103.6) (102.6) (100.6) (104.1) (102.3) (101.6) (101.8) (99.8)
458,015 462,991 483,890 504,915 511,242 550,647 572,596 592,779 617,709 625,274(106.1) (101.1) (104.5) (104.3) (101.3) (107.7) (104.0) (103.5) (104.2) (101.2)
597 515 500 513 509 495 497 512 519 554(108.3) (86.3) (97.1) (102.6) (99.2) (97.2) (100.4) (103.0) (101.4) (106.7)
110,900 108,228 101,540 112,138 107,354 111,489 115,655 118,107 122,949 130,611(102.9) (97.6) (93.8) (110.4) (95.7) (103.9) (103.7) (102.1) (104.1) (106.2)
1,227 1,053 1,041 1,094 1,040 972 982 936 827 721(106.3) (85.8) (98.9) (105.1) (95.1) (93.5) (101.0) (95.3) (88.4) (87.2)11,971 10,202 9,887 11,239 10,583 10,113 10,209 9,864 9,395 8,721(108.9) (85.2) (96.9) (113.7) (94.2) (95.6) (100.9) (96.6) (95.2) (92.8)
836 681 772 692 605 549 582 608 630 614(91.5) (81.5) (113.4) (89.6) (87.4) (90.7) (106.0) (104.5) (103.6) (97.5)6,680 5,232 6,200 5,030 4,323 4,344 4,615 5,153 5,486 5,503(96.8) (78.3) (118.5) (81.1) (85.9) (100.5) (106.2) (111.7) (106.5) (100.3)5,741 6,072 5,975 6,618 6,697 6,376 6,158 6,120 6,334 6,405
(100.1) (105.8) (98.4) (110.8) (101.2) (95.2) (96.6) (99.4) (103.5) (101.1)12,043 12,958 12,964 14,823 15,230 14,311 14,187 14,328 15,147 15,649(101.7) (107.6) (100.0) (114.3) (102.7) (94.0) (99.1) (101.0) (105.7) (103.3)
1,131 1,467 1,610 1,594 1,637 1,954 1,670 2,096 1,989 1,422(105.0) (129.7) (109.7) (99.0) (102.7) (119.4) (85.5) (125.5) (94.9) (71.5)
3,538 4,691 5,025 4,791 4,925 5,877 5,155 6,713 6,380 4,615(106.8) (132.6) (107.1) (95.3) (102.8) (119.3) (87.7) (130.2) (95.0) (72.3)
7,236 5,322 4,892 4,110 3,632 3,883 4,100 3,846 3,948 4,420(91.4) (73.5) (91.9) (84.0) (88.4) (106.9) (105.6) (93.8) (102.7) (112.0)
169,897 166,555 171,315 174,943 173,391 178,357 180,101 183,359 186,515 185,632(103.2) (98.0) (102.9) (102.1) (99.1) (102.9) (101.0) (101.8) (101.7) (99.5)
1,105,115 1,100,183 1,133,588 1,152,932 1,119,444 1,189,810 1,239,608 1,285,166 1,331,404 1,351,773(102.8) (99.6) (103.0) (101.7) (97.1) (106.3) (104.2) (103.7) (103.6) (101.5)
N.B.: 1. Source : JATMA (Total of members only)N.B.: 2. 2001 and following years had a category shift between truck and bus tyres and light truck tyres
Flaps and rim-bands
Total
Industrial tyres
Agricultural tyres
Motorcycle tyres
Cart tyres
Truck and bus tyres
Light truck tyres
Passenger car tyres
Off-the-road tyres
Rubber
Tyres
Rubber
Tyres
Rubber
Tyres
Rubber
Tyres
Rubber
Tyres
Rubber
Rubber
Tyres
Rubber
Tyres
Tyres
Rubber
Tyres
Rubber

Domestics shipment of automobile tyres and tubestyres : ×103, rubber : tons, ( ) : year to year comparison %
1997 1998 1999 2000 2001 2002 2003 2004 2005 20065,146 4,348 4,520 5,050 5,763 5,735 5,884 6,317 6,441 6,687
(100.4) (84.5) (104.0) (111.7) (114.1) (99.5) (102.6) (107.4) (102.0) (103.8)124,954 106,622 112,118 123,644 130,391 128,834 131,007 139,788 141,192 147,320
(98.6) (85.3) (105.2) (110.3) (105.5) (98.8) (101.7) (106.7) (101.0) (104.3)26,859 23,610 23,081 22,980 20,593 18,839 17,446 17,288 16,934 17,070(100.0) (87.9) (97.8) (99.6) (89.6) (91.5) (92.6) (99.1) (98.0) (100.8)
151,162 131,981 127,465 127,344 109,093 100,336 94,121 96,668 93,992 94,671(100.8) (87.3) (96.6) (99.9) (85.7) (92.0) (93.8) (102.7) (97.2) (100.7)82,832 79,187 81,270 84,258 85,618 87,860 84,587 84,140 81,326 83,538(102.8) (95.6) (102.6) (103.7) (101.6) (102.6) (96.3) (99.5) (96.7) (102.7)
321,142 311,095 319,523 331,732 343,109 360,881 348,198 349,752 342,992 360,177(104.3) (96.9) (102.7) (103.8) (103.4) (105.2) (96.5) (100.4) (98.1) (105.0)
236 177 178 184 183 165 168 192 207 215(97.1) (75.0) (100.6) (103.4) (99.5) (90.2) (101.8) (114.3) (107.8) (103.9)
14,755 11,207 11,275 11,805 11,323 10,732 12,696 15,573 17,208 16,758(96.1) (76.0) (100.6) (104.7) (95.9) (94.8) (118.3) (122.7) (110.5) (97.4)
952 841 815 871 818 778 789 855 785 726(103.5) (88.3) (96.9) (106.9) (93.9) (95.1) (101.4) (108.4) (91.8) (92.5)
8,444 7,392 7,087 7,724 7,333 7,048 7,715 8,437 8,267 8,079(105.8) (87.5) (95.9) (109.0) (94.9) (96.1) (109.5) (109.4) (98.0) (97.7)
752 615 674 663 575 534 550 553 602 592(95.4) (81.8) (109.6) (98.4) (86.7) (92.9) (103.0) (100.5) (108.9) (98.3)6,040 4,766 5,396 4,745 3,989 4,014 4,202 4,693 5,027 5,124
(103.7) (78.9) (113.2) (87.9) (84.1) (100.6) (104.7) (111.7) (107.1) (101.9)3,649 3,701 3,486 3,574 3,563 3,373 2,744 2,733 2,904 2,934
(102.8) (101.4) (94.2) (102.5) (99.7) (94.7) (81.4) (99.6) (106.3) (101.0)7,227 7,497 7,208 7,542 7,440 6,941 6,158 6,299 6,866 7,101
(106.2) (103.7) (96.1) (104.6) (98.6) (93.3) (88.7) (102.3) (109.0) (103.4)825 1,037 1,259 1,328 1,379 1,577 1,313 1,710 1,469 959
(117.0) (125.7) (121.4) (105.5) (103.8) (114.4) (83.3) (130.2) (85.9) (65.3)2,537 3,308 3,942 4,054 4,191 4,714 3,944 5,314 4,546 2,919
(118.7) (130.4) (119.2) (102.8) (103.4) (112.5) (83.7) (134.7) (85.5) (64.2)2,337 1,742 1,502 1,405 1,245 1,265 1,117 1,088 1,058 1,125(89.7) (74.5) (86.2) (93.5) (88.6) (101.6) (88.3) (97.4) (97.2) (106.3)
121,251 113,516 115,283 118,908 118,492 118,861 113,481 113,788 110,668 112,721(102.1) (93.6) (101.6) (103.1) (99.7) (100.3) (95.5) (100.3) (97.3) (101.9)
638,598 585,610 595,516 619,995 618,114 624,765 609,158 627,612 621,148 643,274(102.1) (91.7) (101.7) (104.1) (99.7) (101.1) (97.5) (103.0) (99.0) (103.6)
N.B.: 1. Source : JATMA (Total of members only)N.B.: 2. 2001 and following years had a category shift between truck and bus tyres and light truck tyres.
Agricultural tyres
Truck and bus tyres
Total
Flaps and rim-bands
Cart tyres
Motorcycle tyres
Industrial tyres
Off-the-road tyres
Passenger car tyres
Light truck tyres
Rubber
Tyres
Rubber
Rubber
Tyres
Rubber
Tyres
Rubber
Tyres
Rubber
Tyres
Rubber
Tyres
Rubber
Tyres
Tyres
Rubber
Tyres
Rubber
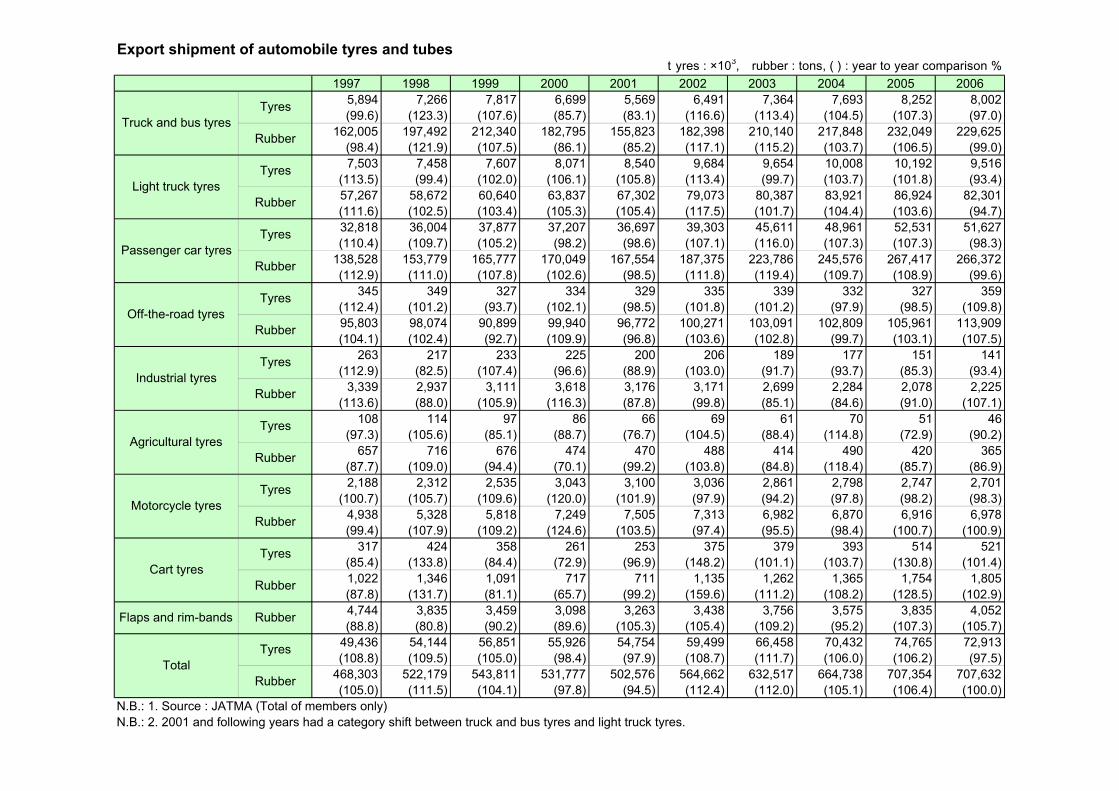
Export shipment of automobile tyres and tubestyres : ×103, rubber : tons, ( ) : year to year comparison %
1997 1998 1999 2000 2001 2002 2003 2004 2005 20065,894 7,266 7,817 6,699 5,569 6,491 7,364 7,693 8,252 8,002(99.6) (123.3) (107.6) (85.7) (83.1) (116.6) (113.4) (104.5) (107.3) (97.0)
162,005 197,492 212,340 182,795 155,823 182,398 210,140 217,848 232,049 229,625(98.4) (121.9) (107.5) (86.1) (85.2) (117.1) (115.2) (103.7) (106.5) (99.0)7,503 7,458 7,607 8,071 8,540 9,684 9,654 10,008 10,192 9,516
(113.5) (99.4) (102.0) (106.1) (105.8) (113.4) (99.7) (103.7) (101.8) (93.4)57,267 58,672 60,640 63,837 67,302 79,073 80,387 83,921 86,924 82,301(111.6) (102.5) (103.4) (105.3) (105.4) (117.5) (101.7) (104.4) (103.6) (94.7)32,818 36,004 37,877 37,207 36,697 39,303 45,611 48,961 52,531 51,627(110.4) (109.7) (105.2) (98.2) (98.6) (107.1) (116.0) (107.3) (107.3) (98.3)
138,528 153,779 165,777 170,049 167,554 187,375 223,786 245,576 267,417 266,372(112.9) (111.0) (107.8) (102.6) (98.5) (111.8) (119.4) (109.7) (108.9) (99.6)
345 349 327 334 329 335 339 332 327 359(112.4) (101.2) (93.7) (102.1) (98.5) (101.8) (101.2) (97.9) (98.5) (109.8)95,803 98,074 90,899 99,940 96,772 100,271 103,091 102,809 105,961 113,909(104.1) (102.4) (92.7) (109.9) (96.8) (103.6) (102.8) (99.7) (103.1) (107.5)
263 217 233 225 200 206 189 177 151 141(112.9) (82.5) (107.4) (96.6) (88.9) (103.0) (91.7) (93.7) (85.3) (93.4)
3,339 2,937 3,111 3,618 3,176 3,171 2,699 2,284 2,078 2,225(113.6) (88.0) (105.9) (116.3) (87.8) (99.8) (85.1) (84.6) (91.0) (107.1)
108 114 97 86 66 69 61 70 51 46(97.3) (105.6) (85.1) (88.7) (76.7) (104.5) (88.4) (114.8) (72.9) (90.2)
657 716 676 474 470 488 414 490 420 365(87.7) (109.0) (94.4) (70.1) (99.2) (103.8) (84.8) (118.4) (85.7) (86.9)2,188 2,312 2,535 3,043 3,100 3,036 2,861 2,798 2,747 2,701
(100.7) (105.7) (109.6) (120.0) (101.9) (97.9) (94.2) (97.8) (98.2) (98.3)4,938 5,328 5,818 7,249 7,505 7,313 6,982 6,870 6,916 6,978(99.4) (107.9) (109.2) (124.6) (103.5) (97.4) (95.5) (98.4) (100.7) (100.9)
317 424 358 261 253 375 379 393 514 521(85.4) (133.8) (84.4) (72.9) (96.9) (148.2) (101.1) (103.7) (130.8) (101.4)1,022 1,346 1,091 717 711 1,135 1,262 1,365 1,754 1,805(87.8) (131.7) (81.1) (65.7) (99.2) (159.6) (111.2) (108.2) (128.5) (102.9)4,744 3,835 3,459 3,098 3,263 3,438 3,756 3,575 3,835 4,052(88.8) (80.8) (90.2) (89.6) (105.3) (105.4) (109.2) (95.2) (107.3) (105.7)
49,436 54,144 56,851 55,926 54,754 59,499 66,458 70,432 74,765 72,913(108.8) (109.5) (105.0) (98.4) (97.9) (108.7) (111.7) (106.0) (106.2) (97.5)
468,303 522,179 543,811 531,777 502,576 564,662 632,517 664,738 707,354 707,632(105.0) (111.5) (104.1) (97.8) (94.5) (112.4) (112.0) (105.1) (106.4) (100.0)
N.B.: 1. Source : JATMA (Total of members only)N.B.: 2. 2001 and following years had a category shift between truck and bus tyres and light truck tyres.
Total
Flaps and rim-bands
Cart tyres
Motorcycle tyres
Agricultural tyres
Industrial tyres
Off-the-road tyres
Passenger car tyres
Light truck tyres
Truck and bus tyres
Rubber
Tyres
Rubber
Rubber
Tyres
Rubber
Tyres
Rubber
Tyres
Rubber
Tyres
Rubber
Tyres
Rubber
Tyres
Rubber
Tyres
Rubber
Tyres
Sales of original equipment tyrestyres : ×103, ( ) : year to year comparison %
1997 1998 1999 2000 2001 2002 2003 2004 2005 2006846 549 449 554 728 776 1,236 1,115 1,207 1,282
(106.5) (64.9) (81.8) (123.4) (131.4) (106.6) (159.3) (90.2) (108.3) (106.2)9,351 7,739 7,131 7,013 6,547 6,066 6,533 6,457 6,370 6,299(99.4) (82.8) (92.1) (98.3) (93.4) (92.7) (107.7) (98.8) (98.7) (98.9)
34,001 32,997 33,801 35,088 35,380 37,954 37,546 38,986 38,633 40,887(107.7) (97.0) (102.4) (103.8) (100.8) (107.3) (98.9) (103.8) (99.1) (105.8)44,198 41,285 41,381 42,655 42,655 44,796 45,315 46,558 46,210 48,468(105.8) (93.4) (100.2) (103.1) (100.0) (105.0) (101.2) (102.7) (99.3) (104.9)
94 67 64 68 66 58 54 67 77 90(92.2) (71.3) (95.5) (106.3) (97.1) (87.9) (93.1) (124.1) (114.9) (116.9)
368 304 275 303 281 259 281 319 403 426(103.7) (82.6) (90.5) (110.2) (92.7) (92.2) (108.5) (113.5) (126.3) (105.7)
848 718 761 693 598 560 554 581 631 642(95.9) (84.7) (106.0) (91.1) (86.3) (93.6) (98.9) (104.9) (108.6) (101.7)2,563 2,623 2,406 2,467 2,277 2,158 1,856 2,004 2,346 2,485
(103.6) (102.3) (91.7) (102.5) (92.3) (94.8) (86.0) (108.0) (117.1) (105.9)735 986 1,203 1,276 1,327 1,518 1,305 1,667 1,531 1,276
(115.6) (134.1) (122.0) (106.1) (104.0) (114.4) (86.0) (127.7) (91.8) (83.3)48,806 45,983 46,090 47,462 47,204 49,349 49,365 51,196 51,198 53,387(105.6) (94.2) (100.2) (103.0) (99.5) (104.5) (100.0) (103.7) (100.0) (104.3)
N.B.: 1. Source : JATMA (Total of members only)N.B.: 2. 2001 and following years had a category shift between truck and bus tyres and light truck tyres.N.B.: 3. The figures don’t include imported tyres.
Total
Cart tyres
Motorcycle tyres
Agricultural tyres
Truck and bus tyres
Passenger car tyres
Light truck tyres
Industrial tyres
Off-the-road tyres
Total for four-wheeled vehicle tyres

Sales of replacement tyrestyres : ×103, ( ) : year to year comparison %
1997 1998 1999 2000 2001 2002 2003 2004 2005 20064,433 3,983 4,214 4,322 5,375 5,200 4,893 5,401 5,494 5,608
(100.6) (89.8) (105.8) (102.6) (124.4) (96.7) (94.1) (110.4) (101.7) (102.1)17,777 16,465 16,697 17,163 15,965 15,027 13,701 14,368 14,389 14,462(189.0) (92.6) (101.4) (102.8) (93.0) (94.1) (91.2) (104.9) (100.1) (100.5)47,650 45,836 47,407 49,361 51,648 52,426 49,037 49,486 51,299 51,931(100.4) (96.2) (103.4) (104.1) (104.6) (101.5) (93.5) (100.9) (103.7) (101.2)69,860 66,284 68,318 70,846 72,988 72,653 67,631 69,255 71,182 72,001(114.0) (94.9) (103.1) (103.7) (103.0) (99.5) (93.1) (102.4) (102.8) (101.2)
140 117 119 124 120 113 113 118 128 131(97.2) (83.6) (101.7) (104.2) (96.8) (94.2) (100.0) (104.4) (108.5) (102.3)
845 763 765 800 767 738 742 771 770 756(104.2) (90.3) (100.3) (104.6) (95.9) (96.2) (100.5) (103.9) (99.9) (98.2)
208 177 182 214 203 197 200 204 195 167(100.0) (85.1) (102.8) (117.6) (94.9) (97.0) (101.5) (102.0) (95.6) (85.6)
2,250 2,257 2,324 2,406 2,393 2,341 2,155 2,239 2,198 2,147(106.0) (100.3) (103.0) (103.5) (99.5) (97.8) (92.1) (103.9) (98.2) (97.7)
79 64 60 55 54 50 45 47 46 40(91.9) (81.0) (93.8) (91.7) (98.2) (92.6) (90.0) (104.4) (97.9) (87.0)
73,382 69,662 71,768 74,445 76,525 76,092 70,886 72,634 74,519 75,242(113.5) (94.9) (103.0) (103.7) (102.8) (99.4) (93.2) (102.5) (102.6) (101.0)
N.B.: 1. Source : JATMA (Total of members only)N.B.: 2. 2001 and following years had a category shift between truck and bus tyres and light truck tyres.N.B.: 3. The figures include imported tyres.
Total
Cart tyres
Motorcycle tyres
Agricultural tyres
Light truck tyres
Truck and bus tyres
Industrial tyres
Off-the-road tyres
Total for four-wheeled vehicle tyres
Passenger car tyres

Sales of summer tyres and winter tyres for replacement (for four-wheeled vehicles)tyres : ×103, ( ) : year to year comparison %
1997 1998 1999 2000 2001 2002 2003 2004 2005 20064,433 3,983 4,214 4,322 5,375 5,200 4,893 5,401 5,494 5,608
(100.6) (89.8) (105.8) (102.6) (124.4) (96.7) (94.1) (110.4) (101.7) (102.1)1,755 2,936 3,036 3,025 3,634 3,494 3,248 3,490 3,465 3,401(95.9) (167.3) (103.4) (99.6) (120.1) (96.1) (93.0) (107.5) (99.3) (98.2)2,678 1,047 1,178 1,297 1,741 1,706 1,645 1,911 2,029 2,207
(103.9) (39.1) (112.5) (110.1) (134.2) (98.0) (96.4) (116.2) (106.2) (108.8)17,777 16,465 16,697 17,163 15,965 15,027 13,701 14,368 14,389 14,462(99.6) (92.6) (101.4) (102.8) (93.0) (94.1) (91.2) (104.9) (100.1) (100.5)
12,345 12,505 12,666 12,696 11,668 10,975 10,112 10,297 10,245 9,858(99.6) (101.3) (101.3) (100.2) (91.9) (94.1) (92.1) (101.8) (99.5) (96.2)5,432 3,960 4,031 4,467 4,297 4,052 3,589 4,071 4,144 4,604(99.7) (72.9) (101.8) (110.8) (96.2) (94.3) (88.6) (113.4) (101.8) (111.1)
47,650 45,836 47,407 49,361 51,648 52,426 49,037 49,486 51,299 51,931(100.4) (96.2) (103.4) (104.1) (104.6) (101.5) (93.5) (100.9) (103.7) (101.2)32,512 32,466 33,303 35,246 35,727 36,048 34,761 35,023 35,343 34,417(101.0) (99.9) (102.6) (105.8) (101.4) (100.9) (96.4) (100.8) (100.9) (97.4)15,138 13,370 14,104 14,115 15,921 16,378 14,276 14,463 15,956 17,514(99.2) (88.3) (105.5) (100.1) (112.8) (102.9) (87.2) (101.3) (110.3) (109.8)
69,860 66,284 68,318 70,846 72,988 72,653 67,631 69,255 71,182 72,001(100.2) (94.9) (103.1) (103.7) (103.0) (99.5) (93.1) (102.4) (102.8) (101.2)46,612 47,907 49,005 50,967 51,029 50,517 48,121 48,810 49,053 47,675(100.4) (102.8) (102.3) (104.0) (100.1) (99.0) (95.3) (101.4) (100.5) (97.2)23,248 18,377 19,313 19,879 21,959 22,136 19,510 20,445 22,129 24,326(99.8) (79.0) (105.1) (102.9) (110.5) (100.8) (88.1) (104.8) (108.2) (109.9)
N.B.: 1. Source : JATMA (Total of members only)N.B.: 2. 2001 and following years had a category shift between truck and bus tyres and light truck tyres.N.B.: 3. 1998 and following years had all season tyres in the summer tyre category.
Total
Passenger car tyres
Light truck tyres
Truck and bus tyres
Winter
Summer
Total
Winter
Summer
Total
Winter
Summer
Total
Winter
Summer
Total

Exports of tyres and tubes based on Ministry of Finance customs statisticstyres : ×103, value : FOB dollar ×103, ( ) : year to year comparison %
1997 1998 1999 2000 2001 2002 2003 2004 2005 20069,099 7,044 6,780 6,752 6,955 8,308 9,263 9,718 8,549 9,002
(112.3) (77.4) (96.3) (99.6) (103.0) (119.5) (111.5) (104.9) (88.0) (105.3)517,155 369,504 403,460 388,728 362,435 435,717 516,696 560,008 546,351 626,039(103.7) (71.4) (109.2) (96.3) (93.2) (120.2) (118.6) (108.4) (97.6) (114.6)
6,421 6,119 6,075 6,429 6,615 7,764 9,093 10,265 11,416 11,775(96.6) (95.3) (99.3) (105.8) (102.9) (117.4) (117.1) (112.9) (111.2) (103.1)
477,897 392,844 356,227 362,412 370,692 416,413 492,264 570,464 688,061 787,641(88.4) (82.2) (90.7) (101.7) (102.3) (112.3) (118.2) (115.9) (120.6) (114.5)
13,565 18,512 17,488 17,004 16,889 16,094 18,240 19,029 20,567 20,275(107.7) (136.5) (94.5) (97.2) (99.3) (95.3) (113.3) (104.3) (108.1) (98.6)
677,402 831,506 795,890 739,407 699,251 708,867 959,556 1,094,021 1,222,552 1,288,941(90.0) (122.7) (95.7) (92.9) (94.6) (101.4) (135.4) (114.0) (111.7) (105.4)
14,259 16,245 20,390 19,996 16,368 20,589 22,929 23,714 26,484 24,792(108.4) (113.9) (125.5) (98.1) (81.9) (125.8) (111.4) (103.4) (111.7) (93.6)
879,854 1,021,786 1,180,331 1,152,867 899,766 1,131,111 1,261,722 1,397,852 1,604,256 1,659,175(107.5) (116.1) (115.5) (97.7) (78.0) (125.7) (111.5) (110.8) (114.8) (103.4)
2,257 2,473 2,065 2,443 2,689 2,074 2,448 2,978 3,559 3,673(123.4) (109.6) (83.5) (118.3) (110.1) (77.1) (118.0) (121.7) (119.5) (103.2)
238,915 240,628 184,932 209,371 192,740 160,502 180,845 213,858 255,035 295,779(117.1) (100.7) (76.9) (113.2) (92.1) (83.3) (112.7) (118.3) (119.3) (116.0)
2,194 2,565 2,295 1,968 2,150 2,063 2,012 2,171 2,253 2,142(132.8) (116.9) (89.5) (85.8) (109.2) (96.0) (97.5) (107.9) (103.7) (95.1)
208,945 208,131 188,965 149,739 153,593 161,499 198,408 231,973 243,941 247,077(117.2) (99.6) (90.8) (79.2) (102.6) (105.1) (122.9) (116.9) (105.2) (101.3)
2,376 2,631 2,739 2,817 3,303 3,516 3,853 3,694 3,711 3,683(106.4) (110.7) (104.1) (102.8) (117.3) (106.4) (109.6) (95.9) (100.5) (99.2)
261,320 220,661 220,677 214,053 223,002 245,870 302,139 333,283 363,509 373,273(97.2) (84.4) (100.0) (97.0) (104.2) (110.3) (122.9) (110.3) (109.1) (102.7)
50,171 55,589 57,832 57,409 54,969 60,408 67,838 71,569 76,539 75,342(108.6) (110.8) (104.0) (99.3) (95.7) (109.9) (112.3) (105.5) (106.9) (98.4)
3,261,488 3,285,059 3,330,482 3,216,577 2,901,479 3,259,979 3,911,630 4,401,459 4,923,705 5,277,926(100.0) (100.7) (101.4) (96.6) (90.2) (112.4) (120.0) (112.5) (111.9) (107.2)
Source: Ministry of Finance customs export records
Total
Oceania
Africa
South andCentral America
North America
Europe
Middle East
AsiaTyres
Value
Tyres
Value
Tyres
Value
Tyres
Value
Tyres
Value
Tyres
Value
Tyres
Value
Tyres
Value

Imports of tyres and tubes based on Ministry of Finance customs statisticstyres : ×103, value : CIF yen×104, ( ) : year to year comparison %
1997 1998 1999 2000 2001 2002 2003 2004 2005 200612,901 11,893 10,334 10,547 11,321 13,618 14,173 18,830 23,810 25,925(116.2) (92.2) (86.9) (102.1) (107.3) (120.3) (104.1) (132.9) (126.4) (108.9)
5,426,358 4,717,228 3,605,106 3,264,095 3,603,274 4,030,513 3,852,532 4,685,202 5,908,881 7,147,540(119.0) (86.9) (76.4) (90.5) (110.4) (111.9) (95.6) (121.6) (126.1) (121.0)
956 1,068 1,270 1,234 1,262 1,301 1,884 1,648 1,657 2,707(124.3) (111.7) (118.9) (97.2) (102.3) (103.1) (144.8) (87.5) (100.5) (163.4)
762,709 801,369 807,095 747,136 749,069 594,360 610,127 672,942 708,528 1,046,032(125.5) (105.1) (100.7) (92.6) (100.3) (79.3) (102.7) (110.3) (105.3) (147.6)
2,607 2,432 2,455 2,899 3,140 2,939 3,129 3,038 3,347 3,155(114.2) (93.3) (100.9) (118.1) (108.3) (93.6) (106.5) (97.1) (110.2) (94.3)
340,324 369,825 350,715 370,324 379,351 341,410 358,836 353,929 393,009 398,770(119.6) (108.7) (94.8) (105.6) (102.4) (90.0) (105.1) (98.6) (111.0) (101.5)
283 154 114 152 263 278 299 278 294 384(95.9) (54.4) (74.0) (133.3) (173.0) (105.7) (107.6) (93.0) (105.8) (130.6)
139,064 120,335 105,824 129,737 154,449 126,857 188,451 217,732 286,310 405,295(113.7) (86.5) (87.9) (122.6) (119.0) (82.1) (148.6) (115.5) (131.5) (141.6)45,060 33,192 22,522 20,403 34,608 48,735 47,100 39,957 43,837 42,523(95.5) (73.7) (67.9) (90.6) (169.6) (140.8) (96.6) (84.8) (109.7) (97.0)
16,747 15,547 14,173 14,832 15,986 18,136 19,485 23,794 29,108 32,171(115.9) (92.8) (91.2) (104.6) (107.8) (113.4) (107.4) (122.1) (122.3) (110.5)
6,713,515 6,041,949 4,891,262 4,531,695 4,920,751 5,141,875 5,057,046 5,969,762 7,340,565 9,040,160(119.4) (90.0) (81.0) (92.6) (108.6) (104.5) (98.4) (118.0) (123.0) (123.2)
Source: Ministry of Finance customs import records
Value
Tyres
Total
Tubes
Others
Motorcycle tyres
Truck and bus tyres
Value
TyresPassenger car tyres
Value
Tyres
Value
Value
Tyres
Value
Tyres