type iax supernovae - home page - supernovae through the...
TRANSCRIPT

Type Iax Supernovae
Supernovae Through the Ages Rapa Nui August 12, 2016
Saurabh W. Jha with Curtis McCully (LCOGT/UCSB),Ryan Foley (UC Santa Cruz),
Max Stritzinger (Aarhus), et al.

THE ASTROPHYSICAL JOURNAL, 509 :74È79, 1998 December 101998. The American Astronomical Society. All rights reserved. Printed in U.S.A.(
SUPERNOVA LIMITS ON THE COSMIC EQUATION OF STATE
PETER M. SAURABH PETER ALEJANDRO ALANGARNAVICH,1 JHA,1 CHALLIS,1 CLOCCHIATTI,2 DIERCKS,3ALEXEI V. RON L. CRAIG J. ROBERT P.FILIPPENKO,4 GILLILAND,5 HOGAN,3 KIRSHNER,1
BRUNO M. M. DAVID ADAM G.LEIBUNDGUT,6 PHILLIPS,7 REISS,3 RIESS,4BRIAN P. ROBERT A. R. CHRISSCHMIDT,8 SCHOMMER,7 SMITH,9JASON CHRIS NICHOLAS B.SPYROMILIO,6 STUBBS,3 SUNTZEFF,7
JOHN AND SEAN M.TONRY,10 CARROLL11Received 1998 May 28; accepted 1998 July 10
ABSTRACTWe use Type Ia supernovae studied by the High-z Supernova Search Team to constrain the properties
of an energy component that may have contributed to accelerating the cosmic expansion. We Ðnd thatfor a Ñat geometry the equation-of-state parameter for the unknown component, must be lessa
x
\Px
/ox
,than [0.55 (95% conÐdence) for any value of and it is further limited to (95%)
m
, a
x
\ [0.60conÐdence) if is assumed to be greater than 0.1. These values are inconsistent with the unknown)
mcomponent being topological defects such as domain walls, strings, or textures. The supernova (SN) dataare consistent with a cosmological constant or a scalar Ðeld that has had, on average, an(a
x
\ [1)equation-of-state parameter similar to the cosmological constant value of [1 over the redshift range ofz B 1 to the present. SN and cosmic microwave background observations give complementary con-straints on the densities of matter and the unknown component. If only matter and vacuum energy areconsidered, then the current combined data sets provide direct evidence for a spatially Ñat universe with
(1 p).)
tot\ )
m
] )" \ 0.94^ 0.26Subject headings : cosmology : observations È cosmology : theory È supernovae : general
1. INTRODUCTION
Matter that clusters on the scale of galaxies or galaxyclusters is insufficient to close the universe, with conven-tional values near et al.)
m
\ 0.2^ 0.1 (Gott 1974 ;et al. et al. Fan, & CenCarlberg 1996 ; Lin 1996 ; Bahcall,
Observations of distant supernovae (SNs) provide1997).credible evidence that the deceleration rate of the universalexpansion is small, which implies that the total matterdensity, clustered or smooth, is insufficient to create a Ñatgeometry et al. et al.(Garnavich 1998 ; Perlmutter 1998).Either the universe has an open geometry or, if Ñat, otherforms of energy are more important than matter.
Large samples of SNs analyzed by the High-z SupernovaSearch collaboration et al. hereafter R98a) and(Riess 1998a,the Supernova Cosmology Project now suggest(Kim 1998)that the universe may well be accelerating. Matter alone
1 Harvard-Smithsonian Center for Astrophysics, 60 Garden Street,Cambridge, MA 02138.
2 Departmento de Astronomi�a y Astrophisica, PontiÐcia UniversidadCato� lica, Casilla 104, Santiago 22, Chile.
3 Department of Astronomy, University of Washington, Seattle, WA98195.
4 Department of Astronomy, University of California, Berkeley, CA94720-3411.
5 Space Telescope Science Institute, 3700 San Martin Drive, Baltimore,MD 21218.
6 European Southern Observatory, Karl-Schwarzschild-Strasse 2, Gar-ching, Germany.
7 Cerro Tololo Inter-American Observatory, Casilla 603, La Serena,Chile.
8 Mount Stromlo and Siding Spring Observatory, Private Bag, WestonCreek P.O., Australia.
9 University of Michigan, Department of Astronomy, 834 Dennison,Ann Arbor, MI 48109.
10 Institute for Astronomy, University of Hawaii, Manoa, HI 96822.11 Institute for Theoretical Physics, University of California, Santa
Barbara, CA 93106.
cannot accelerate the expansion ; therefore, if taken at facevalue the observations demand an additional energy com-ponent for the universe. While the vigorous pursuit of pos-sible systematic e†ects (see, e.g., Wheeler, &Ho� Ñich,Thielemann will be important in understanding these1998)observations, it is instructive to see what they imply aboutthe energy content of the universe.
The cosmological constant was revived to Ðll the gapbetween the observed mass density and the theoretical pref-erence for a Ñat universe Steigman, & Krauss(Turner, 1984 ;
as well as to alleviate the embarrassment of aPeebles 1984),young universe with older stars Press, & Turner(Carroll,
The cosmological constant is a negative pressure1992).component arising from nonzero vacuum energy (Weinberg
It would be extraordinarily difficult to detect on a1989).small scale, but could make up the di†erence)" \ 1 [ )
mbetween the matter density and a Ñat geometry and)
mmight be detected by measurements on a cosmologicalscale. There are few independent observational constraintson the cosmological constant, but Kochanek, &Falco,Mun8 oz estimated that (95% conÐdence)(1998) )" \ 0.7from the current statistics of strong gravitational lenses. Ifthe matter density is less than this limit is close to)
m
D 0.3,preventing the cosmological constant from making a Ñatgeometry. Further, a cosmological constant that justhappens to be of the same order as the matter content at thepresent epoch raises the issue of ““ Ðne tuning ÏÏ &(ColesEllis A number of exotic forms of matter that might1997).contribute to cosmic acceleration are physically possibleand viable alternatives to the cosmological constant
& Waga Dave, & Steinhardt(Frieman 1998 ; Caldwell,The range of possibilities can be narrowed by using1998).
SNs because the luminosity distance not only depends onthe present densities of the various energy components butalso depends on their equations of state while the photonswe see were in Ñight. Here, with some simplifying assump-
74
THE ASTRONOMICAL JOURNAL, 116 :1009È1038, 1998 September1998. The American Astronomical Society. All rights reserved. Printed in U.S.A.(
OBSERVATIONAL EVIDENCE FROM SUPERNOVAE FOR AN ACCELERATING UNIVERSEAND A COSMOLOGICAL CONSTANT
ADAM G. ALEXEI V. PETER ALEJANDRO ALANRIESS,1 FILIPPENKO,1 CHALLIS,2 CLOCCHIATTI,3 DIERCKS,4PETER M. RON L. CRAIG J. SAURABH ROBERT P.GARNAVICH,2 GILLILAND,5 HOGAN,4 JHA,2 KIRSHNER,2
B. M. M. DAVID BRIAN P. ROBERT A.LEIBUNDGUT,6 PHILLIPS,7 REISS,4 SCHMIDT,8,9 SCHOMMER,7R. CHRIS J. CHRISTOPHERSMITH,7,10 SPYROMILIO,6 STUBBS,4
NICHOLAS B. AND JOHNSUNTZEFF,7 TONRY11Received 1998 March 13; revised 1998 May 6
ABSTRACTWe present spectral and photometric observations of 10 Type Ia supernovae (SNe Ia) in the redshift
range 0.16 π z π 0.62. The luminosity distances of these objects are determined by methods that employrelations between SN Ia luminosity and light curve shape. Combined with previous data from ourHigh-z Supernova Search Team and recent results by Riess et al., this expanded set of 16 high-redshiftsupernovae and a set of 34 nearby supernovae are used to place constraints on the following cosmo-logical parameters : the Hubble constant the mass density the cosmological constant (i.e., the(H
0), ()
M),
vacuum energy density, the deceleration parameter and the dynamical age of the universe)"), (q0), (t
0).
The distances of the high-redshift SNe Ia are, on average, 10%È15% farther than expected in a low massdensity universe without a cosmological constant. Di†erent light curve Ðtting methods, SN Ia()
M\ 0.2)
subsamples, and prior constraints unanimously favor eternally expanding models with positive cosmo-logical constant (i.e., and a current acceleration of the expansion (i.e., With no prior)" [ 0) q
0\ 0).
constraint on mass density other than the spectroscopically conÐrmed SNe Ia are statistically)M
º 0,consistent with at the 2.8 p and 3.9 p conÐdence levels, and with at the 3.0 p and 4.0 pq
0\ 0 )" [ 0
conÐdence levels, for two di†erent Ðtting methods, respectively. Fixing a ““minimal ÏÏ mass density, )M
\
results in the weakest detection, at the 3.0 p conÐdence level from one of the two methods.0.2, )" [ 0For a Ñat universe prior the spectroscopically conÐrmed SNe Ia require at 7 p()
M] )" \ 1), )" [ 0
and 9 p formal statistical signiÐcance for the two di†erent Ðtting methods. A universe closed by ordinarymatter (i.e., is formally ruled out at the 7 p to 8 p conÐdence level for the two di†erent Ðtting)
M\ 1)
methods. We estimate the dynamical age of the universe to be 14.2 ^ 1.7 Gyr including systematic uncer-tainties in the current Cepheid distance scale. We estimate the likely e†ect of several sources of system-atic error, including progenitor and metallicity evolution, extinction, sample selection bias, localperturbations in the expansion rate, gravitational lensing, and sample contamination. Presently, none ofthese e†ects appear to reconcile the data with and)" \ 0 q
0º 0.
Key words : cosmology : observations È supernovae : general
ÈÈÈÈÈÈÈÈÈÈÈÈÈÈÈ1 Department of Astronomy, University of California at Berkeley,
Berkeley, CA 94720-3411.2 Harvard-Smithsonian Center for Astrophysics, 60 Garden Street,
Cambridge, MA 02138.3 Departamento de Astronom•�a y Astrof •� sica, PontiÐcia Universidad
Cato� lica, Casilla 104, Santiago 22, Chile.4 Department of Astronomy, University of Washington, Box 351580,
Seattle, WA 98195.5 Space Telescope Science Institute, 3700 San Martin Drive, Baltimore,
MD 21218.6 European Southern Observatory, Karl-Schwarzschild-Strasse 2,
D-85748 Garching bei Mu� nchen, Germany.7 Cerro Tololo Inter-American Observatory, National Optical
Astronomy Observatories, Casilla 603, La Serena, Chile. NOAO is oper-ated by the Association of Universities for Research in Astronomy, Inc.,under cooperative agreement with the National Science Foundation.
8 Mount Stromlo and Siding Spring Observatories, Private Bag,Weston Creek, ACT 2611, Australia.
9 Visiting Astronomer, Cerro Tololo Inter-American Observatory.10 Department of Astronomy, University of Michigan, 834 Dennison
Building, Ann Arbor, MI 48109.11 Institute for Astronomy, University of Hawaii, 2680 Woodlawn
Drive, Honolulu, HI 96822.
1. INTRODUCTION
This paper reports observations of 10 new high-redshiftType Ia supernovae (SNe Ia) and the values of the cosmo-logical parameters derived from them. Together with thefour high-redshift supernovae previously reported by ourHigh-z Supernova Search Team et al.(Schmidt 1998 ;
et al. and two others et al.Garnavich 1998a) (Riess 1998b),the sample of 16 is now large enough to yield interestingcosmological results of high statistical signiÐcance. Con-Ðdence in these results depends not on increasing thesample size but on improving our understanding of system-atic uncertainties.
The time evolution of the cosmic scale factor depends onthe composition of mass-energy in the universe. While theuniverse is known to contain a signiÐcant amount of ordi-nary matter, which decelerates the expansion, its)
M,
dynamics may also be signiÐcantly a†ected by more exoticforms of energy. Preeminent among these is a possibleenergy of the vacuum EinsteinÏs ““ cosmological con-()"),
1009
78 GARNAVICH ET AL. Vol. 509
with a Gaussian prior based on our own Type Ia SNsH0result including our estimate of the systematic error from
the Cepheid distance scale, km s~1 Mpc~1H0\ 65 ^ 7
It is important to note that the Type Ia SNs con-(R98a).straints on are independent of the distance scale()
m
, )")but that the CMB constraints are not. We then combinemarginalized likelihood functions of the CMB and Type IaSNs data. The result is shown in Again, we mustFigure 3.caution that systematic errors in either the Type Ia SNsdata or the CMB could a†ect this result.(R98a)
Nevertheless, it is heartening to see that the combinedconstraint favors a location in this parameter space that hasnot been ruled out by other observations, though there maybe mild conÑict with constraints on from gravitational)"lensing et al. In fact, the region selected by the(Falco 1998).Type Ia SN and CMB observations is in concordance withinÑation, large-scale structure measurements, and the agesof stars & Steinhardt & Turner(Ostriker 1995 ; Krauss
The combined constraint removes much of the1995). high-region that was not ruled out by the Type Ia)
m
, high-)"SN data alone, as well as much of the high-)m
, low-)"region allowed by the CMB data alone. The combined con-straint is consistent with a Ñat universe, as )
tot\ )
mfor MLCS and 1.00^ 0.22 for] )" \ 0.94^ 0.26 *m15
(B)(1 p errors). The enormous redshift di†erence between theCMB and the Type Ia SNs makes it dangerous to generalize
this result beyond a cosmological-constant model becauseof the possible time dependence of But for an equationa
x
.of state Ðxed after recombination, the combined constraintscontinue to be consistent with a Ñat geometry as long as
With better estimates of the systematic errors ina
x
[ [0.6.the Type Ia SN data and new measurements of the CMBanisotropy, these preliminary indications should quicklyturn into very strong constraints et al.(Tegmark 1998).
6. CONCLUSIONS
The current results from the High-z Supernova SearchTeam suggest that there is an additional energy componentsharing the universe with gravitating matter. For a Ñatgeometry, the ratio of the pressure of the unknown energyto its density is probably more negative than [0.6. Thise†ectively rules out topological defects such as strings andtextures as the additional component, and it disfavorsdomain walls as that component. Open models are less con-strained but favor Although there are manya
x
\ [0.5.intriguing candidates for the x-component, the currentType Ia SN observations imply that a vacuum energy or ascalar Ðeld that resembles the cosmological constant is themost likely culprit.
Combining the Type Ia SNs probability distribution withconstraints of today from the position of the Ðrst acousticpeak in the CMB power spectrum provides a simultaneous
FIG. 3.ÈCombined constraints from Type Ia SNs and the position of the Ðrst Doppler peak of the CMB angular power spectrum. The equation-of-stateparameter for the unknown component is like that for a cosmological constant, The contours mark the 68%, 95.4%, and 99.7% encloseda
x
\ [1.probability regions.
360
Publications of the Astronomical Society of the Pacific, 119: 360–387, 2007 April! 2007. The Astronomical Society of the Pacific. All rights reserved. Printed in U.S.A.
The Peculiar SN 2005hk: Do Some Type Ia Supernovae Explode as Deflagrations?1,2,3
M. M. Phillips,4 Weidong Li,5 Joshua A. Frieman,6,7,8 S. I. Blinnikov,9,10 Darren DePoy,11 Jose L. Prieto,11 P. Milne,12
Carlos Contreras,4 Gaston Folatelli,4 Nidia Morrell,4 Mario Hamuy,13 Nicholas B. Suntzeff,14 Miguel Roth,4
Sergio Gonzalez,4 Wojtek Krzeminski,4 Alexei V. Filippenko,5 Wendy L. Freedman,15 Ryan Chornock,5
Saurabh Jha,5,16 Barry F. Madore,15,17 S. E. Persson,15 Christopher R. Burns,15 Pamela Wyatt,15 David Murphy,15
Ryan J. Foley,5 Mohan Ganeshalingam,5 Franklin J. D. Serduke,5 Kevin Krisciunas,18 Bruce Bassett,19,20
Andrew Becker,21 Ben Dilday,7,22 J. Eastman,11 Peter M. Garnavich,18 Jon Holtzman,23 Richard Kessler,7,24
Hubert Lampeitl,25 John Marriner,8 S. Frank,11 J. L. Marshall,11 Gajus Miknaitis,8 Masao Sako,26
Donald P. Schneider,27 Kurt van der Heyden,19 and Naoki Yasuda28
Received 2006 July 1; accepted 2007 March 22; published 2007 April 24
ABSTRACT. We present extensive photometry and optical spectroscopy of the Type Ia′ ′ ′ ′u g r i BVRIYJHKs
supernova (SN) 2005hk. These data reveal that SN 2005hk was nearly identical in its observed properties to SN2002cx, which has been called “the most peculiar known Type Ia supernova.” Both supernovae exhibited high-ionization SN 1991T–like premaximum spectra, yet low peak luminosities like that of SN 1991bg. The spectrareveal that SN 2005hk, like SN 2002cx, exhibited expansion velocities that were roughly half those of typicalType Ia supernovae. The R and I light curves of both supernovae were also peculiar in not displaying thesecondary maximum observed for normal Type Ia supernovae. Our YJH photometry of SN 2005hk reveals thesame peculiarity in the near-infrared. By combining our optical and near-infrared photometry of SN 2005hk withpublished ultraviolet light curves obtained with the Swift satellite, we are able to construct a bolometric lightcurve from ∼15 days before to ∼60 days after B maximum. The shape and unusually low peak luminosity ofthis light curve, plus the low expansion velocities and absence of a secondary maximum at red and near-infraredwavelengths, are all in reasonable agreement with model calculations of a three-dimensional deflagration thatproduces ∼0.2 M, of 56Ni.
Online material: color figures
1. INTRODUCTION
More than 45 years ago, Hoyle & Fowler (1960) first rec-ognized that Type Ia supernovae (SNe Ia; for a review of su-pernova classification, see Filippenko 1997) were the obser-vational signature of the thermonuclear disruption of a
1 Based in part on observations taken at the Cerro Tololo Inter-AmericanObservatory, National Optical Astronomy Observatory, which is operated bythe Association of Universities for Research in Astronomy, Inc., (AURA) undercooperative agreement with the National Science Foundation.
2 Based in part on observations obtained with the Apache Point Observatory3.5 m telescope, which is owned and operated by the Astrophysical ResearchConsortium.
3 Partly based on observations collected at the European Southern Obser-vatory, Chile, in the course of program 076.A-0156.
4 Las Campanas Observatory, Carnegie Observatories, La Serena, Chile;[email protected], [email protected], [email protected], [email protected], [email protected], [email protected], [email protected].
5 Department of Astronomy, University of California, Berkeley, CA;[email protected], [email protected], [email protected], [email protected], [email protected], [email protected].
6 Department of Astronomy and Astrophysics, University of Chicago, Chi-cago, IL.
degenerate star. Over the intervening years, progress has beenslow in identifying the progenitor systems of these objects andunderstanding the details of the explosion mechanism. At pre-sent, the most popular model for the progenitors of typical SNe
7 Kavli Institute for Cosmological Physics, University of Chicago, Chicago,IL; [email protected], [email protected].
8 Fermi National Accelerator Laboratory, Batavia, IL; [email protected],[email protected], [email protected].
9 Institute for Theoretical and Experimental Physics, Moscow, Russia;[email protected].
10 Max-Planck-Institut fur Astrophysik, Garching, Germany.11 Department of Astronomy, Ohio State University, Columbus, OH;
[email protected], [email protected], [email protected], [email protected].
12 Steward Observatory, Tucson, AZ; [email protected] Universidad de Chile, Departamento de Astronomıa, Santiago, Chile;
[email protected] Texas A&M University Physics Department, College Station, TX;
[email protected] Observatories of the Carnegie Institution of Washington, Pasadena, CA;
[email protected] [email protected], [email protected], [email protected],[email protected], [email protected].
16 Kavli Institute for Particle Astrophysics and Cosmology, Stanford LinearAccelerator Center, Menlo Park, CA; [email protected].
historical prelude
High-Z Team SN Ia +ground-based CMB (1st peak)
Garnavich, Jha, + High-Z Team (1998)

“Someone smart and young will sweep away these silly subclasses…”
−N.B. Suntzeff, 2016-08-09
thanks a lot, Nick and Mark!Dec 2011

The Astrophysical Journal, 767:57 (28pp), 2013 April 10 Foley et al.
4000 5000 6000 7000 8000 9000 10000Rest Wavelength (Å)
0
1
2
3
4
5R
elat
ive
f λ +
Con
stan
t
SN 2011ay−2.0
1.9
4.8
10.8
26.4
36.2
49.9
62.7
175.6
Figure 13. Optical spectra of SN 2011ay. Rest-frame phases relative to Vmaximum are listed to the right of each spectrum.
to SN 2008ge, which might be >20 days) is also larger than forthat of SNe Ia (Ganeshalingam et al. 2011); based on currentdata, it appears that the average SN Iax has a shorter rise timethan the average SN Ia, but few SNe have light curves sufficientfor this measurement. Despite their rough similarity in light-curve shape, SNe Iax have consistently lower luminosity (evenif that criterion is relaxed from our classification scheme) thanSNe Ia.
For SNe Iax, there are several clear trends in the derivedphotometric parameters. Peak brightness and decline rates arehighly correlated for a given object in all bands. In other words,an SN that is bright and declines slowly in B is also bright anddeclines slowly in R.
Performing a Bayesian Monte-Carlo linear regression on thedata (Kelly 2007), we determine correlations between differentparameters in different bands. The linear relationships and theircorrelation coefficients are presented in Table 6, where theequations are all of the form
p2 = αp1 + β, (1)
where p1 and p2 are the two parameters, α is the slope, and β isthe offset.
Using the equations in Table 6, one can effectively trans-form observations in one band into measurements in another.
4000 5000 6000 7000 8000 9000 10000Rest Wavelength (Å)
0
1
2
3
Rel
ativ
e f λ
+ C
onst
ant
SN 2012Z
−13.7
−12.7
1.1
4.1
6.1
6.2
7.1
29.0
Figure 14. Optical spectra of SN 2012Z. Rest-frame phases relative to Vmaximum are listed to the right of each spectrum.
0 20 40 60Rest−Frame Days Relative to V Maximum
−12
−13
−14
−15
−16
−17
−18
Abs
olut
e V
Mag
nitu
de
08ha09J05cc03gq02cx08ae08ge05hk08A12Z11ay
Figure 15. Absolute V-band light curves for a subset of SNe Iax. Each SN isplotted with a different color.(A color version of this figure is available in the online journal.)
15
Type Iax Supernovae>50 members in the class
Foley et al. (2013)
SN 2002cx (Li et al. 2003)the “most peculiar” SN Ia
02cx-like subclass of SN Ia(Jha et al. 2006)
e.g., SN 2002cx ↔ SN 2005hk(Phillips et al. 2007)
SN Iax (Foley et al. 2013)Stritzinger et al.: The bright and energetic Type Iax SN 2012Z.
Figure 6:MB plotted vs. ∆m15(B) for a sample of CSP SNe Ia(black dots), a handful of SNe Iax (blue squares) that span theirfull range in luminosity, and SN 2012Z (red star). Note the errorbars associated with SN 2012Z are smaller than its symbol size.The comparison SNe Iax plotted are SN 2002cx (Li et al. 2003;Phillips et al. 2007), SN 2003gq (see Foley et al. 2013, and ref-erences therein), SN 2005hk (Phillips et al. 2007), SN 2007qd(McClelland et al. 2010), SN 2008A (see Foley et al. 2013, andreferences therein), SN 2008ge (Foley et al. 2013), SN 2008ha(Stritzinger et al. 2014), SN 2010ae (Stritzinger et al. 2014), andSN 2011ay (Brown, private communication).
19
Stritzinger et al. (2015)
13dhMcCully et al.
in prep
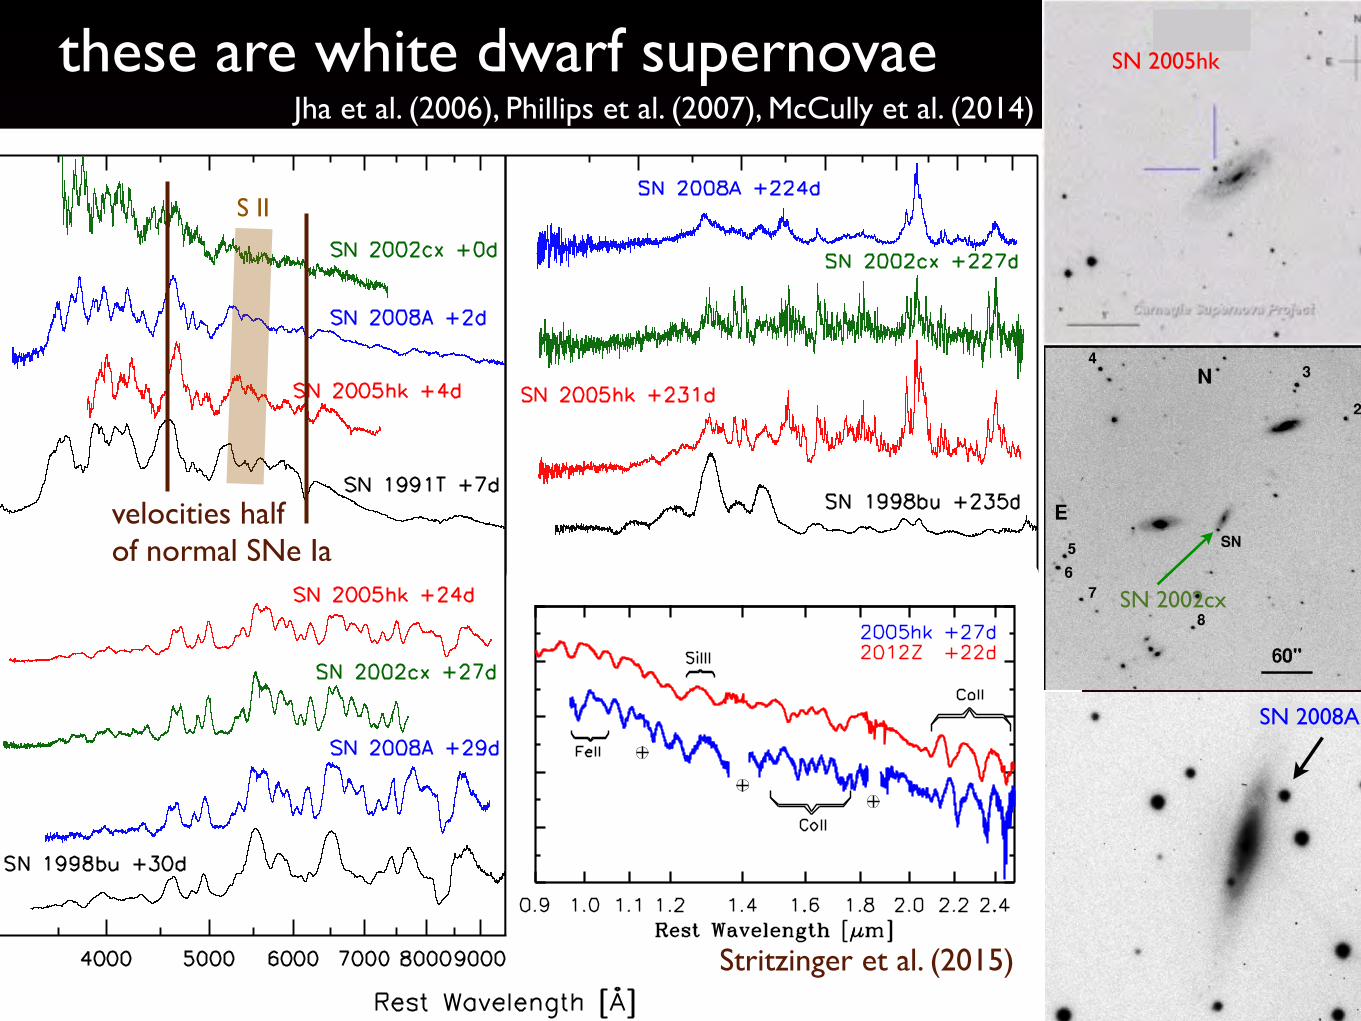
these are white dwarf supernovae SN 2005hk
SN 2002cx 455
2003 PASP, 115:453–473
Fig. 1.—V-band KAIT image of the field of SN 2002cx, taken on 2002
May 18. The field of view is 6!. !.7. The eight local standard stars are7# 6
marked (1–8).
TABLE 1
Photometry of Comparison Stars
ID V B!V V!R V!I Ncalib
1 . . . . . . 15.467(06) 0.635(30) 0.410(08) 0.807(30) 2
2 . . . . . . 17.254(26) 0.608(33) 0.374(30) 0.744(36) 3
3 . . . . . . 16.332(23) 0.523(40) 0.338(20) 0.663(12) 2
4 . . . . . . 16.503(15) 0.509(40) 0.376(07) 0.734(08) 2
5 . . . . . . 16.788(34) 0.586(20) 0.362(17) 0.755(37) 6
6 . . . . . . 17.026(40) 0.796(21) 0.499(09) 0.967(35) 6
7 . . . . . . 17.109(36) 0.658(13) 0.407(18) 0.819(45) 6
8 . . . . . . 17.901(39) 1.166(62) 0.831(17) 1.528(55) 6
Note.—All quantities are magnitudes. Uncertainties in the last two
digits are indicated in parentheses.
Fig. 2.—Preliminary B, V, R, and I light curves of SN 2002cx. The opencircles are the KAIT measurements, and the filled circles are the Nickel data.
For most of the points, the statistical uncertainties are smaller than the plotted
symbols. The upper panel shows the results from the adopted galaxy-subtrac-
tion technique discussed in the text, while the lower panel shows a comparison
between the galaxy-subtraction photometry (solid lines) and the PSF-fitting
photometry (open and filled circles).
(Stetson 1987) and then employed to determine transformation
coefficients to the standard Johnson-Cousins BVRI system. The
derived transformation coefficients and color terms were then
used to calibrate the sequence of eight local standard stars in
the SN 2002cx field. The magnitudes of these eight stars and
the associated uncertainties derived by averaging over the pho-
tometric nights are listed in Table 1. Notice that the local stan-
dard stars have different numbers of calibrations (last column
in Table 1) because the two telescopes have different total fields
of view.
We tried the point-spread function (PSF) fitting method (Stet-
son 1987) to perform differential photometry of SN 2002cx
relative to the comparison stars, but the results are less than
satisfactory. As can be seen in Figure 1, SN 2002cx is con-
taminated by its host galaxy (especially in the R and I bands),
and the relatively poor resolution of KAIT images together
with seeing variations yield fluctuations at the !0.1–0.2 mag
level in the final light curves (lower panel in Fig. 2). The PSF-
fitting method also overestimates the brightness of SN 2002cx,
as a negative residual can be seen at the position of the SN on
the processed images with SN 2002cx and the comparison stars
subtracted.
The solution for getting precise photometry of SN 2002cx
is to obtain BVRI template images after the SN fades and apply
galaxy subtraction to remove the galaxy contamination. We
have attempted to get these template images with both KAIT
and the Nickel telescope (which has better resolution than the
KAIT data) when SN 2002cx was 7 months old, but unfor-
tunately, owing to its slow late-time decline (see below for
SN 2002cx
SN 2008A 1 arcmin
NGC 634 DSSLick 40” V-bandJanuary 12, 2008
Figure 1: Image of SN 2008A from the Lick Observatory 1 m Nickel telescope (left) compared tothe pre-explosion DSS image (right).
– 50 –
Fig. 8.— Comparison of spectra of SN 2005hk at phases of -5, +13, +24, and +55 days with
similar epoch spectra of SN 2002cx from LFC. The spectra are plotted on a logarithmic fluxscale and shifted by an arbitrary constant. The wavelengths of the spectra were shifted to
the SN rest frame using the heliocentric velocities of the host galaxies given in NED.
– 56 –
-20
-19
-18
-17
B
2005hk
-20
-19
-18
-17
V
-20
-19
-18
-17
Mmax I
-20
-19
-18
-17
J
0.8 1 1.2 1.4 1.6 1.8 2!m
15(B)
-20
-19
-18
-17
H
Fig. 14.— The absolute magnitudes of SNe Ia at maximum light in the BV IJH bands
plotted versus the decline rate parameter ∆m15(B). The black triangles are SNe in theredshift range 0.01 < z < 0.1 whose distances were calculated from their host galaxy radial
velocities in the cosmic microwave background frame assuming a Hubble constant of H0 = 72km s−1 Mpc−1. The red circle in each panel corresponds to SN 2005hk.
SN 2008A
4000 5000 6000 7000 8000 9000Rest Wavelength (Å)
0.1
1.0
Log
(f !
) +
co
nsta
nt
SN 2002cx (+25 days)SN 2005hk (+24 days)SN 2008A (+28 days)
Figure 2: February 12, 2008 Keck spectrum of SN 2008A compared to analogues SN 2002cx andSN 2005hk at similar epochs showing striking homogeneity (left); and absolute optical magnitudesof SN 2008A and SN 2005hk showing these are outliers compared to a sample of normal SNe Ia(right; panel adapted from Phillips et al. 2007).
4
SN 2008A
Jha et al. (2006), Phillips et al. (2007), McCully et al. (2014)
velocities half of normal SNe Ia
S II
Stritzinger et al.: The bright and energetic Type Iax SN 2012Z.
Figure 16: Comparison of NIR-wavelength spectra of SN 2012Zat phases of 0d (top) and+22d (bottom), to similar epoch spectraof SN 2005hk (Kromer et al. 2013). Prevalent features attributedto ions of Fe ii, Si iii, and Co ii are indicated with labels.
29
Stritzinger et al. (2015)

SN 2008ge SN 2008ha
SN 2010elSN 2010ae
Galaxy Type
Cum
ulat
ive
Frac
tion
E S0 Sa−Sab Sb Sbc Sc Scd−Sm Irr0
0.1
0.2
0.3
0.4
0.5
0.6
0.7
0.8
0.9
1
Ia91bg91TIbIcII02cx05E
91bg
05E
Ia
II02cx
Figure 3: The cumulative distribution of host galaxies of SNe from the KAIT SNsurvey. We corrected the classification of a few SN Ib/c hosts using higher-quality obser-vations from the Palomar 60-inch telescope (SN 2005ar, 2006ab, and 2006lc were found tobe hosted by spiral galaxies rather than elliptical galaxies). After correcting the classifi-cation we find that all SNe Ib/c found in early-type galaxies are faint Ca-rich SNe similarto SN 2005E. Note that the SN 2005E-like SN host distribution is very di�erent from thatof other SNe Ib/c, as well as that of SNe II (known to have young massive progenitors)and that of SN 2002cx-like SNe Ia, with half of the SN 2005E-like group (four out ofeight) observed in early-type (elliptical or S0) galaxies. The progenitors of SN 2005E andthe other members of its group are therefore likely to belong to an old, low-mass stellarpopulation. The total numbers of host galaxies included in this figure are 244, 25, 8, 257,30, 63, 14, and 8 for SNe of types Ia, 91bg, 91T, II, Ib, Ic, 02cx, and 05E, respectively.
Perets et al. (2009)
Figure 4: Host galaxy distributions for di↵erent classes of supernovae. Note that the 02cx-likeSNe are found preferentially in late-type galaxies, similar to core-collapse SNe (II, Ib, Ic) anddi↵erent from the bulk of the SN Ia population. However, the 02cx-like objects are alsodistributed similarly to SN 1991T-like SNe Ia, thought to be thermonuclear. This figure is
adapted from Perets et al. (2009).
Description of the Observations
We propose to obtain late-time optical WFC3/UVIS V rI photometry of SN 2012Z in NGC1309 in two epochs, once during Cycle 20 (sometime approximately 400 to 600 days after SNmaximum light), and again during Cycle 21 (sometime approximately 750 to 950 days pastmaximum). The few extant HST observations of SNe Ia at these late times have often beentaken in just one or two optical filters; this makes it di⌅cult to get solid physical insight.For this important object, we will observe in V (F555W), r (F625W), and I (F814W).
We need two epochs to trace the development of any excess r-band flux (signifying theemergence of strong [O I] �6300) and importantly, to ensure that we don’t miss the strongcolor evolution predicted by models of the IR catastrophe. The V observations will connectSN 2012Z to other SNe Ia observed at late epochs (Figure 3), and both the V and I obser-vations will tie into the exquisite extant HST data set on NGC 1309 (Figure 1). Becausewe expect the SED to have strong features, it is imperative that we have our two epochsobserved with the same instruments and filters; we cannot a�ord the imprecision in compar-ing ground-based and HST broad-band magnitudes to make the measurement! We choose
6
all late-type hosts (except 08ge)
host-galaxy distribution similar to SN IIP, but also 91T-like SN Ia
(Perets et al. 2009; Foley et al. 2009; Lyman et al. 2013; White et al. 2015)
Iax environments

archivalC
handraX
-rayobservations
ofM
101taken
in2004
(seeSupplem
entaryInform
ation),andderived
upperlim
itsfor
theX
-raylum
inosityatthelocation
ofSN2011fein
therange(4–25)310
36ergs2
1
(dependingon
thedetails
oftheassum
edspectrum
).Single-degenerateprogenitor
systems
arethought
toundergo
aprolonged
period
(Dt<
106years)
ofsteady
nuclearburning
duringthe
mass-transfer
process.Such
systems
shouldappear
aslum
inousX
-raysources:
1036–10
38ergs2
1(kT
<100
eV).
Indeed,nearly
ahundred
ofthese
‘supersoft’sourceshave
beenidentified
sofar
inthe
Milky
Way
andother
nearbygalaxies,
includingM
101itself 20,21.
Double-degenerate
Star 1
Star 2
ba
c
Figure1
|The
siteofSN
2011fein
galaxyM
101as
imaged
bythe
Hubble
SpaceT
elescope/Advanced
Cam
erafor
Surveys.a,A
full-viewcolourpicture
oftheface-onspiralgalaxy
M101
(1893189field
ofview)constructed
fromthe
three-colourH
ubbleSpace
Telescope/A
dvancedC
amera
forSurveys
images
takenatm
ultiplem
osaicpointings.N
orthis
upand
easttothe
left.M101
displaysseveralw
ell-definedspiralarm
s.With
adiam
eterof170,000
lightyears,M
101isnearly
twice
thesize
ofourMilky
Way
Galaxy,and
isestimated
tocontain
atleastonetrillionstars.b,A
cutoutsection(393
39)ofa,centredon
thesupernova
location.SN2011fe
isspatially
projectedon
aprom
inentspiralarm
.c,Acutoutsection
(20320)ofb
centredon
thesupernova
location,which
ism
arkedby
two
circles.The
smaller
circlehas
aradius
ofour1s
astrometric
uncertainty(21
mas),and
thebigger
circlehas
aradius
ofninetim
esthat.N
oobjectis
detectedatthe
nominalsupernova
location,orw
ithinthe
8serror
radius.Tw
onearby
redsources
arelabelled
‘Star1’and
‘Star2’;they
aredisplaced
fromour
nominalsupernova
locationby
about9s,andhence
areform
allyexcluded
asviablecandidate
objectsinvolvedin
theprogenitorsystem
ofSN2011fe.C
reditforthe
colourpicture
ina
(fromhttp://hubblesite.org):
NA
SA,ESA
,K.K
untz(JH
U),F.Bresolin
(University
ofHaw
aii),J.Trauger(Jet
PropulsionLab),J.M
ould(N
OA
O),Y
.-H.C
hu(U
niversityofIllinois,U
rbana)and
STScl.
O5
–6–4–20
V445 Pup
He-star channel
SN
2006dd limit
24650,000
Mv
1.0M!
2.2M!
3.5M!
6.0M!
9.0M!
12.0M!
B5
A5
G0
M5
20,000
Temperature (K
)
10,0003,000
5,000
U S
co
RS
Oph
T CrB
SN
2011fe limit
Figure2
|Progenitor
systemconstraints
ina
Hertzsprung–R
usselldiagram
.T
hethick
yellowline
isthe
2slim
itinM
Vagainsteffective
temperatureatthesupernova
location(see
text)froma
combination
ofthefour
Hubble
SpaceT
elescopefilters,w
eightedusing
syntheticcolours
ofredshiftedstellar
spectraatsolar
metallicity
forthattem
peratureand
luminosity
class.Am
oreconservativelim
itcomesfrom
takingthesingle
filterthatmostconstrains
thestellartypeandlum
inosityclass;show
nisthe2s
limitassum
ingtheadopted
distancem
odulus27,28of29.05
mag
(middle
greycurve
atthebottom
oftheyellow
shading)with
atotaluncertainty
of0.23m
ag(top/bottom
greycurve
atthe
bottomofthe
yellowshading).W
ealso
showthe
theoreticalestimates(H
e-star
channel 13,14)and
observedcandidate
systems
(V445
Pup17,R
SO
ph16,
USco
18,29andT
CrB
16).The
grey-shadedrectangle
shows
thelocation
ofV445
Pup.Also
plottedarethetheoreticalevolutionary
tracks(from1
Myrto
13G
yr)ofisolated
starsforarangeofm
assesforsolarmetallicity;notethatthelim
itsonthe
progenitormass
ofSN2011fe
underthe
supersolarm
etallicityassum
ptionare
similarto
thoserepresented
here.The
greycurve
attopisthe
limitinferred
fromH
ubbleSpaceTelescopeanalysisofSN
2006dd,representativeoftheothernearby
typeIa
supernovaprogenitor
limits
(seeSupplem
entaryInform
ation).For
thehelium
-starchannel,bolom
etriclum
inositycorrections
tothe
Vband
areadopted
onthe
basisofeffectivetem
perature30.Foran
effectivetem
peratureof3,000–4,000
K,as
expectedfor
thered-giant-branch
stars,theM
Vlim
itexcludesprogenitors
brighterthanan
absoluteI-band
magnitude
ofMI <
22.
This
limitis
2m
agfainter
thanthe
observed28tip
ofthered-giantbranch
inM
101and
placesan
upperbound
tothe
radiusofR=
60R8
foran
effectivetem
peratureof3,500
Kon
anyred-giantbranch
progenitor.Ina
progenitorm
odelthatrequiresR
LOF,this
limitthen
demands
anorbitalperiod
smaller
than260
to130
daysin
abinary
systemw
itha
1:3M8
white
dwarf(w
herethe
rangeoforbitalperiod
accomm
odatesthe0:5M
8{
2:5M8
rangeallow
edfora
red-giant-branchstar).T
heforeground
Galactic
andM
101extinction
dueto
dustisnegligible7and
istakento
beA
V5
0m
aghere.H
ada
sourceatthe
2.0sphotom
etriclevelbeen
detectedin
theH
ubbleSpace
Telescope
images
attheprecise
locationofthe
supernova,we
would
havebeen
ableto
ruleoutthe
nullhypothesisofno
significantprogenitorwith
95%confidence.W
etherefore
usethe
2sphotom
etricuncertainties
inquoting
thebrightness
limits
onthe
progenitorsystem
.
LETTERRESEARCH
15
DE
CE
MB
ER
20
11
|V
OL
48
0|
NA
TU
RE
|3
49
Macm
illan Publishers Limited. A
ll rights reserved©2011
AA52CH03-Maoz ARI 28 July 2014 7:58
–6
–4
–2
0
2
4
650,000 20,000
O5
SN 2006dd limit
SN 2011fe limit
V445
Pup
T Cr
B
RS Oph
U Sco
He-st
ar ch
anne
l
B5 A5 G0 M5
10,000
Temperature (K)
Mv
5,000 3,000
Figure 1Hertzsprung-Russell diagram (absolute V magnitude versus effective temperature) showing the 2σ upperlimits (thick yellow line) on the presence of progenitors in pre-explosion Hubble Space Telescope images of SN2011fe in M101, from Li et al. (2011a). Also shown are theoretical evolution tracks of isolated stars with arange of masses, theoretical location of a SD He-star donor, and location on the diagram of several knownrecurrent novae. The data rule out red giants, and any evolved star more massive than 3.5 M⊙, as well as therecurrent nova systems above the limit. Gray curve is the corresponding limit by Maoz & Mannucci (2008)for the more distant SN 2006dd. Reproduced by permission of Nature publishing group.
However, there is only one known case, CAL 83, of a supersoft X-ray source that has a detectedionization nebula, whereas nine others that have been searched for such extended line emissionhave yielded only upper limits, at luminosity levels an order of magnitude lower than that ofCAL 83 (Remillard, Rappaport & Macri 1995). Furthermore, the X-ray luminosity of CAL 83is Lx = 3 × 1037 erg s−1, but its HeII line luminosity is only LHeII ≈ 2 × 1033 erg s−1, an orderof magnitude below model expectations (Gruyters et al. 2012). Contrary to the Hα and [OIII]emission, which is roughly symmetrical around the source, the HeII emission is concentrated onone side within ∼1 pc. The reasons for the discrepancy between the observed supersoft ionization
www.annualreviews.org • Type Ia Supernova Progenitors 123
Ann
u. R
ev. A
stro
. Ast
roph
ys. 2
014.
52:1
07-1
70. D
ownl
oade
d fr
om w
ww
.ann
ualre
view
s.org
by R
utge
rs U
nive
rsity
Lib
rarie
s on
09/1
6/14
. For
per
sona
l use
onl
y.
pre-explosion limits for normal SN Ia
SN 2006dd(Maoz & Mannucci 2008)
SN 2014J(Kelly et al. 2014)
SN 2011fe(Li et al. 2011)
SN 2012Z pre-explosion data are3rd deepest for any
white-dwarf SN SN 2011feLi et al. (2011)
Th
eA
strophysical
Journ
al,790:3(9pp),2014
July20
Kelly
etal.
Figure
1.Coadded
Keck-IIK
-bandN
IRC
2A
O(left)and
HST
pre-explosionF160W
(right)exposuresofthe
locationofSN
2014J.We
useonly
thecentral16 ′′×
16 ′′ofthe
distortion-correctedA
Oim
ageto
performastrom
etricregistration.T
he68
sourcesused
forregistration
areidentified
with
white
circles,while
theposition
ofSN
2014Jis
marked
bya
blackcircle
with
radiuscorresponding
tothe
uncertaintyin
thatpositionestim
ate.
Table1
HST
Data
Setsand
UpperA
bsoluteM
agnitudeL
imits
onPoint-source
FluxatE
xplosionSite
Instrument
Aperture
FilterU
TD
ateO
bs.E
xp.Time
(s)Prop.N
o.V
isualLim
it3σ
Background
Lim
it
WFC
3U
VIS
F225W2010-01-01
1665.011360
26.5026.80
WFC
3U
VIS
F336W2010-01-01
1620.011360
26.7127.23
AC
SW
FCF435W
2006-09-291800.0
1076626.30
27.05W
FC3
UV
ISF487N
2009-11-172455.0
1136026.01
25.94W
FC3
UV
ISF502N
2009-11-172465.0
1136025.93
26.28W
FPC2
WF
F502N1998-08-28
3600.06826
21.7622.70
WFC
3U
VIS
F547M2010-01-01
1070.011360
26.1425.94
WFPC
2W
FF547M
1998-08-28100.0
682621.63
22.12A
CS
WFC
F555W2006-03-29
1360.010766
26.4226.52
WFPC
2W
FF631N
1998-08-281200.0
682621.43
22.17A
CS
WFC
F658N2004-02-09
700.09788
24.6324.76
AC
SW
FCF658N
2006-03-294440.0
1076625.06
25.17W
FPC2
WF
F658N1997-03-16
1200.06826
21.3121.86
WFC
3U
VIS
F673N2009-11-15
2760.011360
24.5325.62
AC
SW
FCF814W
2006-03-29700.0
1076624.83
25.09W
FC3
IRF110W
2010-01-011195.39
1136023.54
23.51W
FC3
IRF128N
2009-11-171197.69
1136022.90
22.85W
FC3
IRF160W
2010-01-012395.39
1136022.43
22.48W
FC3
IRF164N
2009-11-172397.7
1136021.98
22.17
Notes.L
imiting
magnitudes
inthe
Vega
systemforpointsources
neartheexplosion
coordinatesin
theH
STim
ages.Visuallim
itingm
agnitudesare
estimated
byinjecting
apointsource
ofincreasingbrightness
inclose
proximity
tothe
AO
explosioncoordinates,and
identifyingw
hena
sourceis
clearlydetected.T
he3σ
backgrounddetections
arecom
putedusing
therm
softhe
backgroundm
easuredin
aregion
withoutpointsources
orpronouncedbackground
gradients.
ofall
pre-explosionH
STexposures,and
theF435W
(JohnsonB
),F814W
(Wide
I),and
F160W(H
)H
STcoadded
images.
The
Tendulkaretal.(2014)positionw
asreported
relativeto
theW
CS
ofthe
HL
AF814W
image,
andw
euse
ourastrom
etricregistration
ofthe
images
todeterm
inethe
locationof
theTendulkaretal.(2014)position
inourreference
F160Wim
age.T
heSN
2014Jposition
thatwe
measure
isoffsetby
0. ′′08
fromthe
coordinatesw
ecalculate
forthe
Tendulkaret
al.(2014)
F814Wposition
inthe
F160Wim
age.T
heangulardistance
between
theposition
we
estimate
andthe
preliminary
coordinatesreportedby
Tendulkaretal.(2014)may
arisefrom
severaldifferencesbetw
eenourA
Ocoadded
images
andastrom
etricfitting.T
heseinclude
thesubstantially
improved
resolutionofourN
IRC
2A
Oexposures
(0. ′′1)com
paredto
those
analyzedby
Tendulkaret
al.(2014;
0. ′′36),
ourrestriction
ofcross-m
atchedsources
tothose
insideof
thecentral16
′′×16
′′
regionof
the40
′′×40
′′wide-field
NIR
C2
camera
tom
inimize
theeffects
ofresidual
distortion,the
numbers
ofm
atchedsources(68
and8,respectively)incorporated
intothe
astrometric
fitby
thetw
oanalyses,
andour
matching
ofsources
inthe
K-band
NIR
C2
image
againstthe
near-IRH
STF160W
image
asopposed
tothe
I-bandF814W
image
tobe
ableto
minim
izesource
confusionand
theeffects
ofdifferentialreddening.
4.1.Upper
Flux
Limits
As
may
beseen
inthe
representativeim
agesin
Figure2,the
localenvironm
entof
SN2014J
exhibitsstrong
surfacebright-
nessvariations
fromboth
resolvedand
unresolvedsources,as
3
SN 2014JKelly et al. (2014)
Li et al. (2011) via Maoz, Mannucci, & Nelemans (2014)
& SN IaxSN Iax 2008ge(Foley et al. 2010)
MV ≳ −6.7
SN Iax 2012Z3𝜎 depth MV ≈ −3.5

SN 2012Z
S1
N
E
20″ ="3.2 kpc
N
E5″ ="800 pc 0.5″ =
80 pc
HST ACS 2005/2006
HST WFC3 2013
McCully et al. (2014)
LETTERdoi:10.1038/nature13615
A luminous, blue progenitor system for the type Iaxsupernova 2012ZCurtis McCully1, Saurabh W. Jha1, Ryan J. Foley2,3, Lars Bildsten4,5, Wen-fai Fong6, Robert P. Kirshner6, G. H. Marion6,7,Adam G. Riess8,9 & Maximilian D. Stritzinger10
Type Iax supernovae are stellar explosions that are spectroscopicallysimilar to some type Ia supernovae at the time of maximum lightemission, except with lower ejecta velocities1,2. They are also dis-tinguished by lower luminosities. At late times, their spectroscopicproperties diverge from those of other supernovae3–6, but their com-position (dominated by iron-group and intermediate-mass elements1,7)suggests a physical connection to normal type Ia supernovae. Super-novae of type Iax are not rare; they occur at a rate between 5 and 30per cent of the normal type Ia rate1. The leading models for type Iaxsupernovae are thermonuclear explosions of accreting carbon–oxygenwhite dwarfs that do not completely unbind the star8–10, implying thatthey are ‘less successful’ versions of normal type Ia supernovae, wherecomplete stellar disruption is observed. Here we report the detectionof the luminous, blue progenitor system of the type Iax SN 2012Z indeep pre-explosion imaging. The progenitor system’s luminosity, col-ours, environment and similarity to the progenitor of the Galactichelium nova V445 Puppis11–13 suggest that SN 2012Z was the explo-sion of a white dwarf accreting material from a helium-star compan-ion. Observations over the next few years, after SN 2012Z has faded,will either confirm this hypothesis or perhaps show that this super-nova was actually the explosive death of a massive star14,15.
SN 2012Z was discovered16 in the Lick Observatory Supernova Searchon 2012 January 29.15 UT. It had an optical spectrum similar to the typeIax (previously called SN 2002cx-like) SN 2005hk3–5 (see Extended DataFig. 1). The similarities between type Iax and normal type Ia supernovaemake understanding the progenitors of the former important, especiallybecause no progenitor of the latter has been identified. Like core-collapsesupernovae (but also slowly declining, luminous type Ia supernovae),type Iax supernovae are found preferentially in young, star-forminggalaxies17,18. A single type Iax supernova, SN 2008ge, was in a relativelyold (S0) galaxy with no indication of current star formation to deeplimits19. Non-detection of the progenitor of SN 2008ge in Hubble SpaceTelescope (HST) pre-explosion imaging restricts its initial mass to= 12 M8(where M[ is the solar mass), and combined with the lackof hydrogen or helium in the SN 2008ge spectrum, favours a white dwarfprogenitor19.
Deep observations of NGC 1309, the host galaxy of SN 2012Z, wereobtained with HST in 2005–06 and 2010, serendipitously including thelocation of the supernova before its explosion. To pinpoint the positionof SN 2012Z with high precision, we obtained follow-up HST data in2013. Colour-composite images made from these observations beforeand after the supernova are shown in Fig. 1, and photometry of stellar
1Department of Physics and Astronomy, Rutgers, the State University of New Jersey, 136 Frelinghuysen Road, Piscataway, New Jersey 08854, USA. 2Astronomy Department, University of Illinois at Urbana-Champaign, 1002 West Green Street, Urbana, Illinois 61801, USA. 3Department of Physics, University of Illinois at Urbana-Champaign, 1110 West Green Street, Urbana, Illinois 61801, USA. 4Department ofPhysics, University of California, Santa Barbara, California 93106, USA. 5Kavli Institute for Theoretical Physics, University of California, Santa Barbara, California 93106, USA. 6Harvard-Smithsonian Centerfor Astrophysics, 60 Garden Street, Cambridge, Massachusetts 02138, USA. 7Department of Astronomy, University of Texas at Austin, Austin, Texas 78712, USA. 8Department of Physics and Astronomy,Johns Hopkins University, 3400 North Charles Street, Baltimore, Maryland 21218, USA. 9Space Telescope Science Institute, 3700 San Martin Drive, Baltimore, Maryland 21218, USA. 10Department ofPhysics and Astronomy, Aarhus University, Ny Munkegade 120, DK-8000 Aarhus C, Denmark.
SN 2012Z
S1
N
E
20ɇ =3.2 kpc
N
E
5ɇ =800 pc 0.5ɇ =
80 pc
HST ACS 2005/2006
HST WFC3 2013
a b c
d e
Figure 1 | HST colour images before and after supernova 2012Z. a, HubbleHeritage image of NGC 1309 (http://heritage.stsci.edu/2006/07); panels b andc zoom in on the progenitor system S1 in the deep, pre-explosion data.
d, e, Shallower post-explosion images of SN 2012Z on the same scale as b andc, respectively. The source data for these images are available as SupplementaryInformation.
5 4 | N A T U R E | V O L 5 1 2 | 7 A U G U S T 2 0 1 4
Macmillan Publishers Limited. All rights reserved©2014

−0.3 −0.2 −0.1 0.0 0.1 0.2 0.3
F435W − F555W (mag)
−2
−3
−4
−5
−6
MF
555W (
mag)
He s
tar
SSS
WR
V445 Pup
0.0 0.2 0.4
F555W − F814W (mag)
He s
tar
SSS
WR
12Z−S1
−0.2
AV = 0.5 mag
AV = 0.5 mag
8 M9 M
10 M
11 M
7 M 8 M9 M
10 M
11 M
7 M
12Z−S1
a b
the first detected white-dwarf supernova progenitor system
McCully et al. (2014)

C/O white dwarf + helium star model• already suggested by Foley et al. (2013)
to explain SN Iax properties, environments• e.g., binary evolution model of Liu et al. (2010)
7 MSun + 4 MSun close binary →1 MSun C/O WD + 2 MSun He star
Postnov & Yungelson (2006)
• speculation & comparison to V445 Pup:high accretion rate → stable He burning→ C/O WD grows to MCh → deflagrationlow accretion rate → He nova
artist’s conception by Christine Pulliam (CfA)

SN Iax late-time (not nebular) spectroscopy
Jha et al. (2006)McCully et al. (2014)
Yamanaka et al. (2015)Stritzinger et al. (2015)
low line-widths ~500 km/s → barely unbound material → some fallback?significant variation → varying explosion energies?
Stritzinger et al.: The bright and energetic Type Iax SN 2012Z.
Figure 11: Comparison of late phase visual-wavelength spectraof a number of SNe Iax and other SN types. The first 5 spectra,sorted from faintest to brightest (top to bottom), are the Type IaxSNe 2010ae (Stritzinger et al. 2014), 2008ge (Foley et al. 2010),2002cx (Jha et al. 2006), 2005hk (Sahu et al. 2008), and 2012Z.Also shown are similar epoch spectra of the normal Type IaSN 1998bu, (Silverman, Ganeshalingam & Filippenko 2013),the Type Ib SN 2007Y (Stritzinger et al. 2009), and the sublu-minous Type IIP SN 2008bk (Stritzinger et al. 2014). Note inSN 2008bk Balmer lines are associated with emission from theSN ejecta, rather than with the narrower lines associated withhost nebular lines, as is the case for SNe 2002cx and 2010ae.
24
pulsating delayed detonation model (PDD; Hoeflich et al. 1995; Quimby et al. 2007; Dessart et al. 2014; Stritzinger et al. 2015)?

forbidden + permitted lines with similar velocity structure
→ densities remain high to very late timesbound remnant driving an optically thick wind?
McCully et al. (2014)
calcium-line density diagnostics
see also Barna et al. poster andKawabata et al. poster on SN 2014dt
McCully et al. (2014)
2002cx-like SNe from 3D deflagrations 2289
Figure 2. Snapshots of the hydrodynamic evolution of our model N5def. Shown are volume renderings of the mean atomic number calculated from thereduced set of species in the hydrodynamic simulation (see the colour bar). To allow a view to the central part of the ejecta, a wedge was carved out from thefront of the ejecta. (i) At 0.75 s a one-sided deflagration plume rises towards the WD surface and fragments due to Rayleigh–Taylor and Kelvin–Helmholtzinstabilities. (ii) At 1.5 s the expansion of the WD quenches the burning and the explosion ashes wrap around the unburned core. (iii) Finally, at 100 s theunburned core is completely engulfed by the explosion ashes which are ejected into space. The small triads at the bottom-right corner of each panel indicatethe scaling at the origin of each plot: from left to right the legs of the triads represent 1000, 4000 and 500 000 km, respectively.
100 s after ignition when the ejecta reach homologous expansion. Tothis end we used the LEAFS code, a three-dimensional finite-volumediscretization of the reactive Euler equations which is based on thePROMETHEUS implementation (Fryxell, Muller & Arnett 1989) ofthe ‘piecewise parabolic method’ by Colella & Woodward (1984).Deflagration fronts are modelled as discontinuities between COfuel and nuclear ash, and their propagation is tracked with a level-set scheme (Smiljanovski, Moser & Klein 1997; Osher & Sethian1988; Reinecke et al. 1999). All material crossed by these frontsis converted to nuclear ash with a composition and energy releasedepending on fuel density. Composition and energy release are in-terpolated from tables which have been calibrated using our full384-isotope network. After a very short phase of laminar burningfollowing ignition, the propagation of deflagrations is dominated bybuoyancy-induced and shear-induced instabilities and interactionswith a complex turbulent flow field. The unresolved accelerationof the flame due to turbulence is accounted for by a sub-grid-scale model (Schmidt, Niemeyer & Hillebrandt 2006a; Schmidtet al. 2006b). Self-gravity is dealt with by a monopole gravitysolver.
The hydrodynamic evolution of our model is shown in Fig. 2.Since a deflagration flame cannot burn against the density gradi-ent, our asymmetric ignition configuration leads to the formationof a one-sided deflagration plume that fragments due to Rayleigh–Taylor and Kelvin–Helmholtz instabilities. Once the deflagrationfront reaches the outer layers of the WD, the burning quenchesdue to the expansion of the WD and the ashes wrap around thestill unburned core until they finally engulf it completely. A similarevolution of the deflagration flame was already described for single-spot off-centre ignitions by e.g. Plewa, Calder & Lamb (2004) andRopke, Woosley & Hillebrandt (2007). While Plewa et al. (2004)found an ensuing detonation to be triggered when the ashes collideon the far side of the star (see also Seitenzahl et al. 2009a), we – sim-ilarly to Ropke et al. (2007) and Jordan et al. (2012b) – do not findhigh enough densities and temperatures for such a detonation to oc-cur due to a significant expansion of the WD during the deflagrationphase.
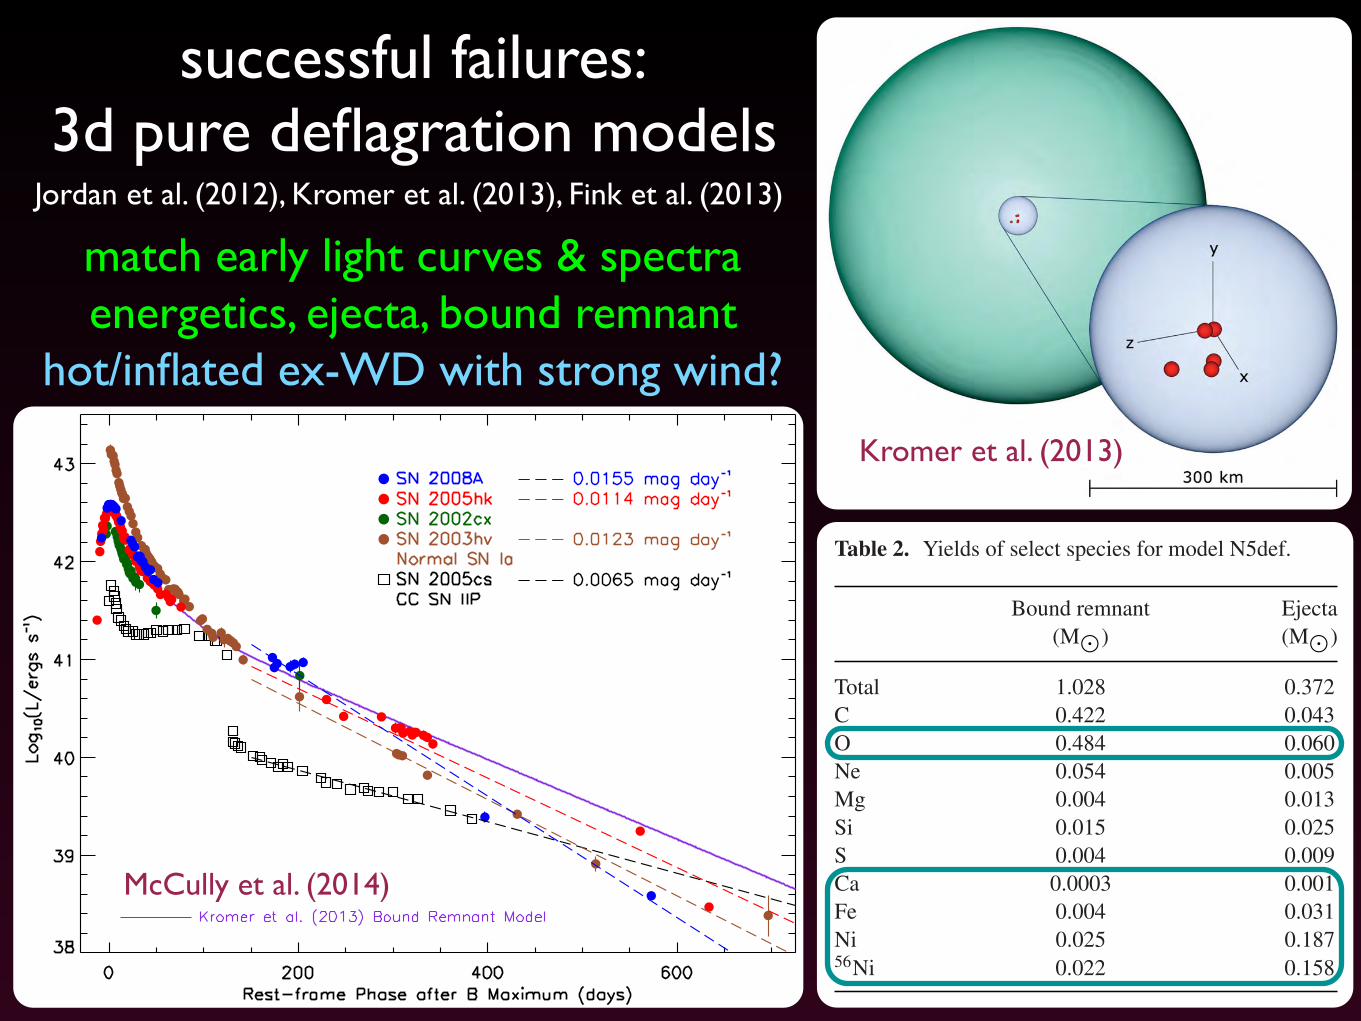
Since only a moderate fraction of the core of the WD is burned,the nuclear energy release in our simulation (Enuc = 4.9 × 1050 erg)is less than the binding energy of the initial WD (Ebind = 5.2 ×1050 erg). Nevertheless, about 0.37 M⊙ of the WD is accelerated toescape velocity and ejected into the ambient medium with a kineticenergy of 1.34 × 1050 erg. The remainder of the mass of the initialWD is left behind and forms a bound remnant. Similar findingswere already reported in 2D (e.g. Livne, Asida & Hoflich 2005) andrecently in the context of a failed gravitationally confined detonation(Jordan et al. 2012b).
To obtain detailed nucleosynthesis yields of the explosion, weperformed a post-processing calculation with a 384-isotope networkfor 106 Lagrangian tracer particles which were passively advectedduring the hydrodynamic simulation to record thermodynamic tra-jectories of mass elements (Travaglio et al. 2004; Seitenzahl et al.2010). A compilation of the masses of important species is givenin Table 2. To determine the mass that stays bound in the remnantand that of the unbound ejecta, we calculated the asymptotic spe-cific kinetic energy ϵkin, a = ϵkin, f + ϵgrav, f for all tracer particles.Here, ϵkin,f = v2
f /2 and ϵgrav, f are the specific kinetic and gravita-tional binding energies at t = 100 s, i.e. at the end of our simulation,
Table 2. Yields of select species for model N5def.
Bound remnant Ejecta(M⊙) (M⊙)
Total 1.028 0.372C 0.422 0.043O 0.484 0.060Ne 0.054 0.005Mg 0.004 0.013Si 0.015 0.025S 0.004 0.009Ca 0.0003 0.001Fe 0.004 0.031Ni 0.025 0.18756Ni 0.022 0.158
2288 M. Kromer et al.
turbulent deflagrations in WDs (Gamezo, Khokhlov & Oran 2004;Ropke & Hillebrandt 2005). The low expansion velocities are alsoin good agreement with the small amount of kinetic energy releasedin deflagration models. Such considerations led Branch et al. (2004)and Jha et al. (2006) to conclude that SN 2002cx-like objects mightbe related to pure deflagrations of Chandrasekhar-mass WDs. Thisinterpretation was supported by Phillips et al. (2007), who com-pared the broad-band light curves of SN 2005hk (a well-sampledprototypical 02cx-like event) to synthetic light curves of a 3D defla-gration model of Blinnikov et al. (2006) and found good agreementbetween the data and the model.
The models presented by Blinnikov et al. (2006), however, donot allow for a detailed comparison to the observed spectral timesequence since the multigroup approximation employed in theirradiative-transfer simulations is too coarse. Moreover, their under-lying hydrodynamic explosion models are restricted to one spatialoctant of the progenitor WD, introducing artificial symmetries to theflame evolution. Here, we report on a 3D full-star deflagration sim-ulation through to the homologous expansion phase. We performdetailed radiative-transfer calculations with the time-dependent 3Dradiative-transfer code ARTIS (Sim 2007; Kromer & Sim 2009) fromwhich we obtain a time series of synthetic spectra that we compareto the observed spectra of SN 2005hk.
The paper is organized as follows. In Section 2 we give a briefdescription of our explosion simulation and present the resultingejecta structure. In Section 3 we present synthetic observables forthis explosion model and compare them to the observed light curvesand spectra of SN 2005hk. Finally, we discuss our results and giveconclusions in Sections 4 and 5, respectively.
2 EX P L O S I O N S I M U L AT I O N
A Chandrasekhar-mass WD is believed to undergo about a centuryof convective carbon burning in the centre before a thermonuclearrunaway finally sets in. Since this so-called simmering phase ischaracterized by highly turbulent flows, it cannot be fully accountedfor by present-day numerical simulations (but see e.g. Hoflich &Stein 2002; Kuhlen, Woosley & Glatzmaier 2006; Zingale et al.2009; Nonaka et al. 2012). Thus, the actual ignition configurationof Chandrasekhar-mass WDs is not well constrained. Given thisignorance, one may use the ignition geometry as a free parame-ter and explore a larger set of explosion simulations with variousignition setups. Thereby one has to account for both different ig-nition strengths and ignition positions. A good way to achieve theformer is to use a multispot ignition scheme which seeds unstableburning modes in a robust and numerically well-controlled way.Recently, we have performed such a systematic study for differ-ent ignition setups of 3D full-star pure deflagration simulations(Fink et al., in preparation) yielding 56Ni masses between 0.035 and0.38 M⊙.
Here, we focus on a detailed comparison to SN 2005hk. For thatpurpose we select one of the models of the series by Fink et al. thatproduces a 56Ni mass of the order of the observationally derivedvalue of SN 2005hk. Applying Arnett’s law (Arnett 1982) to theobserved bolometric light curve, Phillips et al. (2007) report a 56Nimass of ∼0.2 M⊙ for this SN. With a 56Ni mass of 0.18 M⊙, modelN5def of the Fink et al. series comes close to that value.
In the N5def simulation, an isothermal (T = 5 × 10⁵ K)Chandrasekhar-mass WD was set up in hydrostatic equilibrium witha central density of 2.9 × 10⁹ g cm−3 and a homogeneous compo-
Figure 1. Ignition setup of the N5def model. Shown is a volume renderingof the WD in mint green colour. As discussed in Section 2, the ignitionkernels were randomly placed within a radius of 150 km around the centreof the WD, as illustrated by the bluish sphere. The exact configuration ofthe ignition kernels is shown in the enlarged inlay (see also Table 1).
Table 1. Position of the ignition kernels of model N5def.Given are the x, y and z coordinates of the centre of theindividual ignition kernels and their distance d to thecentre of the WD.
# x y z d(in km)
1 65.5 −15.5 24.0 71.52 38.6 −22.7 67.3 80.93 13.0 8.2 15.1 21.64 −5.0 −51.3 −2.6 51.75 5.6 2.9 0.6 6.3
sition of carbon and oxygen in equal parts by mass.1 To account foran assumed solar metallicity of the zero-age main-sequence pro-genitor, we start with a Ye of 0.498 86, corresponding to 2.5 per centof 22Ne in the initial composition. The WD was then discretized ona three-dimensional Cartesian moving grid (Ropke 2005) with 5123
cells consisting of two nested parts (central resolution of 1.9 km)and ignited in five spherical ignition kernels that were placed ran-domly in a Gaussian distribution within a radius of 150 km from theWD’s centre. By chance, for model N5def this algorithm produceda fairly one-sided ignition configuration with all kernels lying ina relatively small solid angle. Thus, this configuration is represen-tative for a slightly off-centred single-spot ignition with a largernumber of initially excited burning modes. The actual configura-tion is shown in Fig. 1. All kernels have a radius of rka = 10 kmand are at distances d between 6.3 and 80.9 km from the origin (seeTable 1).
Neglecting any possible deflagration-to-detonation transition [seeSeitenzahl et al. (2012) for an alternative evolution of this model in adelayed-detonation scenario] we followed the flame evolution up to
1 Although the detailed flame evolution depends on the exact value of thecentral density (which is not well constrained for Chandrasekhar-mass WDs;e.g. Seitenzahl, Ciaraldi-Schoolmann & Ropke 2011), it is not expected tohave a qualitative impact on the outcome of the explosion.
Kromer et al. (2013)
successful failures:3d pure deflagration models
Jordan et al. (2012), Kromer et al. (2013), Fink et al. (2013)
match early light curves & spectraenergetics, ejecta, bound remnant
hot/inflated ex-WD with strong wind?

SN 2012Z +4 years
• detected in January 2016 deep HST imaging
• extrapolation of earlier decline: “supernova” (ejecta) flux should not be significant now
• not fainter than pre-explosion, still consistent with S1 being the companion star
• source of excess flux?• impacted companion?• wind photosphere?• bound remnant?• other energy source
in SN ejecta???

carbon flame quenching can lead to hybrid WDs with central carbon even up to 1.3 M☉higher initial mass stars can still lead to WDs capable of thermonuclear explosion+ less accretion to trigger carbon runaway
→ shorter delay times
CONe WD + He star: shortest time to MCh WD SN
hybrid CONe white dwarfsEvolution of SN Ia progenitors 1279
Figure 4. Similar to Fig. 1; all three cases have an initial mass of 6.5 M⊙ and convective boundary mixing for C-shell burning. Shown are three runs withCBR factors of 1, 10, and 100 from top to bottom. These stellar models with the same initial mass illustrate the three different types of cores that can beproduced depending on the CBR. The shown models lie on the black dashed line seen in Fig. 5.
model would imply that the initial mass for the formation of COWDs is slightly increased and CO core masses could be up to1.1 M⊙. The more interesting implication however is the possibilityof unknown resonances that would increase the CBR and may leadto a decrease of the maximum initial mass to form CO WDs andlimit the maximum CO WD core mass to ≈0.93 M⊙.
For the case in which a small amount of convective boundarymixing leads to the formation of hybrid C–O–Ne WDs, the im-plications of the CBR uncertainties are more significant. If C–O–
Ne WDs can ignite a thermonuclear runaway, the mass range ofSN Ia progenitor WDs could increase significantly. Hybrid WDsthat could form if the reduced hindrance CBR is appropriate couldbe as large as ≈1.3 M⊙. Such a large WD mass would make reach-ing the Chandrasekhar limit much easier, since only a small amountof mass has to be accreted. In addition, the maximum initial massin this case could be just in excess of 8 M⊙. This would implya significantly shorter SN Ia delay time compared to the standardcase.
MNRAS 440, 1274–1280 (2014)
at Rutgers U
niversity on August 2, 2015
http://mnras.oxfordjournals.org/
Dow
nloaded from
Denissenkov et al. (2013), Chen et al. (2014), Meng & Podsiadlowski (2014), Wang et al. (2014),
Kromer et al. (2015), Liu et al. (2015) CO
ONe
CONe
6
3.03.54.04.55.05.5
log10 (Teff/K)
2.0
3.0
4.0
5.0
6.0
log 1
0(L/L
⊙)
CO WD+He star (Ch-mass)
MiWD
= 0.865, 0.9, 1.0, 1.1M⊙
STARS
3.03.54.04.55.05.5
log10 (Teff/K)
2.0
3.0
4.0
5.0
6.0
log 1
0(L/L
⊙)
BPS
SN 2012Z− S1
-2
-1
0
1
3.03.54.04.55.05.5
log10 (Teff/K)
2.0
3.0
4.0
5.0
6.0
log 1
0(L/L
⊙)
CO WD+He star (Ch-mass)
MiWD
= 0.865, 0.9, 1.0, 1.1, 1.2M⊙
STARS
3.03.54.04.55.05.5
log10 (Teff/K)
2.0
3.0
4.0
5.0
6.0
log 1
0(L/L
⊙)
BPS
SN 2012Z− S1
-2
-1
0
1
3.03.54.04.55.05.5
log10 (Teff/K)
2.0
3.0
4.0
5.0
6.0
log 1
0(L/L
⊙)
Hybrid CO-Ne WD+He star (Ch-mass)
MiWD
= 1.1, 1.2, 1.3M⊙
STARS
3.03.54.04.55.05.5
log10 (Teff/K)
2.0
3.0
4.0
5.0
6.0
log 1
0(L/L
⊙)
BPS
SN 2012Z− S1
-2
-1
0
1
Figure 2. Left column: similar to panel (b) of Fig.1, but only for the He-star donor Ch-mass scenario. Right column: the distributions(in logarithmic scale) of companion stars in the the plane of (log10 Teff , log10 L), which are obtained from BPS calculations assuming aconstant star formation rate of 3.5M⊙ yr−1. Here, the C/O WD+He star (top + middle row) and hybrid C/O/Ne WD+He star (bottomrow) Ch-mass channel are considered, respectively. To better compare with the observation of the SN 2012Z-S1 (the error in red, seeMcCully et al. 2014), we show the results from the C/O WD+He star channel by including (middle row) or excluding (top row) thecalculations with an initial WD mass of 1.2M⊙.
of SN 2012Z-S1 is only consistent with the predicted com-panion locations from the hybrid WD+He star scenarioand the C/O WD+He star scenario with an initial C/OWD mass of 1.2M⊙. Taking the problem of the origin ofvery massive C/OWDs into account, our detailed binaryevolution calculations seem to disfavor that SN 2012Z-S1is a non-degenerate companion star to a C/O WD, it ismore likely to be a He star with a hybrid C/O/Ne WD.Because the hybrid WDs have much lower C to O abun-dance ratios at the moment of the explosive C ignition
than their pure C/O counterparts (Denissenkov et al.2015), which probably lead to different observationalcharacteristics from those of the Ch-mass C/O WDs af-ter the SN explosions and thus being distinguished byspectroscopy observations. Recently, an off-centre defla-gration in a near Ch-mass hybrid C/O/Ne WD has beensimulated by Kromer et al. (2015). This showed that de-flagrations in near Ch-mass hybrid C/O/NeWDs can ex-plain the faint SN Iax SN 2008ha (Kromer et al. 2015).However, only a simple near Ch-mass hybrid C/O/Ne
The Astrophysical Journal Letters, 794:L28 (5pp), 2014 October 20 Wang et al.
Figure 2. Distribution of the initial CONe WD masses that can ultimatelyproduce SNe Ia with different values of αceλ.(A color version of this figure is available in the online journal.)
strongly dependent on the choice of the initial conditions; theyare sensitive to the choice of the CE ejection parameter, CBR,IMF, and initial mass ratio distribution, etc. Notably, if we adoptan extreme mass-ratio distribution with uncorrelated componentmasses (set 8), the SN Ia birthrate will decrease significantly.This is because most of the donors in this scenario are notmassive, the result of which is that WDs cannot accrete enoughmass to grow to the Chandrasekhar mass.
In Figure 3, we compare the evolution of SN Ia birthrates fora constant SFR (3.5 M⊙ yr−1; left panel) and a single starburst(right panel). According to our standard model (set 2), the SN Iabirthrates are ∼0.298 × 0−3 yr−1, which is roughly one-tenth ofthe observed birthrate (∼3 × 10⁻³ yr−1; Cappellaro & Turatto1997). Even the largest birthrate in our BPS model (set 7) is onlya factor of two greater. This indicates that the CONe WD + Hestar scenario can only be responsible for part of the total SN Iabirthrate (for other SN Ia formation scenarios, see Wang & Han2012). We note that SN Ia birthrates will become lower withthe decrease in αceλ (see the left panel). This is because morebinaries after the CE ejection may merge with a low αceλ. In
Figure 4. Distribution of properties of the donors in the plane of (log Teff , log L)when the WDs grow to 1.378 M⊙. Here, we set αceλ = 1.5 (set 3). The dashedline denotes the final region obtained from the binary calculations in Figure 1.The error bars present the location of the possible companion in the SN 2012Zprogenitor system, the luminosity and temperature of which are based on ablackbody approximation of the measurements of McCully et al. (2014).(A color version of this figure is available in the online journal.)
addition, the SN Ia birthrates decrease with the CBR factor; ahigh CBR factor will result in a small upper mass limit for theCONe WDs, and consequently a low birthrate.
In Figure 3, we also present the delay time distributionsof SNe Ia obtained from a single starburst (see the rightpanel). From this panel, we see that SN Ia explosions occurbetween ∼28 Myr and ∼178 Myr after the starburst, whichmay contribute to the population of young SNe Ia in late-typegalaxies. Wang et al. (2009b) found that the minimum delaytime from the CO WD + He star scenario is ∼45 Myr, whichis longer than the results obtained in this work. It seems thatSNe Ia from the CONe WD + He star scenario are the youngestof all current progenitor models.
3.3. Surviving Companions of SNe Ia
The donor star in the CONe WD + He star scenario would sur-vive and potentially be identifiable if the WD was completelydisrupted at the moment of the SN explosion (e.g., Wang &Han 2009; Pan et al. 2010; Liu et al. 2013). By interpolating in
Figure 3. Left panel: the evolution of SN Ia birthrates for a constant SFR with different BPS simulation sets. Right panel: similar to the left panel, but for a singlestarburst.(A color version of this figure is available in the online journal.)
3
signatures in explosion → spectra?

20132005-‐‑2006
http://www.latimes.com/science/sciencenow/la-sci-sn-nasa-hubble-zombie-star-20140806-story.htmlhttp://www.latimes.com/science/sciencenow/la-sci-sn-nasa-hubble-zombie-star-20140806-story.html
conclusions
• white dwarf supernovae encompass more than just normal SN Ia
• SN 2012Z: detection of a progenitor systemfor a thermonuclear, white dwarf supernova in pre-explosion data
• a single degenerate system that exploded!
• late-time HST observations are still consistent with this picture
• a model for SN Iax:a CO (or hybrid CONe) WD accretes He from a He star companionpure deflagration explosion near MCh without complete disruptionSN ejecta + bound remnant driving an optically thick winddiversity from deflagration strength & how much mass is ejected/bound
• SN Iax model much more constrained than models for normal SN Ia!Supernovae Through the Ages Rapa Nui August 12, 2016