type ia supernovae and the essence supernova survey kevin krisciunas
Post on 22-Dec-2015
216 views
TRANSCRIPT

Type Ia supernovae and the ESSENCE supernova survey
Kevin Krisciunas


There are two basic kinds of supernovae. Roughly 1 outof 1000 stars that forms has a mass greater than 8 M
sun.
Shortly after such a star develops an iron core, it explodesas a Type II SN.

Type II SNeshow atomichydrogenlines inemission.

Common photometric bands in astronomical photometry:
Filter mean wavelength (m)
U 0.36 B 0.44 V 0.55 R 0.65 I 0.80 Y 1.03 J 1.25 H 1.65 K
s 2.20

Optical andnear-IRlight curvesof the Type II-PSN 2003hn.
Krisciunas et al. (2009)

When a single massive star blows up as a Type II SN:
1) elements heavier than iron (up to uranium) are produced; and
2) a compact remnant is left behind (either a rapidly rotating neutron star or a black hole)
3) 99 percent of the energy of the explosion is radiated away in the form of neutrinos

The most common end state for a star is awhite dwarf.

S. Chandrasekhar (1910-1995)
From a consideration of the equation of state ofrelativistic degenerate matter, Chandrasekhar discovered in 1930 that more massive white dwarfstars were smaller than less massive ones. If awhite dwarf star had a mass approaching 1.4 M
sun its
radius ---> 0.

Binary stars are very common in the universe. Someare close enough that they influence each other's evolution.

It is generally believed that a Type Ia SN is a carbon-oxygen white dwarf that acquires mass froma nearby donor star. When the mass of the WD exceeds1.4 M
sun the WD completely obliterates itself.
The spectra of Type Ia supernovae are characterized byhaving no hydrogen emisssion. The prime signatureis a blue-shifted absorption line of singly ionized siliconobserved at ~6150 Angstroms.


Two Type Iasupernovae atabout the samenumber of daysafter explosion.The spectra arealmost identical.
Krisciunas et al. (2007)

Light curves of SN 2004S in the optical and near-IR bands.
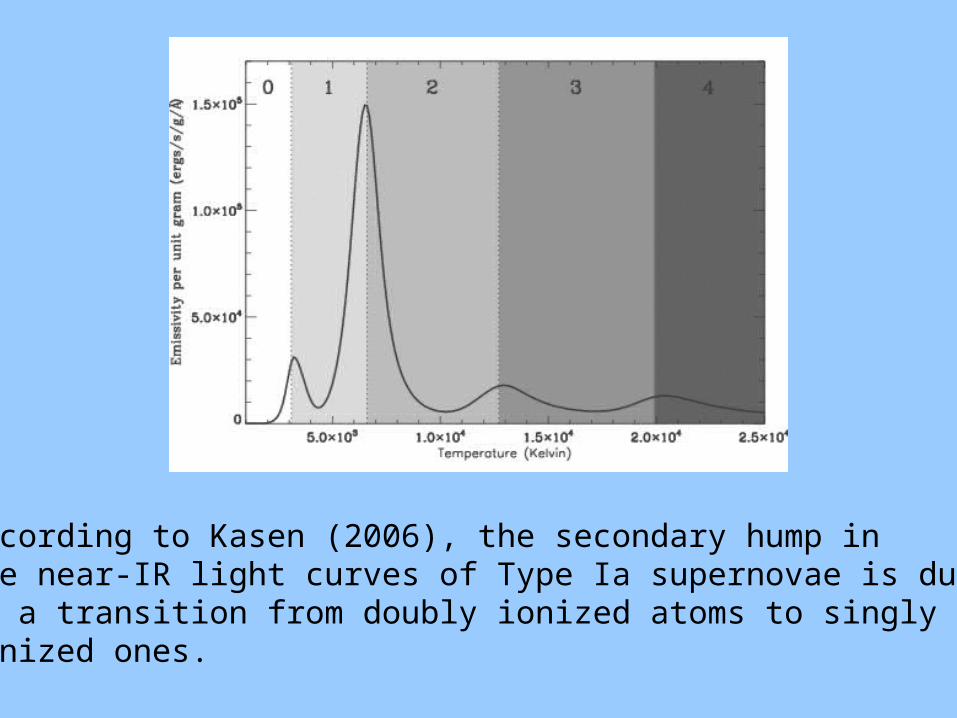
According to Kasen (2006), the secondary hump inthe near-IR light curves of Type Ia supernovae is dueto a transition from doubly ionized atoms to singlyionized ones.

The astronomical magnitude system was originatedby Hipparchus in the 2nd century BC. The brighteststars in the sky are said to be “of the first magnitude”.The faintest stars visible to the unaided eye are 6th magnitude. For two stars of intensity I
1 and I
2 their
apparent magnitudes are related as follows:
m2 –m
1 = log (I
2/I
1)
Thus, if we receive 100 times as many photons persecond from star 1 than from star 2, star 1 is 5 magnitudesbrighter than star 2.

B-band lightcurves of twoType Iasupernovae.The “declinerate” is thenumber ofmagnitudes itgets fainterin the first15 days aftermaximum light.

The distance at which the radius of the Earth's orbitsubtends an angle of 1 second of arc = 1 parsec(3.086 X 10¹³ km). Astronomers needed a standarddistance at which to compare the apparent magnitudesof stars in order to be able to compare their instrinsicbrightness. They chose a standard distance of 10 pc.
The apparent magnitude a star would have if it were ata distance of 10 pc is called the absolute magnitude (M).
M = m + 5 –5 log (dpc
)
mM = 5 log (d) – is a measure of distance, and is called the distance modulus.

At optical wave-lengths, the absolutemagnitudes of TypeIa supernovae atmaximum brightnessare related to thedecline rate parameter.These supernovae arestandardizablecandles. The brighterones are 4 billion times brighter thanthe Sun!
Garnavich et al. (2004)
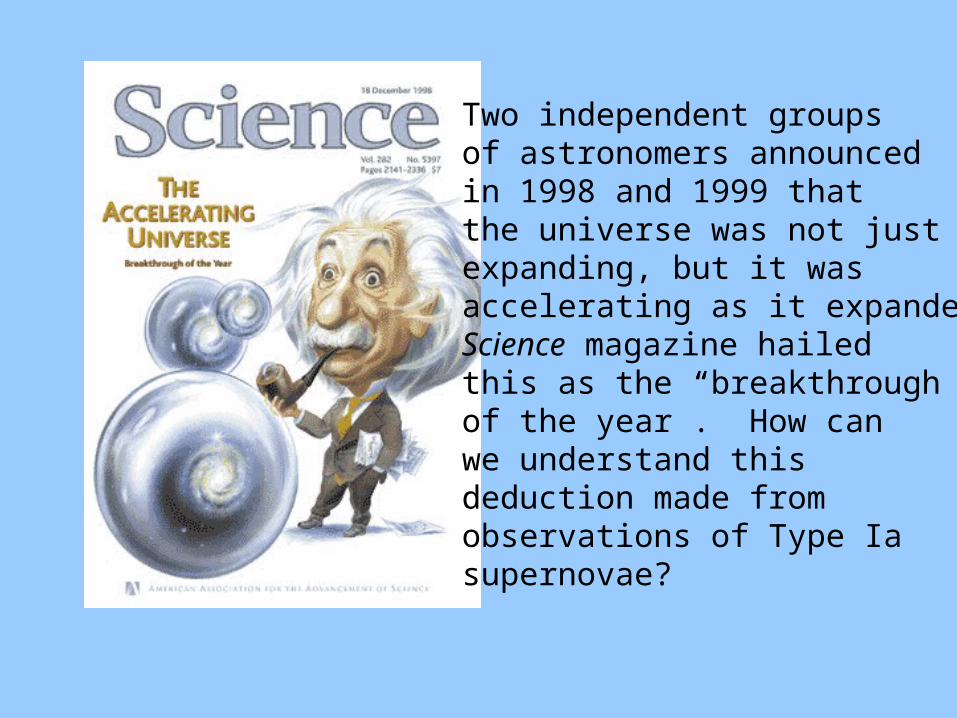
Two independent groupsof astronomers announcedin 1998 and 1999 thatthe universe was not justexpanding, but it wasaccelerating as it expanded.Science magazine hailedthis as the “breakthroughof the year”. How canwe understand this deduction made fromobservations of Type Iasupernovae?

For nearby galaxies the velocity of recession is related tothe distance (in Megaparsecs) according to Hubble's Law:
V (km/sec) = H0 D
Mpc ,
where H0 ~ 72 km/sec/Mpc is the Hubble constant.
The redshift z = (~ v/c for low redshift). Beyond a redshift of ~0.1 we must must alsoconsider the curvature of space-time, which is related to the mass density parameter
M = crit
.
After much grinding away, we can obtain an expressionfor the effective distance (aka proper motion distance):

If the density of the universe is very small compared tothe critical density, then
The arrival rate of photons from a distant galaxy in anexpanding universe is diminished by (1 + z). Thefrequency of the photons is likewise diminished by(1 + z). The flux is then related to the luminosity by:

We can then define a luminosity distance to be:
For extragalactic astronomy, where distances are measuredin Mpc instead of parsecs, the formula for distance modulusthen becomes:

The curvature of the universe depends on themass density parameter
M = crit
, where
crit
= 3 H0
2 / [ 8 G ] .
If we scale Einstein's cosmological constantas follows:
c2 / [3 H0
2 ] ,
this is the (dimensionless) scaled Dark Energy parameter. The universe has flat geometry if
M
+

Loci of distancemodulus vs. redshiftfan out in the Hubblediagram, depending on what the mass density parameter
M and the Dark
Energy density are.

It is common to pick one of the loci in the previous diagramas a reference and to plot a differential Hubble diagram.The expectation prior to 1998 was that Type Ia supernovaewould fall along the “open” line in this diagram.

Riess et al. (2004)
The gravitational attraction of all the matter in the universeis not enough to show a deceleration of the universe.The SN points fall along a curve that is most easilyinterpreted as evidence for a positive cosmologicalconstant.

Krisciunas et al. (2005)
Instead of using the strategically chosen bins to provide the medians shown in the previous diagram, a graph of theindividual points (along with some ESSENCE objects) is not nearly as convincing.

Also, how do we know that distant supernovae arejust like nearby ones?
Previous SN survey work had relied on photometrytaken with a variety of telescopes, cameras, and filters.Even with knowledge of the effective transmission functions of different filters, it is difficult to unscrambledifferences in the photometry owing to features ofthe hardware and the intrinsic differences amongstsupernovae.
What was needed was a systematic search carried outon the same telescope, with the same camera, and withthe same filters.

ESSENCE = Equation of State. SupErNovae trace Cosmic Expansion
● Objects discovered with CTIO 4-m + prime focus camera● Almost all photometry from CTIO 4-m● Oct-Nov observing every other moonless night 2002-7● 32 principal fields (each 0.6 deg X 0.6 deg)● Imagery obtained in R, I bands (rest frame U, B, V)● Spectra from Keck, VLT, Gemini, Magellan● Some optical and IR imagery from HST and Spitzer

We observed on 191 nights with the CTIO 4-m.
5458 R- and I-band images
2000 transients detected by pipeline
400 spectra obtained
~220 Type Ia supernovae identified

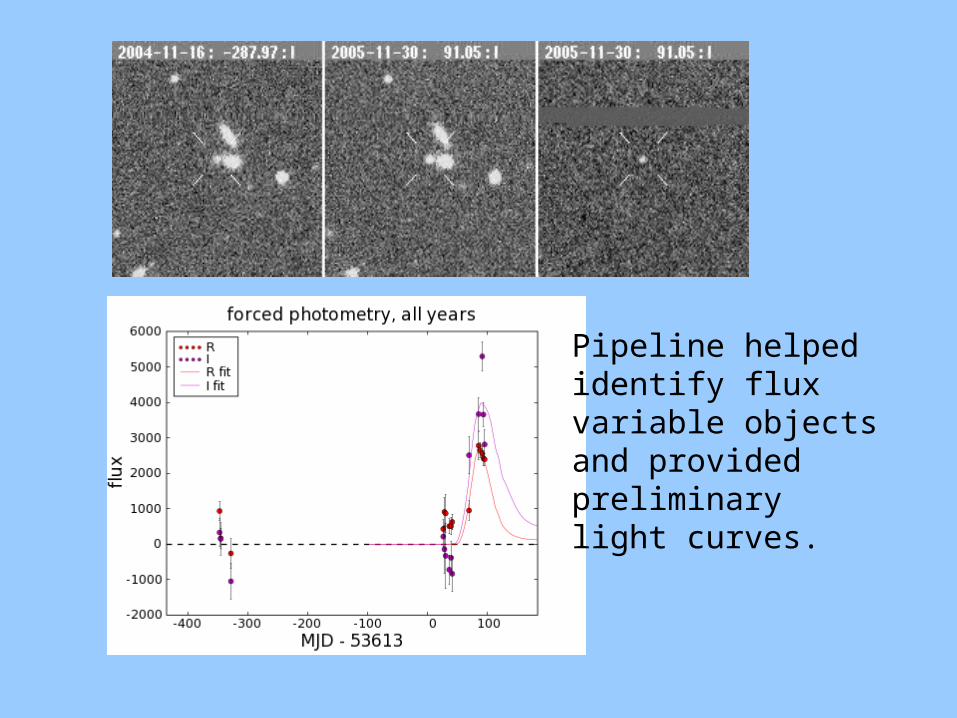
Pipeline helpedidentify fluxvariable objectsand provided preliminarylight curves.

Histogram of redshifts of ESSENCE Type Ia supernovaediscovered from 2002 (bottom) to 2007 (top).

9 ESSENCEobjects thatwere alsoobservedwith HST.
We found alot of blueslow decliners.

The appropriate formula for the luminosity distancegiven flat geometry and a non-zero Dark Energydensity that is not necessarily the same as Einstein'scosmological constant is:
Here w = P / (c2) is the equation of state parameter.If w = -1, then the Dark Energy is equivalent to Einstein's cosmological constant.

Our differential Hubble diagram can provide a valueof w, but we need to control systematics in the photometryto the level of a few hundredths of a magnitude.
w = 1 ifDark Energyis the same asEinstein'scosmologicalconstant.

The goal of the ESSENCE project was to try to measurethe equation of state parameter to +/- 10 percent.
We're still working on the data, but we have a prettygood idea what our final result will be.

Differential Hubble diagram of nearby Type Ia supernovae(red), ESSENCE objects (black) and 1st year of LegacySN search (blue).

SN data combined with data from baryon acoustic oscillations(BAO) give
M + = 1 at the 68 percent confidence level.

Also, within 1- the equation of state parameter isequal to , indicating that Einstein (1917) mighthave been right after all.

Our preliminary answer is w =
If w is less than , then eventually the universe willbe accelerating so fast that everything will be rippedapart. This is called the Big Rip.
If w = 0.98 or so, then various string theory modelscould hold.

We live ata curioustime in cosmichistory,when thematter andDark Energydensitiesare comparable.


What's next?
Dark Energy Survey (w/ refurbished CTIO 4-m)
Large Synoptic Survey Telescope (LSST)
Joint Dark Energy Mission (JDEM)
pushing the rest-frame optical and infrared Hubble diagrams to higher redshift

Krisciunas et al. (2004a)
At near-IRwavelengthsType Ia super-novae are notjust standardizablecandles. Theslow declinersand mid-rangedecliners are standard candles.

Decline rate relations in the near-IR

In the near-IRType Ia SNethat peak earlyare standardcandles, evenif they are fastdecliners. Thefast declinersare subluminousin the opticalbands.