type 1 diabetes pre-clinical research
TRANSCRIPT

Biomedical Research Models, Inc.
Founded 1996 www.brmcro.com
67 Millbrook St., Suite 422
Worcester, MA 01606

Diabetes Mellitus is Not a Single Disease
ABSOLUTE INSULIN
DEFICIENCY
TYPE 2 (NIDDM)
MODY (Maturity Onset
Diabetes of the Young) TYPE 1b (IDDM)
TYPE 1a (IDDM)
LADA (Latent Autoimmune Diabetes in Adults)
RELATIVE INSULIN
DEFICIENCY
DIABETES SPECTRUM
HYPERGLYCEMIA

Type 1 Diabetes

Genetics, Environment and T1A Diabetes
• The environment seems to be important in human T1Diabetes
• Monozygotic twin with the disorder: ~50% concordance
• The incidence of type 1 diabetes is increasing • Finland, Sardinia, the Baltic States, Poland
• Is this genetics, environment, or both?

Candidate Environmental Agents
• Toxins • e.g. nitrosoureas
• Diet • e.g. cow milk protein • Toll-like receptor ligands (e.g. LPS)
• Infection • e.g. mumps, rubella, measles • “Hygiene”

Epidemiology of Type 1A Diabetes
• Seasonal Variation • Lower incidence in Finnish boys in June with a
spike in November-December • Correlations of Type 1A diabetes onset with:
• Coxsackie B • Mumps • Rubella • CMV,EBV, Retrovirus are less clearly associated
Viruses and Human T1D
• Epidemiological studies suggest association • “Causality” is unproven • No evidence of direct viral infection of islets • Other putative mechanisms include:
• Bystander T-cell activation • Molecular mimicry • T cell activation by viral superantigen

Changing Incidence of Autoimmunity In
cide
nce
of In
fect
ions
Dis
ease
s (%
)
1950 1990 1980 1970 1960 2000
Rheumatic fever
Mumps Measles
Tuberculosis
Hepatitis A
0
100
50
Inci
denc
e of
Imm
une
Dis
ease
s (%
)
1950 1990 1980 1970 1960 2000
Multiple sclerosis
Crohn’s Disease
Asthma
Type 1 diabetes
100
200
300
400

“Spontaneous” Type 1 Diabetes
Human NOD BBDP Rat MHC Multiple I-Ag7 RT1B/Du
Other Loci ~18 ≥27 >5
Gender M=F F>M M=F
Insulitis + + +
DKA + +/- +
AutoAbs + + +

Rat Models of Autoimmune Diabetes:
• Spontaneous • BBDP/Wor • BBZDP/Wor • Long Evans
Tokushima Lean (LETL)
• Komeda Diabetes Prone (KDP)
• LEW.1AR1/ Ztm-iddm
• Induced • YOS • PVG • PVG.RT1u • PVG.R8 • WAG • BBDR/Wor • WF.iddm4
congenic
• Both • MAD
(LEW.1WR1) • Transgenic • None
Strains in blue are maintained by BRM

Insulitis in Human, Rat, and Mouse
BBDP/Wor Human Pancreas
NOD Mouse

The Diabetes Prone BB Rat
• Oldest Model of Spontaneous Type 1 Diabetes
• Evidence for Autoimmunity • Pancreatic insulitis • Class II MHC associated (RT1u) • T cell dependent
• Preventable by immunosuppression • Transferable to adoptive recipients
• Autoantibodies • Lymphocytic thyroiditis

Tolerance in the Presence of Genetic Susceptibility
A A A
R
β
Autoim
munity
CD4+ART2+ Treg Transfusion
A A R
R R A
β
Tolerance BBDP/Wor Rat

Environmental Considerations • Viruses have been shown to alter the tempo of diabetes among
BBDP/Wor rats • Some viruses delay the onset of diabetes
• (SDAV,LCMV and Sendai) • Others accelerate (RCMV) • Incidence of diabetes in virus free colony ~85%
• In BBDR rats virus can induce resistant rats to develop autoimmune disease • Hashimoto’s Thyroiditis • Type 1 Diabetes • No spontaneous diabetes among virus free rats

• Parvovirus in the BBDR Rat
• Kilham’s rat virus (KRV) • Single stranded DNA virus • 3 overlapping structural proteins, VP1, VP2 and VP3 • 2 overlapping nonstructural proteins, NS1 and NS2
• Parvovirus B19 associated with autoimmune
rheumatoid arthritis in humans (Simpson et al 1984 Science 223:1425)
• BBDR rats are an animal model for Rheumatoid
Arthritis (Watson et al. 1990 J.Exp.Med 172:1331)

Susceptibility and Mechanism of Parvovirus Induced Diabetes
• Protocol • 21-25 day old male and female animals • 1 x 10⁷ PFU KRV i.p. on day 0
• Monitor plasma glucose and body weight
• Experimental data demonstrates that the virus
• working through TLR-9 • creates and immune imbalance

Diabetes in Parvovirus (KRV) infected BBDR Rats
Days After Infection
0 10 20 30 40
Cum
ulat
ive
Dia
bete
s-Fr
ee
Surv
ival
(%)
0
20
40
60
80
100
KRV Alone (N=24)

Immunological Balance Tolerance and Autoimmunity in BB rats
A A A
R
β
Autoim
munity
CD4+ART2+ Transfusion “Treg” Cells
A A R
R R A
β
Tolerance
ART2+ Treg Depletion
Virus Infection
BBDP BBDR
TLR Ligation

Diabetes in Parvovirus vs. H-1 Infected BBDR Rats
Days After Infection
0 10 20 30 40
Cum
ulat
ive
Dia
bete
s-Fr
ee
Surv
ival
(%)
0
20
40
60
80
100
KRV Alone (N=24) H-1 Alone (N=6)

Parvovirus Reduces Splenic Treg Cells
BBDR WF
CD
4+ CD
25+
Treg
Spl
een
Cel
ls (%
)
0%
1%
2%
No Virus KRV H-1
N.D.

BBDR Summary 1
• BBDR rats show virus-specific susceptibility to the triggering of T1D
• Virus-induced Treg modulation may be one mechanism of viral induction of diabetes

Innate Immune Responses Trigger T1D in Rats
• Adaptive Immunity • Pathogen-specific defense • Involves the MHC and T Cell Receptor • Long lasting immunity
• Innate Immunity • First line of defense • Activation of immune responses through toll-like
receptors (TLRs) that recognize pathogen associated molecular patterns (PAMPs)

Hypothesis and Method • Innate immune responses produced by TLR
ligation will induce T1D in resistant rats • Polyinosinic:polycytidylic acid (poly I:C)
– A synthetic double-stranded polyribonucleotide – Ligand of toll-like receptor 3 (TLR3) – Strong inducer of cytokines – A simple tool for testing multiple strains

TLR3 Ligation Can Induce Diabetes
Strain RT1 B/D Diabetes
MAD (LEW.1WR1) u 22/22
BBDR u 20%-100%
PVG.RT1u u 26/30
LEW.1AR1 u 4/20
PVG.R8 u 6/9
LEW.1AR1-iddm u 0/10
WF u 1/22
WAG u 1/9
Treatment with poly I:C alone for 2-3 weeks; insulitis data concordant Data from Ellerman and Like, Tirabassi et al., and Hedrich et al.

Synergy: Diabetes After Virus Infection and Activation of Innate Immunity
Days After Infection 0 10 20 30 40
Cum
ulat
ive
Dia
bete
s-Fr
ee
Surv
ival
(%)
0
20
40
60
80
100
KRV Alone (N=24) KRV after Poly I:C (N=6) H-1 Alone (N=6) H-1 after Poly I:C (N=10)

Parvovirus (KRV) Itself May Act via TLR9
StimulusCpG KRV Poly I:C
IL-1
2p40
(% o
f Con
trol)
0
20
40
60
80
1000.1 µg/ml 1 µg/ml 10 µg/ml
The ability of spleen cells to respond to KRV by producing IL12-p40 is inhibited by iCpG, an inhibitor of TLR9 (Dr. D Zipris)

BBDR Summary 2 • Innate immune activation can trigger T1D in
many but not all rat strains with a high risk MHC haplotype
• Innate immune activation can synergize with viral infection to increase the penetrance of T1D
• One diabetogenic virus, KRV, may act in part via activation of TLR9
New Model of Type1 Diabetes The MAD Rat (LEW.1WR1)
• Recombinant inbred congenic strain • Same MHC class II RT1B/Du haplotype required for autoimmune
diabetes in BB, Komeda, and LEW.1AR1/Ztm-iddm rats
• In the colony of rats maintained at BRM, Inc.: • Spontaneous diabetes absent from acquisition in 1989 until 1999 • Now occurs at low frequency (0.5-3%)
• Develop autoimmune insulitis and diabetes when treated with poly I:C, a ligand of toll-like receptor 3 (TLR3)

Extending the Scope of Viral Triggers: The MAD Rat
• The BBDR + KRV combination is not unique • LEW.1WR1 Rats
– MHC-Congenic LEW rats – High risk MHC class II RT1B/Du haplotype – Normal immunological phenotype – Diabetes occurs at consistently but at low
frequency (~2.5%)

Hypothesis
• Given its genetic predisposition to spontaneous T1D:
• Viral infection will trigger T1D in MAD rats

Rat Cytomegalovirus (RCMV)
• Beta-herpesvirus homologous to human cytomegalovirus • Persistent and latent infections
• No reported associated diseases • Stocks are prepared from salivary glands

Relevance to Human Disease
• Human Cytomegalovirus (HCMV) • Associated with autoimmune diseases
• Ubiquitous pathogen causing unapparent infections in immunocompetent individuals
• Peptide from HCMV protein stimulate CD4+ T cells that recognize GAD
• Organ transplantation
• Currently no effective vaccine

MAD Rats are Sensitive to Virus-Induced Diabetes
Treatment N % Diabetic Grade
None 6 0 n.a.
Kilham Rat Virus 8 38 3.3
H-1 Virus 20 0 n.a.
Rat Cytomegalovirus 16 44 4.0
Vaccinia virus 10 0 n.a.
Coxsackie B4 10 0 n.a.
Tirabassi, et. al. 2004. Diabetes. 53 Supplement 2:A301

Diabetes in BBDR and MAD Rats Summary of Induction Studies
Method BBDR/Wor MAD Spontaneous - +
Anti-Art2a - +
TLR3 ligands - +
Parvovirus 21days + +
RCMV -/+ + +
TLR 3 + Art2a + + Parvovirus 45days - +

Diabetogenicity of five TLR agonists in MAD rats
Group Test Article
TLR
Induction of
Diabetes
Induction Of
Arthritis
Gender Bias
1 Poly I:C (primarily HMW) TLR3 ++++
No ♀ = ♂
2 LMW poly I:C (purified) TLR3 ++++ 3 HMW poly I:C (purified) TLR3 ++++ 4 Zymosan TLR2 +++ 5 R848 TLR7 ++ 6 CpG oligodeoxynucleotide TLR9 -
The dosing regimen was 3 times weekly by intraperitoneal injection beginning at 21-24 days of age. Compounds were administered to 6 female and 6 male rats at each dose of compound. Animals were treated over a 30 day period and were monitored for diabetes from 7 to 40 days after the initiation of treatments

Serial Viral Infection Alters Diabetes Incidence
Virus % Diabetic
BBDR MAD
Parvovirus 41% 38%
RCMV 6.3% 44%
Parvovirus→ RCMV
0% 40%
RCMV→KRV 75% 90%

RCMV accelerates diabetes onset in Diabetes Prone BB rats
0 5
0
20
40
60
80
10030 40 50 60 70 80 90 100 110 120
RCMV/mockinfection
+ RCMV
- RCMV
RCMV INFECTED (n = 47)CONTROLS (n = 29)
Age (days)
% D
iabe
tic B
B-D
P r
ats
p = .0043 (Kaplan-Meier Log Rank)
van der Werf et al 2003: Clin Dev Immunol. 10:153
Hillebrands et al 2003: Clin Dev Immunol 10:133
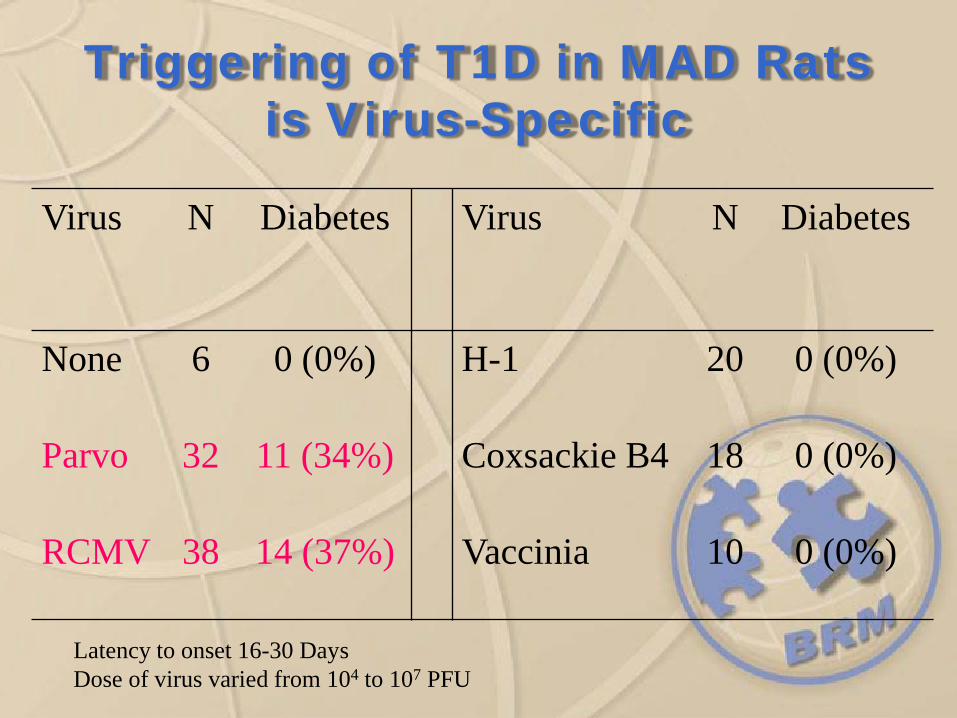
Virus N Diabetes Virus N Diabetes
None 6 0 (0%) H-1 20 0 (0%)
Parvo 32 11 (34%) Coxsackie B4 18 0 (0%)
RCMV 38 14 (37%) Vaccinia 10 0 (0%)
Triggering of T1D in MAD Rats is Virus-Specific
Latency to onset 16-30 Days Dose of virus varied from 104 to 107 PFU

RCMV Infected Cells in Salivary Glands But Not in Pancreatic Islets
Immunohistochemistry for RCMV early antigen (mAb 8)
Salivary Gland (mAb8) Islet (H&E) Islet mAb8

Conclusions Virus Triggering of T1D in Resistant Rats
• T1D can be triggered in the rat by: – Specific viral infections – Two infections that are synergistic – TLR ligation – Certain viruses only in an immune system “pre-
activated” by TLR ligation

Topic 2 Prevention by Immunization
• If viral infections do promote diabetes onset in susceptible rats with normal immune systems…
• Then immunization may prevent the disease

“Immunized Pups”
X
Immunized Female
Naïve Male
Virus
Non-Diabetic
Virus Diabetes?
A “Maternal Immunization” Protocol
MAD rat Females

Maternal Immunization Protects Weanling MAD Rats from Virus-Induced Diabetes
0
Cum
ulat
ive
Dia
bete
s-Fr
ee
Surv
ival
(%)
0
20
40
60
80
100
Days After Infection 10 20 30
Pups born to RCMV+KRV Immunized Dam (N=10)
KRV+RCMV co-infection Ordinary pups (N=10)
Pups born to RCMV Immunized Dam (N=26)
Ordinary pups (N=13)
RCMV
Conclusion
• Maternal immunization can provide effective and specific protection from virus-induced diabetes in weanling rats
• Diabetes may be preventable by vaccines that target candidate pathogens
• Rats like the MAD can be used to test diabetes vaccination strategies

T-1D RAID Programs
• Rapid Access to Interventional Development for Type 1 diabetes
• BRM responded to two USPHS RFP’s in June of 2005. • Our requested budgets totaled > $11.3 MM
• BRM was notified in December 2005 that it was
technically competent and within the Competitive Range for Both RFP’s – Only company competing for both contracts

T-1D RAID Programs • Rapid Access to Interventional Development for Type 1
diabetes
• Preclinical Studies of Efficacy in Animal Models of Type 1 Diabetes (Pathogenesis) N01-DK-6-2909 – BRM Awarded $4.9Million Contract 2006-2012 – Selected over a Top 25 Research Institute

T1D RAID Process Potential therapeutics
submitted by US scientists
5 selected yearly by T1D RAID board
Successful compounds screened and identified by BRM
Entry into TrialNet
New successful drug identified

Trials to Prevent or Treat Type 1 Diabetes: Clinical Considerations
Tight glycemic control is correlated with C-peptide preservation in type 1 diabetes clinical trials.
Interventions are more likely to succeed if done early, while some beta cell function is preserved.

NOD Model Problem 1: Treatment of diabetes in new onset NOD mice
Diabetic NODs are treated with poorly-characterized insulin pellets or by insulin injection resulting in variable or inadequate glycemic control. Poor control may contribute to rapid beta cell
demise or loss of functionality, and therefore a poorer response to immune interventions designed to reverse disease may be observed.

NOD Model Problem 1: Solutions
Contract is developing better ways to control glycemia in NOD diabetic mice Contract is developing ways to predict
imminent diabetes in order to intervene prior to beta cell loss.

Interventions to Maximize Success
• Tight glycemic control of diabetic animals for periods of 3-6 weeks – Provides immune modulatory therapies maximum
opportunity for success
• Contract is developing ways to predict imminent diabetes to intervene prior to complete beta cell loss

Model Standardization • Use optimized rodent models for standardized
preclinical testing of agents to prevent or reverse diabetes – Testing in multiple models (mice and rats) – Development of standardized testing protocols – Development of insulin treatment protocols for
reversal studies

Example Testing Schemes
Treat 21-110 days
Treat 21-160 days
Follow 50 days
Preventative Protocol
Read-outs
Preventative/Reversal Protocol
Treat when turns diabetic
Treat 2 nondiabetic littermates Read-outs
Pulse Protocol
Read-outs

Year BRM Jackson
2006 68% 65%
2007 (at 27 weeks) 86% 95%
2008 (at 23 weeks) 75% 75%
Incidence of Diabetes Among NOD Mice

Therapeutic Evaluations in the NOD Mouse Study Designs
Reversal Initiate treatment after frank diabetes onset. Insulin therapy to maintain euglycemia.
Late Prevention Initiate treatment to animals with impaired GTT prior to frank diabetes. Insulin therapy not used.
Early Prevention Initiate treatment prior to disease onset. Insulin therapy not used.

Control and Prediction • Contract is developing better ways to control
glycemia in NOD diabetic mice (and BB rat)
• Contract is developing ways to predict imminent diabetes to intervene prior to complete beta cell loss

Using the GTT test to predict diabetes onset (Protocol 2)
• Impaired glucose tolerance (IGT) expected to be early manifestation of impending diabetes – Perform GTT (ip injected glucose) on fasted
nondiabetic female mice at 12, 14, or 16 weeks of age, then follow for 30 days for diabetes onset
– Analyze AUC of animals that became diabetic or remained non-diabetic
– Determine the best parameters for prediction

*** P<0.001 * P<0.05
*** *
NOD Mice with Impaired Glucose Tolerance Develop Diabetes

NOD Mice with Impaired Glucose Tolerance Develop Diabetes
GTT performed on animals at 14 weeks of age. IGTT= Impaired Glucose Tolerance, NGTT= Normal Glucose Tolerance. 9/19 animals with IGTT turned diabetic within 30 days after test. 4/31 animals with NGTT turned diabetic within 30 days after test.

GTT Conclusions
• GTT has high predictive value for diabetes when performed at 14 weeks of age
Sensitivity Specificity Pos. Pred. Value 14 Weeks 0.69 0.73 0.47

Study Design Late Intervention
Perform GTT at 14 weeks
Select mice with impaired IGTT
Randomize into groups: Rx, vehicle or no rRX

Development of Protocols to Optimize Treatment of
Spontaneous Type 1 Diabetes in NOD Mice

Metabolic Control in NOD Mice • Factors to consider
– Total daily dose (2- 4 Units) 25 g mouse – Type of Insulin – Frequency of dosing QD, BID, TID – % of daily dose administered each injection – Injection time relative to “fed state”
• Many pilots done to test insulin formulation (Humulin 50/50, Humulin 70/30, PZI), dose, use of diluted insulin and BID dosing
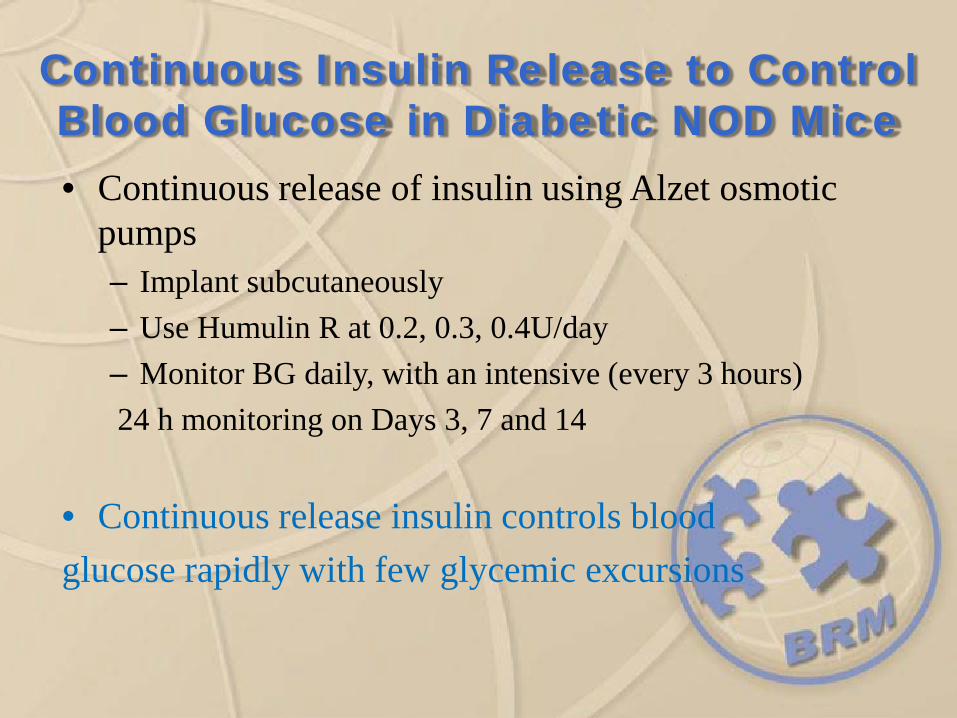
Continuous Insulin Release to Control Blood Glucose in Diabetic NOD Mice • Continuous release of insulin using Alzet osmotic
pumps – Implant subcutaneously – Use Humulin R at 0.2, 0.3, 0.4U/day – Monitor BG daily, with an intensive (every 3 hours) 24 h monitoring on Days 3, 7 and 14
• Continuous release insulin controls blood glucose rapidly with few glycemic excursions

Daily Blood Glucose Averages
0
100
200
300
400
500
600
0 5 10 15 20
Bloo
d G
luco
se (m
g/dL
)
Day Post Pump Insertion
0.2U0.3U0.4U
Mice implanted subcutaneously with pumps releasing 0.2-0.4U Humulin R/day. Daily blood glucose measured approx. 8-9 hours after lights on. N=6 for 0.2 and 0.3U groups; N=12-15 for 0.4U group.

Intensive BG Monitoring – 0.4U
Mice implanted subcutaneously with pumps releasing 0.4U Humulin R/day. BG measured every 3 hours for 24 hours on Days 3, 7 and 14 post pump insertion. N=15 for Days 3 and 7; N=12 for Day 14.
0
100
200
300
400
500
600
0 2 4 6 8 10 12 14 16 18 20 22 24
Blo
od G
luco
se (m
g/dL
)
Hour in Study
3 Day 7 Day 14 Day

Intensive BG Monitoring – 0.3U
0
100
200
300
400
500
600
0 2 4 6 8 10 12 14 16 18 20 22 24
Bloo
d G
luco
se (m
g/dL
)
Hour in Study
3 Day7 Day14 Day
Mice implanted subcutaneously with pumps releasing 0.3U Humulin R/day. BG measured every 3 hours for 24 hours on Days 3, 7 and 14 post pump insertion. N=15 for Days 3 and 7; N=12 for Day 14

Daily Blood Glucose Mean +/- SEM
0
100
200
300
400
500
600
-1 1 2 3 4 5 6 7 8 9 10 11 12 13 14
Blo
od G
luco
se (m
g/dL
)
Days Post Pump Insertion
.2U .25U .3U Diluent
Mice implanted subcutaneously with 1002 Alset pumps releasing 0.2-0.3U Humulin R/day. Daily blood glucose measured approx. 5-7 hours after lights on. N=12 for 0.2U and 0.25U groups; N=14 for 0.3U group; N=7 for Diluent group.

Day 3 Intensive BG (Mean +/- SEM)
0.0
100.0
200.0
300.0
400.0
500.0
600.0
3 3.5 4
Bloo
d G
luco
se (m
g/dl
)
Days Post Pump Insertion
.2U .25U .3U Diluent
Mice implanted subcutaneously with 1002 Alset pumps releasing 0.2-0.3U Humulin R/day. Daily blood glucose measured 3 days post insertion over 24 hours. N=12 for 0.2U and 0.25U groups; N=14 for 0.3U group; N=7 for Diluent group.

Day 7 Intensive BG (Mean +/- SEM)
0.0
100.0
200.0
300.0
400.0
500.0
600.0
7 7.5 8
Bloo
d Gl
ucos
e (m
g/dl
)
Days Post Pump Insertion
.2U .25U .3U Diluent
Mice implanted subcutaneously with 1002 Alset pumps releasing 0.2-0.3U Humulin R/day. Daily blood glucose measured 7 days post insertion over 24 hours. N=12 for 0.2U and 0.25U groups; N=14 for 0.3U group; N=7 for Diluent group.

Day 14 Intensive BG (Mean +/- SEM)
0.0
100.0
200.0
300.0
400.0
500.0
600.0
14 14.5 15
Bloo
d Gl
ucos
e (m
g/dl
)
Days Post Pump Insertion
.2U .25U .3U Diluent
Mice implanted subcutaneously with 1002 Alset pumps releasing 0.2-0.3U Humulin R/day. Daily blood glucose measured 14 days post insertion over 24 hours. N=12 for 0.2U and 0.25U groups; N=14 for 0.3U group; N=7 for Diluent group.

Digitized images of islets following 3 weeks of insulin Rx by Alzet pumps
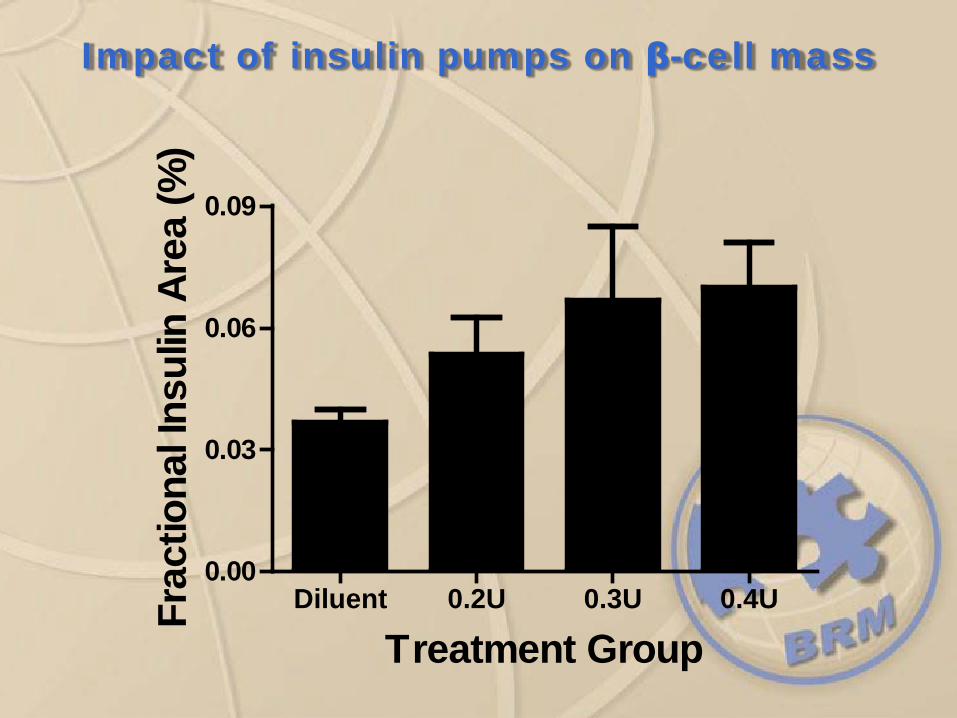
Impact of insulin pumps on β-cell mass
Diluent 0.2U 0.3U 0.4U0.00
0.03
0.06
0.09
Treatment Group
Frac
tiona
l Ins
ulin
Are
a (%
)