two-way satellite time and frequency …tycho.usno.navy.mil/ptti/2008papers/paper50.pdf · two-way...
TRANSCRIPT

40th Annual Precise Time and Time Interval (PTTI) Meeting
TWO-WAY SATELLITE TIME AND FREQUENCY TRANSFER (TWSTFT) CALIBRATION CONSTANCY FROM CLOSURE SUMS
Demetrios Matsakis, Lee Breakiron Time Service Department U.S. Naval Observatory
Washington, DC 20392, USA
Andreas Bauch, Dirk Piester Physikalisch-Technische Bundesanstalt, Braunschweig, Germany
Zhiheng Jiang
Bureau International des Poids et Mesures, Paris, France
Abstract
Two-way Satellite Time and Frequency Transfer (TWSTFT) is considered to be the most accurate means of long-distance time transfer, on the basis of its reported 1 ns repeat calibration consistency. This paper uses the closure sum technique to show that variations of the link-based component of the transfer data, in the absence of configuration changes, are largely subnanosecond in the European links. Two explanations for small, but non-zero, biases observed in the closure sums of uncalibrated data are presented.
I. INTRODUCTION TWSTFT [1] has developed into a widely used technique in laboratories that contribute to the generation and realization of UTC [2] and to accurate frequency comparisons between atomic fountain clocks [3]. Although carrier-phase GPS has significantly better subdaily stability [4], and TWSTFT electronic components are often located in exterior or poorly controlled temperature and humidity environments, TWSTFT is currently rated the most accurate means of time transfer. This is based upon the observed 1-ns repeatability of TWSTFT calibrations [5,6]. At present, TWSTFT is performed operationally in at least 12 laboratories in Europe, seven in the Asia Pacific Rim region, and laboratories in the United States. Our study is restricted to the European laboratories’ data for reasons that are explained below. To employ the full potential of TWSTFT for time transfer (in contrast to frequency transfer, where absolute delays do not matter), a calibration of the overall signal delays is necessary. This consists of the calibration of either the operational link at large, including every component involved, or of the ground
587

40th Annual Precise Time and Time Interval (PTTI) Meeting
stations’ internal delays. Both modes were successfully employed by circulating and operating a portable reference TWSTFT station between the sites involved [6]. The operational practice of many of these calibration exercises assumes that the closure sum δTC is zero. Any violation would have to be accounted for in the uncertainty of the calibration. If all of (say) three links have been independently calibrated, and the calibration values were included in the calculation of equation (8) below, then the study of the triplets would provide a test for the calibration accuracy. Thirteen years ago, Davis et al. [7] studied triplet closures, which can be defined as the signed sum of the timing differences between stations A, B, and C: (A-B) + (B-C) + (C-A), where the notation (A-B) denotes the measured time transfer difference between the two laboratories. It was recognized that any violation would constitute an important hint for the measurement procedures. The results were obtained from at most three data points per week for each triplet. Most stations used so-called MITREX modems for signal generation and reception, and mean bias values as large as 4 ns were observed. Nowadays, most non-Asian stations use the next-generation SATRE modem [8]. TWSTFT is now performed according to a time schedule fixed under the auspices of the CCTF Working Group on TWSTFT in such a way that regular comparisons are made during the even hours each day (0:00 to 0:59, 2:00 to 2:59, etc.). The odd hours of each day are reserved for special projects. Thus, in the best cases 12 data points per day are collected. Operation of the TWSTFT equipment is fully automatic in all stations involved in the current study, and data are made available on ftp sites. Rules for data taking, processing, and reporting have been laid down in [9]. During the period of observations, all stations remain transmitting so as to keep the background power level constant. In the following sections, we give a theoretical background, present the results, and discuss possible explanations for the uncertainties. Our observed calibration variations are consistent with the BIPM’s assignment of an overall type B uncertainty of 1 ns to TWSTFT. The acronyms used in this manuscript are given in the Appendix. II. THEORETICAL BACKGROUND TWSTFT between two remote stations 1 and 2 operating clocks CL (1) and CL (2), respectively, is based on two combined coincident measurements at both stations. Each measurement represents the determination of the time of arrival of a radio signal that is phase-coherent with the remote atomic clock and transmitted from the remote station with respect to its local clock. The measurement result obtained at one site, e.g. TW (1), is the time difference reading from the time-interval counter (TIC). It is the observed difference between the two clocks, [CL (1) − CL (2)], in combination with all the delays along the signal path; see equation (1) below. For the ground station we distinguish only between the transmission (TX) and receiving (RX) part, but the reader may find a more detailed description of the ground stations’ components in [1,9]. The delay of a signal between its transmission from station 2 and its reception at station 1 consists of the remote site transmitter delay TX (2), the overall signal path delay to the satellite and back to site 1 on Earth SP (2) (sum of the uplink delay SPU (2), the transponder delay SPT (2), and the downlink delay SPD (1)), the local receiver delay RX (1), and the delay due to the Sagnac effect [10], which is computed from the positions of the ground stations and the geostationary satellite. Following [10], we introduce Sagnac corrections for both the uplink and downlink to and from the satellite, SCU (2) = -SCD (2) and SCD (1) = -SCU (1), respectively. At site 2, the equivalent measurement is carried out simultaneously, and we obtain two measurement results, TW (1) and TW (2):
TW(1)=[CL(1)-CL(2)]+TX(2)+SP(2)+RX(1)+[SCD(1)-SCD(2)] (1) TW(2)=[CL(1)-CL(2)]+TX(1)+SP(1) +RX(2)+[SCD(2)-SCD(1)]. (2)
588

40th Annual Precise Time and Time Interval (PTTI) Meeting
In the context of this study, we assume a complete reciprocity of the signal path, SP (1) = SP (2). Non-reciprocities are mostly due to the different signal frequencies and hardware paths in uplink and downlink; see [1,9,11] for a discussion. The configuration of the measurement equipment at each ground station is depicted in Figure 1. The TIC involved may be a constituent part of the modem or a separate device. The clock (CL) 10-MHz input drives the signal generation of the modem. The one pulse per second (1 PPS) TX output is generated from the CL input and represents the epoch of the transmitted signal. Initially, the modem is synchronized with a 1 PPS input from the local timescale UTC (k). If the physical source of UTC (k) is identical to CL (k), then the difference between the 1 PPS TX and UTC (k) is a constant, determined by cable and modem delays. Such is the situation at USNO, NIST, and only two European labs (SP and VSL). In other cases, CL is a cesium clock or an active hydrogen maser and UTC (k) is derived from another system. Then the difference is measured periodically (with the same or a different TIC), and in all cases the value is reported as reference delay RDY (k), as in Figure 2.
Figure 1. Measurement configuration at a TWSTFT ground station.
589

40th Annual Precise Time and Time Interval (PTTI) Meeting
Figure 2. Relation of TWSTFT-measured values to UTC (k). The solid arrows represent the actual TWSTFT measurements between the local clocks CL (k), the dotted arrows represent the local RDY-measurements, and the dash-dotted lines represent the link results combined in triplets.
The comparison between two UTC (k) scales is thus written as
[UTC (1) – UTC (2)] = ½ [TW (1) – TW (2)] + [RDY (1) – RDY (2)] + ½ [{TX (1) – RX (1)} –
{TX (2) – RX (2)}] + [SCD (2) – SCD (1)]. (3) Closure sums are derived by combining three TWSTFT measurements linking three stations A, B, and C. One might expect that (A-B) + (B-C) + (C-A) using the above equations would give a zero triplet closure result, δTC = 0. There are a few potential causes why triplet closures could deviate from zero, and these will now be discussed. Non-zero closure sums would result if the delay of the RX path in station 1 receiving the signal from station 2 may be different from the delay when receiving station 3:
RX (1,2) ≠ RX (1,3). (4) Equation (3) is then transformed to:
[UTC (1) – UTC (2)] = ½ [TW (1,2) – TW (2,1)] + [RDY (1) – RDY (2)] + ½ [{TX (1) – RX (1,2)} – {TX (2) – RX (2,1)}] + [SCD (2) – SCD (1)]. (5) If three measurements between three stations are performed simultaneously and the results are added, one gets ½ [TW (1,2) – TW (2,1)] + [RDY (1) – RDY (2)]
+ ½ [TW (2,3) – TW (3,2)] + [RDY (2) – RDY (3)]
590
40th Annual Precise Time and Time Interval (PTTI) Meeting
+ ½ [TW (3,1) – TW (1,3)] + [RDY (3) – RDY (1)] = - ½ [{TX (1) – RX (1,2)} – {TX (2) – RX (2,1)}] - [SCD (2) – SCD (1)] + [UTC (1) – UTC (2)] - ½ [{TX (2) – RX (2,3)} – {TX (3) – RX (3,2)}] - [SCD (3) – SCD (2)] + [UTC (2) – UTC (3)] - ½ [{TX (3) – RX (3,1)} – {TX (1) – RX (1,3)}] - [SCD (1) – SCD (3)] + [UTC (3) – UTC (1)]. (6) We notice that the RDY (k), the Sagnac corrections, and the time scale differences vanish, as well as the TX path delays TX (k), and (6) simplifies to δTC:= ½ [TW (1,2) – TW (2,1)] + ½ [TW (2,3) – TW (3,2)] + ½ [TW (3,1) – TW (1,3)]
= ½ [RX (1,2) – RX (2,1)] + ½ [RX (2,3) – RX (3,2)] + ½ [RX (3,1) – RX (1,3)] = ½ [RX (1,2) – RX (1,3)] + ½ [RX (2,3) – RX (2,1)] + ½ [RX (3,1) – RX (3,2)]. (7)
Non-zero closure sums can come about due to the slightly incorrect assumption that the three measurements are performed simultaneously in the European links. In practice, they are made within an interval of 10 to 30 minutes. For measurements at epochs ti, (7) expands to:
δTC := ½ [TW (1,2) – TW (2,1)]t1 + [RDY (1) – RDY (2)]t1 + ½ [TW (2,3) – TW (3,2)]t2 + [RDY (2) – RDY (3)]t2 + ½ [TW (3,1) – TW (1,3)]t3 + [RDY (3) – RDY (1)]t3. (8)
Clock noise, as well as measurement and instrumentation noise, will contribute to non-zero closures in a stochastic sense, and in general raise the (Type A) noise level by 3 . In addition, any average frequency differences among the UTC (k) may cause a bias in their triplet closure sums, and even small biases would be easily seen when many tens of days are averaged or even plotted. We do not think this to be a serious contributor to non-zero closures, since we have based the study on the local UTC (k)-scales, which have small rate differences. Even for an extremely high rate of 10 ns/day (which would not be maintained for long), this translates to 200 ps/half-hour. The RDY-values must also be determined close to the epoch when the actual TWSTFT measurement is done, and the fully automated TWSTFT stations actually allow this. Transatlantic TWSTFT observations employ different transducers in each direction. Although this introduces a phase bias, this bias would be cancelled in the triple sum. However, transatlantic triplets would not be expected to have zero round-trip closure sums, because slightly different transmission and reception frequencies are used for comparisons within Europe and across the Atlantic. In some stations, even different hardware components are used. Currently, there is no TWSTFT connection inside the US between USNO and NIST, and we therefore restrict our analysis to links within Europe. III. DATA REDUCTION TWSTFT data were gathered from the Web sites of the participating laboratories, and reduced by standard procedures. While most of the data processing is internal to the USNO, automated closure results are made publicly available in several forms in the USNO Web pages (ftp://tycho.usno.navy.mil/twstt), and updated nightly. Triplet results are calculated without interpolation to a common measurement epoch. A triplet is calculated only if all three involved measurements have been actually reported during a given hour. The RDY is included in the reduction, so that the laboratory
591

40th Annual Precise Time and Time Interval (PTTI) Meeting
time references are their UTC (k). The USNO Web page products contain no outlier filtering, but for the purposes of this study, outliers were crudely filtered at the link-level by first excluding all 2-minute runs for which less than 100 seconds of data were gathered and then by excluding all hourly values that differed more than 10 ns from the previous value and at least one value appearing within 24 hours afterwards. Closure sums were calculated based upon the filtered data from individual links. Some representative closure triplets are shown in Figures 3-6. In some cases, outliers or gaps can be traced to malfunctioning equipment at a given site. Laboratories whose geographic location leads to extremely low-elevation look-angles, such as SP, can at times lose significant amounts of individual 1-second points and this can result in both outliers and gaps. Many of the abrupt jumps can be attributed to known configuration changes, such as the change of satellite and frequencies in February 2008 (MJD 54500), and VSL’s conversion from a MITREX modem which had previously been modified to a SATRE modem at MJD 54669. However, the observed slow variations are not related to any known hardware issues. Although not shown on the scale of the figures, it is significant that diurnal observations are not observed in the European closure sums, although diurnal cycles in individual pairs of stations can persist for weeks.
Figure 3. Closure sum for laboratories IT, PTB, and SP. A steady increase is observed, which halted after the satellite change on 54500. Some short-term variations are evident as well.
592

40th Annual Precise Time and Time Interval (PTTI) Meeting
Figure 4. Closure sum for PTB, ROA, and VSL. The satellite change at 54500 is evident; the noise reduction at 54670 coincides with VSL's replacement of its MITREX modem by a SATRE modem.
593

40th Annual Precise Time and Time Interval (PTTI) Meeting
Figure 5. Closure sum for laboratories CH, PTB, and SP.
594

40th Annual Precise Time and Time Interval (PTTI) Meeting
Figure 6. Closure sum for laboratories IT, OCA, and ROA. OCA was using a MITREX modem for these observations, and this probably explains why closure sums involving OCA can be 2 ns.
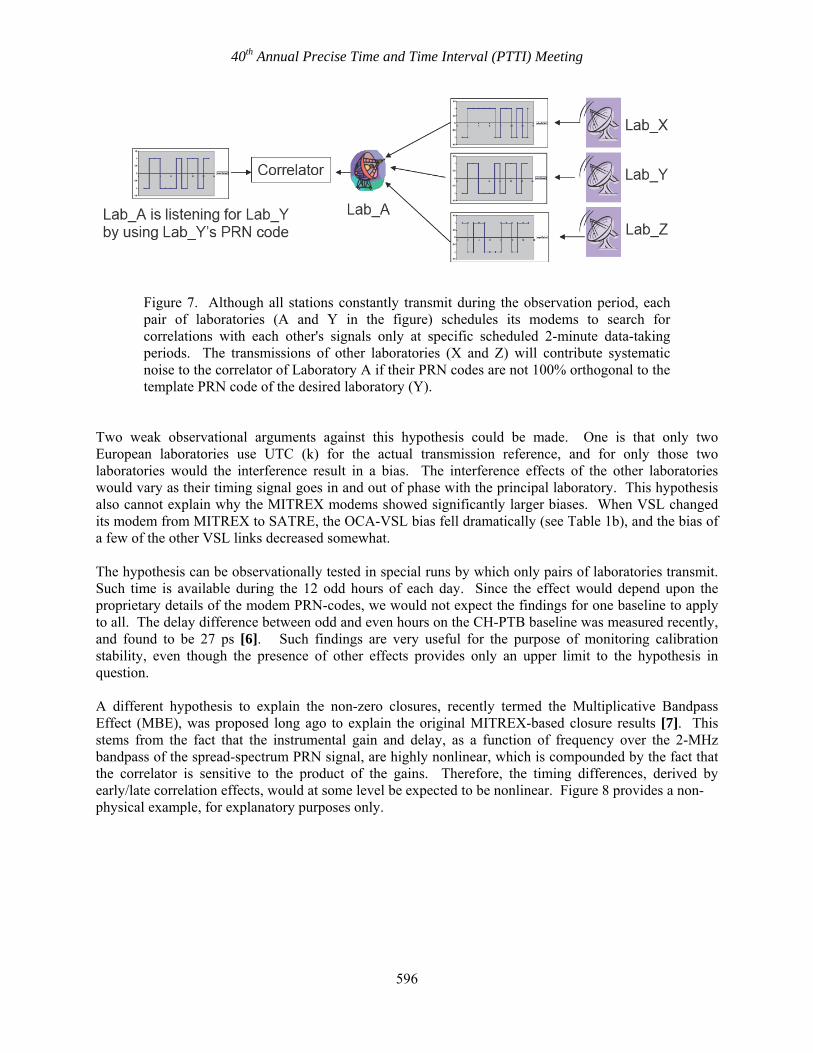
IV. DATA ANALYSIS Although the large number of data outliers is a problem in TWSTFT data reduction, we will focus on the biases because their variations are related to the ability of a link to maintain its calibration. We present two explanations for the non-zero biases. One is that the observed variations are related to interference (or confusion) from the simultaneous transmissions of other laboratories. As shown in Figure 7, a given laboratory (Lab_A) attempts to correlate its received signals with only the template transmissions of Lab_Y. Following standard “early/late” correlator technology, the correlator will infer the time of reception by equalizing the amplitude of the correlated signal when the template is advanced with when it is retarded by the same amount [12]. However, small correlations between the template PRN code and the PRN codes of other laboratories will distort the correlation, since the time offset of the competing laboratories’ transmitted signals will not be the same as that of the desired laboratory.
595
40th Annual Precise Time and Time Interval (PTTI) Meeting
Figure 7. Although all stations constantly transmit during the observation period, each pair of laboratories (A and Y in the figure) schedules its modems to search for correlations with each other's signals only at specific scheduled 2-minute data-taking periods. The transmissions of other laboratories (X and Z) will contribute systematic noise to the correlator of Laboratory A if their PRN codes are not 100% orthogonal to the template PRN code of the desired laboratory (Y).
Two weak observational arguments against this hypothesis could be made. One is that only two European laboratories use UTC (k) for the actual transmission reference, and for only those two laboratories would the interference result in a bias. The interference effects of the other laboratories would vary as their timing signal goes in and out of phase with the principal laboratory. This hypothesis also cannot explain why the MITREX modems showed significantly larger biases. When VSL changed its modem from MITREX to SATRE, the OCA-VSL bias fell dramatically (see Table 1b), and the bias of a few of the other VSL links decreased somewhat. The hypothesis can be observationally tested in special runs by which only pairs of laboratories transmit. Such time is available during the 12 odd hours of each day. Since the effect would depend upon the proprietary details of the modem PRN-codes, we would not expect the findings for one baseline to apply to all. The delay difference between odd and even hours on the CH-PTB baseline was measured recently, and found to be 27 ps [6]. Such findings are very useful for the purpose of monitoring calibration stability, even though the presence of other effects provides only an upper limit to the hypothesis in question. A different hypothesis to explain the non-zero closures, recently termed the Multiplicative Bandpass Effect (MBE), was proposed long ago to explain the original MITREX-based closure results [7]. This stems from the fact that the instrumental gain and delay, as a function of frequency over the 2-MHz bandpass of the spread-spectrum PRN signal, are highly nonlinear, which is compounded by the fact that the correlator is sensitive to the product of the gains. Therefore, the timing differences, derived by early/late correlation effects, would at some level be expected to be nonlinear. Figure 8 provides a non- physical example, for explanatory purposes only.
596

40th Annual Precise Time and Time Interval (PTTI) Meeting
Figure 8. Extremely simplified description of the multiplicative bandpass effect. The hypothetical gain and delay of the electronics of three laboratories are plotted over their bandpass, in arbitrary units. In each link, high or low frequencies may be preferentially weighted, and the corresponding effect is noted in the table. The signed sum (A-B) - (A-C) + (B-C) is non-zero. In reality, the gain and delay variations are much more rapid, and the early/late correlator analysis complicates the final result.
The MBE explanation is not easily tested, since strong delay and gain variations are caused by filtering within the modem itself. The lack of diurnal signatures to the TWSTFT closure sums indicates that the external equipment is not involved. The larger variations of the MITREX modems could be explained by their different design. The slow long-term variations can be explained by long-term changes of the modem components, while the abrupt changes due to configuration adjustments could also be expected. Hegarty et al. [12] and Matsakis [13] found similar effects to cause nanosecond-level biases between GPS satellite signals, as measured by GPS receivers. There is no reason for TWSTFT to be expected to be different. We conclude that the MBE is sufficient to explain the observed closure sums. V. A LEAST-SQUARES EFFORT TO ESTIMATE THE CLOSURE-VIOLATING CONTRIBUTIONS OF INDIVIDUAL LINKS The series of TWSTFT observations benefits from a plethora of redundancies, as depicted in Figure 9. Given the large number of triplets, it is reasonable to ask what information about the individual links can be extracted from the closure sums. Since the closure sums are merely the signed sums of the non-site-based asymmetries in the links, the values of the triplets are not necessarily independent from each other.
597

40th Annual Precise Time and Time Interval (PTTI) Meeting
Figure 9. The abundance of redundant TWSTFT links is illustrated here. For N participating laboratories, in the absence of closure biases and noise, only N-1 links contain all the information needed to reproduce the other links.
Figure 10 shows that only three independent triplets exist in a four-station topology, in that the closure sum of the fourth triplet can be inferred exactly from that of the other three.
Figure 10. The signed sum of triplets composed of laboratories ABC, ADB, and ACD exactly equals the value of the triplet BCD.
Although N stations making regular TWSTFT observations with each other result in N*(N-1)/2 links and in N*(N-1)*(N-2)/6 triplets, only 1+ N*(N-3)/2 of those triplets are independent. For N>4, it is easy to convince oneself that the number of independent triplets is correctly described by assuming the formula works for N laboratories and computing the additional number of independent triplets created when N is incremented by 1.
598

40th Annual Precise Time and Time Interval (PTTI) Meeting
From the above formulas, we see that one can never use the triplets to unambiguously determine individual link offsets, no matter how many laboratories are participating. The solution would always be underdetermined by N-1. This is consistent with the fact that the offset is link-based, not site-based. Any set of trial values that matched the data could be used to derive more trial values that fit the data identically well by changing values for the N-1 links to any one site, and adjusting the other links – a process identical to how the BIPM is computing the calibration of the redundant links [14]. Accordingly, we have conducted several least-squares fits to the European laboratories by neglecting all links to one site. The data are mildly over-determined only because some redundant links are not functional. Although the exact derived values for individual links depend upon which links are not solved for, the solutions have the same general characteristics over time as the closure-sums themselves. They are generally subnanosecond and at most slowly varying, except for jumps at equipment changes. The exception is OCA, which uses a MITREX modem. Table 1 summarizes the results for solutions before and after the February 2008 satellite change, using the PTB links as fixed references. Table 2 shows the VSL-links before and after their modem change. The differences between the pre-modem change and post-satellite change solutions are a measure of the systematic variations over time, which are often larger than the 20 ps formal errors of the fit. VI. CONCLUSION TWSTFT closure sums reveal generally subnanosecond biases, showing that the link-based variations to calibration constancy are small. The most likely explanation is the Multiplicative Bandpass Effect. On the other hand, Figures 3-5 show a considerable number of outliers which are very likely not caused by that effect, but rather by observational flaws. TWSTFT operations are based on individually designed stations, comprising complex equipment from different vendors and acquired at quite different times. Software and operational procedures have to be adapted continuously to the available installations, and this has proven not to be a trivial task. Before using triplet closure results in the process of estimating link uncertainties or link performance, one must carefully analyze the data set and suppress outliers. In general, however, triplet data are very sensible indicators, since they are practically free of clock noise. For their effective use as “analytical tools,” it appears safe to suppress triplets for which data on one of the links are combined that have been collected during substantially less than 120 s per data point; the availability of at least 100 data points was used in this study. VII. ACKNOWLEDGMENT The authors appreciate the cooperation with and the consent of all institutes to have their results shown in this report. VIII. DISCLAIMER Some commercial products are identified in the text for the purpose of scientific clarity. The BIPM, USNO, and PTB do not endorse any commercial products, nor do they permit any use of this document for marketing or advertisement.
599

40th Annual Precise Time and Time Interval (PTTI) Meeting
Table 1a. Fits for individual link contributions to closure sums, referenced to PTB-links, for data averages before and after the satellite change. Links involving OCA are given in Table 1b. Formal errors are 20 ps.
Lab1 Lab2 54124-54479(365 days)
54502-54750(250 days)
Difference between fits
aos ch -0.29 -0.21 0.08 aos op 0.00 -0.03 -0.03 aos roa -0.52 -0.11 0.41 aos sp -0.07 -0.14 -0.07 aos vsl -0.46 -0.11 0.35 ch it 1.39 0.59 -0.80 ch npl 0.96 0.09 -0.87 ch roa 0.85 -0.02 -0.87 ch sp 0.03 -0.12 -0.15 ch vsl 0.01 0.65 0.64 it op -0.53 -0.07 0.46 it roa -0.24 0.39 0.63 it sp -0.83 -0.01 0.82 it vsl -0.47 -0.24 0.23 npl op -0.29 0.09 0.38 npl roa -0.04 0.16 0.20 npl sp -0.69 0.22 0.91 npl vsl -0.44 -0.12 0.32 op roa 0.29 0.01 -0.28 op sp -0.16 0.03 0.19 op vsl -0.04 0.25 0.29 roa sp -0.61 -0.02 0.59 roa vsl -0.65 0.09 0.74 sp vsl 0.10 0.52 0.42
Table 1b. Links involving OCA, for same data as in Table 1a.
Lab1 Lab2 54124-54480(365 days)
54502-54750 (250 days)
Difference between fits
oca aos -0.79 -0.29 0.50 oca ch 1.98 1.90 -0.08 oca it -2.48 -2.29 0.19 oca op 0.87 0.90 0.03 oca roa -0.98 -0.73 0.25 oca sp 1.99 1.94 -0.05 oca vsl 1.11 1.61 0.50
600

40th Annual Precise Time and Time Interval (PTTI) Meeting
Table 2. VSL-links from solutions before and after the VSL modem upgrade.
Lab 1 Lab 2 54510-54660 (150 days)
54679-54798 (119 days)
Difference Between Fits (ns)
aos vsl -0.11 -0.13 0.02 ch vsl 0.28 0.34 -0.06 it vsl -0.18 -0.18 -0.00 npl vsl 0.12 0.23 -0.11 oca vsl 1.93 -0.16 2.09 op vsl 0.35 -0.01 0.36 roa vsl 0.28 -0.17 0.45 sp vsl 0.48 0.12 0.36
REFERENCES [1] D. Kirchner, 1991, “Two-Way Time Transfer via Communication Satellites,” Proceedings of the
IEEE, 79, 983-989. [2] E. F. Arias, 2005, “The metrology of time,” Philosophical Transactions of the Royal Society A,
363, (1834), 2289-2305. [3] A. Bauch et al., 2006, “Comparison between frequency standards in Europe and the US at the 10-15
uncertainty level,” Metrologia, 43, 109-120. [4] D. N. Matsakis, K. Senior, and P. Cook, 2002, “Comparison of Continuously Filtered GPS Carrier
Phase Time Transfer with Independent GPS Carrier-Phase Solutions and with Two-Way Satellite Time Transfer,” in Proceedings of the 33rd Annual Precise Time and Time Interval (PTTI) Systems and Applications Meeting, 27-29 November 2001, Long Beach, California, USA (U.S. Naval Observatory, Washington, D.C.), pp. 63-87.
[5] L. A. Breakiron, A. L. Smith, B. C. Fonville, E. Powers, and D. N. Matsakis, 2005, “The Accuracy of
Two-Way Satellite Time Transfer Calibrations,” in Proceedings of the 36th Annual Precise Time and Time Interval (PTTI) Systems and Applications Meeting, 7-9 December 2004, Washington, D.C. (U.S. Naval Observatory, Washington, D.C.), pp. 139-148.
[6] D. Piester et al., 2008, “Time transfer with nanosecond accuracy for the realization of International
Atomic Time,” Metrologia, 45, 185-198. [7] J. A. Davis et al., 1995, “European Two-Way Satellite Time Transfer Experiments Using the
INTELSAT (VA-F13) Satellite at 307°E,” IEEE Transactions on Instrumentation and Measurement, IM-44, 90-93.
[8] SATRE is the brand name of the modem produced by Time Tech GmbH, Stuttgart, Germany. [9] ITU Radiocommunication Sector, 2003, “The operational use of two-way satellite time and frequency
transfer employing PN codes,” Recommendation ITU-R TF.1153-2 (ITU, Geneva, Switzerland).
601

40th Annual Precise Time and Time Interval (PTTI) Meeting
[10] E. J. Post, 1967, “Sagnac Effect,” Reviews of Modern Physics, 39, 475-493. [11] D. Piester et al., 2008, “Studies on instabilities in long-baseline Two-Way Satellite Time and
Frequency Transfer (TWSTFT) including a troposphere delay model,” in Proceedings of the 39th Precise Time and Time Interval (PTTI) Systems and Applications Meeting, 27-29 November 2007, Long Beach, California, USA (U.S. Naval Observatory, Washington, D.C.), pp. 211-222.
[12] C. Hegarty, E. Powers E, and B. Fonville, 2005, “Accounting for the Timing Bias Between GPS,
Modernized GPS, and Galileo Signals,” in Proceedings of the 36th Annual Precise Time and Time Interval (PTTI) Systems and Applications Meeting, 7-9 December 2004, Washington, D.C. (U.S. Naval Observatory, Washington, D.C.), pp. 307-317.
[13] D. N. Matsakis, 2007, “The Timing Group Delay Correction (TGD) and GPS Timing Biases,” in
Proceedings of the 63rd Annual ION Meeting, 23-25 April, 2007, Cambridge, Massachusetts, USA (Institute of Navigation, Alexandria, Virginia).
[14] Z. Jiang and A. Niessner, 2009, “Calibrating GPS with TWSTFT for Accurate Time Transfer,” in
Proceedings of the 40th Annual Precise Time and Time Interval (PTTI) Systems and Applications Meeting, 1-4 December 2008, Reston, Virginia, USA (U.S. Naval Observatory, Washington, D.C.), pp. 577-586.
[15] W. Lewandowski, D. Matsakis, G. Panfilo, and P. Tavella, 2006, “The evaluation of uncertainties in
[UTC - UTC (k)],” Metrologia, 43, 278-286.
602

40th Annual Precise Time and Time Interval (PTTI) Meeting
IX. APPENDIX − TABLE OF ACRONYMS
Acronym Designation AOS Astrogeodynamical Observatory, Space Research Centre,
Borowiec, Poland
BIPM Bureau International des Poids et Mesures, Sèvres, France
CH Designation of the Swiss metrology institute METAS
IPQ Instituto Português da Qualidade, Laboratório Central de Metrologia,
Caparica, Portugal
METAS Federal Office of Metrology (METAS), Bern-Wabern, Switzerland
MITREX Microwave Timing and Ranging Experiment modem
NIST National Institute of Standards and Technology, Boulder, Colorado, USA
OCA Observatoire de la Côte d’Azur, Grasse, France
OP Observatoire de Paris
PTB Physikalisch-Technische Bundesanstalt
RDY Reference delay, time difference between the local timescale and the
modem 1 pps output synchronous with its TX signal
ROA Real Instituto y Observatorio de la Armada (ROA), San Fernando, Spain
RX(i) Signal delay in the receive path of TWSTFT station i
SATRE Satellite Time and Ranging Equipment modem
SCD(i) Sagnac delay for a signal propagating from the GEO satellite to station i
SCU(i) Sagnac delay for a signal propagating from station i to the GEO satellite
SP Swedish National Testing and Research Institute (SP), Borås, Sweden
SP(i) Complete signal path delay from station i to station k through the GEO,
SPU (k) + SPT (k) + SPD (i)
TIC Time-interval counter
TUG Technische Universität Graz, Austria
TW(i) Counter reading in the TWSTFT station i
TX(i) Signal delay in the transmit path of the TWSTFT station i
603

40th Annual Precise Time and Time Interval (PTTI) Meeting
604
TWSTFT Two-Way Satellite Time and Frequency Transfer
USNO United States Naval Observatory, Washington
VSL Nederlands Meetinstituut Van Swinden Laboratorium, Delft, The
Netherlands