two types of affirmative action programs
TRANSCRIPT

Two Types of Affirmative Action Programs Lex Borghans (Research centre for Education and the Labour Market (ROA), University of Maastricht) & L.F.M. (Loek) Groot ([email protected], Utrecht School of Economics, Utrecht University) JEL codes: C43, I28, J7, J15, J16 1 INTRODUCTION
Under a variety of names - affirmative action, positive discrimination, reverse discrimination, preferential
treatment, desegregation – it has been debated as a policy instrument to realize a more equal distribution of
job opportunities between men and women and between black and white. Notably in the U.S., affirmative
action programs (henceforth AAPs) are widespread. E.g. there are binding hiring quota’s imposed on
firms with federal contracts, on pain of debarment from future federal contracts, or federal mandated
AAPs in faculty composition in higher education.1 They usually require that preferential treatment will be
given to adequately or equally skilled minorities or women and take the form of ‘in year t at least x% of
the workers in job y at firm or institution z have to be female, or black’. In this paper, we want to point out
that such a policy is not always the most effective way to help move women and minorities into types of
jobs in which they are underrepresented and in this way to reduce occupational segregation (OS for short).
In line with this argument, we propose an alternative form of AAP, which, if feasible, is much more
effective in achieving a decline in OS in the short term.
AAPs are highly controversial policies, witness the great number of AAPs brought to state and federal
courts and the Supreme Court in the US. Rather than join the debate concerning whether AAPs are
controversial or not, we wish to provide the tools with which to monitor more accurately the segregation
practice of the labour market, henceforth providing a better insight in which ways OS can most effectively
be tackled. The reasoning behind this is that in order to formulate, execute and effectuate successful AAPs
it is not sufficient to determine in which occupations segregation occurs, or in what kind of jobs
segregation occurs, and how strong the segregation is. One also has to find out what ‘causes’ the
segregation. We do this by linking OS to educational segregation (henceforth ES).
The structure of this paper is as follows. Without trying to be exhaustive, the next section presents
the most important segregation theories, which serve as a background in the evaluation of the
effectiveness of different policies to combat segregation. Sections 3 and 4 present the basics of an
integrated educational and occupational segregation analysis. In section 3, we will give definitions of ES,
presorting, OS, postsorting, and reintegration and, in section 4, show how they are knitted together.
Section 5 contains some highly stylized examples illustrating the (in)effectiveness of different AAPs. A
1 For affirmative action for women faculty in higher education, see e.g. Hyer (1985) and Hanna (1988).

1
rough indication of the empirical relevance of AAPs is given in section 6. Section 7 discusses the most
appropriate policy instruments to be used, dependent on what causes OS, or what type of OS is involved,
to remedy the often vast inequalities in occupational representation of well-defined groups. Section 8
summarizes and concludes.
2 SEGREGATION THEORIES
Different theories have been put forward to explain the OS of men and women (or blacks and whites).2
The main difference between these theories is whether segregation is attributed to discrimination or to
differences in preferences or choices. Alternative theories seem to have different implications for the
relationship between ES and OS, and possibly for the policy instruments to be used to combat ES and OS.
In discrimination theories first introduced by Becker (1971), both employers and employees prefer not to
co-operate or to be supervised by members of the discriminated group, whereas the discriminated group
does not have a lower productivity level and is not insufficiently qualified. If this kind of discrimination is
ubiquitous, the existent OS will tend to persist despite any changes in ES. With strong tastes for
discrimination, it is difficult for women (blacks) to find employment in typical male (white) occupations,
even if they possess the relevant skills.
In the theory of statistical discrimination developed by Phelps (1972), employers' evaluations of
candidates or job applicants in situations of incomplete information are partly based on easy to assess
individual characteristics and partly based on group characteristics. Group characteristics are better known
and generally easier to determine than the possible individual deviations from the overall group
characteristics. Since educational status is an item which can be easily assessed by employers, changes in
the educational distribution of men and women may in the long term change the OS of men and women,
but do not necessarily have to do so. On average women interrupt their labour market career more often
and for longer spells than men, although this does not apply to each individual woman. As a consequence,
in occupations where interruption is costly (e.g. because of high training costs or intense on-the-job
training, leading to high turnover and replacement costs), employers prefer men to women, despite the fact
that female candidates, not planning to interrupt their career, and with the required education for the job,
are available (for a critique, see Olson (1990)). In sum, statistical discrimination may explain why even
with an equal educational distribution of men and women still OS, through postsorting, may arise.
Both theories of discrimination refer directly to OS, but there may be an indirect link to ES. Girls
2 See a critical review of the potential of different theories to explain total segregation, distinguished into vertical segregation (essentially inequality of pay) and horizontal segregation (essential occupation segregation), see Blackburn et al. (2002).

2
might anticipate these job exclusions and therefore adjust their educational choices to their future labour
market opportunities. By such mechanisms the existent OS is, at least partly, reproduced as ES, which in
turn will have a presorting effect on the future occupational distribution.
The socialization theory is directly focused on differences in the choice of schooling between girls and
boys, and indirectly on OS (e.g., to the extent that ES ‘causes’ future OS through presorting). From
infancy onwards, institutions such as the family, school, church and media have an influence on how boys
and girls behave and on the goals they set themselves. For instance, through socialization women are
directed more towards the model of mother and homemaker and men towards the model of father and
provider (see Corcoran and Courant (1987)). Fuchs (1989, 29) expressed this as follows: "Socialization
can affect occupational segregation through the choice of subjects in school, the pattern of extracurricular
activities, and the goals one sets with respect to family, career, friendships, and so on. If, from infancy on,
boys and girls are exposed to different circumstances, influences, training, and role models, it is likely that
they will reach the labour markets with different aspirations, aptitudes, interests, and commitments".
Because the socializing influence on behaviour and aspirations is already effective during the schooling
years, boys and girls follow different educational careers (as measured by ES), and these educational
choices will later on in adult life act as constraints on occupational choices (that is, through presorting).3
For this reason women’s occupational choices may differ from those of men. Thus while the
discrimination theories concentrate more on OS and postsorting, the socialization model is more relevant
for ES and presorting.
Paramount in the theory of human capital is the acquisition of skills and knowledge by investing in formal
schooling and through learning activities such as on-the-job training. The acquired skills will be applied
when pursuing one's chosen profession. Different educations result in the acquisition of different skills.
The strength of the connection between educational and occupational choice will reveal itself if part of the
final OS can be attributed to the ES taking place during the precedent educational route (presorting).
True to the tradition of human capital theory, Polachek (1981) investigated the relationship between
the educational choice, labour participation and occupational choice of women. His main thesis, given that
it is more harmful to interrupt the working career for some occupations than for others, is that women
anticipating long future spells of interruption will take this into account in both their educational and
occupational choice. For instance, women who anticipate that they will interrupt their labour market career
(e.g. due to the greater responsibilities and burdens taken at home at a later stage of life) will choose an
education which prepares them for occupations in which interruptions are not very harmful, or they will
3 Moreover, the effect of socialization might interact with that of specialization according to the new home economics (see Becker (1985)), leading to entirely different careers of women compared to men, e.g. that women will predominantly choose part-time jobs.

3
choose low levels of education which make the opportunity costs of not doing paid work after leaving
school low. Besides this indirect effect, differences in the human capital investments by men and women
may be caused by differences in preferences (e.g. due to socialization or otherwise, mothers might have a
stronger preference to take care of the children then fathers (see Fuchs (1989, 39) for this kind of argument
to explain why women’s wage rate is lower that that of men) and for this reason choose shorter
educational careers.
Additionally, it is important to note that in human capital theory a distinction is made between three
kinds of human capital: general, job or occupation specific, and firm specific human capital. The first two
can in principle be acquired outside the firm, for instance by formal schooling. Some jobs are open to
applicants with different educational backgrounds. In this case job specific human capital may not be
important or it may be acquired by on-the-job training. For instance, many jobs do not require a specific
type of educational preparation, but only that job applicants have achieved at least a particular level of
education. They learn the required job skills and firm specific capital on-the-job. In these and other cases,
the phenomenon of reintegration (i.e. men and women with different educational backgrounds coming
together in the same job or occupation) may occur. In other cases, where the link between education and
occupation is tight (e.g. in the medical professions in which job holders must have all the necessary bits of
paper), it is almost certain that ES will pass on fully to OS (in other words, that educational presorting
takes place). A traditional AAP will be of little use here. Instead, a publicity campaign to promote the
enrolment of girls (boys) in (fe)male types of education might probably be more appropriate and effective,
although the beneficial effects will only become manifest in the long term.
This short description of the main theories of segregation serves as a background to interpret the different
components (presorting, postsorting, reintegration) of segregation which we distinguished above, and
which will be derived analytically later on. It was also argued that different situations call for different
policy instruments: The usual AAP can be effective to counter discrimination practices and other types of
postsorting; publicity campaigns and information films might weaken the socializing impact of role
models among pupils, their parents and their teachers, and it might also lead to more well-informed
educational choices, as is implicit in the human capital theory. We also identified that the more frequent
and longer career interruptions by women may give rise to statistical discrimination and, among women of
foresight, less ambitious schooling careers. If this would be an important factor underlying the OS, an
issue which we do not address further, there is much to be said to implement and improve ‘child-centred
policies’, e.g. the provision of day care centres and generous child benefits.
It is crucial to note that the causes of segregation might be in both the occupational and educational
domain: the existence of ES might lead to OS as with presorting, but OS might also lead to ES due to
indirect effects and forward-looking expectations. For this reason, we bracket the term ‘cause’ when we
say that ES ‘causes’ occupational segregation. Equally, due to the same interaction effects socialization is
4
not exclusively linked to presorting, discrimination to postsorting, and human capital theory to
reintegration. All of them might give more or less coherent explanations of ES and OS and their
interactions.
3 FROM EDUCATIONAL TO OCCUPATIONAL SEGREGATION
Our first claim is that in designing policies to counter a sex- or race-related distribution of workers over
occupations, it is crucial to take into account what ‘causes’ segregation. Segregation analyses so far have
concentrated on OS, without giving due attention to the extent that OS is induced by ES. We define ES as
the extent to which boys and girls choose (or men and women have chosen) different educational careers.
In studying the link between ES and OS, the most obvious phenomenon to be observed is that ES may
give rise to OS: if boys choose more technical careers while girls prefer non-technical educational careers,
then these differing educational choices act as constraints on the future occupational choice, with the likely
result of men becoming overrepresented in technical jobs and women in non-technical jobs. This
phenomenon we call presorting: the extent to which different educational distributions of boys and girls
(that is, ES proper) give rise to or cause different occupational choices and job opportunities of men and
women. Thus, whereas ES is about the divergence of the educational distribution of men and women (or
whites and blacks), irrespective of its effects on the OS later on, presorting can be seen as ‘ES-induced
OS’. One may expect that presorting will be stronger, the stronger the link between educational types and
occupations. To illustrate, most people amongst the older generation (including both men and women)
only received primary education. This has a loose connection to occupational choice. Young people
though tend to specialize themselves in vocational types of education which are closely tied to particular
occupations (e.g. medical training which prepares for medical professions). The level of presorting among
graduates leaving school nowadays may therefore be much greater than that of, say, 40 years ago.
However, the trajectory of the transition from the educational to the occupation domain is more
complicated. To see this consider the following example: suppose, not unrealistically, that boys with an
intermediate vocational education in commerce and administration become bookkeeper, while girls with
exactly the same education become secretary. This will increase OS between the sexes, supplementary to
that expected because of presorting. This second phenomenon we call postsorting: the extent to which,
given the ES, men and women with the same educational background end up in different occupations.
Even when the ES is perfectly equal, so presorting is non-existent, there might still be considerable OS
because of postsorting.
A third phenomenon, called reintegration, occurs when girls with a 'female' education enter male-
dominated occupations or vice versa, when boys who followed a typical 'male' type of education enter
5
female dominated jobs. This phenomenon is perhaps illustrated best by the fact that in the last decade
women without a technical educational background have successfully entered traditionally male jobs as
bus and taxi drivers, train guards, etc. The salience of reintegration is that it is an effective and unorthodox
way to realize a less sex-related occupational distribution.
Reintegration-based AAPs are of an entirely different nature than the more well-known traditional
AAPs. The crucial difference is that a traditional AAP stipulates that employers have to hire more persons
of the underrepresented group from a pool of workers with the requisite skills. If there are no such workers
(qualified and of the minority-type) the AAP is bound to be ineffective (for an example, see Figure 1 in
section 5). A reintegration-based AAP can be applied even when there are no workers, belonging to the
underrepresented group, available who are sufficiently or adequately skilled. Of course, such an
unorthodox AAP will be greatly facilitated when it is accompanied with special training programs to
enable members of the underrepresented group to qualify for the jobs involved. We do not suggest,
however, that the traditional AAPs are of no use. On the contrary, the best instances to use the traditional
AAPs are to combat postsorting, that is when women and men with the same educational background end
up in different, sex-related, occupations. Thus, only when, for some reason or another (e.g.
discrimination), women with the requisite educational background do not have easy access to jobs which
men with the same educational skills freely enter, then a traditional AAP is the most appropriate
instrument at hand, that is to combat (discrimination-based) postsorting. But, and this is our second claim,
if women are duly represented, given their educational background, then applying a traditional AAP in
some sectors of the economy (e.g. to firms with federal contracts, or institutions of higher education) is
counterproductive. At best, the hiring rates of appropriately skilled women will go up in sectors subject to
AAPs, but it will almost inevitably go down in other sectors not being exposed to these AAPs. The net
result is that OS will not decline, and it might even increase.
In this light, unorthodox reintegration-based AAP are in a sense supplementary, and most
appropriate when a) there are some occupations which are predominantly typically male or female and b)
the link between these occupations and educations is loose. If condition b applies, then it might be feasible
to recruit and train women (men) with a female (male) educational background for typical male (female)
jobs, and in this way to reduce the strong OS in these jobs, as formulated under a.
The most difficult cases to reduce OS are ‘presorting-induced OS’ among highly specialized
occupations which require a particular kind of extensive educational training, e.g. medical professions,
notary’s, lawyers, architects, but one can also think of lower level occupations like construction workers,
plumbers, etc. To launch reintegration-based AAPs is then not realistic, but neither are traditional AAPs:
the goals set by traditional AAPs are very difficult to achieve as long as the underrepresented group does
not have the requisite educational credentials. It might turn out that the groups which are seemingly
underrepresented are nevertheless duly represented, given their educational background. E.g., although
women are underrepresented among economists, this may be entirely induced by the low share of women
6
in economic educations: those women who do have an economic educational background may have as
easy as their male colleagues access to jobs which require economic skills, so there might be no point for a
traditional AAP applied to faculties of higher education to combat discrimination. Also, it is not realistic to
train women with a non-economic educational background for these jobs, so reintegration-based AAPs are
not relevant here. As a result, presorting-induced OS among highly specialized occupations can be
considered as the hard core (that is, the most difficult to combat) of OS. Instead, to combat this type of OS
requires publicity campaigns to promote the enrolment of girls (boys) in (fe)male types of education that
prepares for hitherto sex-related occupations, but unlike an AAP, the beneficial effects will only become
manifest in the long term.
Summarizing, the best instances to make use of the instrument of a traditional AAP is to combat
postsorting, that is when women and men with the same educational background end up in different, sex-
related, occupations. The best instances to deploy reintegration-based AAPs occur when it is feasible to
train workers without the appropriate educational background in a relatively short time period for jobs in
which they are underrepresented. One can then think of AAPs which aim at increasing the number of
women in male dominated jobs, as well as AAPs increasing the number of men in female dominated jobs.
In practice, we see only the former, and mostly only according to the format of a traditional AAP.
However, it is worthwhile to consider to what extent reintegration-based AAPs can be promoted to realize
a less sex-related occupational distribution, alongside the more traditional type of AAPs.
In the next two sections we set out the trajectory of ES to OS, illustrated by simple examples, and
report how ES, OS, presorting, and postsorting can be measured. This provides the analytical framework
to critically assess the traditional AAPs and to explore the potential of reintegration-based AAPs to reduce
the sexual division of labour. Section 6 provides the empirical findings.
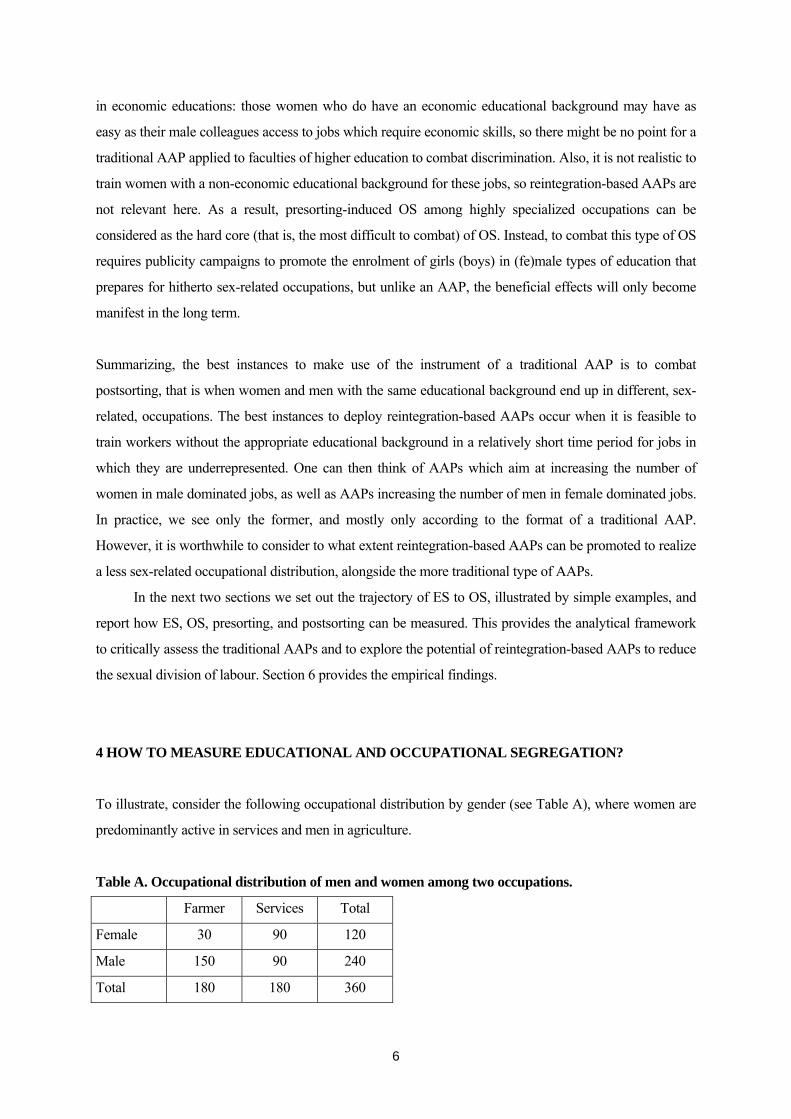
4 HOW TO MEASURE EDUCATIONAL AND OCCUPATIONAL SEGREGATION?
To illustrate, consider the following occupational distribution by gender (see Table A), where women are
predominantly active in services and men in agriculture.
Table A. Occupational distribution of men and women among two occupations.
Farmer Services Total
Female 30 90 120
Male 150 90 240
Total 180 180 360
7
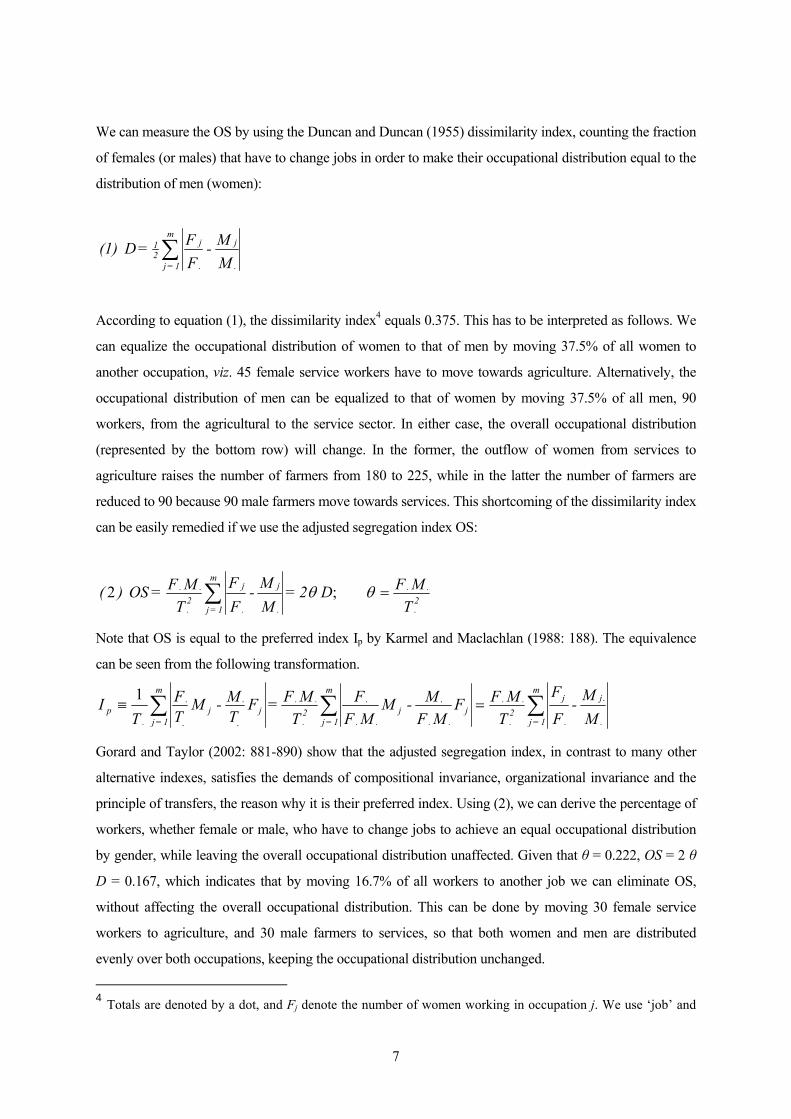
We can measure the OS by using the Duncan and Duncan (1955) dissimilarity index, counting the fraction
of females (or males) that have to change jobs in order to make their occupational distribution equal to the
distribution of men (women):
According to equation (1), the dissimilarity index4 equals 0.375. This has to be interpreted as follows. We
can equalize the occupational distribution of women to that of men by moving 37.5% of all women to
another occupation, viz. 45 female service workers have to move towards agriculture. Alternatively, the
occupational distribution of men can be equalized to that of women by moving 37.5% of all men, 90
workers, from the agricultural to the service sector. In either case, the overall occupational distribution
(represented by the bottom row) will change. In the former, the outflow of women from services to
agriculture raises the number of farmers from 180 to 225, while in the latter the number of farmers are
reduced to 90 because 90 male farmers move towards services. This shortcoming of the dissimilarity index
can be easily remedied if we use the adjusted segregation index OS:
Note that OS is equal to the preferred index Ip by Karmel and Maclachlan (1988: 188). The equivalence
can be seen from the following transformation.
MM -
F
F
TMF F
MFM - M
MFF
TMF = F
TM - M
TF
TI
.
j
.
jm
1 =j 2.
..j
..j
..
m
1 =j 2.
..jj
m
1 =j .p
...
.
.
.
.1 ∑∑∑ =≡
Gorard and Taylor (2002: 881-890) show that the adjusted segregation index, in contrast to many other
alternative indexes, satisfies the demands of compositional invariance, organizational invariance and the
principle of transfers, the reason why it is their preferred index. Using (2), we can derive the percentage of
workers, whether female or male, who have to change jobs to achieve an equal occupational distribution
by gender, while leaving the overall occupational distribution unaffected. Given that θ = 0.222, OS = 2 θ
D = 0.167, which indicates that by moving 16.7% of all workers to another job we can eliminate OS,
without affecting the overall occupational distribution. This can be done by moving 30 female service
workers to agriculture, and 30 male farmers to services, so that both women and men are distributed
evenly over both occupations, keeping the occupational distribution unchanged.
4 Totals are denoted by a dot, and Fj denote the number of women working in occupation j. We use ‘job’ and
MM -
FF = D (1)
.
j
.
jm
1 =j 21 ∑
TMFD2 =
MM -
FF
TMF= OS )(
2.
..
.
j
.
jm
1 =j 2.
.. =∑ θθ ;2

8
However, the adjusted index also suffers from two, different, short-comings. Firstly, the adjusted
segregation index will increase if, all other things equal, the labour participation of women becomes more
in line with that of men.5 This may seriously hamper the comparison of OS across countries with differing
female labour participation rates, or the comparison of OS in time when the female participation rate
changes rapidly. Secondly, although the index can be interpreted as ‘the percentage of job changes
needed’, it fails to consider whether the workers involved in these job changes possess the educational
skills that their new jobs require. We do not claim to solve the first shortcoming, although we feel it is
useful to acknowledge that it exists, especially if this index is used to measure segregation across countries
or over longer time spells. However, for our purposes, since we want to relate OS to ES, and to pre- and
postsorting, the second shortcoming is more serious. In the framework below, we shall devise an index
which expresses by how much the OS can be reduced, taking the existent level of ES as given.
By analogy with (2), the index for ES can be expressed as:
To illustrate ES, consider Table B, which retains the occupational distribution by gender as given in Table
A, but adds the educational dimension to the exercize. Ignore, for the moment, the italicized numbers.
Table B. Educational distribution of men and women, specified by occupation (italicized numbers
represent the equal distribution).
Farmer Services Total
Female; agricultural 6 42 18 30 24 72
Female; administrative 24 18 72 30 96 48
Male; agricultural 120 84 72 60 192 144
Male; administrative 30 36 18 60 48 96
Total 180 180 360
Women tend to specialize in, say, administrative skills while men specialize in, say, agricultural skills.
‘occupation’ interchangeably. 5 If the overall employment ratio between both sexes is unity, so θ =1/4, then the adjusted segregation index OS is at maximum half the Duncan and Duncan index, while the maximum of the latter is 1. If only 10% of the total work force is female the outcome for OS can never exceed 2θD=0.18D. OS will be equal to 2θ only when OS is complete, that is, if all (fe)males are working in (fe)male jobs, so D=1. To equalise the occupational distribution, 9 out of 10 female workers have to be directed towards male jobs and 1 out of 10 male workers must take up a female job, illustrating that the greatest proportion of job changes occurs in the smallest group. Since the female participation rate is assumed to be 10%, 18% of the work force (which equals 2θ) have to
MM -
FF = ES )(
..
i.
..
i.n
1 = i∑θ3

9
Using (3), ES = 0.267, which amounts to 96 persons (26.7% of 360) who have to change their educational
status to achieve an equal representation of men and women among both educations. ES would be lifted if
48 female students in administration would have chosen agriculture instead, and 48 male agricultural
students would have chosen administrative education. This is shown by the italicized numbers in the final
column of Table B.
We can go one step further, and specify the equal educational and occupational distribution by gender, in
which neither gender-related educational or occupational differences exist, nor differences in the
allocation of men and women of the same educational type over the occupational structure. This
distribution, which we term as the 'equal' distribution, is described by:
and
In the equal distribution neither pre- or postsorting occurs, nor is there any ES or OS. The notion of the
equal distribution F equalij and M equal
ij is important as an Archimedean point in the measurement of
segregation. Given the total number of workers T ij , the share of female workers in this combination (i,j)
only depends on the overall female participation rate.
By using (4) and (5), we can derive in a straightforward manner the (italicized) numbers of the
second and third column of Table B. Note that the equal distribution does not affect the overall
occupational distribution (which remains 180:180), nor the overall educational distribution (which
remains 216:144). Note also that the tightness of the link between education and occupation is preserved.
In the original distribution, 216 persons (78 women and 138 men) do have an educational background
which prepared them for their occupation, while 144 persons (42 women and 102 men) perform a job
without having the appropriate educational background. In the equal distribution, the number of marriages
between education and occupation is also 216 (72 women and 144 men), and the number of ‘mismatches’
equals 144 (48 women and 96 men). This is not by chance, because for all (i,j):
ijequalij
equalij ij
equalij TTTMFMFT =+=+= ...... /)( ,
change jobs.
TTF = F )( ij
..
..equalij4
F - T = TTM = M )( equal
ijijij..
..equalij5
10
so preserving the link between education and occupation, and therefore also TT equaljj .. = , preserving the
same occupational distribution, and TT equalii .. = , preserving the same educational distribution.
We define total segregation (TS) as the extent to which F ij and M ij differ from their counterparts
F equalij and M equal
ij . Because:
MM -
FF
TMF =
TMF - FM =
TMF - F)F - T(
== T
TF - FT = T
F
TF
..
ij
..
ij2..
....2..
ij..ij..2..
ij..ij....2..
ij..ij..
..
equalij
..
ij −
we can write TS as:
MM -
FF =
TF -
TF TS )(
..
ij
..
ijm
1 =j
n
1 = i..
equalij
..
ijm
1 =j
n
1 = i∑∑∑∑= θ6
In the example, TS equals 0.267, which, as with ES, amounts to 96 persons who have to change
educational or occupational status, or both. Despite all the nice properties of the equal distribution vis-à-vis
the existent distribution, there is one major drawback: although the overall educational distribution does
not change, the educational composition among the female and male workforce has to change rather
dramatically. In the example, twice as much men have to enrol in administrative education, and thrice as
much women have to enrol in agricultural education. For AAPs directed at changing the hiring practices
of employers, the equal distribution is of little use as a point of reference. Only in the very long term,
when AAPs are also directed to the educational domain, aiming at equal enrolment of men and women in
different types and levels of education, is the equal distribution a useful yardstick to check how far reality
is still away from the kind of impeccable equality described by the equal distribution. Even if from now on
AAPs in the educational trajectory were a complete success, and assuming that the new entrants on the
labour market are distributed gender-blind over the occupations, it would take about two generations to
achieve the equal distribution, taking into account that the existent workforce exhibits a considerable
degree of ES and OS by gender. So it seems that for the time being inertia continues to weigh upon us
like a mortgage that cannot be paid off.
However, this gloomy view on the possibilities to attain a more equal occupational distribution of men and
women in the more near future has to be qualified. As we shall show shortly, even if there is a
considerable ES among the pupils now at school and among the workforce, which can be taken as fixed in
the short term, there may be ample room to reduce OS by using the two different kinds of AAPs discussed
in the previous section: firstly, traditional AAPs directed at eliminating postsorting, the phenomenon that

11
men and women with the same educational skills are allocated differently over occupations; secondly,
reintegration-based AAPs to mitigate the extent of presorting by weakening the male-dominance of
particular occupations by recruiting women from female types of education,6 or the other way around for
female-dominated jobs. Before we go into this, we have to devise a way how presorting (OS pre) and
postsorting (PS) can be measured.
The baseline for postsorting is the situation in which no postsorting occurs, that is when students
from one type of education are distributed over all occupations in proportion to their educational sex
ratios. This counterfactual distribution can be described by:
and
In the distribution F = F educijij , only presorting occurs and no postsorting takes place, so all OS there is, is
‘ES-induced OS’. The chance of a randomly selected woman ending up in (i,j), given the number of
workers in (i,j), only depends on the fraction of women within education i. Taking this as the baseline, PS
can now be measured by the distance between the actual distribution and the counterfactual distribution
which we would expect with only presorting due to ES:
T
F - TF = PS )(
..
educij
..
ijm
1 =j
n
1 = i∑∑9
In other words, if the link between education and occupation is watertight, that is, all workers, whether
male or female, from one type of education go to the same type of job, or less stringent, when men and
women with the same type of education are distributed equally over occupations, then PS is zero. If for
some reason or the other (e.g. statistical discrimination or taste discrimination by employers), some female
workers go to different kinds of jobs than male workers with the same education, then postsorting occurs.
In the example, PS is equal to 40/360, slightly more than 10%, but it comprises two-third of the total
amount of OS, which, as we saw equals 16.7%, or 60/360. So, while keeping the gender-specific
educational distribution unchanged, we can cutback the OS to about one-third of the initial OS by
6 As noted before, reintegration can take place among occupations for which a specific educational training is not strictly necessary. Suppose that hitherto all bus drivers are men and technically trained, so that there seems to be a tight connection between the job of bus driver, gender and educational type, which was earlier described as presorting. However, this tight connection is not strictly necessarily. If women from female types of education can be easilty trained to become bus driver, this will mean that presorting will go down, because some women who followed a female type of education now end up in a male dominated job, and otherwise
TTF = F )( ij
i.
i.educij7
1
F - T = TTM = M )( educ
ijijiji.
i.educij8
2

12
eliminating presorting from the scene. This is illustrated in Table C.
Table C. Educational distribution of men and women, specified by occupation (bold-faced numbers
represent the distribution induced by only presorting and no postsorting).
Farmer Service Total
Female; agricultural 6 14 18 10 24
Female; administrative 24 36 72 60 96
Male; agricultural 120 112 72 80 192
Male; administrative 30 18 18 30 48
Total 180 180 360
Making use of the counterfactual educ-distribution we can, besides postsorting, also measure the ‘ES-
induced OS’ or presorting, representing the amount of OS that would result when only presorting and no
postsorting would occur. By applying formula (2) for OS to the counterfactual distribution educ as
described by Eqs. (7) and (8), the extent of OS we may expect under the situation with presorting but
without postsorting can be expressed as:
M
M - F
F OS )(..
educj
..
educj
m
1 =j
pre ..10 ∑=θ .
Using the bold numbers of Table C, OS pre is equal to 0.055, corresponding to 20 persons out of the grand
total of 360.
So, making shift with what one comes across in terms of the gender-specific educational distribution, it is
possible to reduce OS significantly just by moving some men (and women) from occupations in which
they are overrepresented to occupations in which they are underrepresented. OS drops from 16.7% to
5.5% under the counterfactual distribution with only presorting and no postsorting. Basically, to do this
requires two parallel moves. First, an AAP which stimulates employers in the agricultural business to
recruit (eight) more women with the right kind of educational background previously employed in the
service sector (the first row) and to recruit less men (twelve) with the ‘wrong’, administrative, educational
background (the fourth row). Such a traditional AAP is appropriate here since women and men with the
same educational background turn out to be distributed in unequal proportions over the occupations: e.g.,
in the original distribution 75% (18 out of 24) of the women with an agricultural educational background
turn out to be employed in the service sector, whereas for men it is only 37.5% (3 out of 8).
The second and third row illustrate the effect of reintegration-based AAPs. In the second row,
twelve more women with a predominantly female educational background join the ranks of the male-
probably would end up in female dominated jobs.
13
dominated occupation of farmer, while in the third row eight more men with a predominantly male
educational background join the ranks of the female-dominated occupation of service worker. This move
brings the OS further down with an additional 20/360.
Summarizing, although at first sight the counterfactual equal distribution might appear as the most
important point of reference for evaluating the existent distribution of men and women over both
educations and occupations, we think there are good reasons to give the counterfactual presorting-induced
distribution a more important place in the design of policies to cure unequal access to jobs of women and
men on the labour market. One additional reason to concentrate on the latter distribution is that AAPs in
the educational domain are of limited use as long as discrimination leading to postsorting is still a
widespread phenomenon. In the next section we present some fictitious, but not unrealistic, examples to
illustrate how effective and ineffective AAPs work and what happens when reintegration takes place.
These examples show what can be achieved and what should be avoided when using AAPs to remedy
gender job segregation.
5 THE (IN)EFFECTIVENESS OF AFFIRMATIVE ACTION PROGRAMS
Given this bird’s eye view on segregation, and the potential of different forms of AAPs to reduce
prevalent OS in the short term, we will first turn the attention to the danger of ineffective, even
counterproductive, forms of AAPs, and next discuss the circumstances that need to be taken into account
when designing effective AAPs.
Assume, not unrealistically, that one third of the labour force is female so that for all (i,j),
F 2 = M equalij
equalij . Now suppose that the councils of all economic departments within universities adopt a
rather ambitious AAP stating that half of the staff must be female economists. Given an overall female
participation rate of 1/3, the equal distribution would require that only 1/3 of all staff have to be female.
Further, assume that only 1 out of 10 of all employed economists are female, so that we would expect a
share of female economists in economics departments of also 1/10. Figure 1 depicts this state of affairs.
Figure 1 here
Initially female economists are distributed over both occupations according to their educational share (so
PS is zero). The AAP, if successful, has the effect that the number of female economists at universities
(call this job j) not only becomes higher than what could be expected (indicated by F educij ), but also higher
than what would be the case if their representation at universities is equal to the overall female
participation ratio (as indicated by F equalij ). If the programs succeeds, so female trained economists will
14
become overrepresented in universities ( F > F > F educij
equalijij
' ), then they will by necessity become
underrepresented elsewhere (e.g. in higher commercial professions (job k) which also recruit female
economists). Note that, whatever the goal of the AAP adopted, F equalij and F educ
ij are fixed (the overall and
the 'economic' female participation rates of the labour force will not change in the short term due to the
AAP). What happens is that the further 'Fij moves to the right, the further 'F ik moves to the left, with the
result that F F F educik
equalikik <<' . Thus, the AAP proves to be too ambitious and increases PS, OS and TS:
the lower contribution of (i,j) to OS and TS is more than offset by the higher contribution of (i,k).
As noted earlier, traditional AAPs are only effective when there is in some occupation postsorting of the
kind of women being underrepresented with regard to the educational distribution F educij . This was not
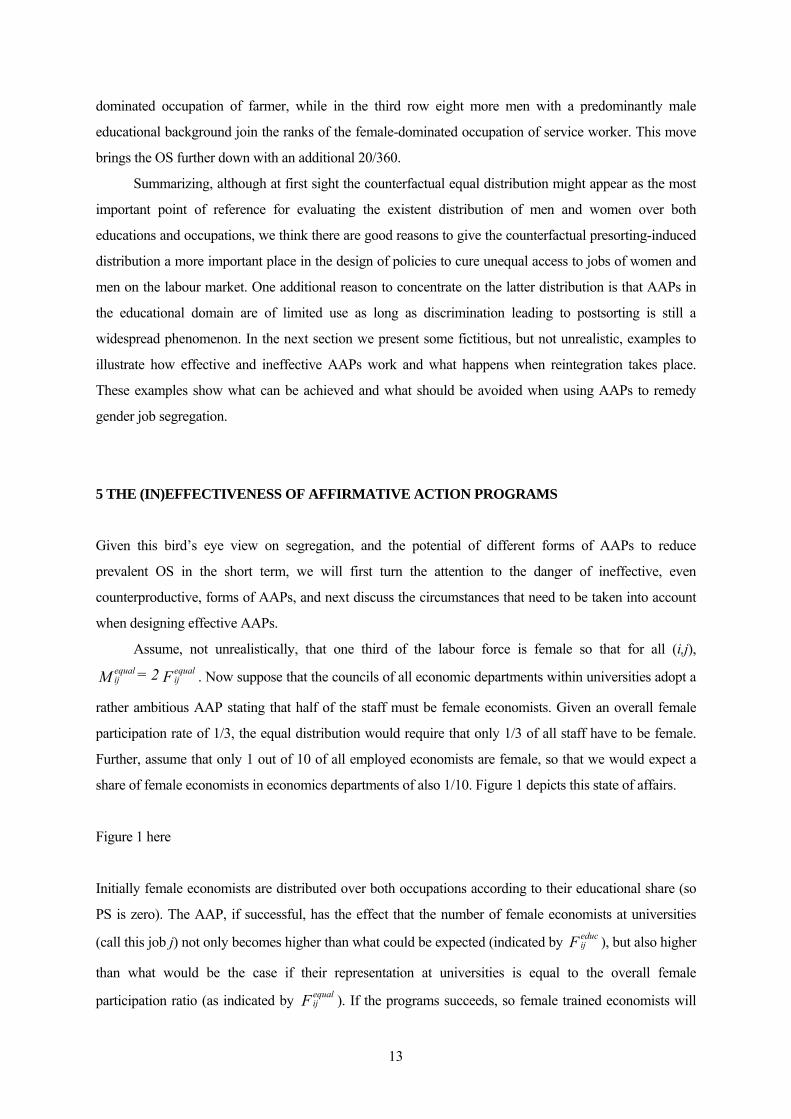
the case in the example given in Figure 1. Figure 2 (left panel) presents a case where although 25% of the
students enrolled in lower technical education is female, only 10% of all workers in lower technical
occupations are women.
Figure 2 here
The mirror image of this underrepresentation is that women with this educational background are
overrepresented in, say, lower service occupations (they work in shops selling electrical equipment), as
shown in the right hand panel of Figure 2. A realistic and effective traditional AAP would stipulate that
women’s representation in lower technical occupations must reflect more their educational representation
in this field. It is not unrealistic to assume that some of the technically trained women working as service
workers are able to switch towards the technical jobs. If this AAP would achieve its aim, for convenience
assume that 'Fij is now equal to 167 and 'F ik equal to 333, it would lower OS (and AS and TS) by 134.
Any technically trained female worker switching from services to technical jobs reduces not only OS in
the occupational domain from where she comes, but also in the domain to where she goes. In the limit,
where 'Fij becomes equal to F educij , and 'F ik becomes equal to F educ
ik , PS would become zero and there
would be no postsorting contribution to OS anymore. The OS that remains is due to the unequal
representation of men and women among the technically educated workforce, that is, ES-induced OS or
presorting.
Thus, a traditional AAP can only be effective when enough workers of the underrepresented group
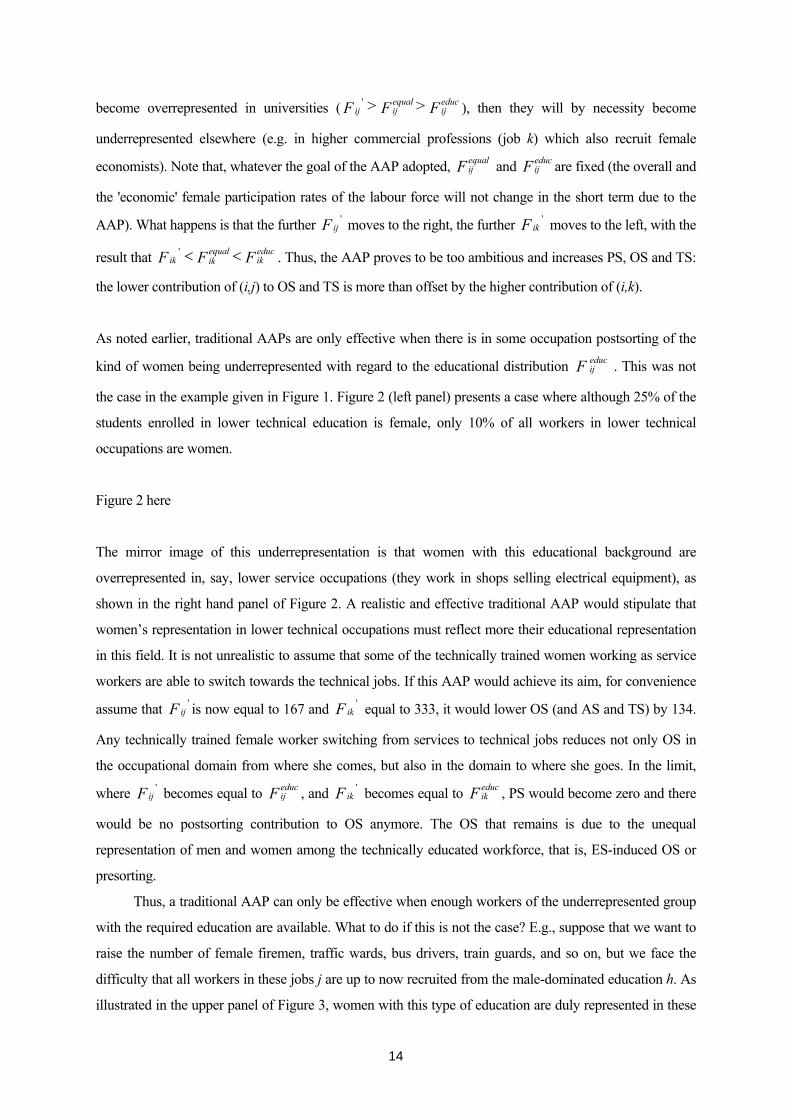
with the required education are available. What to do if this is not the case? E.g., suppose that we want to
raise the number of female firemen, traffic wards, bus drivers, train guards, and so on, but we face the
difficulty that all workers in these jobs j are up to now recruited from the male-dominated education h. As
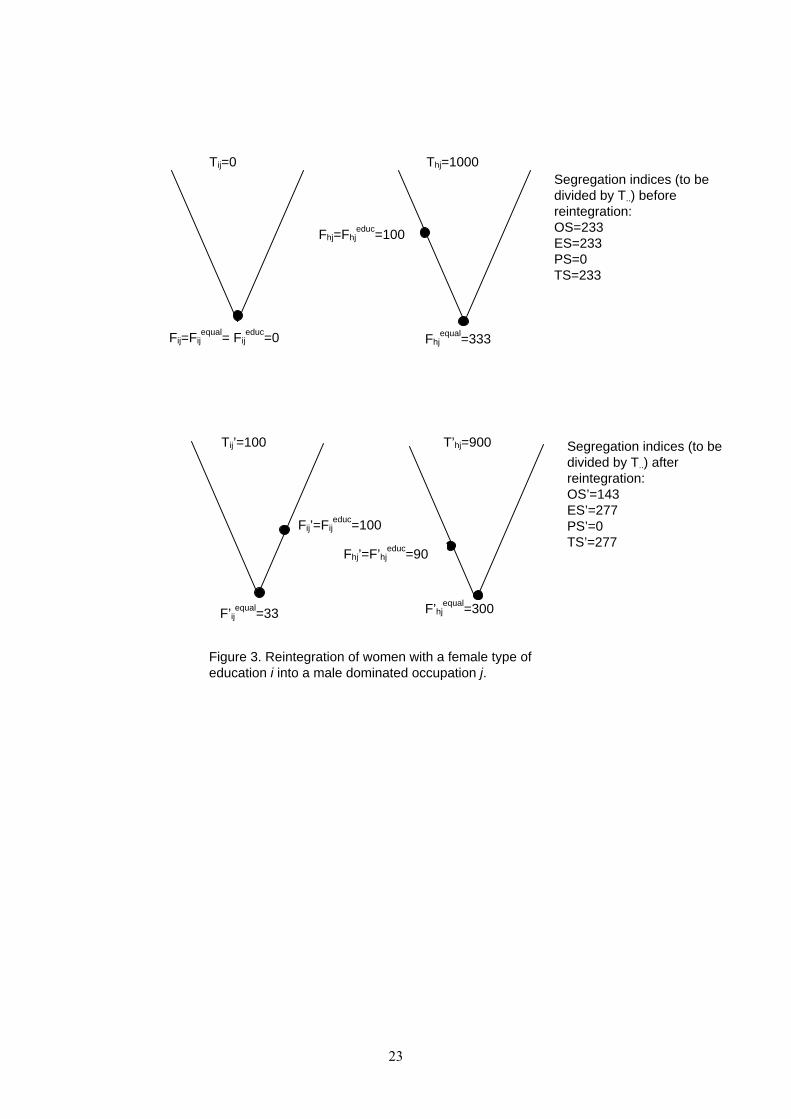
illustrated in the upper panel of Figure 3, women with this type of education are duly represented in these

15
jobs: their participation is just equal to what we would have expected according to their share in education
h. Nevertheless, women are underrepresented according to the yardstick of the equal distribution,
reflecting the fact that education h is male-dominated and the main supplier of workers in jobs of type j.
From the discussion above in the parallel case of the female economists of Figure 1, it is clear that one
should not try to raise the number of female workers with education h in job j. This will not result in a
decrease in OS (at best, the overall OS is unaffected when the decline of OS in job j is exactly
compensated by the increase in OS in jobs k ≠ j). If possible, the most obvious policy to pursue here is to
recruit and train women with a female-dominated educational background for these male-dominated jobs.
What happens then is that men with a male-dominated educational background are merged with women
with a female-dominated background into the same jobs. During their educational careers they were
segregated, but in the occupational domain they become reintegrated.
Figure 3 here
The lower panel of Figure 3 illustrates this reintegration. Initially all workers in occupation j are recruited
from the predominantly male type of education h. In the next situation, females are recruited from a
female type of education i, keeping the number of workers in job j constant. As shown, even though TS
increases, OS decreases due to reintegration. Here, the difference between TS and OS is exactly equal to
twice the amount of reintegration.7 This simple example shows that AAPs based on reintegration can be
very effective in reducing OS, even to levels below the pre-existing amount of ES. If such AAPs can be
carried out successfully, part of the impact of ES on OS can be neutralized. This type of reintegration-
based AAPs is further strengthened by the fact that it does not only reduce OS in jobs of type h, as shown
in Figure 3, but also — not shown in Figure 3 — that the female workers with a female dominated
educational background who now join the ranks of workers of job j would otherwise probably end up in
female-dominated jobs. A reintegration-based AAP is, so to speak, a double-edged sword.
6 EMPIRICAL RELEVANCE
The discussion above about the (in)effectiveness of traditional and reintegration-based AAPs might be
theoretically sound but still misleading because it was entirely cast in terms of hypothetical and, witness
Tables A-C, rather farfetched examples. However, we have an excellent database to our disposal, which
can be used to get a rough indication of what can be achieved by a full-fledged implementation of AAPs.
The data we use are taken from the Dutch labour force surveys. For 1979-1985 this is the so-called
7 This is not by coincidence. For the analytical result that the difference between TS and OS always equals

16
Arbeids Krachten Telling (AKT), covering approximately 2.5% of the labour force in 1979, 1983 and
1985 and 5% in 1981. For 1993/94 the survey is called Enquête Beroeps-Bevolking (EBB). This survey
covers approximately 1% yearly. For this reason a double year has been used, making coverage
comparable with the former survey. The segregation indices of Table D are based on the two-digit ISCED
classification of educations (54 educational types) and the ROA occupational classification (49
occupational categories).
Table D. Educational segregation, occupational segregation, postsorting and reintegration 1979 1981 1983 1985 1993/94 Educational segregation (ES) 17.9 18.5 19.9 20.8 21.6
Postsorting (PS) 9.6 10.0 9.6 8.7 6.7
Reintegration (R) 2.8 3.1 3.4 3.4 4.5
Occupational segregation (OS=ES+PS-R) 24.8 25.2 26.0 25.9 23.8
Presorting (OS pre) 16.0 17.0 18.4 18.6 19.5
Focussing on the development over time, we see that ES increases steadily over time, whereas OS first
increases (up to 1983), and then decreases. Apparently, the increase in ES has not been passed on fully to
OS, and this is due to the combined effect of postsorting becoming less, and reintegration becoming more
important. That postsorting becomes less important over time is in line with our earlier remark that young
cohorts entering the labour market are educationally more specialized than older cohorts, who went to
school a long time ago. To the extent that more specialized educations tend to be closely knitted to
particular occupations, it is no surprise that postsorting decreases slowly, but steadily. That reintegration
has increased is probably due to the phenomenon that women with a female educational background have
successfully entered formerly stereotype male occupations, e.g. in transport and agriculture.8 Note that
reintegration in Table D is not the result of a deliberate and politically explicit choice for AAPs, but
entirely spontaneous.
The question now is by how much the OS can be reduced by making use of both types of AAPs.
The potential of the traditional AAP is to eliminate postsorting, which amounts to a reduction of the
incidence of OS in 1993/94 by 6.7%-points, or by 6.7/23.8 = 28%. Further, suppose that fine-tuned
reintegration-based AAPs applied to occupations with loose connections to educational types is able to
double reintegration, from 4.5 to 9%, leading to a further reduction of OS by 4.5%-points, or 4.5/23.8 =
19%. In total, OS would be reduced by 47%, and reach a level of 12.6%, approximately half the level
twice the amount of reintegration, see Borghans and Groot 1999: 386. 8 For example, in lower agricultural occupations and lower transport occupations, which are both male
17
without the AAPs. Note that in this highly speculative exercise we keep the level of ES, and also the
ceteris paribus presorting effect of ES on OS, unchanged. The OS that will remain is probably due to ES-
induced OS (presorting), that is, to a large extent concentrated among gendered occupations requiring
specialized training.
7 A TAILOR-MADE POLICY MIX TO REDUCE OCCUPATIONAL SEGREGATION
In practice, we see a wide array of different kinds of policies, all aimed at improving opportunities of
minority groups or women.9 Here we concentrate only on the relevant policies impinging on the trajectory
of education to occupation, relating them to the framework expounded above and to the segregation
theories briefly discussed in section 2. Table E gives an overview.
Table E. Tailor-made policies directed at combating different types of occupational segregation.
OS caused or characterized by: Most appropriate policy instrument
Statistical or taste discrimination (giving rise to
postsorting)
Traditional AAPs
Socialization (giving rise to ES and presorting) Publicity campaigns; Reintegration-based
AAPs
The existence of typical (fe)male jobs with a loose
connection to education
Reintegration-based AAPs
The existence of typical (fe)male jobs with a tight
connection to education
Publicity campaigns; AAPs in the
educational domain
‘Foresighted’ educational and occupational choices of
women anticipating greater child and home care
responsibilities
Child-centred policies; eventually
implementation of paid parental leave
schemes for men
Admittedly, this is a sketchy portrayal of policy instruments to be used to influence the rather intricate
motivations underlying the educational and occupational choices made by men and women.10 However,
we think it is useful to distinguish between different kinds of OS, as done in the first column of Table E, if
only to obtain some clues for what we need to investigate and measure before designing and launching
policies to combat OS.
dominated, reintegration amounts to 12.3% and 10% respectively in 1993/94. 9 For a survey of the variety of AAPs and its impact on economic efficiency, see Holzer and Neumark (2000). 10 For sake of brevity, we abstract from all kinds of interactions, briefly indicated at the end of section 2, that may occur between ES and OS.
18
If the unequal sex composition of specific occupations is due to statistical or taste discrimination, it
may be wise to launch AAPs which urge, force or stimulate employers to increase the number of workers
who are underrepresented. Statistical discrimination can lead to great inequalities in job assignments to
similarly endowed men and women, for instance if employers searching candidates for jobs with high
turnover costs are unable to assess the quit propensity of female job applications. In theory, if employers’
perceptions of group characteristics are biased or inaccurate, we do not need an AAP because a small
minority of employers who happen to have more accurate or unbiased information can gain a competitive
advantage over their rivals by hiring the discriminated group at lower pay levels, so that sooner or later
discrimination is resolved. However, if the perceptions are unbiased, the AAP may force employers to
devise better, or intensify existent, screening procedures, leading to higher accuracy, so that they can
single out the female applicants with higher work commitments.11 In this way, women who would
otherwise be assigned to jobs with less opportunities to improve skills, that is to jobs with lower turnover
costs, lower wages and bleak career prospects, can demonstrate that they are as motivated as their male
colleagues. If discrimination is due to prejudice, as with taste discrimination, then of course traditional
AAPs can be highly recommended, incurring no efficiency losses. As noted at the end of section 4, if OS
is due to discrimination on the labour market, it makes more sense to go onto the attack of employers’
hiring practices first rather than launching AAPs in the educational domain, although one might say that it
is only a question of priority.
To neutralize the effects of all kinds of more or less subtle forms of socialization on educational and
(directly or indirectly) on occupational choices is probably impossible. One strategy is to launch publicity
campaigns to make people aware that it happens all the time, and to hope that these consciousness-raising
efforts will lead to less ‘socialized’ choices. Another strategy is to take socialization and its effects on
educational choices for granted, but to neutralize part of it by stimulating employers to recruit women
(men) for (fe)male jobs. The same type of reintegration-based AAPs can be applied when we observe
jobs, not demanding specific educational skills or extensive training, divided along gender lines (see the
third row of Table E). The loose educational connection that some job titles exhibit indicates that it might
be very well feasible for employers to alter the sex composition of workers in these jobs. Such
reintegration-based AAPs might get off the ground if targeted subsidies are made available to employers
who train and recruit workers belonging to the underrepresented groups for these jobs. In the opposite
case, jobs with a tight connection to education, forcing some employers to recruit more adequately skilled
women is, as we have shown, counterproductive. Moreover, to force them to take women without the
requisite skills would be productivity-reducing and cost-raising.12 As said, these jobs are the hard-core of
OS, and one can only hope that a free of obligations publicity campaign can change this in the long term.
Alternatively, one might consider to implement AAPs in the educational domain, to combat ES (and in
11 See Coate and Loury (1993) for an analysis of the interaction between AAPs and statistical discrimination.
19
time ES-induced OS) in educational types which are closely connected to particular jobs.
Finally, ‘foresighted’ educational and occupational choices of women anticipating greater child and
home care responsibilities in later stages of their life may lead to a considerable degree of educational and
occupational specialization by sex.13 Of course here child-centred policies, e.g. providing enough and
affordable day care centres, can be helpful. Supplementary, one can think of providing paid parental leave
schemes for men to stimulate them to take a greater share of care work. The upshot of the (combined)
effect of such policies might be that differing foresighted career choices between men and women become
less ubiquitous.
8 CONCLUSIONS
The main aim of this paper was to disentangle the relationship between ES and OS, and in doing so, to
decompose the trajectory of ES to OS into presorting, postsorting and reintegration. Based on these
distinctions we identified different types of AAPs available to policy-makers to restructure gender-related
educational or occupational distributions. In short, only if women are underrepresented in some
occupation ― according to what would be expected according to the female participation in educational
categories from which this occupation recruit its workers — then a traditional AAP is effective to combat
postsorting, e.g. to force employers to give up discrimination practices. If women are duly represented —
again, given the educational distribution — but still underrepresented when using the yardstick of the
overall female participation rate, then a traditional AAP is counter-effective. Instead, two policy
instruments might be used. First, a publicity campaign might help to induce more girls to choose
educations which prepare for occupations in which women are underrepresented. This will only help to
mitigate ES and OS in the long term. In the short term, a very effective, double-edged sword, policy is to
recruit women with a female-dominated type of education for jobs which are male-dominated, and vice
versa. This policy, however, requires that these jobs do not require an extensive and long educational
preparation. Reintegration-based AAPs can be applied whenever the link between type of education and
job types is loose.
REFERENCES
Becker, G.S., 1971 (1957), The Economics of Discrimination, 2nd edition, Chicago, University of Chicago Press.
Becker, G.S., 1985, Human Capital, Effort, and the Sexual Divisioin of Labour, Journal of Labor Economics 3(1), S33-58.
Blackburn, R.M., J. Browne, B. Brooks and J. Jarman, Explaining Gender Segregation, British
12 See e.g. Griffin (1992) for a test on the impact of AAPs in the form of hiring quotas on costs of production. 13 See Polachek (1981).

20
Journal of Sociology, 53 (4), 513-536. Borghans, L. and L.F.M. Groot, 1999, Educational Presorting and Occupational Segregation, Labour
Economics 6, 375-95. Coate, S. and G.C. Loury, 1993, Will Affirmative-Action Policies Eliminate Negative Stereotypes?, The
American Economic Review 83 (5), 1220-1240. Corcoran, M.E. and P.N. Courant, 1987, Sex-Role Socialization and Occupational Segregation: An
Exploratory Investigation, Journal of Post Keynesian Economics 9 (3), 330-46. Duncan, O.D. and B. Duncan, 1955, A Methodological Analysis of Segregation Indexes, American
Sociological Review 20, 210-217. Fuchs, V., 1989, Women’s Quest for Economic Equality, The Journal of Economic Perspectives 3
(1), 25-41. Gorard, S. and C. Taylor, What is Segregation?: A Comparison of Measures in Terms of ‘Strong’ and
‘Weak’ Compositional Invariance, Sociology, 36 (4), 875-895. Griffin, P., 1992, The Impact of Affirmative Action on Labor Demand: A Test of Some Implications of
the Le Chatelier Principle, The Review of Economics and Statistics 74 (2), 251-260. Hanna, C., 1988, The Organizational Context for Affirmative Action for Women Faculty, Journal of
Higher Education 59 (4), 390-411. Holzer, H. and D. Neumark, 2000, Assessing Affirmative Action, The Journal of Economic Literature
38 (3), 483-568. Hyer, P.B., 1985, Affirmative Action for Women Faculty: Case Studies of Three Successful Institutions,
Journal of Higher Education 56 (3), 282-299. Olson, P., 1990, The Persistence of Occupational Segregation: A Critique of its Theoretical
Underpinnings, Journal of Economic Issues 24 (1), 161-70. Phelps, E.S., 1972, The Statistical Theory of Racism and Sexism, American Economic Review 62, 659-61. Polachek, S.W., 1981, Occupational Self-Selection: A Human Capital Approach to Sex Differences in
Occupational Structure, The Review of Economics and Statistics 63 (1), 60-69.

21
Tij=100
Fij=Fijeduc=10
Tik=900
Fijequal=33 Fik
equal=300
Fik’=50
Fik=Fikeduc=90
Fij’=50
Segregation indices (to be divided by T..) before and after the AAP: OS=233 OS’=267 ES=233 ES’=233 PS=0 PS’=80 TS=233 TS’=267
Figure 1. Affirmative action in occupation j to increase the number of female workers with a male type of education i.

22
Tij=1000
Fij=100
Tik=1000
Fijequal=333 Fik
equal=333=Fik’
Fik=400
Fikeduc=250 Fij’=167
Segregation indices (to be divided by T..) before and after the AAP: OS=300 OS’=166 ES=166 ES’=166 PS=300 PS’=166 TS=300 TS’=166
Figure 2. Effective affirmative action by increasing (decreasing) the number of female workers with a male type of education i in occupation j (k).
Fijeduc=250
23
Tij’=100 T’hj=900
F’ijequal=33 F’hjequal=300
Fhj’=F’hjeduc=90
Segregation indices (to be divided by T..) before and after the AAP: OS=300 OS’=166 ES=166 ES’=166 PS=300 PS’=166 TS=300 TS’=166
Tij=0 Thj=1000
Fij=Fijequal= Fij
educ=0 Fhjequal=333
Fhj=Fhjeduc=100
Segregation indices (to be divided by T..) before reintegration: OS=233 ES=233 PS=0 TS=233
Fij’=Fijeduc=100
Segregation indices (to be divided by T..) after reintegration: OS’=143 ES’=277 PS’=0 TS’=277
Figure 3. Reintegration of women with a female type of education i into a male dominated occupation j.