twenty years on – have we made progress in service delivery? · antenatal care • overall...
TRANSCRIPT

Twenty years on – have we made progress in service delivery?
An overview of relevant data
Lizette BerrySenior Researcher
Children’s Institute (UCT)
ECD Knowledge Building Seminar5 December 2014
Acknowledgements: L Biersteker, A Dawes, K Hall and W Sambu

Introduction
Child-centred data is useful and necessary for evidence-based planning
It helps with measuring and monitoring progress against objectives
Data tells us about: children’s environments and living
conditions Access to resources, services and support Gaps and inadequacies, enabling action

Providing services across the developmental continuum
Adapted from Richter L, Biersteker L, Burns J, Desmond C, Feza N, Harrison D, Martin P, SaloojeeH & Slemming W (2012) Diagnostic Review of Early Childhood Development. Pretoria: Department of Performance, Monitoring and Evaluation & Inter-Departmental Steering Committee on ECD.
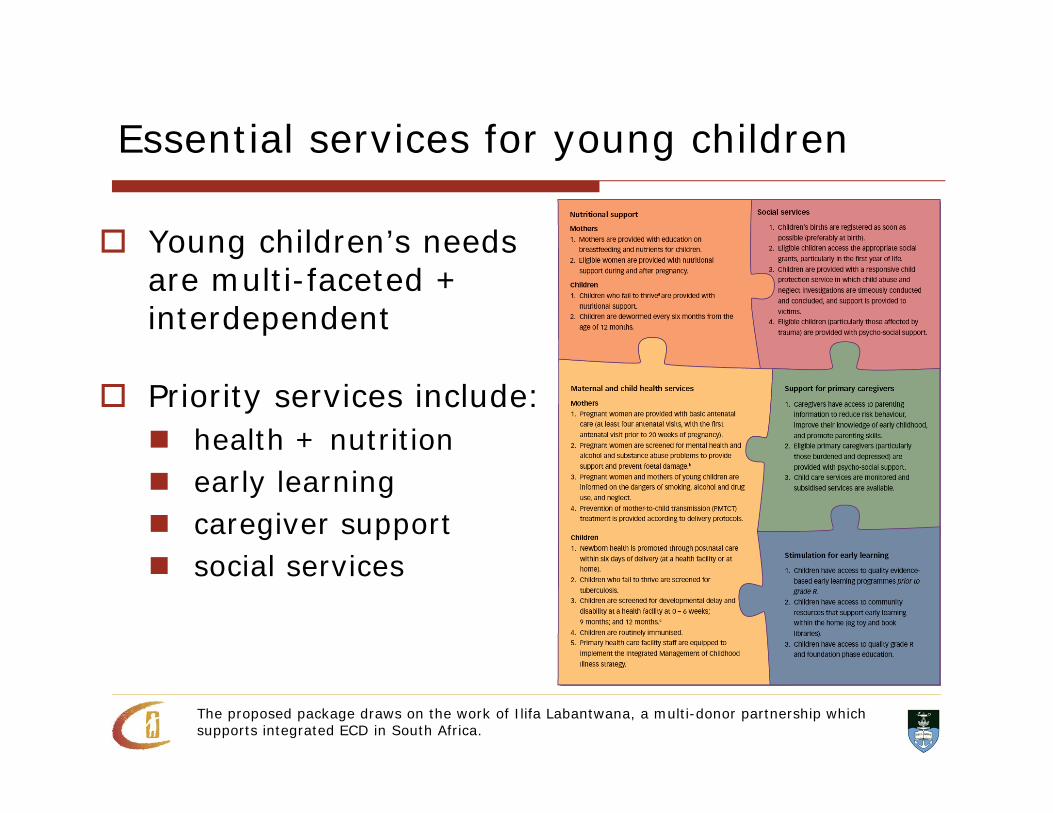
Essential services for young children
Young children’s needs are multi-faceted + interdependent
Priority services include: health + nutrition early learning caregiver support social services
The proposed package draws on the work of Ilifa Labantwana, a multi-donor partnership which supports integrated ECD in South Africa.

Then and now….
1994: advent of democracy Limited and fragmented attempts to monitor
child well-being Availability and quality of data was a challenge Focus was largely on maternal and child health Overwhelming attention on child survival Child-centred data not readily available

Then and now….
Present context – Wider variety of data sources allows for
deeper and diverse analysis Growing understanding of developmental
stages and the need to differentiate ages Greater number of actors and systems
performing monitoring functions Gradual acknowledgment that moving beyond
child survival/curative approach to a developmental and holistic approach is essential

The young child population
4,443,6215,685,452
4,668,722
4,819,751
1996 2011
5-9 years
0-4 years
Number of young children aged 0-9 years, 1996 and 2011
9.1 million
10.5 million
Source: Statistics South Africa 1998, 2012. Census 1996 and 2011.

Child health and mortality
Provision of public health services has improved significantly since 1994
Sector’s most profound success is the reduction in child mortality – from 58.5 in 1994 to 41 per 1,000 live births in 2012
Mostly due to improved access and take-up of HIV prevention and treatment programmes
Existing public health infrastructure enables regular contact and reach of services to young children
Sources: 1994 U5MR - Estimates generated by the UN Inter-agency Group for Child Mortality Estimation (IGME) in 2013; U5MR 2012 - MRC, Rapid mortality surveillance report, adjustments 2012.
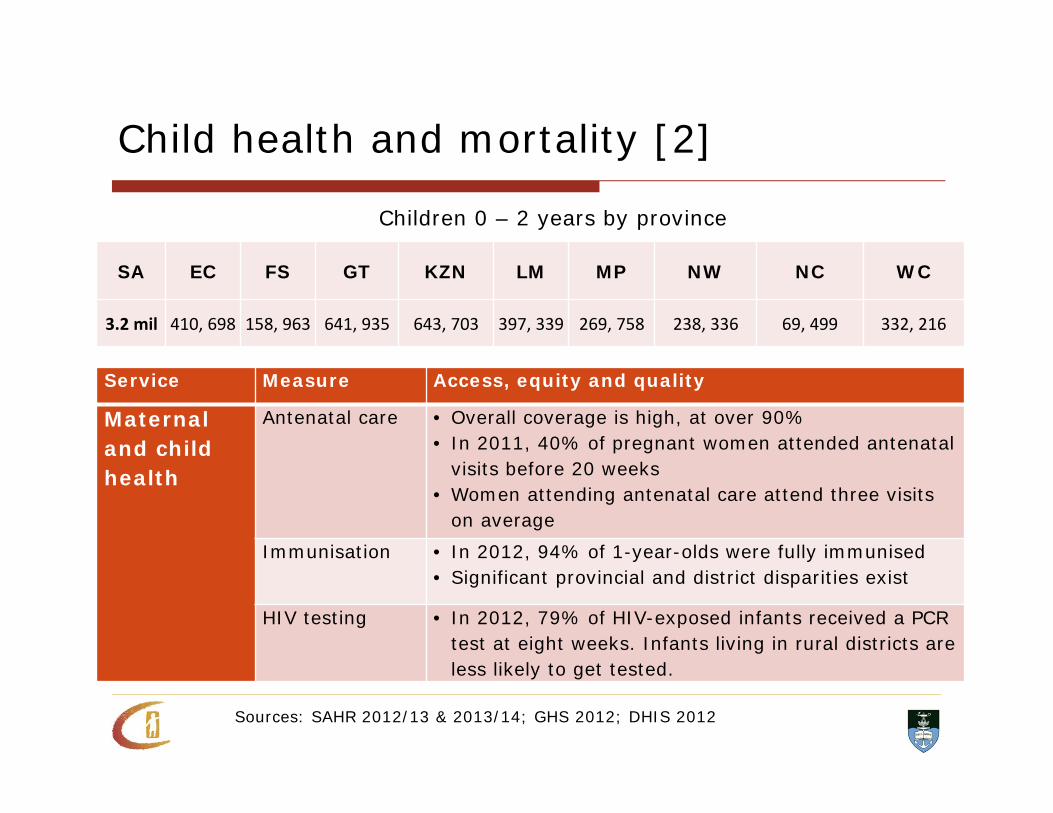
Child health and mortality [2]
SA EC FS GT KZN LM MP NW NC WC
3.2 mil 410, 698 158, 963 641, 935 643, 703 397, 339 269, 758 238, 336 69, 499 332, 216
Children 0 – 2 years by province
Service Measure Access, equity and quality
Maternal and child health
Antenatal care • Overall coverage is high, at over 90%• In 2011, 40% of pregnant women attended antenatal
visits before 20 weeks• Women attending antenatal care attend three visits
on average
Immunisation • In 2012, 94% of 1-year-olds were fully immunised• Significant provincial and district disparities exist
HIV testing • In 2012, 79% of HIV-exposed infants received a PCR test at eight weeks. Infants living in rural districts are less likely to get tested.
Sources: SAHR 2012/13 & 2013/14; GHS 2012; DHIS 2012

Child nutrition
6m - 6 years (1994)%
1 - 6 years (1999)%
0-5 years (2012)%
Stunting 23 24 22Wasting 3 4 3Underweight 9 11 5
• 27% of 0–2 year-olds remain stunted
• Severe acute malnutrition in children younger than 12 months appears to be increasing
40%
29%
0%
5%
10%
15%
20%
25%
30%
35%
40%
45%
1993 2008
Stunting rates among the poorest 20% of children under 5 years
Sources: SAVACG survey 1995; Food Consumption Survey 1999; PSLSD 1993 & NIDS wave 1 2008 (SALDRU) Children’s Institute analysis; SANHANES-1 2012

Child nutrition [2]
SA EC FS GT KZN LM MP NW NC WC
44% ‐ ‐ ‐ ‐ ‐ ‐ ‐ ‐ ‐
Vitamin A deficiency in children under 5 years
Sources: SANHANES-1 2012; SADHS 2003; The health of our children 2008; HST review of public health facilities 2011; DHIS 2012
Service Measure Access, equity and qualityNutrition Breastfeeding
rates• In 2003, 8% of infants were exclusively breastfed for the
first six months • A 2008 survey suggested 26%, but the sample was very
small • A 2010 survey found that 28% of infants were exclusively
breastfed at 4-8 weeks
Vitamin A coverage
• In 2012, 43% of children 1 – 5 years received vitamin A supplements
• Provincial variation is a concern, and malnutrition is highest in rural and urban-informal areas

Stimulation for early learning
Since 1994 there has been a significant increase in access to centre-based care
In 2001, over 1 million learners (0 – 7 years) were enrolled in over 23,000 audited ECD sites
Enrolment in Grade R has more than doubled between 2003 and 2011 and is near universal access
By 2012, 88% of learners in Grade 1 in public schools had attended Grade R
Sources: Nationwide ECD audit 2001; 20 year review, South Africa 2014

Stimulation for early learning [2]
SA EC FS GT KZN LM MP NW NC WC
3.2 mil 487, 003 171, 525 595, 528 680, 205 369, 561 259, 647 237, 751 78, 687 310, 183
Children 3 – 5 years by province
Sources: GHS 2012; National DSD data
67%73% 75% 76%
53%
74%
61%66%
54%
63%
0%
10%
20%
30%
40%
50%
60%
70%
80%
SA EC FS GT KZN LP MP NW NC WC
Attendance of early learning group programmes, 3-5 year olds
• In 2012, 486,000 children under 5 years received a subsidy
• An estimated 16% of poor children was covered by the subsidy in 2013/14
• There are age, geographic, race and income disparities
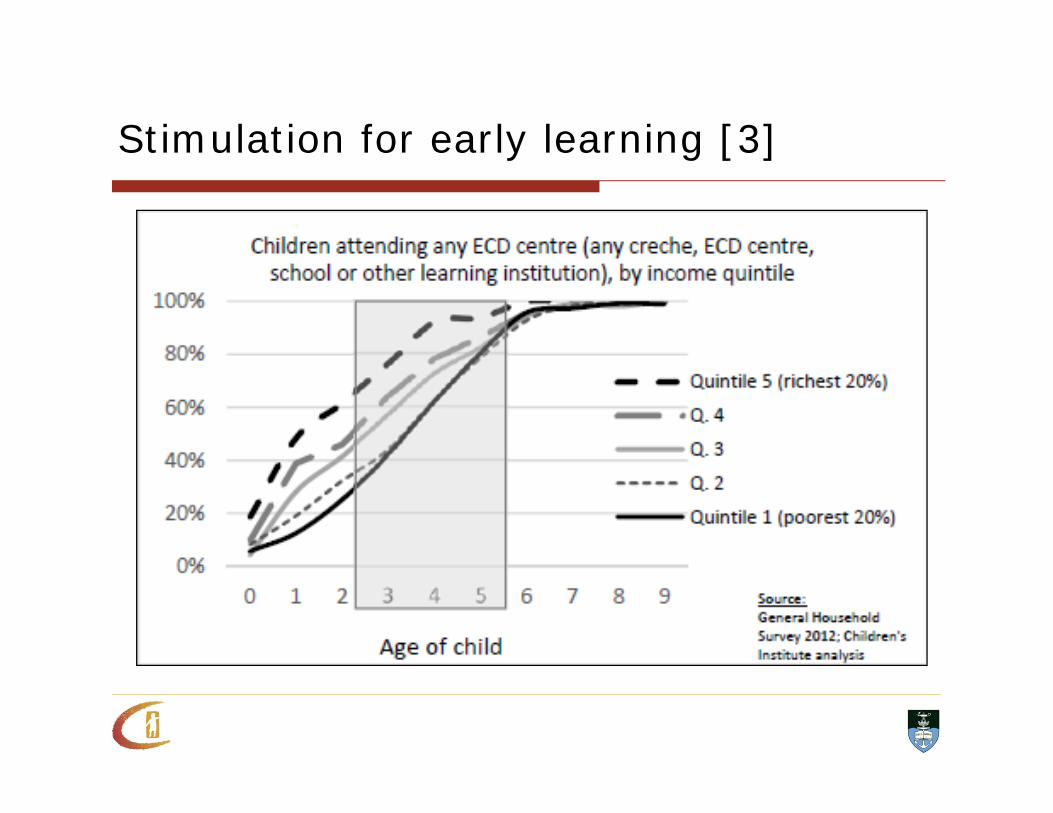
Stimulation for early learning [3]
Caregiver support
Since 1994, there has been a focus on transforming social welfare services by deracialising access and promoting a developmental approach
Family and parental support are included in the ambit of designated welfare services and recognised in several policies
Parenting support offers a strong preventive and protective function and has been shown to produce good child outcomes when implemented effectively
Sources: Twenty year review, South Africa 2014

• Antenatal visits are a good place to start • Postnatal care is improving: in 2009, 5% of women
received follow-up, while 53% received care in 2012• An estimated one-third of mothers suffer from post-
natal depression
Caregiver support [2]
Sources: GHS 2011; DHIS 2012
0%10%20%30%40%50%60%70%80%90%
100%
0-2 yrs 3-4 yrs 5-6 yrs 7-9 yrs
Young children living with their mothers
Mother only Both

Social services and income support
The CSG has enjoyed tremendous success: 22,000 recipients in 1998 11,3 million in 2013
Its benefits are well documented, including improving child nutrition, health and educational outcomes
An estimated 76% of eligible children currently receiving the grant
Birth registration is another service area where South Africa boasts large improvements in service delivery over the past decade
Sources: Twenty year review, South Africa 2014; Stats SA mid year population estimates 2011, Children’s Institute analysis

Social services and income support
Take-up is lower for younger children
This indicates barriers in access to the grant in the first year of life
This is the period when children are arguably most in need of nutritional foods, access to health care and other forms of support
There are no reliable statistics on the need for social services, or on the extent of delivery

South African Child Gauge 2013