twenty years of soft computing: a bibliometric overview
TRANSCRIPT

Soft Computing (2019) 23:1477–1497https://doi.org/10.1007/s00500-018-3168-z
FOUNDATIONS
Twenty years of Soft Computing: a bibliometric overview
José M. Merigó1 ·Manuel J. Cobo2 · Sigifredo Laengle1 · Daniela Rivas1 · Enrique Herrera-Viedma3
Published online: 30 March 2018© Springer-Verlag GmbH Germany, part of Springer Nature 2018
AbstractThe journal Soft Computing was launched in 1997, and it is dedicated to promote advancements in soft computing theories,which includes fuzzy sets theory, neural networks, evolutionary computation, probabilistic reasoning and hybrid theories.2017 marks the 20th anniversary of the journal. Motivated by this anniversary, this study presents a bibliometric analysis ofthe current publications in the journal in order to identify the leading trends ruling the journal. The paper also develops amapping analysis of the bibliographic material by using the visualization of similarities viewer software. The results showthat researchers from all over the world publish regularly in the journal. Soft Computing is growing significantly during thelast years, becoming one of the leading journals in the field.
Keywords Bibliometrics · Web of Science · h-Index · VOS viewer
1 Introduction
The Soft Computing (SC) journal is a leading internationaljournal in the field of Soft Computing, which encom-passes a wide range of theories including fuzzy sets andsystems, neural networks, evolutionary computation, prob-abilistic reasoning and other related theories. The journalpublished its first issue in 1997, and since then, it has
Communicated by A. Di Nola.
B José M. Merigó[email protected]
B Enrique [email protected]
Manuel J. [email protected]
Sigifredo [email protected]
Daniela [email protected]
1 Department of Management Control and InformationSystems, School of Economics and Business, University ofChile, Av. Diagonal Paraguay 257, 8330015 Santiago, Chile
2 Department of Computer Science and Engineering,University of Cadiz, Cádiz, Spain
3 Department of Computer Science and Artificial Intelligence,University of Granada, Av. Periodista Daniel Saucedo s/n,Granada, Spain
increased significantly becoming today a monthly journal.The journal is indexed in Web of Science Core Collec-tion and received an impact factor of 2.472 in the latestJournal Citation Reports being in the 46th position of 133journals in the category of Computer Science, ArtificialIntelligence. Antonio Di Nola, the founding editor-in-chief,created the journal. Today, he currently runs the journaltogether with Vincenzo Loia. Both are from the Universityof Salerno, Italy. SC is published by Springer internationalpublisher.
In 2017, SC has celebrated 20 years old. To mark thisanniversary, this work presents a bibliometric overview ofthe journal in order to identify the leading trends that haveoccurred over the last 20 years. The study identifies the mostproductive authors, institutions and countries and develops ageneral analysis of the publications and citations of the jour-nal. The work also develops a mapping analysis in orderto visualize the bibliographic material by using the visu-alization of similarities (VOS) viewer software (Van Eckand Waltman 2010). The analysis uses a wide range ofbibliometric indicators including the number of papers andcitations, the h-index (Hirsch 2005), citation thresholds, bib-liographic coupling (Kessler 1963) and co-citation (Small1973).
Observe that many other journals have already developeda bibliometric overview of their journals, especially for thecelebration of a special event. Among others, it is worthmen-tioning:
123
1478 J. Merigó et al.
• Journal of Financial Economics (Schwert 1993).• Strategic Management Journal (Ramos-Rodríguez andRuiz-Navarro 2004).
• Technovation (García-Merino et al. 2006).• Journal of Risk and Insurance (Weiss and Qiu 2008).• Knowledge-Based Systems (Cobo et al. 2015).• Journal of Business Research (Merigó et al. 2015b).• International Journal of Intelligent Systems (Merigó et al.2017).
• Journal of Business & Industrial Marketing (Valenzuelaet al. 2017).
• European Journal of Operational Research (Laengle et al.2017).
• Computers & Industrial Engineering (Cancino et al.2017b).
• Information Sciences (Merigó et al. 2018;Yu et al. 2017).• Journal of Political Economy (Amiguet et al. 2017).• European Journal of Marketing (Martínez-López et al.2018).
• International Journal of Uncertainty, Fuzziness andKnowledge-Based Systems (Wang et al. 2018).
• International Journal of FuzzySystems (Tang et al. 2018).
The remainder of the work is structured as follows: Sec-tion 2 presents the bibliometric methods to be used in thepaper. Section 3.1 presents the most productive authors,institutions and countries. Section 3.2 studies the structureof the publications and citations of the journal. Section 4presents the graphical analysis with VOS viewer software.Section 5 summarizes the main findings and conclusions ofthe study.
2 Bibliometric methods
The work uses different bibliometric methods to discoverinformation from the journal Soft Computing (Gutierrez-Salcedo et al. 2018). Observe that bibliometrics is usuallydefined as the science that studies quantitatively the bib-liographic material (Broadus 1987; Pritchard 1969). In theliterature, it is very common to develop bibliometric studiesof awide rangeof issues including topics (Heradio et al. 2016;Moral-Muñoz et al. 2016; Liao et al. 2018a, b), journals (Bie-mans et al. 2007; Thongpapanl 2012), authors (Coupé 2003),universities (Cancino et al. 2017a; Linton 2004) and coun-tries (Bonilla et al. 2015). Due to the strong development ofcomputers, bibliometrics has become a very powerful tech-nique for providing a general overview of a research field.
Note that there are also several bibliometric studies regard-ing different soft computing topics including fuzzy research(Cobo et al. 2011a, b; Merigó et al. 2015a), fuzzy and lin-guistic decision making (Blanco-Mesa et al. 2017; Liu andLiao 2017; Yu et al. 2016), intuitionistic fuzzy sets (Yu
and Liao 2016; Yu and Shi 2015), ordered weighted aver-aging operators (Emrouznejad and Marra 2014; He et al.2017), aggregation operators (Yu 2015) and computationalintelligence (Van Eck andWaltman 2007). Recall that biblio-metric studies represent an alternative approach to developa literature review of a research field that can complementperfectly the classical review and survey papers. Observethat survey papers in soft computing research are availablein a wide range of topics including intuitionistic fuzzy sets(Xu and Liao 2015), hesitant fuzzy sets (Liao et al. 2015,2018b), group decision making (Capuano et al. 2018; Taibiand Atmani 2017), consensus analysis (Moral et al. 2018;Zhang et al. 2018) and applications in artificial intelligencesuch as big data and internet of things (Dhall and Solanki2017; Settouti et al. 2016).
The study uses the Web of Science (WoS) Core Collec-tion database. The search was carried out betweenNovember2016 and January 2017 and finds all the documents in thejournal since 2003. Note that for the documents publishedin the journal between 1997 and 2002, the work uses the“Cited Reference Search” tool of WoS, finding all the doc-uments with at least one citation. For those papers that havenot received any citation, the search finds them through thewebpage of the journal. Up to 2016, the journal has published2331 documents which decreases to 2037 if only consider-ing articles, reviews and notes. It has received 17523 citationswith a ratio of 7,52 cites per paper. The h-index is 48, thatis, of the 2331 documents published in the journal, 48 havereceived 48 citations or more.
The analysis uses a wide range of bibliometric indica-tors (Merigó and Yang 2017) including the total number ofpublications and citations, the ratio cites per paper, the h-index (Alonso et al. 2009; Hirsch 2005; Martinez et al. 2014)and citations thresholds (Merigó et al. 2015a). The objec-tive is to provide a general overview of the bibliographicmaterial. The main reason for doing so is because there aredifferent perspectives to consider when analyzing the bibli-ographic material. From a general point of view (Podsakoffet al. 2008), the two main perspectives are the number ofpublications that reflect the productivity and the number ofcitations that focus on the influence and popularity of a doc-ument.
Additionally, theworkuses bibliographic coupling (Kessler1963), co-authorship, co-occurrence, citation analysis andco-citation analysis (Small 1973) to develop the graphicalanalysis. Recall that co-citation occurs when two documentsreceive a citation from the same source and bibliographiccoupling when two documents cite the same third work. Co-authorship appears when a document is written by more thanone author. Citation analysis measures how different docu-ments or sources cite each other. Co-occurrence of keywordsmeasures the most common keywords in the set of docu-ments. Observe that in this study co-occurrence focuses on
123

Twenty years of Soft Computing: a bibliometric overview 1479
Table 1 Most productiveauthors in SC
R Author name Country TP TC C/P H Q1 Q2 Q3 Q4
1 Pedrycz, W Canada 27 97 3.59 5 1 12 3 11
2 Buckley, JJ USA 18 252 14.00 9 0 12 6 0
3 Chajda, I Czech Rep 18 61 3.39 4 0 0 5 13
4 Herrera, F Spain 16 1023 63.94 11 0 3 9 4
5 Dvurecenskij, A Slovakia 16 111 6.94 5 2 3 5 6
6 Allahviranloo, T Iran 14 130 9.29 7 0 0 4 10
7 Wang, ST China 13 93 7.15 5 0 7 3 3
8 Jiao, LC China 13 26 2.00 2 0 0 0 13
9 Liu, ZQ China 12 98 8.17 5 0 3 7 2
10 Alba, E Spain 12 67 5.58 4 1 0 5 6
11 Zhang, MJ China 12 33 2.75 3 0 0 2 10
12 Davvaz, B Iran 10 355 35.50 7 0 3 5 2
13 Yager, RR USA 10 173 17.30 3 3 0 5 2
14 Hong, TP China 10 122 12.20 4 3 2 3 2
15 Chung, FL China 10 40 4.00 4 0 5 3 2
16 Yang, SX China 9 211 23.44 5 0 1 6 2
17 Yao, X China 9 177 19.67 5 0 2 3 4
18 Melin, P Mexico 9 116 12.89 4 0 1 3 5
19 Sanchez, L Spain 8 469 58.63 5 1 1 5 1
20 Lozano, M Spain 8 188 23.50 8 0 2 5 1
21 Castillo, O Mexico 8 116 14.50 4 0 1 3 4
22 Ishibuchi, H Japan 8 103 12.88 5 0 1 6 1
23 Li, YM China 8 42 5.25 4 0 2 4 2
24 Pulmannova, S Slovakia 8 6 0.75 1 0 1 4 3
25 Marcelloni, F Italy 7 216 30.86 6 0 1 6 0
26 Lazzerini, B Italy 7 216 30.86 6 0 1 6 0
27 Nojima, Y Japan 7 116 16.57 5 0 1 6 0
28 Dudek, WA Poland 7 100 14.29 5 0 0 6 1
29 Cheng, CH Taiwan 7 88 12.57 5 0 5 2 0
30 Xu, Y China 7 54 7.71 4 0 0 2 5
31 Shen, Q China 7 28 4.00 3 0 0 3 4
32 Li, YY China 7 25 3.57 2 0 1 0 6
33 Ventura, S Spain 6 494 82.33 4 0 0 2 4
34 Eslami, E Iran 6 155 25.83 5 0 3 2 1
35 Wang, XZ China 6 77 12.83 4 0 0 4 2
36 Chen, CH Taiwan 6 74 12.33 3 0 1 2 3
37 Abraham, A India 6 71 11.83 4 0 0 4 2
38 Gao, JW China 6 66 11.00 5 0 0 3 3
39 Kalra, PK India 6 45 7.50 5 0 4 2 0
40 Lee, CS Taiwan 6 45 7.50 4 0 0 2 4
41 Hirota, K Japan 6 28 4.67 3 0 2 3 1
42 Jin, YC China 6 10 1.67 2 0 0 0 6
43 Wang, YP China 6 9 1.50 2 0 0 0 6
44 Vincekova, E Slovakia 6 5 0.83 1 0 0 3 3
45 Saha, S India 6 4 0.67 1 0 0 0 6
46 Das, S India 5 81 16.20 3 0 0 2 3
47 Zhan, JM China 5 49 9.80 4 0 0 4 1
123

1480 J. Merigó et al.
Table 1 continued R Author name Country TP TC C/P H Q1 Q2 Q3 Q4
48 Zhou, LG China 5 25 5.00 2 0 0 1 4
49 Zelinka, I Czech Rep 5 21 4.20 3 0 0 0 5
50 Li, J China 5 11 2.20 2 0 0 0 5
R = Rank; TP and TC = Total papers and citations; C/P = Cites per paper; H = h-index; Q1 = 1997–2001;Q2 = 2002–2006; Q3 = 2007–2011; Q4 = 2012–2016
Table 2 The most productive and influential institutions in SC
R Institution Country TP TC H C/P ≥ 50 ≥ 25 ≥ 5 ARWU QS
1 U Granada Spain 56 1628 18 29.07 3 4 13 201–300 501–550
2 Slovak Academy of Sciences Slovakia 43 167 6 3.88 0 0 1 – –
3 Islamic Azad U Iran 42 375 11 8.93 0 1 4 – –
4 Chinese Academy of Sciences China 41 182 7 4.44 0 0 2 – –
5 Palacky U Olomouc Czech Rep 32 121 7 3.78 0 0 0 – 651–700
6 Xidian U China 32 72 5 2.25 0 0 0 – –
7 Indian Institute Tech India 31 246 9 7.94 0 0 3 – –
8 U Alberta Canada 30 110 6 3.67 0 0 0 101–150 94
9 Czech Academy of Sciences Czech Rep 24 382 8 15.92 1 1 5 – –
10 U Salerno Italy 23 134 6 5.83 0 0 1 401–500 –
11 City U Hong Kong China 22 189 9 8.59 0 0 3 201–300 55
12 Hong Kong Polytechnic U China 22 143 7 6.50 0 0 1 301–400 111
13 Jiangnan U China 22 124 6 5.64 0 0 1 – –
14 U Malaga Spain 21 88 5 4.19 0 0 0 – –
15 U Jaen Spain 19 903 11 47.53 2 1 7 – –
16 Tsinghua U China 19 157 7 8.26 0 0 3 58 24
17 U Ostrava Czech Rep 19 157 7 8.26 0 0 2 – –
18 U Alabama Birmingham USA 18 261 9 14.50 0 0 6 201–300 601–650
19 Slovak U Tech Bratislava Slovakia 17 162 6 9.53 0 0 4 – –
20 Polish Academy of Sciences Poland 17 77 4 4.53 0 0 1 – –
21 U Cordoba Argentina 16 554 7 34.63 1 1 0 – –
22 Hebei U China 16 190 6 11.88 0 1 2 – –
23 CNRS—France France 16 184 7 11.50 0 1 1 – –
24 Polytechnic U Madrid Spain 16 113 5 7.06 0 0 0 – 551–600
25 U Oviedo Spain 15 505 7 33.67 1 0 2 – –
26 U Birmingham UK 15 194 5 12.93 1 0 1 101–150 82
27 Shaanxi Normal U China 15 69 6 4.60 0 0 0 – –
28 Nanyang Tech U Singapore Singapore 14 169 6 12.07 0 2 2 101–150 13
29 Shahid Bahonar U Kerman Iran 14 156 5 11.14 0 1 2 – –
30 National Cheng Kung U China 14 91 4 6.50 0 1 0 401–500 241
31 Wuhan U China 14 64 4 4.57 0 0 1 301–400 275
32 U Naples Federico II Italy 14 51 5 3.64 0 0 0 301–400 481–490
33 Tongji U China 14 43 4 3.07 0 0 0 301–400 315
34 National Chiao Tung U China 13 107 6 8.23 0 0 1 401–500 174
35 Jadavpur U India 13 96 3 7.38 0 0 2 – –
36 Victoria U Wellington New Zealand 13 33 3 2.54 0 0 0 301–400 228
37 King Abdulaziz U Saudi Arabia 13 27 3 2.08 0 0 0 101–150 283
38 U Nottingham UK 12 445 5 37.08 1 0 0 101–150 75
123
Twenty years of Soft Computing: a bibliometric overview 1481
Table 2 continued
R Institution Country TP TC H C/P ≥ 50 ≥ 25 ≥ 5 ARWU QS
39 Wroclaw U Tech Poland 12 105 5 8.75 0 0 2 – 701
40 Southwest Jiaotong U China 12 88 7 7.33 0 0 1 – –
41 CSIC—Spain Spain 12 85 5 7.08 0 0 0 – –
42 Shanghai Jiao Tong U China 12 82 4 6.83 0 0 1 101–150 61
43 Renmin U China China 12 73 5 6.08 0 0 1 – 421–430
44 Nanjing U Science Tech China 12 53 4 4.42 0 0 0 401–500 –
45 Tianjin U China 12 30 3 2.50 0 0 0 301–400 481–490
46 Technical U Ostrava Czech Rep 12 50 5 4.17 0 0 0 – –
47 South China U Tech China 12 44 3 3.67 0 0 0 201–300 551–600
48 U Yazd Iran 11 371 8 33.73 1 1 3 – –
49 Ulster U UK 11 104 6 9.45 0 0 2 – 601–650
50 Sun Yat Sen U China 11 39 4 3.55 0 0 0 151–200 297
Abbreviations are in Table 1 except for:≥ 50,≥ 25,≥ 5 = Number of documents with equal or more than 50, 25 and 5 citations and less than theprevious threshold; ARWU and QS = Ranking of the university in the general ARWU and QS university rankings
the author keywords that usually appear below the abstractof an article.
In order to visualize and map the bibliographic material,thework usesVOSviewer (VanEck andWaltman 2010). Thedifference between the software and the results of WoS CoreCollection is that the software only focuses on the publica-tions of the journal and the citations generated inside thesedocuments. However, WoS Core Collection also considersthe citations from documents published in other journals inorder to measure the general impact this set of documentshave in the scientific community (Blanco-Mesa et al. 2017).Note that in the literature there are many other softwares todevelop a graphical analysis of the bibliographic material(Cobo et al. 2011a, b, 2012).
3 Results
This section presents the bibliometric results found in WoSCore Collection including the publication and citation struc-ture, the citing articles, and the leading authors, universitiesand countries.
3.1 Leading authors, institutions and countries of SC
Many authors have published significant contributions in thejournal since 1997. Table 1 presents a list with the fifty mostproductive authors until December 31, 2016. Note that sev-eral other indicators are considered including the numberof citations, the h-index, the cites per paper ratio, citationthresholds and the number of publications divided in periodsof 5 years.
Witold Pedrycz clearly obtains the first position withtwenty-seven articles. However, in terms of citations and
the h-index, Francisco Herrera obtains the most significantresults far away from the rest of authors. Note that nineteenauthors work at a Chinese institution, five in Spain, four inIndia and three in Iran, Japan, Slovakia and Taiwan.
Next, let us look into the leading institutions of the jour-nal. For doing so, Table 2 presents the fifty most productiveinstitutions.
The University of Granada clearly leads the rankingobtaining the most significant results in number of papers,citations and the h-index. Observe that eighteen institutionsare from China, six from Spain and four from Czech Repub-lic. Only one is from the USA.
In order to deepen the results of Table 2, let us look into thetemporal evolution of the productivity. For doing so, Table 3analyzes the annual number of publications of the thirty mostproductive institutions.
During the last 3 years, Chinese universities are emergingvery strongly. Remark also that theUniversity ofGranada hasnot publishedmany papers in the last years although between2009 and 2013 it published thirty-eight papers.
A further interesting issue is to consider the country affil-iation of the institutions in order to analyze the geographicalregions with a highest productivity in SC. Table 4 presentsthe fifty most productive countries.
China clearly dominates the list with more than twice thenumber of papers of Spain, which is in the second place.The USA and the UK obtain the third and fourth positions,respectively. However, when normalizing per person, CzechRepublic and Slovakia obtain the most remarkable results.
Next, let us analyze the publications by countries througha temporal evolution. For doing so, Table 5 presents theannual number of papers published by countries in SC. Notethat those published before 2002 are summarized in a single
123
1482 J. Merigó et al.
Table3
Mostp
roductiveinstitu
tions
inSC
throughout
time
RUniversities
TP
2016
2015
2014
2013
2012
2011
2010
2009
2008
2007
2006
2005
2004
2003
2002
Pre2002
Q1
Q2
Q3
Q4
1UGranada
500
11
97
107
52
30
10
13
00
527
18
2Slovak
AcadSc
i43
51
21
23
32
51
21
15
18
810
1411
3IslamicAzadU
424
74
59
73
11
01
00
00
00
112
29
4Chinese
AcadSc
i41
115
45
22
13
24
11
00
00
02
1227
5XidianU
3216
59
01
00
00
10
00
00
00
01
31
6PalackyUOlomouc
323
54
35
51
20
12
00
10
00
39
20
7Indian
InstTech
316
32
52
22
01
12
11
11
11
66
18
8UAlberta
303
24
20
10
02
22
32
24
11
135
11
9Czech
AcadSc
i24
02
00
10
00
21
14
25
15
513
33
10USa
lerno
232
11
13
02
00
01
41
02
55
82
8
11City
UHongKong
220
21
33
21
40
30
00
30
00
310
9
12HongKongPo
lytecU
220
11
01
01
11
46
22
11
00
127
3
13Jiangnan
U21
13
10
12
10
21
52
20
00
09
66
14UMalaga
213
51
32
31
00
20
00
00
11
06
14
15TsinghuaU
192
22
20
32
22
11
00
00
00
110
8
16UJaen
193
00
13
33
31
10
00
01
00
111
7
17UAlabamaBirmingham
190
00
00
00
13
21
43
13
11
126
0
18UOstrava
190
01
01
01
11
00
14
14
44
103
2
19Slovak
UTech
Bratislava
171
11
10
13
01
15
01
00
11
66
4
20Po
lishAcadSc
i17
32
21
00
11
11
00
11
30
05
48
21UCordoba
161
01
24
12
12
01
10
00
00
26
8
22HebeiU
160
10
33
11
10
60
00
00
00
09
7
23CNRS—
France
160
01
14
00
02
13
03
10
00
73
6
24UOviedo
153
00
03
32
21
01
00
00
00
18
6
25Sh
aanxiN
ormalU
150
11
21
01
14
13
00
00
00
37
5
26Wuhan
U14
36
11
03
00
00
00
00
00
00
311
27To
ngjiU
144
40
20
40
00
00
00
00
00
04
10
28Sh
ahid
Bahonar
UKerman
141
10
12
30
02
11
01
10
00
36
5
29NationalC
heng
KungU
142
23
20
20
11
01
00
00
00
14
9
30VictoriaUWellin
gton
134
30
22
20
00
00
00
00
00
02
11
Abb
reviations
areavailablein
theprevious
tables.N
otethateach
year
indicatesthenu
mberof
paperspu
blishedthatyear
123

Twenty years of Soft Computing: a bibliometric overview 1483
Table 4 The most productive countries in SC
R Country TP TC H C/P Pop TP/Pop TC/Pop ≥ 100 ≥ 50 ≥ 20
1 China 546 2893 23 5.30 1371220 0.40 2.11 1 2 26
2 Spain 230 2793 23 12.14 46418.269 4.95 60.17 4 6 20
3 USA 197 1676 18 8.51 321418.82 0.61 5.21 2 5 14
4 UK 178 1587 16 8.92 65138.232 2.73 24.36 3 0 9
5 Iran 140 1177 17 8.41 79109.272 1.77 14.88 1 3 10
6 India 132 670 13 5.08 1311050.527 0.10 0.51 0 0 7
7 Taiwan 128 698 13 5.45 23113.99 5.54 30.20 0 1 5
8 Italy 127 972 14 7.65 60802.085 2.09 15.99 0 3 7
9 Czech Republic 107 724 13 6.77 10551.219 10.14 68.62 1 1 6
10 Japan 94 568 11 6.04 126958.472 0.74 4.47 0 0 8
11 Canada 77 421 11 5.47 35851.774 2.15 11.74 0 1 2
12 Germany 56 865 10 15.45 81413.145 0.69 10.62 1 2 6
13 Slovakia 54 291 9 5.39 5424.05 9.96 53.65 0 0 5
14 Turkey 53 369 10 6.96 78665.83 0.67 4.69 0 0 7
15 Australia 53 362 9 6.83 23781.169 2.23 15.22 0 0 3
16 France 52 421 12 8.10 66808.385 0.78 6.30 0 1 2
17 Poland 52 265 10 5.10 37999.494 1.37 6.97 0 0 3
18 Romania 51 336 8 6.59 19832.389 2.57 16.94 0 2 1
19 South Korea 49 183 7 3.73 50617.045 0.97 3.62 0 0 1
20 Greece 37 197 7 5.32 10823.732 3.42 18.20 0 0 2
21 Malaysia 32 256 6 8.00 30331.007 1.06 8.44 1 0 1
22 Austria 30 187 6 6.23 8611.088 3.48 21.72 0 0 6
23 Finland 29 725 12 25.00 5482.013 5.29 132.25 1 2 4
24 Singapore 29 273 7 9.41 5535.002 5.24 49.32 0 2 3
25 Mexico 26 176 6 6.77 127017.224 0.20 1.39 0 1 1
26 Belgium 25 502 8 20.08 11285.721 2.22 44.48 3 0 2
27 Saudi Arabia 21 41 3 1.95 31540.372 0.67 1.30 0 0 0
28 Portugal 19 105 6 5.53 10348.648 1.84 10.15 0 0 1
29 Brazil 17 226 5 13.29 207847.528 0.08 1.09 1 0 0
30 New Zealand 17 37 3 2.18 4595.7 3.70 8.05 0 0 0
31 Egypt 16 79 4 4.94 91508.084 0.17 0.86 0 0 1
32 Netherlands 16 54 5 3.38 16936.52 0.94 3.19 0 0 0
33 Argentina 13 196 3 15.08 43416.755 0.30 4.51 1 0 0
34 Sweden 10 79 4 7.90 9798.871 1.02 8.06 0 0 1
35 Tunisia 10 50 4 5.00 10982.754 0.91 4.55 0 0 0
36 Pakistan 9 186 3 20.67 188924.874 0.05 0.98 1 0 1
37 Hungary 9 165 3 18.33 9844.686 0.91 16.76 0 0 3
38 Switzerland 8 16 3 2.00 8286.976 0.97 1.93 0 0 0
39 Serbia 7 19 3 2.71 7098.247 0.99 2.68 0 0 0
40 South Africa 6 15 2 2.50 54956.92 0.11 0.27 0 0 0
41 Cyprus 5 64 4 12.80 1141.166 4.38 56.08 0 0 1
42 Jordan 5 27 3 5.40 7594.547 0.66 3.56 0 0 0
43 Ireland 5 19 3 3.80 4757.976 1.05 3.99 0 0 0
44 Cuba 5 17 2 3.40 11389.562 0.44 1.49 0 0 0
45 Slovenia 4 335 4 83.75 2063.768 1.94 162.32 1 1 0
46 Latvia 4 34 3 8.50 1978.44 2.02 17.19 0 0 1
47 Norway 4 15 2 3.75 5195.921 0.77 2.89 0 0 0
123
1484 J. Merigó et al.
Table 4 continued
R Country TP TC H C/P Pop TP/Pop TC/Pop ≥ 100 ≥ 50 ≥ 20
48 Algeria 4 15 2 3.75 39666.519 0.10 0.38 0 0 0
49 Thailand 4 12 2 3.00 67959.359 0.06 0.18 0 0 0
50 Iraq 4 4 1 1.00 36423.395 0.11 0.11 0 0 0
Abbreviations are in Tables 1 and 2 except for: Pop= Population in thousands; TP/Pop, TC/Pop = Total publications and citations per millioninhabitants
result. Additionally, the results are also shown in periods of5 years.
During the first years of the journal, the USA and Italywere the most productive countries in the journal. However,since 2006, China has become the most productive countryand today publishes about three times more than the sec-ond most productive country. From a general point of view,developing countries have been increasing their productivityin the journal although they still need to improve more in thefuture.
3.2 Publication and citation structure of SC
SC started publishing papers in 1997, and since then, it hasgrown significantly. Figure 1 shows the annual evolution ofthe number of papers published in the journal.
At the beginning, the journal was publishing about twentyto thirty papers. Since then, it started growing significantlysurpassing the one hundred citation threshold in 2006. In2015, SC published 261 documents and in 2016, 341.
Next, let us look into the general citation structure of thejournal classified by years. Table 6 presents the results con-sidering several citation thresholds and the impact factor.
Currently, there is a significant dispersion between thetime the most cited papers were published. Note that paperspublished during the last 5 years still need more time togrow their number of citations. Observe that about 1.3% ofthe papers receive more than fifty citations, 5.8% more thantwenty, and 61% receive at least one citation.
Focusing on the impact factor of the journal, SC is grow-ing significantly the impact factor through time. Currently,SC obtains a remarkable result of 2.47 being on the secondquartile of the journal ranking of the Journal Citation Reports(2016 edition) of the Web of Science category of ComputerScience, Artificial Intelligence. The last column of Table 6shows how SC is getting better positions in the journal rank-ing of Computer Science and Artificial Intelligence, throughtime. Note that due to the recent expansion in the numberof journals indexed in the Web of Science Core Collectionthrough the Emerging Sources Citation Index, SC has verygood chances to improve its ranking becoming a quartile 1journal in the near future.
Another interesting issue to consider is those variablesthat cite more the journal. For doing so, Table 7 shows thejournals, authors, universities and countries that have citedmore SC. Note that the table considers the citing articles.Nevertheless, inside each article there may be one or morecitations to the journal.
The self-citations of SC are the most remarkable onewhich is very common in most of the journals. InformationSciences, Applied Soft Computing and Fuzzy Sets and Sys-tems show a strong connection with SC. Francisco Herrerais the most significant author, and the University of Granadais the institution that cites more the journal. Spain reachesthe second place, which is very remarkable considering hissize. The first position goes to China that strongly leads theranking showing the strong influence SC is having in Asia.
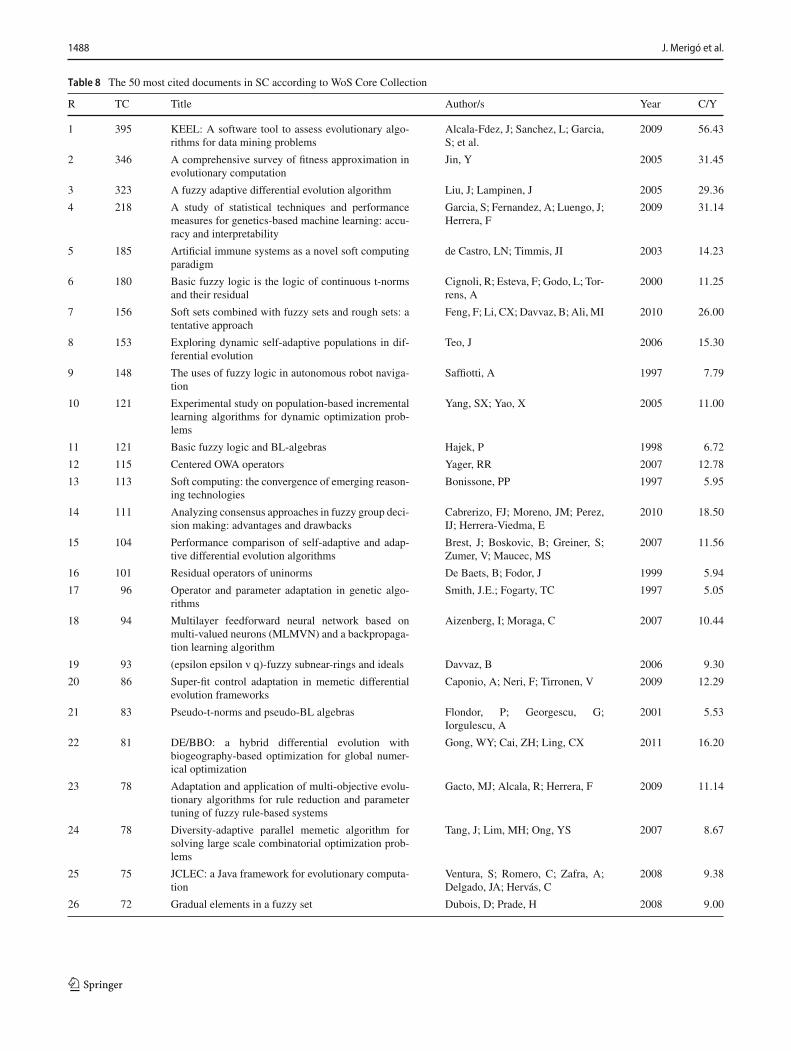
In order to identifymore specifically themost cited papersof the journal until now, Table 8 presents a list with the fiftymost cited. Note that these results are up to the beginningof 2017 when all the publications of 2016 were available.However, these data are dynamic so the rankingsmay changein the future.
The most cited paper was published by Jesús Alcalá-Fernández, Luciano Sánchez, Salvador García and otherco-authors (Alcalá-Fernández et al. 2009). This work pre-sented software for assessing evolutionary algorithms fordata mining problems. Both the second and the third mostcited papers focus on evolutionary computation.
Another interesting issue to analyze is to identify thosepapers that are most cited in the documents published in thejournal. To assess this issue, let us use VOS viewer softwarein a co-citation analysis of documents. Table 9 presents theresults.
The most cited paper in the journal is the seminal paperof Lotfi A. Zadeh about fuzzy sets. Note that this paper isthe most cited paper in computer science of all the time andamong the fifty most cited papers of all the time of all sci-ences (Merigó et al. 2015a). Five books are among the tenmost cited documents in the journal and eleven in the top30. Note that the references of the table only include the firstauthor of each document. The total link strength indicates theconnections with other documents that have at least receivedtwenty citations in the journal.
123

Twenty years of Soft Computing: a bibliometric overview 1485
Table5
Tempo
ralevolutio
nof
thepu
blications
classifie
dby
coun
tries
RCountry
TP
2016
2015
2014
2013
2012
2011
2010
2009
2008
2007
2006
2005
2004
2003
2002
Pre2002
Q1
Q2
Q3
Q4
1China
546
129
9660
5034
5022
2619
2421
33
51
33
33141
369
2Sp
ain
224
3016
1424
3130
2011
128
610
02
64
424
81115
3USA
197
1710
716
513
66
1812
1213
155
1626
2661
5555
4UK
178
2224
1027
820
310
24
86
47
716
1632
3991
5Iran
140
2525
1411
2014
55
104
50
11
00
07
3895
6India
132
3820
1510
510
73
44
63
13
12
214
2888
7Taiwan
128
1415
149
128
57
710
93
30
39
918
3764
8Italy
127
97
76
77
73
63
714
43
631
3134
2636
9Czech
Republic
107
97
148
87
33
32
55
611
412
1231
1846
10Japan
947
23
32
69
66
125
54
58
1111
2739
17
11Canada
7712
68
62
50
27
55
63
25
33
2119
34
12Slovakia
686
23
23
46
26
38
12
51
1414
1721
16
13Germany
563
31
72
10
12
75
72
26
77
2211
16
14Turkey
5310
95
44
34
53
13
10
10
00
516
32
15Australia
538
12
24
82
32
73
12
32
33
1122
17
16Po
land
5210
96
40
13
27
12
01
13
22
714
29
17France
523
14
17
22
15
48
06
41
33
1914
16
18Rom
ania
517
16
06
62
21
30
43
30
77
1014
20
19So
uthKorea
498
98
18
02
33
40
00
12
00
312
34
20Greece
371
21
25
11
21
01
102
12
55
165
11
21Malaysia
329
91
10
30
11
15
01
00
00
66
20
22Austria
302
32
32
40
00
20
13
22
44
86
12
23Finland
290
12
32
43
13
00
33
03
11
911
8
24Singapore
294
41
31
11
11
33
00
13
22
77
13
25Mexico
265
53
22
21
00
12
10
00
22
34
17
26Belgium
241
02
20
14
01
31
21
20
44
69
5
27Sa
udiA
rabia
219
62
30
10
00
00
00
00
00
01
20
28Po
rtugal
192
22
12
30
01
20
40
00
00
46
9
29Brazil
170
41
30
50
10
02
00
10
00
36
8
30Egypt
164
40
20
02
21
00
10
00
00
15
10
Abb
reviations
areavailablein
theprevious
tables
123

1486 J. Merigó et al.
Fig. 1 Annual number ofpublications in SC
0
50
100
150
200
250
300
350
400
Table 6 Annual citationstructure of SC
Year TP TC H ≥ 100 ≥ 50 ≥ 20 ≥ 10 ≥ 5 ≥ 1 IF IF (%)
1997 21 598 10 2 1 4 3 3 8 – –
1998 20 314 8 1 0 3 3 4 6 – –
1999 32 388 11 1 0 3 8 3 9 – –
2000 34 386 9 1 0 2 5 3 11 – –
2001 62 373 10 0 1 1 7 12 16 – –
2002 64 757 17 0 3 9 12 8 20 – –
2003 68 697 13 1 1 5 10 14 20 – –
2004 62 525 13 0 2 6 7 15 20 0.33 16.67
2005 91 1587 18 3 0 14 11 15 26 0.53 26.46
2006 128 1533 20 1 6 12 20 27 37 0.51 22.10
2007 115 1401 19 2 4 11 19 21 34 0.60 31.90
2008 117 1261 20 0 2 15 27 18 35 0.98 37.76
2009 98 1860 20 2 4 13 27 14 21 1.32 54.17
2010 111 1245 18 2 2 11 15 29 35 1.51 57.59
2011 188 1669 20 0 4 16 31 34 59 1.88 74.84
2012 161 976 15 0 1 5 20 35 62 1.12 41.57
2013 171 869 13 0 0 5 16 31 79 1.30 47.15
2014 186 522 10 0 0 0 7 20 82 1.27 45.59
2015 261 381 8 0 0 1 3 11 62 1.63 56.29
2016 341 181 4 0 0 1 0 1 28 2.47 67.41
Total 2331 17523 48 16 31 137 251 318 670 – –
% 100 – – 0.69 1.33 5.88 10.77 13.64 28.74 – –
Abbreviations are available in Tables 1 and 2 except for IF = Impact factor of the Journal Citation Reports2016; IF% = Percentile ranking in the WoS category (Computer Science, Artificial Intelligence) accordingto the IF (the results are between 0 and 100, being 0 the last position in the ranking and 100 the first position)
4 Graphical analysis of SC with VOS viewersoftware
VOS viewer software collects the bibliographic material pro-viding general maps by using several bibliometric indicatorsincluding bibliographic coupling, co-citation, co-authorship,citation analysis and co-occurrence of keywords (Van Eck
and Waltman 2010). In order to provide a different perspec-tive from the results of the previous section, this chapterdevelops a graphical visualization of the publications of SC.By doing so, the reader obtains amore general representationof the results being able to see the results from two differentpoints of view.
123

Twenty years of Soft Computing: a bibliometric overview 1487
Table7
Citing
artic
lesof
SC
RJournaln
ame
TP
Author
TP
University
TP
Country
TP
1So
ftCom
putin
g699
Herrera,F
129
UGranada
300
China
2409
2Inform
ationSciences
443
Davvaz,B
81IslamicAzadU
182
Spain
925
3AppliedSo
ftCom
putin
g307
Zhan,
JM75
UJaen
137
Iran
660
4Fu
zzySetsandSy
st266
Pedrycz,W
52KingAbdulazizU
104
USA
549
5JIntelligent
FuzzySy
st232
Herrera-Viedm
a,E
43Chinese
AcadSci
104
UK
485
6ExpertS
ystw
ithApplications
227
Chen,
XH
42Nanyang
TechUSingapore
90India
459
7Neurocomputin
g154
Mesiar,R
38PalackyUOlomouc
87Taiwan
381
8KnowledgeBased
Syst
150
Jun,
YB
37CNRS—
France
85Italy
327
9IEEETrans
FuzzySy
st125
Dvurecenskij,A
37Cordoba
U84
Czech
Rep
274
10NeuralC
omputin
gApplications
115
Ventura,S
35UYazd
82Turkey
257
11MathematicalProblemsin
Engin
102
Merigo,
JM35
Indian
InstTech
80Canada
223
12IEEETrans
Evolutio
nary
Com
put
92Garcia,S
33CentralSo
uthU
80France
214
13IntJ
ApproximateReasoning
90Fernandez,A
33Slovak
AcadSci
79Australia
201
14IntJ
Com
putatio
nalIntellS
yst
78DeBaets,B
31XidianU
69S.
Korea
183
15IntJ
UncertF
uzzKnowlB
ased
Syst
66Yang,
SX30
HuazhongUScienceTech
67Po
land
166
16IranianJFu
zzySy
st63
Xu,
ZS
27Sh
ahid
Bahonar
UKerman
66Malaysia
161
17IntJ
Intelligent
Syst
63DelJesus,MJ
27Po
lishAcadSciences
65Japan
161
18Eur
JOperatio
nalR
esearch
62Chajda,I
26NortheasternUChina
64S.
Arabia
153
19Eng
ineering
App
licArtificialIntell
61Bustin
ce,H
26Ghent
U63
Rom
ania
148
20Com
putersMathematicsApplic
58Sh
abir,M
25TsinghuaU
62Slovakia
144
21JMultip
leValuedLogicSo
ftCom
p55
Saeid,
AB
24To
ngjiU
61Germany
139
22ScientificWorld
J54
Cordon,
O24
AmirkabirUTechnology
61Singapore
125
23App
liedMathematicsCom
putatio
n48
Yin,Y
Q23
Slovak
UTech
Bratislava
60Greece
105
24IEEETrans
Cybernetics
41Wang,
JQ23
UTehran
59Pakistan
104
25Sw
arm
andEvolutio
nary
Com
put
41Su
ganthan,
PN23
HongKongPo
lytechnicU
59Mexico
101
26App
liedIntelligence
40Ma,XL
23Czech
AcadSc
iences
59Belgium
97
27Com
putersIndustrialEngineering
38Xu,
YJ
22UAlberta
58Brazil
93
28IntJ
Machine
LearningCybernetics
37Wang,
ST22
SichuanU
58Austria
74
29IntJ
FuzzySy
st36
Leoreanu-Fo
tea,V
22Eur
CtrSo
ftCom
p57
Finland
67
30IntJ
AdvancedManufacturing
Tech
36Jiao,L
C22
XiA
nJiaotong
U56
Portugal
54
Abb
reviations
areavailablein
Table1
123
1488 J. Merigó et al.
Table 8 The 50 most cited documents in SC according to WoS Core Collection
R TC Title Author/s Year C/Y
1 395 KEEL: A software tool to assess evolutionary algo-rithms for data mining problems
Alcala-Fdez, J; Sanchez, L; Garcia,S; et al.
2009 56.43
2 346 A comprehensive survey of fitness approximation inevolutionary computation
Jin, Y 2005 31.45
3 323 A fuzzy adaptive differential evolution algorithm Liu, J; Lampinen, J 2005 29.36
4 218 A study of statistical techniques and performancemeasures for genetics-based machine learning: accu-racy and interpretability
Garcia, S; Fernandez, A; Luengo, J;Herrera, F
2009 31.14
5 185 Artificial immune systems as a novel soft computingparadigm
de Castro, LN; Timmis, JI 2003 14.23
6 180 Basic fuzzy logic is the logic of continuous t-normsand their residual
Cignoli, R; Esteva, F; Godo, L; Tor-rens, A
2000 11.25
7 156 Soft sets combined with fuzzy sets and rough sets: atentative approach
Feng, F; Li, CX; Davvaz, B; Ali, MI 2010 26.00
8 153 Exploring dynamic self-adaptive populations in dif-ferential evolution
Teo, J 2006 15.30
9 148 The uses of fuzzy logic in autonomous robot naviga-tion
Saffiotti, A 1997 7.79
10 121 Experimental study on population-based incrementallearning algorithms for dynamic optimization prob-lems
Yang, SX; Yao, X 2005 11.00
11 121 Basic fuzzy logic and BL-algebras Hajek, P 1998 6.72
12 115 Centered OWA operators Yager, RR 2007 12.78
13 113 Soft computing: the convergence of emerging reason-ing technologies
Bonissone, PP 1997 5.95
14 111 Analyzing consensus approaches in fuzzy group deci-sion making: advantages and drawbacks
Cabrerizo, FJ; Moreno, JM; Perez,IJ; Herrera-Viedma, E
2010 18.50
15 104 Performance comparison of self-adaptive and adap-tive differential evolution algorithms
Brest, J; Boskovic, B; Greiner, S;Zumer, V; Maucec, MS
2007 11.56
16 101 Residual operators of uninorms De Baets, B; Fodor, J 1999 5.94
17 96 Operator and parameter adaptation in genetic algo-rithms
Smith, J.E.; Fogarty, TC 1997 5.05
18 94 Multilayer feedforward neural network based onmulti-valued neurons (MLMVN) and a backpropaga-tion learning algorithm
Aizenberg, I; Moraga, C 2007 10.44
19 93 (epsilon epsilon v q)-fuzzy subnear-rings and ideals Davvaz, B 2006 9.30
20 86 Super-fit control adaptation in memetic differentialevolution frameworks
Caponio, A; Neri, F; Tirronen, V 2009 12.29
21 83 Pseudo-t-norms and pseudo-BL algebras Flondor, P; Georgescu, G;Iorgulescu, A
2001 5.53
22 81 DE/BBO: a hybrid differential evolution withbiogeography-based optimization for global numer-ical optimization
Gong, WY; Cai, ZH; Ling, CX 2011 16.20
23 78 Adaptation and application of multi-objective evolu-tionary algorithms for rule reduction and parametertuning of fuzzy rule-based systems
Gacto, MJ; Alcala, R; Herrera, F 2009 11.14
24 78 Diversity-adaptive parallel memetic algorithm forsolving large scale combinatorial optimization prob-lems
Tang, J; Lim, MH; Ong, YS 2007 8.67
25 75 JCLEC: a Java framework for evolutionary computa-tion
Ventura, S; Romero, C; Zafra, A;Delgado, JA; Hervás, C
2008 9.38
26 72 Gradual elements in a fuzzy set Dubois, D; Prade, H 2008 9.00
123
Twenty years of Soft Computing: a bibliometric overview 1489
Table 8 continued
R TC Title Author/s Year C/Y
27 69 Evolutionary rule-based systems for imbalanced datasets
Orriols-Puig, A; Bernado-Mansilla,E
2009 9.86
28 69 Some types of filters in BL algebras Haveshki, M; Saeid, AB; Eslami, E 2006 6.90
29 68 Optimization in dynamic environments: a survey onproblems, methods and measures
Cruz, C; Gonzalez, JR; Pelta, DA 2011 13.60
30 66 Memetic algorithm using multi-surrogates for com-putationally expensive optimization problems
Zhou, ZZ; Ong, YS; Lim,MH; Lee,BS
2007 7.33
31 64 Bosbach states on fuzzy structures Georgescu, G 2004 5.33
32 60 Fuzzy relation equations (I): the general and special-ized solving algorithms
Chen, L; Wang, PP 2002 4.29
33 60 Dynamic ensemble extreme learning machine basedon sample entropy
Zhai, JH; Xu, HY; Wang, XZ 2012 15.00
34 57 Self-adaptive differential evolution algorithm usingpopulation size reduction and three strategies
Brest, J; Maucec, MS 2011 11.40
35 57 Scale factor inheritance mechanism in distributed dif-ferential evolution
Weber, M; Tirronen, V; Neri, F 2010 9.50
36 57 Context adaptation of fuzzy systems through a multi-objective evolutionary approach based on a novelinterpretability index
Botta, A; Lazzerini, B; Marcelloni,F; Stefanescu, DC
2009 8.14
37 56 A Pareto-based multi-objective evolutionaryapproach to the identification of Mamdani fuzzysystems
Cococcioni, M; Ducange, P;Lazzerini, B; Marcelloni, F
2007 6.22
38 55 A communication model based on the 2-tuple fuzzylinguistic representation for a distributed intelligentagent system on internet
Delgado, M; Herrera, F; Herrera-Viedma, F; Martín-Bautista, MJ;Martinez, L; Vila, MA.
2002 3.93
39 54 Optimization of interval type-2 fuzzy logic controllersusing evolutionary algorithms
Castillo, O; Melin, P; Alanis, A;Montiel, O; Sepulveda, R
2011 10.80
40 53 A GA-based fuzzy mining approach to achieve atrade-off between number of rules and suitability ofmembership functions
Hong, TP; Chen, CH;Wu, YL; Lee,YC
2006 5.30
41 53 Artificial neural networks and genetic algorithm forbearing fault detection
Samanta, B; Al-Balushi, KR; Al-Araimi, SA
2006 5.30
42 52 Hybrid learning models to get the interpretability-accuracy trade-off in fuzzy modeling
Alcala, R; Alcala-Fdez, J; Casillas,J; Cordón, O; Herrera, F
2006 5.20
43 52 Edge detection using ant algorithms Nezamabadi-pour, H; Saryazdi, S;Rashedi, E
2006 5.20
44 52 Observations on non-commutative fuzzy logic Hajek, P 2003 4.00
45 52 An algorithmic description of XCS Butz,M.V.; Wilson SW 2002 3.71
46 50 Multi-objective self-adaptive differential evolutionwith elitist archive and crowding entropy-based diver-sity measure
Wang, YN; Wu, LH; Yuan, XF 2010 8.33
47 50 Uncertain probabilities II: the continuous case Buckley, JJ; Eslami, E 2004 4.17
48 48 Self-adaptive differential evolution with multi-trajectory search for large-scale optimization
Zhao, SZ; Suganthan, PN; Das, S 2011 9.60
49 48 Tabu search for attribute reduction in rough set theory Hedar, AR;Wang, J; Fukushima, M 2008 6.00
50 48 Faster convergence by means of fitness estimation Branke, J; Schmidt, C 2005 4.36
Abbreviations are available in Table 1 except for: C/Y = Citations per year
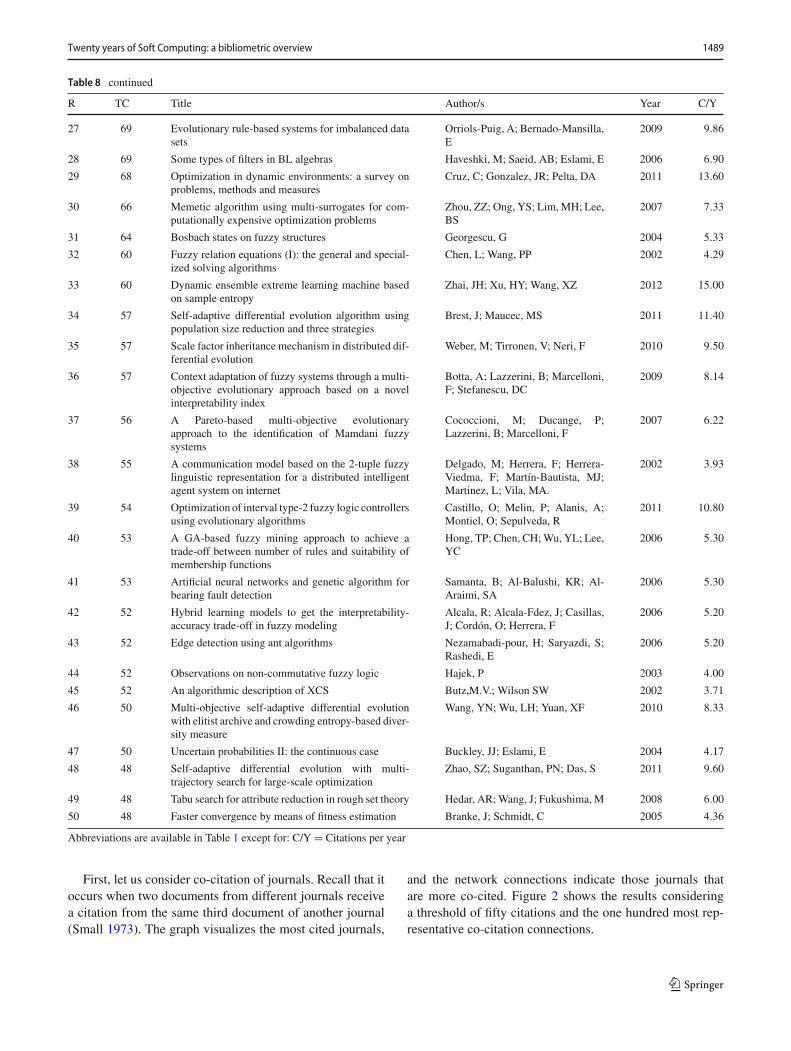
First, let us consider co-citation of journals. Recall that itoccurs when two documents from different journals receivea citation from the same third document of another journal(Small 1973). The graph visualizes the most cited journals,
and the network connections indicate those journals thatare more co-cited. Figure 2 shows the results consideringa threshold of fifty citations and the one hundred most rep-resentative co-citation connections.
123

1490 J. Merigó et al.
Table 9 Most cited documents in SC publications
R Year Cited reference Type Citations TLS
1 1965 Zadeh LA, Inform Control, vol 8, p 338 A 203 137
2 1989 Goldberg DE, Genetic Algorithms B 124 90
3 1995 Kennedy J, IEEE Int Conf Neural Networks Proc, vols 1-6, p 1942 C 98 81
4 2002 Deb K, IEEE T Evolut Comput, vol 6, p 182 A 92 74
5 1997 Storn R, J Global Optim, vol 11, p 341 A 82 73
6 1975 Zadeh LA, Inform Sciences, vol 8, p 199 A 78 65
7 1981 Bezdek JC, Pattern Recognition B 62 37
8 1998 Hajek P, Metamathematics of Fuzzy Logic B 55 40
9 1975 Holland JH, Adaptation in Natural and Artificial Systems B 55 45
10 2001 Deb K, Multiobjective Optimization B 52 50
11 2000 Dvurecenskij A, New Trends in Quantum Structures B 50 43
12 1992 Koza JR, Genetic Programming B 45 24
13 2009 Garcia S, J Heuristics, vol 15, p 617 A 44 41
14 1999 Zitzler E, IEEE T Evolut Comput, vol 3, p 257 A 41 38
15 1993 Quinlan JR, C4.5: Programs for Machine Learning B 39 28
16 2006 Demsar J, J Mach Learn Res, vol 7, p 1 A 38 34
17 1985 Takagi T, IEEE T Syst Man Cyb, vol 15, p 116 A 38 28
18 1998 Vapnik VN, Statistical Learning Theory B 38 17
19 1986 Atanassov KT, Fuzzy Set Syst, vol 20, p 87 A 37 32
20 1982 Pawlak Z, Int J Comput Inf Sci, vol 11, p 341 A 37 23
21 1999 Yao X, IEEE T Evolut Comput, vol 3, p 82 A 37 35
22 2009 Qin AK, IEEE T Evolut Comput, vol 13, p 398 A 36 36
23 2000 Cignoli R, Algebraic Foundations of Many-Valued Reasoning B 34 29
24 2006 Brest J, IEEE T Evolut Comput, vol 10, p 646 A 33 32
25 2009 Garcia S, Soft Comput, vol 13, p 959 A 33 31
26 2001 Georgescu G, Multiple Valued Logic, vol 6, p 95 A 33 33
27 1997 Wolpert DH, IEEE T Evolut Comput, vol 1, p 67 A 33 32
28 1988 Yager RR, IEEE T Syst Man Cyb, vol 18, p 183 A 33 17
29 2007 Zhang QF, IEEE T Evolut Comput, vol 11, p 712 A 32 30
30 1995 Vapnik VN, The Nature of Statistical Learning Theory B 31 18
Abbreviations: A = Article; B = Book; C = Conference proceedings; TLS = Total Link Strength
Fig. 2 Co-citation of journals cited in SC
123
Twenty years of Soft Computing: a bibliometric overview 1491
Fig. 3 Bibliographic coupling of authors that publish in SC
Fig. 4 Bibliographic coupling of institutions that publish in SC
123

1492 J. Merigó et al.
Fig. 5 Citation analysis of institutions publishing in SC
Fuzzy Sets and Systems is the most cited journal in SCfollowed by Information Sciences and SC itself. The journalsthat form the core strongly connect to the field of computerscience with a strong focus on the emerging theories of softcomputing and related issues. It is also worth noting that theLecture Notes in Computer Science has a strong influence inthe journal.
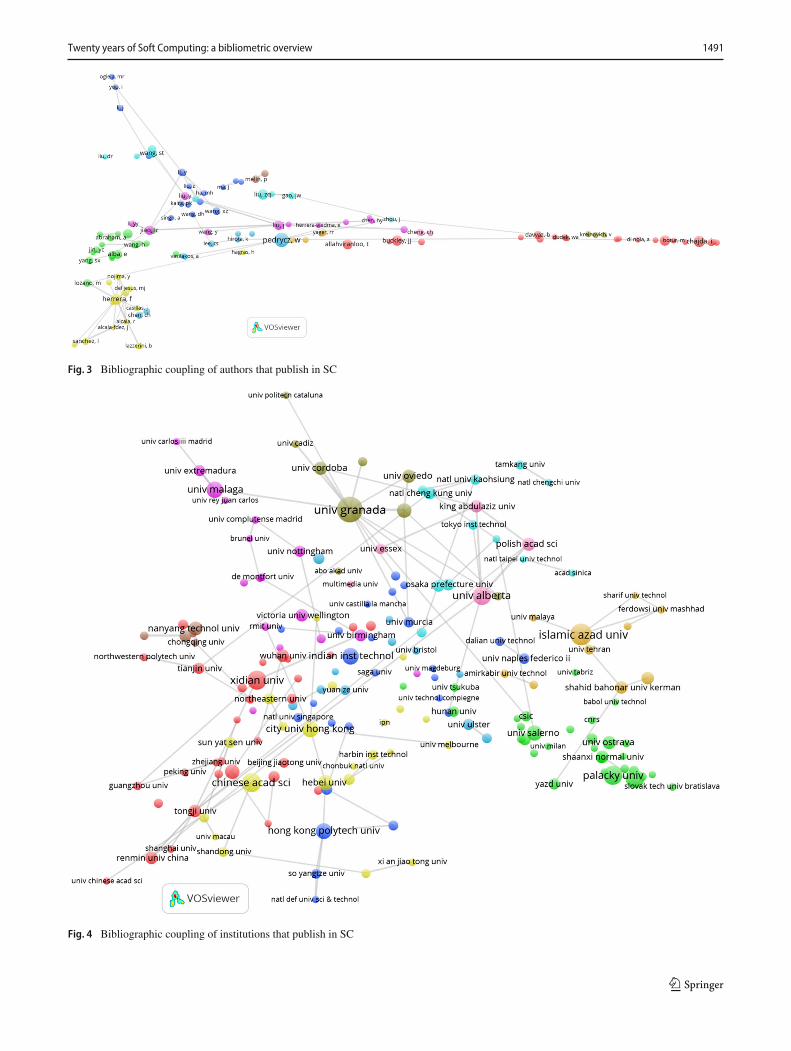
Next, let us analyze bibliographic coupling of authorsthat publish in SC. Bibliographic coupling (Kessler 1963)of authors analyzes the authors of two documents that citethe same third document. Thus, in the map appears the nameof the authors of these documents. Particularly, the graphpresents the most productive authors when dealing with allthe set of documents. In addition, the network connectionsshow those authors that cite the same bibliographic materialwith the aim of identifying authors with similar research pro-files. Figure 3 visualizes the results considering a threshold offive documents published in the journal and the one hundredmost representative bibliographic coupling connections.
Witold Pedrycz and Francisco Herrera form the most rep-resentative cores. In general, the results are quite consistentwith the results of Table 1. The main advantage of Figure 3is that it visualizes those authors with similar profiles eitherbecause they work on similar topics or because they are co-authors.
Bibliographic coupling can also be studied from the insti-tutional perspective. Here, the difference is that the mapvisualizes the most productive institutions in terms of theinstitutional affiliation of the authors that publish in SC. Thenetwork connections represent the authors of institutions thatcite many times the same bibliographic references showingsimilar research profiles. Figure 4 shows the results with athreshold of five documents published in the journal and theone hundredmost significant bibliographic coupling connec-tions.
The University of Granada is the most productive insti-tution and represents one of the key cores of the journal.The results of this figure are in accordance with the resultsof Table 2 although in the figure the universities appearaccording to their research profile connections with otherinstitutions.
Another interesting issue to consider is how the insti-tutions cite each other. For doing so, the work develops acitation analysis of institutions that publish in SC. Note thatthe size of the circles shows the most productive institutionsas in Fig. 4. However, the network connections visualize theinstitutions that cite each other significantly. Observe that thenetwork connections sum the citations from institution A toinstitution B and the citations from institution B to institutionA. Figure 5 presents the results visualizing those institutions
123
Twenty years of Soft Computing: a bibliometric overview 1493
Fig. 6 Co-authorship of institutions that publish in SC
with at least five documents published in SC and the onehundred most representative citation links.
The University of Granada obtains the most remarkableresults due to its strong productivity that generates manyoutgoing and incoming citations. It is worth noting that itis very common that universities from the same country orregion tend to connect strongly. Note that some authors thatwork at an institution are foreigners making the institutionsto connect with other unexpected institutions. A representa-tive example is the case of Witold Pedrycz that works at the
University ofAlberta but has strong connectionswith the Pol-ish Academy of Sciences. Therefore, both institutions appearstrongly connected in the figure.
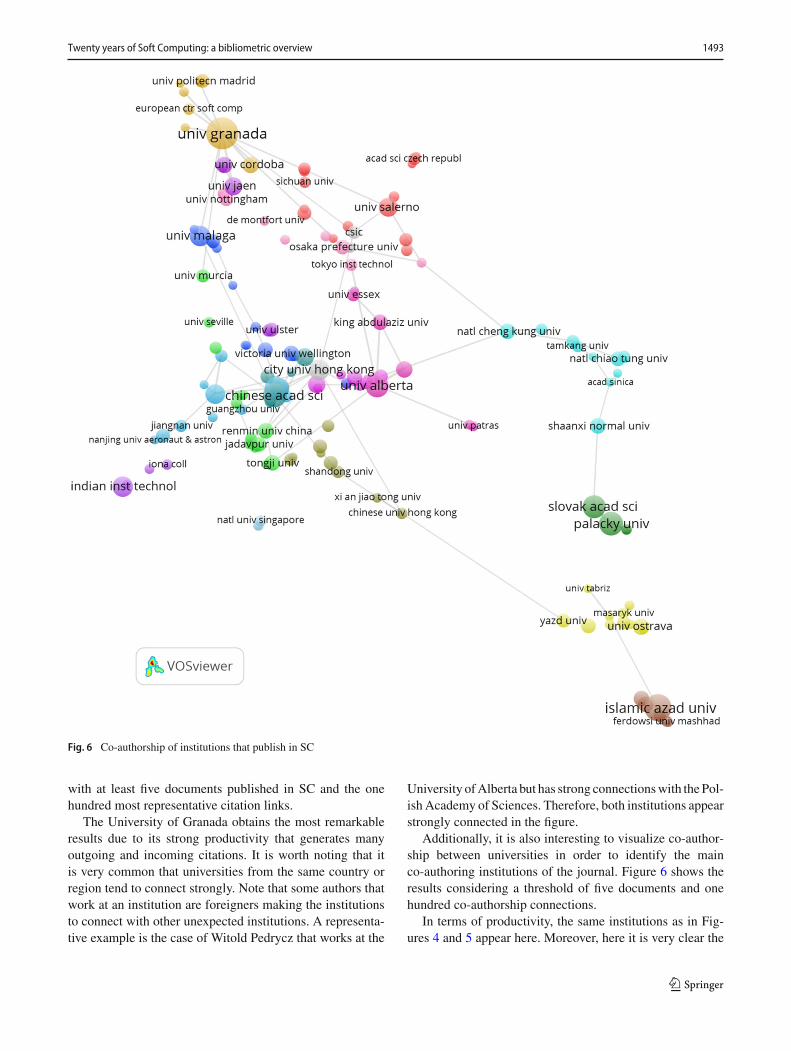
Additionally, it is also interesting to visualize co-author-ship between universities in order to identify the mainco-authoring institutions of the journal. Figure 6 shows theresults considering a threshold of five documents and onehundred co-authorship connections.
In terms of productivity, the same institutions as in Fig-ures 4 and 5 appear here. Moreover, here it is very clear the
123
1494 J. Merigó et al.
Fig. 7 Bibliographic coupling of countries that publish in SC
local co-authoring connections where institutions from thesame country or region tend to collaborate more than withinstitutions from other countries. Figure 6 strongly visualizesthis for the case of Spain and China.
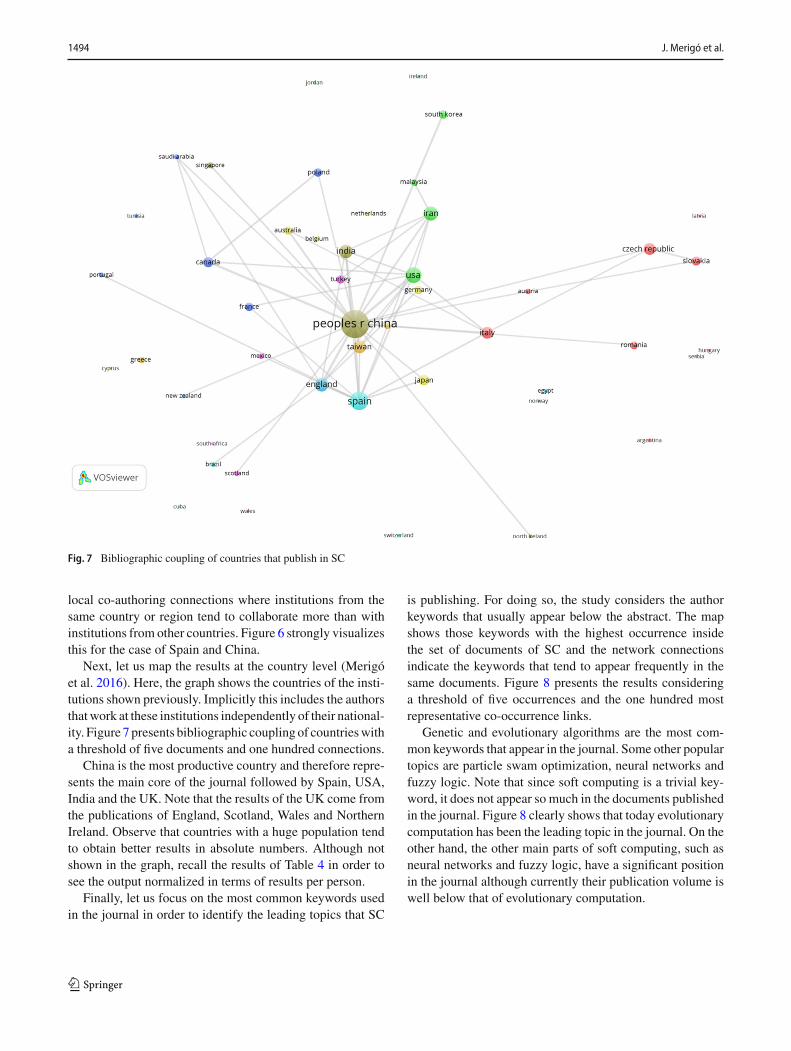
Next, let us map the results at the country level (Merigóet al. 2016). Here, the graph shows the countries of the insti-tutions shown previously. Implicitly this includes the authorsthatwork at these institutions independently of their national-ity. Figure 7 presents bibliographic coupling of countrieswitha threshold of five documents and one hundred connections.
China is the most productive country and therefore repre-sents the main core of the journal followed by Spain, USA,India and the UK. Note that the results of the UK come fromthe publications of England, Scotland, Wales and NorthernIreland. Observe that countries with a huge population tendto obtain better results in absolute numbers. Although notshown in the graph, recall the results of Table 4 in order tosee the output normalized in terms of results per person.
Finally, let us focus on the most common keywords usedin the journal in order to identify the leading topics that SC
is publishing. For doing so, the study considers the authorkeywords that usually appear below the abstract. The mapshows those keywords with the highest occurrence insidethe set of documents of SC and the network connectionsindicate the keywords that tend to appear frequently in thesame documents. Figure 8 presents the results consideringa threshold of five occurrences and the one hundred mostrepresentative co-occurrence links.
Genetic and evolutionary algorithms are the most com-mon keywords that appear in the journal. Some other populartopics are particle swam optimization, neural networks andfuzzy logic. Note that since soft computing is a trivial key-word, it does not appear so much in the documents publishedin the journal. Figure 8 clearly shows that today evolutionarycomputation has been the leading topic in the journal. On theother hand, the other main parts of soft computing, such asneural networks and fuzzy logic, have a significant positionin the journal although currently their publication volume iswell below that of evolutionary computation.
123

Twenty years of Soft Computing: a bibliometric overview 1495
Fig. 8 Co-occurrence of author keywords of documents published in SC
5 Conclusions
Motivated by the twentieth anniversary of the journal, thisstudy presents a bibliometric overview of the publications ofthe journal between 1997 and 2016. The results show a strongincrease in the journal becoming a monthly journal since2005. Today, the journal publishes more than three hundreddocuments every year and is recognized as one of the leadingjournals in the field of computer science. The study usesseveral bibliometric indicators to identify the leading trendsoccurring in the journal.
The University of Granada (Spain) is the most influentialinstitution in the journal although China is the most produc-tive country. However, if the numbers are normalized percapita, then the Spanish institutions achieve a more remark-able result. In terms of authors, Witold Pedrycz is the mostproductive author in the journal, while Francisco Herrera isthe most influential one.
Mapping analysis is very useful to provide a general viewof the publication and citation structure of the documentspublished and cited in SC. This work uses VOS viewersoftware. The main reason for using two different perspec-tives is to see two different representations and compare theresults and their differences. The VOS viewer software pro-
vides a deeper visualization of the publication and citationstructure of the key variables of the journal. The networkconnections showwhich authors, journals and/or institutionsconnect between them in terms of bibliographic coupling andco-citation. It is worth noting that soft computing includesthree huge fields: evolutionary computation, neural networktheory and fuzzy systems. Currently, the journal seems topublish more on topics focused on evolutionary computationrather than the other two areas. However, this may changein the future depending on the importance that each subareamay achieve under the scope of the journal.
Future research could expand the analysis consideringadditional bibliometric issues in the study including a deepertemporal evolution of the publications and more results withother graphical software such as Science Mapping AnalysisTool (SciMAT) (Cobo et al. 2011a, b, 2012). Note that otherjournals shall be considered in order to provide a better viewof the publications in this field of study and also other topics.
Acknowledgements We would like to thank Vincenzo Loia and theanonymous reviewers for valuable comments that have improved thequality of the paper. Support from the Chilean Government through theFondecyt Regular program (Project Number 1160286) and the FEDERfunds under grant TIN2016-75850-R are gratefully acknowledged.
123

1496 J. Merigó et al.
Compliance with ethical standards
Conflict of interest The authors declare that they do not have any con-flict of interest.
Ethical approval This article does not contain any studies with humanparticipants performed by any of the authors.
References
Alcalá-Fernández J, Sánchez L, García S, del Jesús MJ, Ventura S,Garrell JM, Otero J, Romero C, Bacardit J, Rivas VM, FernándezJC, Herrera F (2009) KEEL: a software tool to assess evolutionaryalgorithms for data mining problems. Soft Comput 13:307–318
Alonso S, Cabrerizo FJ, Herrera-Viedma E, Herrera F (2009) H-index:a review focused on its variants, computation, and standarizationfor different scientific fields. J. Informetr. 3:273–289
Amiguet L, Gil-Lafuente AM, Kydland FE, Merigó JM (2017) Onehundred and twenty-five years of the Journal of Political Econ-omy: a bibliometric overview. J Political Econ 125(6) http://www.journals.uchicago.edu/journals/jpe/125-5
Biemans W, Griffin A, Moenaert R (2007) Twenty years of the Jour-nal of Product Innovation Management: history, participants andknowledge stocks and flows. J Prod Innov Manag 24:193–213
Blanco-Mesa F, Merigó JM, Gil-Lafuente AM (2017) Fuzzy decisionmaking: a bibliometric-based review. J Intell Fuzzy Syst 32:2033–2050
BonillaC,Merigó JM,Torres-AbadC (2015)Economics inLatinAmer-ica: a bibliometric analysis. Scientometrics 105:1239–1252
Broadus RN (1987) Toward a definition of “bibliometrics”. Sciento-metrics 12:373–379
Cancino C, Merigó JM, Coronado F (2017a) A bibliometric analysis ofleading universities in innovation research. J Innov Knowl 2:106–124
Cancino C, Merigó JM, Coronado F, Dessouky Y, DessoukyM (2017b)Forty years of computers & industrial engineering: a bibliometricanalysis. Comput Ind Eng 113:614–629
Capuano N, Chiclana F, Fujita H, Herrera-Viedma E, Loia V (2018)Fuzzy group decision making with incomplete information guidedby social influence. IEEE Trans Fuzzy Syst. https://doi.org/10.1109/TFUZZ.2017.2744605
CoboMJ, López-Herrera AG, Herrera-Viedma E, Herrera F (2011a) Anapproach for detecting, quantifying and visualizing the evolutionof a research field: a practical application to the fuzzy sets theoryfield. J Informetr 5:146–166
Cobo MJ, Lopez-Herrera AG, Herrera-Viedma E, Herrera F (2011b)Science mapping software tools: review, analysis and cooperativestudy among tools. J Am Soc Inf Sci Technol 62:1382–1402
Cobo MJ, Lopez-Herrera AG, Herrera-Viedma E, Herrera F (2012)SciMAT: a new science mapping analysis software tool. J Am SocInf Sci Technol 63:1609–1630
Cobo MJ, Martínez MA, Gutiérrez-Salcedo M, Fujita H, Herrera-Viedma E (2015) 25 years at knowledge-based systems: a bib-liometric analysis. Knowl-Based Syst 80:3–13
Coupé T (2003) Revealed performances: worldwide rankings ofeconomists and economics departments, 1990–2000. J Eur EconAssoc 1:1309–1345
del Moral MJ, Chiclana F, Tapia JM, Herrera-Viedma E (2018) A com-parative study on consensus measures in group decision making.Int J Intell Syst. https://doi.org/10.1002/int.21954
Dhall R, Solanki VK (2017) An IoT based predictive connected carmaintenance approach. Int J Interact Multimed Artif Intell 4:16–22
EmrouznejadA,MarraM (2014)Orderedweighted averaging operators1988–2014. A citation based literature survey. Int J Intell Syst29:994–1014
García-MerinoMT, Pereira-do-CarmoML, Santos-ÁlvarezMV (2006)25 years of technovation: characterisation and evolution of thejournal. Technovation 26:1303–1316
Gutierrez-Salcedo M, Martinez MA, Moral-Muñoz JA, Herrera-Viedma E, Cobo MJ (2018) Some bibliometric procedures foranalyzing and evaluating research fields. Appl Intell. https://doi.org/10.1007/s10489-017-1105-y
He XR, Wu YY, Yu D, Merigó JM (2017) Exploring the orderedweighted averaging operator knowledge domain: a bibliometricanalysis. Int J Intell Syst 32:1151–1166
Heradio R, Pérez-Morago H, Fernández-Amorós D, Cabrerizo FJ,Herrera-Viedma E (2016) A bibliometric analysis of 20 years ofresearch on software product lines. Inf Softw Technol 72:1–15
Hirsch JE (2005)An index to quantify an individual’s scientific researchoutput. Proc Natl Acad Sci USA 102:16569–16572
Kessler MM (1963) Bibliographic coupling between scientific papers.Am Doc 14:10–25
Laengle S,Merigó JM,Miranda J, Slowinski R, Bomze I, Borgonovo E,Dyson RG, Oliveira JF, Teunter R (2017) Forty years of the Euro-pean Journal of Operational Research: a bibliometric overview.Eur J Oper Res 262:803–816
Liao HC, Xu ZS, Zeng XJ, Merigó JM (2015) Qualitative decisionmaking with correlation coefficients of hesitant fuzzy linguisticterm sets. Knowl-Based Syst 76:127–138
Liao HC, Tang M, Luo L, Li C, Chiclana F, Zeng XJ (2018a) A bib-liometric analysis and visualization of medical big data research.Sustainability 10:1–18
Liao HC, Xu ZS, Herrera-Viedma E, Herrera F (2018b) Hesitant fuzzylinguistic term set and its application in decision making: a state-of-the art survey. Int J Fuzzy Syst. https://doi.org/10.1007/s40815-017-0432-9
Linton JD (2004) Perspective: ranking business schools on the manage-ment of technology. J Prod Innov Manag 21:416–430
Liu W, Liao HC (2017) A bibliometric analysis of fuzzy decisionresearch during 1970–2015. Int J Fuzzy Syst 19:1–14
Martinez MA, Herrera M, Lopez-Gijon J, Herrera-Viedma E (2014)H-classics: characterizing the concept of citation classics throughH-index. Scientometrics 98:1971–1983
Martínez-López FJ, Merigó JM, Valenzuela L, Nicolás C (2018) Fiftyyears of the European Journal of Marketing: a bibliometric analy-sis. Eur J Mark 52:439–468
Merigó JM, Yang JB (2017) A bibliometric overview of operationsresearch & management science. Omega—International Journalof Management Science 73:37–48
Merigó JM, Gil-Lafuente AM, Yager RR (2015a) An overview of fuzzyresearch with bibliometric indicators. Appl Soft Comput 27:420–433
Merigó JM, Mas-Tur A, Roig-Tierno N, Ribeiro-Soriano D (2015b) Abibliometric overviewof the Journal ofBusinessResearch between1973 and 2014. J Bus Res 68:2645–2653
Merigó JM, Cancino C, Coronado F, Urbano D (2016) Aca-demic research in innovation: a country analysis. Scientometrics108:559–593
Merigó JM, Blanco-Mesa F, Gil-Lafuente AM, Yager RR (2017) Thirtyyears of the International Journal of Intelligent Systems: a biblio-metric review. Int J Intell Syst 32:526–554
Merigó JM, Pedrycz W, Weber R, de la Sotta C (2018) Fifty years ofInformation Sciences: a bibliometric overview. Inf Sci 432:245–268
Moral-Muñoz JA, Cobo MJ, Chiclana F, Collop A, Herrera-Viedma E(2016) Analyzing highly cited papers in intelligent transportationsystems. IEEE Trans Intell Transp Syst 17:993–1001
123
Twenty years of Soft Computing: a bibliometric overview 1497
Podsakoff PM, MacKenzie SB, Podsakoff NP, Bachrach DG (2008)Scholarly influence in the field of management: a bibliometricanalysis of the determinants of university and author impact inthe management literature in the past quarter century. J Manag34:641–720
Pritchard A (1969) Statistical bibliography or bibliometrics? J Doc25:348–349
Ramos-Rodríguez AR, Ruiz-Navarro J (2004) Changes in the intel-lectual structure of strategic management research: a bibliometricstudy of the Strategic Management Journal, 1980–2000. StrategManag J 25:981–1004
Schwert GW (1993) The Journal of Financial Economics: a retrospec-tive evaluation (1974–91). J Financ Econ 33:369–424
Settouti N, Bechar MEA, Chikh MA (2016) Statistical comparisons ofthe top 10 algorithms in data mining for classification task. Int JInteract Multimed Artif Intell 4:46–51
Small H (1973) Co-citation in the scientific literature: a newmeasure ofthe relationship between two documents. J AmSoc Inf Sci 24:265–269
Taibi A, Atmani B (2017) Combining fuzzyAHPwithGIS and decisionrules for industrial site selection. Int J InteractMultimedArtif Intell4:60–69
TangM, Liao HC, Su SF (2018) A bibliometric overview and visualiza-tion of the International Journal of Fuzzy Systems between 2007and 2017. Int J Fuzzy Syst (forthcoming)
ThongpapanlN (2012) The changing landscape of technology and inno-vation management: an updated ranking of journals in the field.Technovation 32:257–271
Valenzuela L, Merigó JM, Nicolás C, Jaramillo F, Johnston W (2017)Thirty years of the Journal of Business & Industrial Marketing: abibliometric analysis. J Bus Ind Mark 32:1–18
Van Eck NJ, Waltman L (2007) Bibliometric mapping of the compu-tational intelligence field. Int J Uncertain Fuzziness Knowl-BasedSyst 15:625–645
Van Eck NJ, Waltman L (2010) Software survey: VOSviewer, a com-puter program for bibliometric mapping. Scientometrics 84:523–538
Wang W, Laengle S, Merigó JM, Yu D, Herrera-Viedma E, CoboMJ, Bouchon-Meunier B (2018) A bibliometric analysis of thefirst twenty-five years of the International Journal of Uncertainty,Fuzziness and Knowledge-Based Systems. Int J Uncertain Fuzzi-ness Knowl-Based Syst 26:169–193
WeissMA, Qiu J (2008) “The Journal of Risk and Insurance”: a 75-yearhistorical perspective. J Risk Insur 75:253–274
Xu ZS, Liao HC (2015) A survey of approaches to decision makingwith intuitionistic fuzzy preference relations. Knowl-Based Syst80:131–142
Yu D (2015) A scientometrics review on aggregation operator research.Scientometrics 105:115–133
Yu D, Liao HC (2016) Visualization and quantitative research on intu-itionistic fuzzy studies. J Intell Fuzzy Syst 30:3653–3663
Yu D, Shi S (2015) Researching the development of Atanassov intu-itionistic fuzzy set: using a citation network analysis. Appl SoftComput 32:189–198
Yu D, Li DF, Merigó JM, Fang L (2016) Mapping development oflinguistic decision making studies. J Intell Fuzzy Syst 30:2727–2736
YuD,XuZS, PedryczW,WangWR (2017) Information Sciences 1968–2016: a retrospective analysis with text mining and bibliometric.Inf Sci 418–419:619–634
Zhang HJ, Dong Y, Herrera-Viedma E (2018) Consensus building forthe heterogeneous large-scale GDM with the individual concernsand satisfactions. IEEE Trans Fuzzy Syst. https://doi.org/10.1109/TFUZZ.2017.2697403
123