twenty years of ambient observations of nitrogen oxides ... · traffic emissions reduced by...
TRANSCRIPT

Twenty years of ambient observations of nitrogen oxides and specified hydrocarbons in air masses dominated by traffic emissions in Germany
Christian Ehlers, Dieter Klemp, Franz Rohrer, Djuro Mihelcic, Robert Wegener, Astrid Kiendler-Scharr and Andreas Wahner
Research Centre Jülich, Institute IEK-8:Troposphere, 52428 Jülich, Germany

Ambient observations
2016-04-12 C. Ehlers | Forschungszentrum Jülich, IEK-8 2
• NOx detection– in situ measurements– chemiluminescence
detector– mobile and fixed
stations
VOC detection• VOC and OVOC• detection range from
C2 to C13 (+ CO)• sensitivity: low ppt level

3
Urban background-concentrations
• Identification of localsources
• Estimation of possiblereductions

Düsseldorf,
RheinufertunnelUrban, 2010
Bonn,
Bad Godesberger TunnelEhlers, 2013
Example: tunnel-studies
2016-01-28 C. Ehlers | Forschungszentrum Jülich, IEK-8 4

05. 08. 2014 NOx-concentrationExample: Berlin, 2014
5[Submitted: Mobile BAERLIN2014: Sources and sinks - The influence of land surface types and horizontal heterogeneity on air pollutant levels in Berlin,B. Bonn, E. von Schneidemesser, D. Andrich, J. Quedenau, H. Gerwig, A. Lüdecke, J. Kura, A. Pietsch, C. Ehlers, D. Klemp, C. Kofahl, R. Nothard, A. Kerschbaumer, W. Junkermann, R. Grote, T. Pohl, K. Weber, B. Lode, P. Schönberger, G. Churkina, T.M. Butler, and M.G. Lawrence , acp-2016-57]

Beispiel: Berlin, 2014Airport Tegel: NOx-concentration
6

Measurement: CO (1 second resolution)
Modell: EURAD-IM, 1x1 km resolution
CO-concentration• Good agreement for „background-
concentration“• Peak-concentrations can not be
covered with 1x1 km resolution
7
Comparison with model-results

Ozone production - dependence of NOx and VOC
2016-04-12 C. Ehlers | Forschungszentrum Jülich, IEK-8 8
𝑅𝑅𝑉𝑉𝑉𝑉𝑉𝑉 = �𝑘𝑘𝑉𝑉𝑂𝑂+𝑉𝑉𝑉𝑉𝑉𝑉𝑖𝑖 × 𝑉𝑉𝑉𝑉𝑉𝑉𝑖𝑖
𝑅𝑅𝑵𝑵𝑵𝑵𝟐𝟐 = 𝑘𝑘𝑉𝑉𝑂𝑂+𝑵𝑵𝑵𝑵𝟐𝟐 × 𝑵𝑵𝑵𝑵𝟐𝟐
0
5
10
15
20
25
0.01 0.1 1 10 100
P(O
3) [p
pb/h
]
RNO2 [s-1]

2016-04-12 C. Ehlers | Forschungszentrum Jülich, IEK-8 9
𝑅𝑅𝑵𝑵𝑵𝑵𝟐𝟐 = 𝑘𝑘𝑉𝑉𝑂𝑂+𝑵𝑵𝑵𝑵𝟐𝟐 × 𝑵𝑵𝑵𝑵𝟐𝟐
𝑅𝑅𝑉𝑉𝑉𝑉𝑉𝑉 = �𝑘𝑘𝑉𝑉𝑂𝑂+𝑉𝑉𝑉𝑉𝑉𝑉𝑖𝑖 × 𝑉𝑉𝑉𝑉𝑉𝑉𝑖𝑖
Ozone production - dependence of NOx and VOC

10Figure: National Trend Tables for the German Atmospheric Emission Reporting, ANNEX 1: National sector emissions: Main pollutants, particulate matter, heavy metals and persistent organic pollutants, Excel spreadsheets DE_2015_Table_I_1990.xls - DE_2015_Table_I_2013.xls, ed. P. Gniffke, Umweltbundesamt Deutschland, Dessau, 27.04.2015
German emission inventory

German emission inventory
11
Current situation in urban areas:• Diesel cars are dominant source of NOx
• Petrol cars are dominant source of VOCFigure: National Trend Tables for the German Atmospheric Emission Reporting, ANNEX 1: National sector emissions: Main pollutants, particulate matter, heavy metals and persistent organic pollutants, Excel spreadsheets DE_2015_Table_I_1990.xls - DE_2015_Table_I_2013.xls, ed. P. Gniffke, Umweltbundesamt Deutschland, Dessau, 27.04.2015

Trend in observations
2016-04-12 C. Ehlers | Forschungszentrum Jülich, IEK-8 12Data Gubrist tunnel: U. Steinemann and F. Zumsteg, Verkehrs- und Schadstoffmessungen 2008 im Gubristtunnel ; report US 89 - 16 - 13, OSTLUFT, Zürich, Switzerland, update May 25, 2010.
• Ratio RVOC / RNO2 decreased by factor 7.5• VOCs were reduced more than NOx

Trend in observations
2016-04-12 C. Ehlers | Forschungszentrum Jülich, IEK-8 13Data Gubrist tunnel: U. Steinemann and F. Zumsteg, Verkehrs- und Schadstoffmessungen 2008 im Gubristtunnel ; report US 89 - 16 - 13, OSTLUFT, Zürich, Switzerland, update May 25, 2010.
• Ratio RVOC / RNO2 decreased by factor 7.5• VOCs were reduced more than NOx

Trend in observations
2016-04-12 C. Ehlers | Forschungszentrum Jülich, IEK-8 14Data Gubrist tunnel: U. Steinemann and F. Zumsteg, Verkehrs- und Schadstoffmessungen 2008 im Gubristtunnel ; report US 89 - 16 - 13, OSTLUFT, Zürich, Switzerland, update May 25, 2010.
• Ratio RVOC / RNO2 decreased by factor 7.5• VOCs were reduced more than NOx

Germany, 21.6., clear sky, noon, 25°C, MCM 3.2Photochemistry
15

16
Germany, 21.6., clear sky, noon, 25°C, MCM 3.2Photochemistry

2016-04-12 C. Ehlers | Forschungszentrum Jülich, IEK-8 17
Conclusions
Traffic emissions reduced by catalytic converter• very strong reduction in VOC • small reduction in NOx
Significant reduction of ozone production in urban areas
Future reduction schemes should include both NOx and VOC
2016-04-12 C. Ehlers | Forschungszentrum Jülich, IEK-8 18
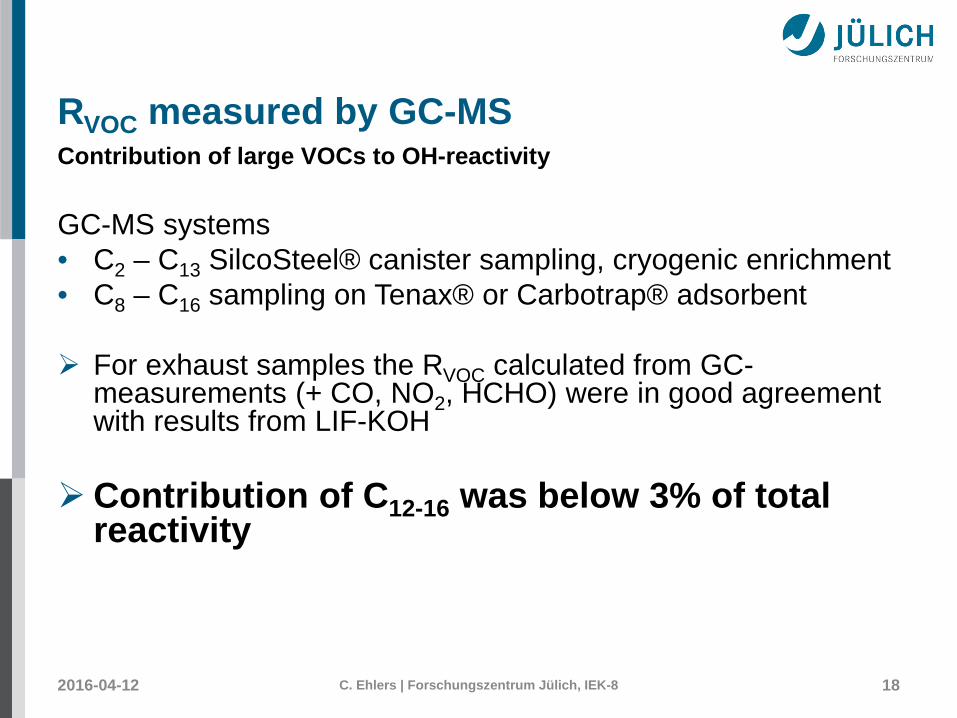
Contribution of large VOCs to OH-reactivityRVOC measured by GC-MS
GC-MS systems• C2 – C13 SilcoSteel® canister sampling, cryogenic enrichment• C8 – C16 sampling on Tenax® or Carbotrap® adsorbent
For exhaust samples the RVOC calculated from GC-measurements (+ CO, NO2, HCHO) were in good agreement with results from LIF-KOH
Contribution of C12-16 was below 3% of total reactivity
2016-04-12 C. Ehlers | Forschungszentrum Jülich, IEK-8 19
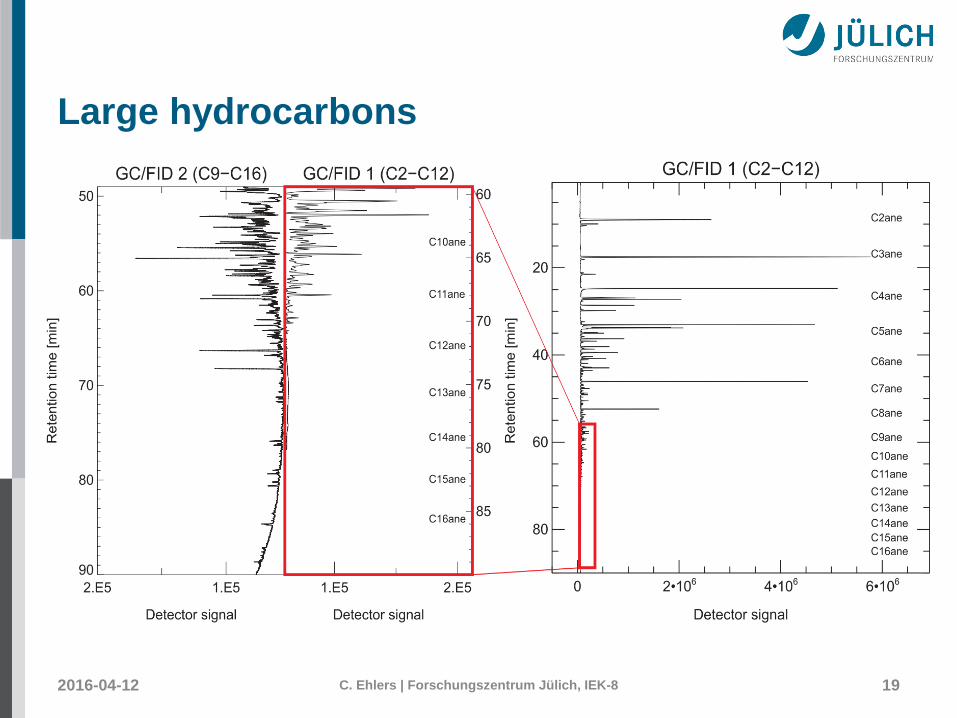
Large hydrocarbons

Different regimes
20

21
Germany, 21.12., clear sky, noon, -5°C, MCM 3.1Winter conditions

Changes in Emission Profiles
2016-04-12 C. Ehlers | Forschungszentrum Jülich, IEK-8 22
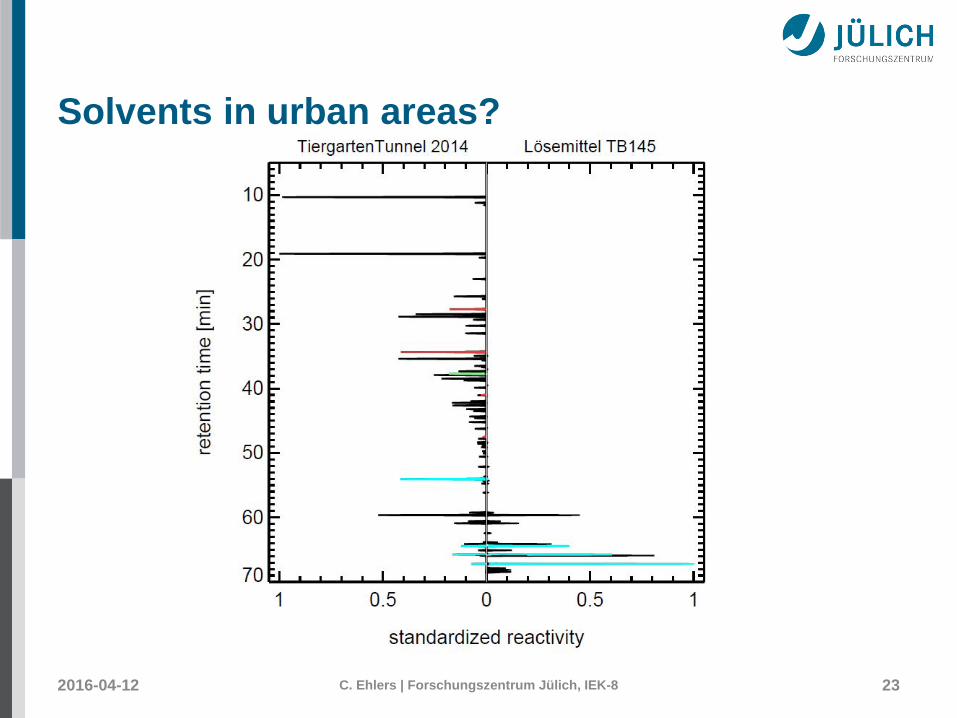
Solvents in urban areas?
2016-04-12 C. Ehlers | Forschungszentrum Jülich, IEK-8 23

Ozone concentration
2016-04-12 C. Ehlers | Forschungszentrum Jülich, IEK-8 24
Averaged annual surface ozone concentrations observed at the GAW stations Mace Head, Ireland (blue diamonds) [R. G. Derwent, A. J. Manning, P. G.Simmonds, T. G. Spain and S. O’Doherty, Atmospheric Environment, 2013, 80, 361–368], and Hohenpeissenberg, Germany (red circles). The data fromHohenpeissenberg for the time period until 2010 are taken from the literature [O. R. Cooper, D. D. Parrish, J. Ziemke, N. V. Balashov, M. Cupeiro, I. E. Galbally,S. Gilge, L. Horowitz, N. R. Jensen, J.-F. Lamarque, V. Naik, S. J. Oltmans, J. Schwab, D. T. Shindell, A. M. Thompson, V. Thouret, Y. Wang and R. M. Zbinden,Elementa: Science of the Anthropocene, 2014, 2:000029, 1–28]. The later data were kindly supplied by the German Weather Service and are preliminary.

Trend in Ozone concentration
2016-04-12 C. Ehlers | Forschungszentrum Jülich, IEK-8 25
Average number of hours exceeding 240 µg/m³ Ozone per year
• Fewer exceedances of ozone alarm values• Decrease in Ozone concentrations in Germany
Figure: U. Dauert, S. Feigenspan, A. Minkos and M. Langner, Luftqualität 2014, Vorläufige Auswertung, Umweltbundesamt Deutschland, Dessau-Roßlau, Januar 2015

Raw exhaust emissions
2016-04-12 C. Ehlers | Forschungszentrum Jülich, IEK-8 26
NOx and VOC emissions of diesel and petrol passenger cars without catalytic converters; replotted using published mixing ratio measurements (see [R.Pischinger, M. Kell and T. Sams, Thermodynamik der Verbrennungskraftmaschine: Der Fahrzeugantrieb, Springer, Wien, Austia, and New York, USA, 3rd edn.,2009]) multiplied with λ to be proportional to g/km and then scaled to the values of table 1 at λ = 1 for petrol and λ = 3 for diesel passenger cars.

Petrol car emissions
2016-04-12 C. Ehlers | Forschungszentrum Jülich, IEK-8 27
Normalized cumulative emissions of CO (100%=23.8g corresponding to 0.80g/km), CO2 (262g/km), NO (0.205g/km as NO2), and VOC (0.088g/km as HC)derived during on-board measurements of a petrol car (see [D. Klemp, D. Mihelcic and B. Mittermaier, Messung und Bewertung von Verkehrsemissionen,Schriften des Forschungszentrums Jülich, Energy & Environment, volume 21, Jülich, Germany, 1st edn., 2012]) during a drive of 29.7km length 11.07.2001 inMunich (passenger petrol car, year of manufacture: 2000, 85 kW, G-Kat, exhaust norm D4)

Diesel car emissions
2016-04-12 C. Ehlers | Forschungszentrum Jülich, IEK-8 28
Normalized cumulative emissions of CO (100%=2.09g corresponding to 0.116g/km), CO2 (180g/km), NO (0.149g/km as NO2), NO2 (0.173g/km), and VOC(0.008g/km as HC) derived during on-board measurements of a diesel car (see [D. Klemp, D. Mihelcic and B. Mittermaier, Messung und Bewertung vonVerkehrsemissionen, Schriften des Forschungszentrums Jülich, Energy & Environment, volume 21, Jülich, Germany, 1st edn., 2012]) during a drive of 18.0kmlength 27.11.2002 executing a FTP-75-cycle (passenger diesel car, year of manufacture: 2002, 105 kW, DOC, exhaust norm EURO3)

Inventory of passenger cars
2016-04-12 C. Ehlers | Forschungszentrum Jülich, IEK-8 29
Inventory of passenger cars (PC Diesel and PC Petrol) in Germany for the years 1960-2015 (see [Fahrzeugzulassungen: Bestand an Kraftfahrzeugen nach Umwelt-Merkmalen; Statistische Mitteilungen des Kraftfahrt-Bundesamtes FZ 13, Kraftfahrt-Bundesamt, Flensburg, Germany, 2015]); since January 1, 2008, only registered vehicles without temporary suspension respectively decommissioning are taken into account

Annual fuel consumption
2016-04-12 C. Ehlers | Forschungszentrum Jülich, IEK-8 30
Annual fuel consumption of road traffic in Germany for the years 1960-2011 (PC: passenger cars; oV: other vehicles including HGV, LCV, and UBus (HeavyGoods Vehicles, Light Commercial Vehicles, Urban Buses); misc: miscellaneous petrol cars; natural and liquefied gas included in PC petrol; PJ: Peta Joule =1015 Joule); replotted from TREMOD version 5.3 (see [S. Hausberger, M. Rexeis, M. Zallinger and R. Luz, Emission Factors from the Model PHEM for theHBEFA Version 3; Report Nr. I-20/2009 Haus-Em 33/08/679 from 07.12.2009, TU Graz, Graz University of Technology, Graz, Austria, 2009 ])

Emission regulation
2016-04-12 C. Ehlers | Forschungszentrum Jülich, IEK-8 31
Vehicle emission regulation categories for passenger cars in Germany for the years 1990-2011; replotted from TREMOD version 5.3 (see [Aktualisierung ”Daten-und Rechenmodell: Energieverbrauch und Schadstoff-emissionen des motorisierten Verkehrs in Deutschland 1960-2030” (TREMOD, Version 5.3) für dieEmissionsberichtserstattung 2013, ed. W. Knörr, ifeu - Institut für Energie- und Umweltforschung Heidelberg GmbH, Heidelberg, Germany, 2012] and table 1)

NOx emissions
2016-04-12 C. Ehlers | Forschungszentrum Jülich, IEK-8 32
NOx emissions (as NO2) of road traffic in Germany for the years 1960-2011 (PC: passenger cars; oV: other vehicles including HGV, LCV, and UBus (HeavyGoods Vehicles, Light Commercial Vehicles, Urban Buses), ; misc: miscellaneous petrol cars and remaining types of road traffic); replotted from TREMODversion 5.3 (see [Aktualisierung ”Daten- und Rechenmodell: Energieverbrauch und Schadstoff-emissionen des motorisierten Verkehrs in Deutschland 1960-2030”(TREMOD, Version 5.3) für die Emissionsberichtserstattung 2013, ed. W. Knörr, ifeu - Institut für Energie- und Umweltforschung Heidelberg GmbH, Heidelberg,Germany, 2012])

Anually averaged NOx concentrations
2016-04-12 C. Ehlers | Forschungszentrum Jülich, IEK-8 33
Annually averaged NOx concentrations (NO displayed as µg/m³ NO2) close to traffic in inner city districts in Germany (replotted from [Umweltbundesamt,Entwicklung der Luftqualität in Deutschland, Umweltbundesamt Deutschland, Fachgebiet II 4.2 ”Beurteilung der Luftqualität”, Dessau-Roßlau, October 2009, pp.5–7.])

Vehicle kilometers
2016-04-12 C. Ehlers | Forschungszentrum Jülich, IEK-8 34
Vehicle kilometers traveled by passenger cars in Germany; replotted from TREMOD version 5.3 [Aktualisierung ”Daten- und Rechenmodell: Energieverbrauchund Schadstoff-emissionen des motorisierten Verkehrs in Deutschland 1960-2030” (TREMOD, Version 5.3) für die Emissionsberichtserstattung 2013, ed. W.Knörr, ifeu - Institut für Energie- und Umweltforschung Heidelberg GmbH, Heidelberg, Germany, 2012]. AB:Autobahn, OT:out-of-town, IT:in-town

NOx traffic emissions
2016-04-12 C. Ehlers | Forschungszentrum Jülich, IEK-8 35
Estimated NOx traffic emissions in urban areas in Germany, this paper; for details see subsection 1.3.1. Featured categories from bottom to top are: ”PC petrolRDE=EU”: PC petrol car emissions which essentially show real-drive-emissions RDE in compliance with EU legislation, ”PC diesel EU”: intended PC diesel caremissions according to EU legislation, ”PC diesel RDE-EU”: surplus of PC diesel car real-drive-emissions RDE on top of the intended emissions according to EUlegislation, ”LCV+HGV”: emissions of light-commercial-vehicles and of heavy-goods-vehicles.

Ozone production
2016-04-12 C. Ehlers | Forschungszentrum Jülich, IEK-8 36
Vergleich der Ozonproduktionsraten, berechnet aus gemessenen Radikalkonzentrationen verschiedener Kampagnen auf dem Schauinsland (Sommer1989,1990, 1992 und 1994 Quadrate); aus Izania, Teneriffa (1994, Dreiecke); die roten Punkte geben die gemessenen -Werte aus der BERLIOZ-Kampagne(20.07.1998 und 21.07.1998) wieder. (aus: [Mihelcic et al. 2003]). Die Daten repräsentieren 30 min-Mittelwerte und sind als Funktion der gleichzeitig gemessenen-Konzentration aufgetragen. Berücksichtigt wurden ausschließlich Tageswerte mit > 0,004 s-1. Zusätzlich eingetragen (grüne Linie) wurden die -Resultate derMCM-Modellierung des Münchener Datensatzes.

37Retention time [min]

VOC „fingerprints“
38

VOC „fingerprints“
392016-04-12 C. Ehlers | Forschungszentrum Jülich, IEK-8

VOC OH-reactivity
2016-04-12 C. Ehlers | Forschungszentrum Jülich, IEK-8 40
• OH-reactivity speed of reaction with OH– 90% of all VOCs react with OH– Reciprocal lifetime of OH [unit: s-1]
• 𝑅𝑅𝑉𝑉𝑉𝑉𝑉𝑉𝑖𝑖 = 𝑘𝑘𝑉𝑉𝑂𝑂+𝑉𝑉𝑉𝑉𝑉𝑉𝑖𝑖 × 𝑉𝑉𝑉𝑉𝑉𝑉𝑖𝑖– Processing of an air mass can be described by
proxy of total VOC reactivity with OH• 𝑅𝑅𝑉𝑉𝑉𝑉𝑉𝑉 = ∑𝑘𝑘𝑉𝑉𝑂𝑂+𝑉𝑉𝑉𝑉𝑉𝑉𝑖𝑖 × 𝑉𝑉𝑉𝑉𝑉𝑉𝑖𝑖