twenty-seven years of pharmaceutical industry criminal and...
TRANSCRIPT

Twenty-Seven Years of Pharmaceutical
Industry Criminal and Civil Penalties:
1991 Through 2017
March 14, 2018 Sammy Almashat, M.D., M.P.H. Ryan Lang, M.D., M.P.H. Sidney M. Wolfe, M.D. Michael Carome, M.D.
–––––––––––––––––––
www.citizen.org

Public Citizen Pharmaceutical Industry Settlements: 1991-2017
2
About Public Citizen Public Citizen is a national nonprofit organization with more than 400,000 members and supporters. We represent consumer interests through lobbying, litigation, administrative advocacy, research, and public education on a broad range of issues, including consumer rights in the marketplace, product safety, financial regulation, safe and affordable health care, campaign finance reform and government ethics, fair trade, climate change, and corporate and government accountability.
Public Citizen Pharmaceutical Industry Settlements: 1991-2017
3
Table of Contents Executive Summary 4 Introduction 7 Methods 7 Results 7 Combined federal and state trends 7 Federal settlements 8 State settlements 8 Civil versus criminal settlements 10 False Claims Act and qui tam settlements 10 Worst and repeat offenders and largest settlements 11
Types of violations 11 Discussion 12 Federal settlements 13
State settlements 17 More enforcement needed 19
Limitations and future research 23 Conclusion 23 Appendix 1: Figures and Tables 25 Appendix 2: Detailed methodology 52

Public Citizen Pharmaceutical Industry Settlements: 1991-2017
4
Executive Summary Background
Public Citizen has published three previous reports — in 2010,1 2012,2 and 20163 — documenting the number and size of criminal and civil settlements and court judgments reached between the federal and state4 governments and pharmaceutical manufacturers. The 2016 report, which included all settlements from 1991 through 2015, revealed that the pace of settlement activity had decreased considerably in the then-most-recent two-year period. The current report analyzes settlements announced in 2016 and 2017, thereby providing collective data for the 27 years from 1991 through 2017. Methods
Methodology was identical to that employed for the 2016 report. Note that the current report and the 2016 report included all settlements, regardless of the magnitude of the financial penalty. However, for the time period prior to July 19, 2012, only settlements of $1 million or greater were included. We changed our methodology beginning with the 2016 report to include settlements of less than $1 million primarily to ensure that totals for smaller states (which are more likely to have smaller settlements) were not underrepresented. Main Findings
From 1991 through 2017, a total of 412 settlements were reached between the federal and state governments and pharmaceutical manufacturers, for a total of $38.6 billion. For 2016 and 2017, 38 settlements for a total of $2.9 billion occurred. These totals are comparable to the number of settlements (39) and overall financial penalties ($2.9 billion) in the previous two-year period (2014-2015). Total settlements in each of these two-year intervals were significantly lower than the 117 settlements totaling $9.8 billion in 2012-2013. Other key findings include the following:
In 2016 and 2017, 29 federal settlements for a total of $2.8 billion occurred. These
totals are somewhat higher than the previous two-year (2014-2015) totals of 19 settlements for $2.4 billion. However, both financial-penalty totals were
1 Public Citizen. Rapidly Increasing Criminal and Civil Monetary Penalties Against the Pharmaceutical Industry: 1991 to 2010. December 16, 2010. https://www.citizen.org/media/public-citizen-publications-rapidly-increasing-criminal-and-civil-monetary-penalties. Accessed February 21, 2018. 2 Public Citizen. Pharmaceutical Industry Criminal and Civil Penalties: An Update. September 27, 2012. https://www.citizen.org/our-work/health-and-safety/pharmaceutical-industry-criminal-and-civil-penalties-update. Accessed February 21, 2018. 3 Public Citizen. Twenty-Five Years of Pharmaceutical Industry Criminal and Civil Penalties: 1991 Through 2015. March 31, 2016. https://www.citizen.org/our-work/health-and-safety/twenty-five-years-pharmaceutical-industry-criminal-and-civil-penalties-1991-through-2015. Accessed February 21, 2018. 4 The District of Columbia is considered a “state” for the purposes of this report.

Public Citizen Pharmaceutical Industry Settlements: 1991-2017
5
significantly lower than the $8.7 billion total for the 22 federal settlements in 2012-2013. The average financial penalty in 2016-2017 ($97 million per federal settlement) and in 2014-2015 ($128 million per federal settlement) were both markedly lower than the $394 million per federal settlement in 2012-2013. Thus, the average penalty per settlement in 2016-2017 decreased by 75% from the average penalty in 2012-2013.
The continued low levels of financial penalties in 2016-2017 were primarily due to a continued decrease in financial penalties (almost all federal) from settlements involving unlawful promotion of prescription drugs. Such penalties have declined drastically, by 94%, since their peak in 2012-2013 – from $8.7 billion then to just $527 million in 2016-2017. This is the lowest two-year total since 2003-2004.
Another striking finding was a dramatic decrease in criminal penalties (which have all been federal since 1991). In 2012-2013, criminal penalties totaled $2.7 billion, but by 2016-2017, the total had fallen to $317 million, an 88% decrease.
In 2016 and 2017, there were just 9 state settlements for a total of $82 million, the lowest two-year total for both the number of settlements and the amount of financial penalties since 2004-2005.
From 1991 through 2017, overcharging of government health programs (mainly drug pricing fraud against state Medicaid programs) was the most common violation, but the number of settlements involving this violation has decreased dramatically in recent years, with just three federal or state settlements involving overcharging of government health programs in 2016-2017 and eight settlements in 2014-2015, compared with 78 such settlements in 2012-2013.
Qui tam (whistleblower) revelations, brought mostly under the False Claims Act, were responsible, at least in part, for 92 of 170 (54%) federal settlements, and $24.7 billion of $34.8 billion (71%) in federal penalties, from 1991 through 2017. By contrast, from 1991 through 2017, a much lower proportion of state settlements (17 of 242; 7%) and state financial penalties ($791 million of $3.9 billion; 20%) originated from qui tam actions.
From 1991 through 2017, 31 states reached at least one single-state settlement with a pharmaceutical company. Hawaii recovered the most money as a proportion (15%) of Medicaid drug expenditures, Alabama recouped the most money per enforcement dollar spent ($10.02), and Louisiana had the most single-state settlements (55). During these 27 years, 16 of the 31 states with at least one single-state settlement have attained a return on investment of $1 or greater per enforcement dollar spent, meaning they recouped enough money through financial penalties from these pharmaceutical settlements alone to offset their entire (pharmaceutical and non-pharmaceutical) Medicaid fraud enforcement budgets from FY 2006 to FY 2017.

Public Citizen Pharmaceutical Industry Settlements: 1991-2017
6
From 1991 through 2017, GlaxoSmithKline and Pfizer paid more in financial penalties — $7.9 billion and $4.7 billion, respectively — and reached more settlements (32 and 34, respectively) with the federal and state governments than any other companies. Johnson & Johnson, Teva, Merck, Abbott, Eli Lilly, Schering-Plough, Novartis, Mylan, and AstraZeneca were the other companies that paid more than $1 billion in financial penalties from 1991 through 2017, with Teva and Mylan having joined the $1 billion list over the past two years. Thirty-seven companies have entered into multiple settlements with the federal government from 1991 through 2017, with Pfizer (14), GlaxoSmithKline (9), Novartis (9), Bristol-Myers Squibb (8), Teva (7), and Merck (7) finalizing the most federal settlements.
Conclusion
The number and size of federal and state settlements against the pharmaceutical industry remained low in 2016 and 2017, with federal criminal penalties nearly disappearing. Financial penalties continued to pale in comparison to company profits, with the $38.6 billion in penalties from 1991 through 2017 amounting to only 5% of the $711 billion in net profits made by the 11 largest global drug companies during just 10 of those 27 years (2003-2012). To our knowledge, a parent company has never been excluded from participation in Medicare and Medicaid for illegal activities, which endanger the public health and deplete taxpayer-funded programs. Criminal prosecutions of executives leading companies engaged in these illegal activities have been extremely rare. Much larger penalties and successful prosecutions of company executives that oversee systemic fraud, including jail sentences if appropriate, are necessary to deter future unlawful behavior. Otherwise, these illegal but profitable activities will continue to be part of companies’ business model.

Public Citizen Pharmaceutical Industry Settlements: 1991-2017
7
Introduction Public Citizen has published three previous reports — in 2010,5 2012,6 and 20167 — documenting the number and size of criminal and civil settlements and court judgments reached between the federal and state8 governments and pharmaceutical manufacturers. The 2016 report, which included all settlements from 1991 through 2015, revealed that the pace of settlement activity had decreased considerably in the then-most-recent two-year period. The current report analyzes settlements announced in 2016 and 2017, thereby providing collective data for the 27 years from 1991 through 2017.
Methods Methodology was identical to that employed for the 2016 report (see Appendix 2 for more details and updated URLs). Note that the current report and the 2016 report included all settlements, regardless of the magnitude of the financial penalty. However, for the time period prior to July 19, 2012, only settlements of $1 million or greater were included. We changed our methodology beginning with the 2016 report to include settlements of less than $1 million primarily to ensure that totals for smaller states (which are more likely to have smaller settlements) were not underrepresented. State settlements refer to those in which the federal government neither was involved in the investigation responsible for the settlement nor was a party to the final settlement, as determined through a review of the press release and, when available, the official settlement document. All other cases were classified as federal, including joint federal-state cases (e.g., those involving Medicaid). Note that settlement subtotals across the different parts of the “Results” section may not add up precisely to overall totals due to rounding.
Results Combined federal and state trends
From 1991 through 2017, a total of 412 settlements were reached between the federal and state governments and pharmaceutical manufacturers, for a total of $38.6 billion (Figures 1 and 2).
5 Public Citizen. Rapidly Increasing Criminal and Civil Monetary Penalties Against the Pharmaceutical Industry: 1991 to 2010. December 16, 2010. https://www.citizen.org/media/public-citizen-publications-rapidly-increasing-criminal-and-civil-monetary-penalties. Accessed February 21, 2018. 6 Public Citizen. Pharmaceutical Industry Criminal and Civil Penalties: An Update. September 27, 2012. https://www.citizen.org/our-work/health-and-safety/pharmaceutical-industry-criminal-and-civil-penalties-update. Accessed February 21, 2018. 7 Public Citizen. Twenty-Five Years of Pharmaceutical Industry Criminal and Civil Penalties: 1991 Through 2015. March 31, 2016. https://www.citizen.org/our-work/health-and-safety/twenty-five-years-pharmaceutical-industry-criminal-and-civil-penalties-1991-through-2015. Accessed February 21, 2018. 8 The District of Columbia is considered a “state” for the purposes of this report.

Public Citizen Pharmaceutical Industry Settlements: 1991-2017
8
For 2016 and 2017, 38 settlements for a total of $2.9 billion occurred. These totals are comparable to the number of settlements (39) and overall financial penalties ($2.9 billion) in the previous two-year period (2014-2015). Total settlements in each of these two-year intervals were significantly lower than the 117 settlements totaling $9.8 billion in 2012-2013. Federal settlements
From 1991 through 2017, a total of 170 federal settlements were reached for a total of $34.8 billion (Figures 3 and 4). In 2016 and 2017, 29 federal settlements for a total of $2.8 billion occurred. These totals are somewhat higher than the previous two-year (2014-2015) totals of 19 settlements for $2.4 billion. However, the total amounts of the financial penalties for all federal settlements in each of these most recent two-year intervals were significantly lower than $8.7 billion total for the 22 federal settlements in 2012-2013. The average financial penalty in 2016-2017 ($97 million per federal settlement) and in 2014-2015 ($128 million per federal settlement) were both markedly lower than the $394 million per federal settlement in 2012-2013. Thus, the average penalty per settlement in 2016-2017 decreased by 75% from the average penalty in 2012-2013. State settlements
From 1991 through 2017, 242 state settlements were reached for a total of $3.9 billion (Figures 3 and 4). In 2016 and 2017, there were just 9 state settlements for a total of $82 million, the lowest two-year total for both the number of settlements and the amount of financial penalties since 2004-2005. Single-state settlements From 1991 through 2017, 204 (84%) of the 242 state settlements were single-state settlements and $2.3 billion (59%) of the $3.9 billion in total state financial penalties were recovered from single-state settlements (Figures 5 and 6). The number of single-state settlements decreased precipitously beginning in 2014. In 2016-2017, five single-state settlements were reached by five different states (for $16 million), a decline from 2014-2015 (17 settlements for $213 million) and an even more dramatic decline from 2012-2013 (88 settlements for $741 million). From 1991 through 2017, 31 states reached at least one single-state settlement with a pharmaceutical company (Table 1). During these 27 years, Hawaii, New Mexico, South Carolina, and Texas recovered the most in financial penalties as a proportion of state Medicaid prescription drug expenditures from fiscal year (FY) 2001 to FY 2015, with recoveries of 4% to 15% of the total of each state Medicaid program’s spending on drugs

Public Citizen Pharmaceutical Industry Settlements: 1991-2017
9
over that period (percentages presented as dollars per $1,000 in Table 1). The 31 states with at least one single-state settlement recouped a median of slightly less than 1% ($7.84 per $1,000) and a mean of approximately 2% ($20.16 per $1,000) of their total FY 2001-2015 Medicaid drug expenditures through these settlements. Twenty-five (81%) of the 31 states with at least one single-state settlement had a False Claims Act (FCA) enacted as of 2017. The six states without an FCA recouped a far higher median of approximately 2.8% ($27.50 per $1,000) of their total FY 2001-2015 Medicaid drug expenditures than did the 25 with an FCA (0.6%, or $5.64 per $1,000), including the 10 with a Deficit Reduction Act (DRA)-compliant FCA (0.7%, or $6.59 per $1,000; see Appendix 2, “State FCA status and settlement activity”, for an explanation of DRA-compliant FCAs). However, single-state settlements tended to be larger in states with an FCA ($12.60 million average per settlement) than in those without an FCA ($8.55 million average per settlement). States with a DRA-compliant FCA had the largest settlements, averaging $20.28 million per settlement. Notably, 18 of 43 states with an FCA by 2017 had not yet had a single-state settlement. Sixteen of the 31 states with at least one single-state settlement have attained a return on investment (ROI) of $1 or greater per enforcement dollar spent, meaning they recouped enough money through financial penalties from these settlements alone to offset their entire Medicaid fraud enforcement budgets from FY 2006 to FY 2017 (Table 1). Alabama, South Carolina, Hawaii, and Idaho had the highest ROIs, returning between $4 and $10 to the state for every $1 spent on enforcement of pharmaceutical- and non-pharmaceutical-related Medicaid fraud. Overall, from 1991 through 2017, the $1.4 billion recovered in single-state settlements by just the top five states (Texas, Louisiana, South Carolina, Pennsylvania, and California) represented more than one-half (60%) of all single-state penalties and more than one-third (36%) of all state financial penalties. Louisiana had the most single-state settlements (55), followed by Kentucky (20) and Texas (19). Multi-state settlements From 1991 through 2017, there were 38 multi-state settlements totaling approximately $1.6 billion, representing 16% of state settlements and 41% of state financial penalties, respectively. Every state participated in at least one multi-state settlement from 1991 through 2017, with three of the 38 multi-state settlements involving all 50 states and the District of Columbia. States participated in a median of 25 multi-state settlements from 1991 through 2017. Arizona, Florida, and Texas participated in the most multi-state settlements (32 each), followed by Massachusetts, North Carolina, and Vermont with 31 each (Table 2). Just $909 million (57%) of the $1.59 billion in multi-state settlement financial penalties were attributable as individual states’ shares of those settlements.

Public Citizen Pharmaceutical Industry Settlements: 1991-2017
10
Overall (single- and multi-state combined) state settlement totals and state FCA status Table 3 lists the overall state settlement tallies (single- and multi-state combined) for all 51 states from 1991 through 2017. Louisiana (68 settlements), Texas (51), Idaho (41), and Kentucky (41) participated in the most settlements, whereas New Hampshire (13 settlements), Alaska (13), Georgia (10), and Wyoming (8) participated in the fewest. Civil versus criminal settlements
From 1991 through 2017, there were 364 civil settlements, 39 civil-criminal settlements, and nine criminal settlements, with a total of $30.6 billion in civil penalties and $8.0 billion in criminal penalties (Figures 7 and 8). Criminal penalties (all of which, from 1991 through 2017, were federal) have dropped precipitously since 2013. In the most recent two-year period (2016-2017), there were just $317 million in criminal penalties from four settlements, with $283 million of that total coming from a single 2016 settlement with Teva for kickbacks that were illegal under the Foreign Corrupt Practices Act (FCPA). This continued a decline in criminal penalties first seen in the 2014-2015 period, in which just $44 million in criminal penalties were levied in two settlements. By comparison, in the two-year period of 2012-2013, there were $2.7 billion in criminal penalties from 10 different settlements. Among the 29 federal settlements announced in 2016-2017, the FCA continued to be the most commonly invoked law in civil settlements (12 of 29 settlements), whereas the Food, Drug, and Cosmetic Act (FDCA) was the most commonly invoked law in settlements with a criminal component (three of four settlements).
FCA and qui tam (whistleblower) settlements
From FY 1991 through FY 2017, the pharmaceutical industry paid at least $12.1 billion in financial penalties to the federal government under the FCA, more than twice the $5.3 billion that the defense industry paid for FCA fraud over the same period.9 The pharmaceutical industry continued to outpace the defense industry in such payouts from FY 2016 to FY 2017 (Figure 9), with $1.5 billion in payments, compared with $342 million paid by the defense industry. With the exception of FY 2003, FY 2006, and FY 2015, pharmaceutical industry penalties under the FCA have exceeded those of the defense industry annually from FY 2002 through FY 2017.
From calendar years 1991 through 2017, qui tam (whistleblower) revelations, brought mostly under the FCA, were responsible, at least in part, for 92 of 170 (54%) federal settlements, and $24.7 billion of $34.8 billion (71%) in federal penalties. This trend 9 These represent underestimates of the FCA totals for the pharmaceutical industry. Many settlement press releases did not include the federal portion of penalties, thus excluding those settlements from this analysis. Note also that totals for the defense industry from FYs 1991 through 2015 have been revised downwards by the Department of Justice since the release of our last report in 2016, from $5.6 to $4.9 billion. Source: Department of Justice. Fraud Statistics – Department of Defense, October 1, 1986 – September 30, 2017. https://www.justice.gov/opa/press-release/file/1020111/download. Accessed February 15, 2018.

Public Citizen Pharmaceutical Industry Settlements: 1991-2017
11
declined somewhat over the past two years (2016-2017), with qui tam revelations responsible, at least in part, for 11 of 29 (38%) federal settlements and $1.8 billion of $2.8 billion (64%) in federal penalties (Figures 10 and 11).
By contrast, from 1991 through 2017, a much lower proportion of state settlements (17 of 242; 7%) and state financial penalties ($791 million of $3.9 billion; 20%) originated from qui tam actions (Figures 12 and 13). There have been no state settlements involving qui tam revelations since 2013. Of the 17 state settlements for a total of $791 million originating from qui tam actions from 1991 through 2017, nine (53%) of the settlements and $409 million (52%) of the financial penalties resulted from investigations undertaken by a single state: Texas. Worst offenders, repeat offenders, and largest settlements Table 4 presents the 20 companies that paid the most in financial penalties to the federal and state governments from 1991 through 2017. GlaxoSmithKline and Pfizer still top this list with $7.9 billion and $4.7 billion, respectively, and also reached more settlements (32 and 34, respectively) with the federal and state governments than any other companies. Johnson & Johnson, Teva, Merck, Abbott, Eli Lilly, Schering-Plough, Novartis, Mylan, and AstraZeneca were the other companies that paid more than $1 billion in financial penalties from 1991 through 2017, with Teva and Mylan having joined the $1 billion list over the past two years. Thirty-seven companies have entered into multiple settlements with the federal government from 1991 through 2017, with Pfizer (14), GlaxoSmithKline (9), Novartis (9), Bristol-Myers Squibb (8), Teva (7), and Merck (7) finalizing the most federal settlements (Table 5). Table 6 lists the 20 largest settlements (all federal) from 1991 through 2017, with seven settlements involving more than $1 billion in penalties. Three companies had more than one settlement among the Top 20 list (GlaxoSmithKline with three, Pfizer with two, and Merck with two). Types of violations (violation categories defined in Table 7)
From 1991 through 2017, overcharging of government health programs (mainly drug pricing fraud against state Medicaid programs) was cited in more settlements (204) than any other violation (44% of all violations) (Figure 14), but this total has decreased dramatically in recent years, with just three federal or state settlements involving overcharging of government health programs in 2016-2017 and eight settlements in 2014-2015, compared with 78 such settlements in 2012-2013 (Figure 15). The vast majority of settlements involving overcharging of government health programs have historically been state settlements, mainly involving reporting falsely elevated average wholesale prices upon which Medicaid relied to reimburse end-purchasers of drugs. Such settlements appear to have disappeared, with the last state settlement for overcharging of government health programs announced in 2015. Instead, over the past two years, the federal government has stepped in to enforce other forms of pricing fraud against Medicaid and the Department of Veterans Affairs in three settlements worth a total of $1.3 billion.

Public Citizen Pharmaceutical Industry Settlements: 1991-2017
12
From 1991 through 2017, unlawful promotion resulted in the most financial penalties ($11.3 billion, 29% of all financial penalties) (Figure 16), but these totals have considerably declined in recent years, with just $209 million in penalties attributable to unlawful promotion in 2016-2017 and $519 million in 2014-2015, compared with $3.4 billion in 2012-2013 (Figure 17). This parallels a drastic decline, by 94%, in the total financial penalties from settlements involving unlawful promotion since their peak in 2012-2013 – from $8.7 billion then to just $527 million in 2016-2017. This is the lowest two-year total since 2003-2004 (Figure 18).10 This decline was due to a sharp decrease in the amount of the average penalty paid per unlawful-promotion settlement, since the number of settlements involving unlawful promotion declined proportionally less, from 29 in 2012-2013 to 20 in 2014-2015 and 12 in 2016-2017 (not shown in figures).
Discussion This updated report on settlements between the federal and state governments and pharmaceutical manufacturers with data from 2016 and 2017 confirms the continuation of the downward trend in government legal actions against pharmaceutical companies, first noted in our previous March 31, 2016, report. The annual number of settlements first decreased in 2014 and has flatlined since then, while annual financial penalties have generally continued to fall. The largest settlement announced in the most recent two-year study period (2016-2017) was reached in April 2016 with Pfizer’s Wyeth subsidiary for $785 million over allegations that the company hid from Medicaid bundled discounts it had given hospitals as an incentive to purchase its drug Protonix, thereby avoiding paying hundreds of millions of dollars in rebates to Medicaid as required by law.11 The second largest settlement for 2016-2017 was reached with Mylan in August 2017 for $465 million over allegations that the company violated the FCA by knowingly misclassifying EpiPen as a generic drug to avoid paying rebates owed primarily to Medicaid.12
10 The annual totals are smaller in Figure 17 than in Figure 18 because Figure 18 totals include all financial penalties in settlements involving unlawful promotion. However, $10.3 billion in financial penalties for these settlements either were due to other violations in those settlements ($798 million) or, in the vast majority of cases, were not attributable to any single violation ($9.5 billion). Therefore, these $10.3 billion in penalties are excluded from Figure 17, which includes only penalties explicitly attributed to unlawful promotion within the text of the press release. 11 Department of Justice. Wyeth and Pfizer Agree to Pay $784.6 Million to Resolve Lawsuit Alleging That Wyeth Underpaid Drug Rebates to Medicaid. April 27, 2016. https://www.justice.gov/opa/pr/wyeth-and-pfizer-agree-pay-7846-million-resolve-lawsuit-alleging-wyeth-underpaid-drug-rebates. Accessed February 24, 2018. The allegations in this settlement were classified for the purposes of this report as “overcharging a government health program.” 12 Department of Justice. Mylan Agrees to Pay $465 Million to Resolve False Claims Act Liability for Underpaying EpiPen Rebates. August 17, 2017. https://www.justice.gov/opa/pr/mylan-agrees-pay-465-million-resolve-false-claims-act-liability-underpaying-epipen-rebates. Accessed February 26, 2018. The allegations in this settlement were classified for the purposes of this report as “overcharging a government health program.”

Public Citizen Pharmaceutical Industry Settlements: 1991-2017
13
Federal settlements Continued low levels of federal financial penalties and virtual disappearance of criminal penalties Continuing the downward trend first seen in 2014-2015, total federal penalties were $2.8 billion in 2016- 2017, slightly higher than the previous two-year period but distributed among more federal settlements (29 vs. 19, respectively). Federal financial penalties decreased by 68% since their peak in 2012-2013 — from $8.7 billion then to $2.8 billion in 2016-2017. Similarly, the average penalty per federal settlement decreased by 75% since 2012-2013 – from $394 million per settlement then to $97 million per settlement in 2016-2017, the lowest two-year per-settlement average since 1998-1999. Of particular concern, there were three federal settlements announced in 2016-2017 that had no accompanying financial penalty.13 One was an FTC settlement,14 which is discussed further below. The other two were reached with the Department of Justice (DOJ)15 and the Securities and Exchange Commission.16 Criminal penalties against pharmaceutical companies (which have all been federal since 1991) have decreased even more drastically. In 2012-2013, there were $2.7 billion in federal criminal penalties from 10 different settlements. But in the most recent period, 2016-2017, there were just $317 million in federal criminal penalties from four settlements, with $283 million, or 89%, of that total coming from a single 2016 settlement with Teva for kickbacks that were illegal under the FCPA. This amounts to an 88% decrease from the 2012-2013 penalties. It is unclear why the federal government has decided to all but abandon its use of criminal penalties for pharmaceutical manufacturer misconduct. What is clear, however, is that such a policy favoring civil settlements enables companies to proclaim innocence from the serious charges underpinning these settlements. Decreased federal penalties for unlawful promotion Of the nine different violation categories documented in settlements from 1991 through 2017, unlawful promotion (primarily off-label marketing) resulted in the most federal financial penalties. However, the financial penalties from such settlements have declined
13 Note that, per our previous methodology, covering the period from 1991 through July 18, 2012, we did not include settlements consisting of less than $1 million in financial penalties. Therefore, we do not know whether there were any such zero-penalty federal settlements prior to July 19, 2012. 14 Federal Trade Commission. Endo Pharmaceuticals Inc. Agrees to Abandon Anticompetitive Pay-for-Delay Agreements to Settle FTC Charges; FTC Refiles Suits Against Generic Defendants. January 23, 2017. https://www.ftc.gov/news-events/press-releases/2017/01/endo-pharmaceuticals-inc-agrees-abandon-anticompetitive-pay-delay. Accessed February 24, 2018. 15 Department of Justice. District Court Enters Permanent Injunction Against Tennessee Company and Its CEO to Stop Distribution of Unapproved and Misbranded Drugs. July 27, 2017. https://www.justice.gov/opa/pr/district-court-enters-permanent-injunction-against-tennessee-company-and-its-ceo-stop. Accessed February 24, 2018. 16 Securities and Exchange Commission. SEC Charges Biopharmaceutical Company With Failing to Properly Disclose Perks for Executives. December 12, 2017. https://www.sec.gov/news/press-release/2017-229. Accessed February 24, 2018.

Public Citizen Pharmaceutical Industry Settlements: 1991-2017
14
dramatically since 2013 (Figures 17 and 18), constituting one important explanation for the decline in overall federal financial penalties since that time. The reasons for this now-four-year decline are likely a combination of decreased political will on the part of the DOJ to prosecute companies for off-label marketing and the weakening of legal restrictions on such marketing.17 Since 2012, there have been two key court cases that may have affected the DOJ’s ability to regulate and prosecute off-label marketing. In the December 2012 United States v. Caronia decision,18 the United States Court of Appeals for the Second Circuit ruled “that the government cannot prosecute pharmaceutical manufacturers and their representatives under the FDCA for speech promoting the lawful, off-label use of an FDA-approved drug.”19 In 2015, drugmaker Amarin sued the FDA after the agency did not approve a supplemental new drug application for the drug Vascepa and challenged the FDA’s authority to restrict Amarin’s promotion of the drug for the rejected indication. In March 2016, after the district court preliminarily ruled in favor of Amarin, the parties entered into a settlement agreement that allowed Amarin to promote Vascepa for the off-label use.20 It is difficult to determine whether these legal developments had any impact on the federal government’s willingness to initiate investigations of pharmaceutical companies for off-label promotional activities. Previously, large federal off-label marketing investigations had focused on particularly egregious cases (both admitted and alleged) involving downplaying the side effects of dangerous drugs, systematic (rather than lone-employee) efforts to deceive physicians and the FDA regarding the safety or effectiveness of drugs, and kickbacks.21 In addition, even before the Caronia decision in December 2012, DOJ officials
17 See the March 31, 2016, iteration of this report for a more detailed description of many of these developments related to off-label marketing: Public Citizen. Twenty-Five Years of Pharmaceutical Industry Criminal and Civil Penalties: 1991 Through 2015. March 31, 2016. https://www.citizen.org/our-work/health-and-safety/twenty-five-years-pharmaceutical-industry-criminal-and-civil-penalties-1991-through-2015. Accessed February 24, 2018. 18 Thomas K. Ruling Is Victory for Drug Companies in Promoting Medicine for Other Uses. The New York Times. December 3, 2012. http://www.nytimes.com/2012/12/04/business/ruling-backs-drug-industry-on-off-label-marketing.html. Accessed February 24, 2018. 19 FindLaw. United States Court of Appeals, Second Circuit. Docket No. 09-5006-cr. Decision in United States of America v. Alfred Caronia. Decided: December 03, 2012. http://caselaw.findlaw.com/us-2nd-circuit/1617010.html. Accessed February 24, 2018. 20 [Proposed] Stipulation and Order of Settlement, Amarin v. FDA, No. 15 Civ 3588 (S.D.N.Y. Mar. 8, 2016), http://files.shareholder.com/downloads/AMRN/1666903329x0x879932/A9BE5FCE-A228-429F-8394-DE4D76DAFACF/AMRN.pdf. Accessed February 24, 2018. 21 See e.g. Department of Justice. GlaxoSmithKline to Plead Guilty and Pay $3 Billion to Resolve Fraud Allegations and Failure to Report Safety Data. July 2, 2012. https://www.justice.gov/opa/pr/glaxosmithkline-plead-guilty-and-pay-3-billion-resolve-fraud-allegations-and-failure-report; Department of Justice. Justice Department Announces Largest Health Care Fraud Settlement in Its History. September 2, 2009. https://www.justice.gov/opa/pr/justice-department-announces-largest-health-care-fraud-settlement-its-history; Department of Justice. Johnson & Johnson to Pay More Than $2.2 Billion to Resolve Criminal and Civil Investigations. November 4, 2013. https://www.justice.gov/opa/pr/johnson-johnson-pay-more-22-billion-resolve-criminal-and-civil-investigations; Department of Justice. Abbott Labs to Pay $1.5 Billion to Resolve Criminal & Civil Investigations of Off-label Promotion of Depakote. May 7, 2012. https://www.justice.gov/opa/pr/abbott-labs-pay-15-billion-resolve-criminal-civil-investigations-label-promotion-depakote. All links accessed February 26, 2018.

Public Citizen Pharmaceutical Industry Settlements: 1991-2017
15
were claiming, in January 2012, that that the era of “really big, corporate-wide, off-label” promotional activity had ended and that large off-label marketing cases were already on the decline.22 According to The Pink Sheet, the officials alluded to a shift in the focus of DOJ enforcement to “false and misleading claims” regarding drugs’ safety, effectiveness, and economic superiority outside the context of off-label marketing.23 Although it is possible that, in spite of miniscule fines and virtually no executive accountability (see section on More Aggressive Enforcement Urgently Needed), drug companies decided to increase their compliance with federal laws regarding off-label marketing, to our knowledge no evidence verifies any such change. For one, annual compliance reports submitted to the federal government by companies that have entered into previous federal settlements (required under corporate integrity agreements, or CIAs) are not publicly disclosed, with litigation thus far unsuccessful in obtaining the full reports.24 Furthermore, we are not aware of data showing a decline in the number of qui tam complaints related to off-label marketing. In fact, the annual number of qui tam lawsuits submitted to the DOJ for alleged wrongdoing on the part of all (pharmaceutical and non-pharmaceutical combined) Department of Health and Human Services-contracting industries has approximately doubled over the past eight years, from an average of 235 per year from FY 2002 to FY 2009 to an average of 451 such complaints per year from FY 2010 to FY 2017.25 Kickbacks, including foreign bribery, continue to be a primary focus of federal settlements In 2016 and 2017, more federal settlements (12) involved kickbacks than any other violation. In addition, in a rare move, executives of some companies have been indicted for such domestic and foreign bribery (see Executive Impunity section below). Six of the 12 federal settlements involving kickbacks in the most recent two-year period involved violations or alleged violations of the FCPA. In our previous report, we noted that the SEC, in 2015 under the Obama administration, had indicated that it was increasingly focused on enforcing the pharmaceutical industry’s suspected violations of the FCPA.26 From 1991 through 2017, 11 pharmaceutical companies (AstraZeneca, Bristol-Myers Squibb, Eli Lilly, GlaxoSmithKline, Johnson & Johnson, Novartis, Novo Nordisk, Pfizer,
22 Sutter S. Economic Superiority Claims, Manufacturer/Payer Relationships Ripe for Enforcement Scrutiny. The Pink Sheet. February 2012. https://www.pharmamedtechbi.com/~/media/Supporting%20Documents/The%20Pink%20Sheet/75/1/Economic_claims.pdf. Accessed February 26, 2018. 23 Ibid. 24 Public Citizen. Public Citizen v. Department of Health and Human Services http://www.citizen.org/litigation/forms/cases/getlinkforcase.cfm?cID=752. Accessed February 26, 2018. 25 Department of Justice, Civil Division. Fraud Statistics – Health and Human Services. October 1, 1987 – September 30, 2017. https://www.justice.gov/opa/press-release/file/1020116/download. Accessed February 26, 2018. 26 Ceresney A, Director, Division of Enforcement, Securities and Exchange Commission. FCPA, Disclosure, and Internal Controls Issues Arising in the Pharmaceutical Industry: Remarks at CBI's Pharmaceutical Compliance Congress in Washington D.C. March 3, 2015. https://www.sec.gov/news/speech/2015-spch030315ajc.html. Accessed February 24, 2018.

Public Citizen Pharmaceutical Industry Settlements: 1991-2017
16
SciClone, Syncor, and Teva) paid a total of $767 million in 14 separate criminal and civil settlements over FCPA violations, with all but one of these settlements having occurred since 2009. Moreover, in December 2016, Teva was handed a substantial fine for FCPA violations. The company was forced to pay a combined $519 million criminal and civil penalty and pleaded guilty to bribing government officials and doctors in Russia, Ukraine, and Mexico, in order to increase market share and prescriptions of Copaxone and other drugs.27 The previous largest fine for a drug company for violating the FCPA was $70 million, paid by Johnson and Johnson in 2011.28 As of June 2017, six pharmaceutical manufacturers may have been under investigation for potential FCPA violations, according to a third-party tally of the privately run FCPA Tracker database.29 Pay-for-delay deals continue to decline For many years, branded and generic drug manufacturers have entered into what are known as “pay-for-delay” deals, in which the brand-name manufacturer pays the generic manufacturer to delay entry of a generic drug into the market.30 The FTC has estimated that such deals between brand-name and generic pharmaceutical companies have cost consumers and taxpayers $3.5 billion per year in higher drug costs.31 The FTC has challenged some of these deals as violating antitrust laws. The manufacturer-defendants in some of these lawsuits argued that the FTC lacked the authority to do so. In 2013, the U.S. Supreme Court held that these deals may be, but are not necessarily, unlawful, allowing such FTC challenges to continue.32 And in November 2016, the Supreme Court refused to hear an appeal33 of a ruling by the Third Circuit Court of Appeals that held that pay-for-delay deals do not have to involve direct cash payments from a brand-name to a generic drug company in order to be anticompetitive and therefore potentially illegal.34
27 Department of Justice. Teva Pharmaceutical Industries Ltd. Agrees to Pay More Than $283 Million to Resolve Foreign Corrupt Practices Act Charges. December 22, 2016. https://www.justice.gov/opa/pr/teva-pharmaceutical-industries-ltd-agrees-pay-more-283-million-resolve-foreign-corrupt. Accessed February 24, 2018. 28 Securities and Exchange Commission. SEC Charges Johnson & Johnson With Foreign Bribery. April 7, 2011. https://www.sec.gov/news/press/2011/2011-87.htm. Accessed February 24, 2018. 29 Canopy Consulting International. Hottest Industries for FCPA Investigations. June 8, 2017. http://c2iconsulting.com/hottest-industries-for-fcpa-investigations/. Accessed February 24, 2018. 30 Federal Trade Commission. Pay-for delay: When Drug Companies Agree Not to Compete. https://www.ftc.gov/news-events/media-resources/mergers-competition/pay-delay. Accessed February 24, 2018. 31 Ibid. 32 Wyatt E. Supreme Court Lets Regulators Sue Over Generic Drug Deals. New York Times. June 17, 2013. http://www.nytimes.com/2013/06/18/business/supreme-court-says-drug-makers-can-be-sued-over-pay-for-delay-deals.html. Accessed February 24, 2018. 33 Silverman E. Supreme Court lets pay-to-delay ruling against pharma stand. STAT. November 7, 2016. https://www.statnews.com/pharmalot/2016/11/07/supreme-court-pay-delay-glaxo-teva/. Accessed February 24, 2018. 34 Patterson Belknap Webb & Tyler LLP. Third Circuit allows pay-for-delay suit despite no cash payment. July 7, 2015. https://www.lexology.com/library/detail.aspx?g=416689c8-cf1e-47b6-a6a8-cd1dce28b3c4. Accessed February 24, 2018.

Public Citizen Pharmaceutical Industry Settlements: 1991-2017
17
In November 2017, the FTC reported that potential pay-for-delay deals35 had declined considerably in FY 2014 and FY 2015, the first complete fiscal years since the Supreme Court’s 2013 decision.36 There were 21 such potential deals in FY2014 and 14 in FY 2015, compared with a record high of 40 in FY 2012, the year prior to the decision.37 In the two most recent full calendar years (2016-2017), the federal government finalized just one pay-for-delay settlement, with Endo in January 2017, for allegedly entering into pay-for-delay deals with former Allergan subsidiary Watson and with Impax Laboratories that were intended to delay generic competition to Endo’s drugs Lidoderm and Opana ER, respectively.38 However, of concern, this settlement involved no financial penalty for Endo and even released the company from liability for having entered into another pay-for-delay deal to delay competition to its drug AndroGel in exchange for Endo being prohibited from entering into such deals again. State settlements Our research found that state governments have virtually stopped prosecuting pharmaceutical manufacturers on their own initiative and with their own resources (in what are called single-state settlements in this report). One major reason for this decline is simply that the investigations involved in many previous settlements – the pricing fraud of Medicaid known as the average wholesale price scandal – have largely reached their conclusions.39 And the fact that the Centers for Medicare and Medicaid Services (CMS) now requires all states to reimburse for pharmaceuticals based on the actual acquisition cost of the drugs and not on potentially fictitious and grossly inflated average wholesale prices40
35 The FTC defines “potential pay-for-delay” deals as those deals which “contain both explicit compensation from a brand manufacturer to a generic manufacturer and a restriction on the generic manufacturer’s ability to market its product in competition with the branded product.” Federal Trade Commission. Agreements Filed with the Federal Trade Commission under the Medicare Prescription Drug, Improvement, and Modernization Act of 2003, Overview of Agreements Filed in FY 2015: A Report by the Bureau of Competition. https://www.ftc.gov/system/files/documents/reports/agreements-filed-federal-trade-commission-under-medicare-prescription-drug-improvement-modernization/overview_of_fy_2015_mma_agreements_0.pdf. Accessed February 28, 2018. 36 Federal Trade Commission. FTC Staff Issues FY 2015 Report on Branded Drug Firms’ Patent Settlements with Generic Competitors. November 1, 2017. https://www.ftc.gov/news-events/press-releases/2017/11/ftc-staff-issues-fy-2015-report-branded-drug-firms-patent. Accessed February 24, 2018. 37 Federal Trade Commission. Agreements Filed with the Federal Trade Commission under the Medicare Prescription Drug, Improvement, and Modernization Act of 2003, Overview of Agreements Filed in FY 2015: A Report by the Bureau of Competition. https://www.ftc.gov/system/files/documents/reports/agreements-filed-federal-trade-commission-under-medicare-prescription-drug-improvement-modernization/overview_of_fy_2015_mma_agreements_0.pdf. Accessed February 24, 2018. 38 Federal Trade Commission. Endo Pharmaceuticals Inc. Agrees to Abandon Anticompetitive Pay-for-Delay Agreements to Settle FTC Charges; FTC Refiles Suits Against Generic Defendants. January 23, 2017. https://www.ftc.gov/news-events/press-releases/2017/01/endo-pharmaceuticals-inc-agrees-abandon-anticompetitive-pay-delay. Accessed February 20, 2018. 39 There has not been a state settlement for overcharging of government health programs (i.e. pricing fraud) since 2015. 40 81 Federal Register 5170 (2016). Medicaid Program; Covered Outpatient Drugs. Final Rule With Comment Period. https://www.gpo.gov/fdsys/pkg/FR-2016-02-01/pdf/2016-01274.pdf. Accessed February 24, 2018.

Public Citizen Pharmaceutical Industry Settlements: 1991-2017
18
may decrease the potential for average wholesale price fraud and thus continue the decline in state Medicaid pricing fraud settlements. Another potential reason for the decline in single-state settlements in particular is the limited resources of certain states. To prosecute fraud against their Medicaid programs, such states often have to enter into agreements with private law firms to prosecute pharmaceutical companies on a contingency fee basis. However, as discussed in more detail in our previous report, a systematic campaign by the pharmaceutical industry has long targeted this practice. After failing to prevail over state governments in court,41,42 the pharmaceutical and other industries lobbied for state legislation to curb the practice,43 succeeding in passing legislation in 18 states, as of February 2016, placing restrictions on the hiring of outside counsel by state attorneys general.44 Instead, states have focused their recent litigation against the pharmaceutical industry squarely on the opioid epidemic. There were just five single-state settlements in the entire two-year period of 2016-2017. All but one of these settlements involved the drugmakers Insys Therapeutics and Endo for the alleged unlawful promotion and kickbacks related to their opioid drugs Subsys (fentanyl sublingual spray) and Opana ER (oxymorphone45), respectively. A slew of lawsuits brought by other states, cities, and counties across the country against various opioid manufacturers are still ongoing.46 This recent focus on alleged wrongdoing by opioid makers is not surprising given the devastation wrought by the opioid epidemic.47 Despite these laudable actions by state governments to hold
41 Lipton E. Lawyers Create Big Paydays by Coaxing Attorneys General to Sue. New York Times. December 18, 2014. http://www.nytimes.com/2014/12/19/us/politics/lawyers-create-big-paydays-by-coaxing-attorneys-general-to-sue-.html. Accessed February 24, 2018. 42 Habte S. Drugmakers in N.H. Opioid Probe Lose Bid to Oust Cohen Milstein. Bloomberg BNA. July 12, 2017. https://www.bna.com/drugmakers-nh-opioid-n73014461605/. Accessed February 24, 2018. 43 Louisiana and the Fight Over Outside Lawyers. New York Times. December 18, 2014. http://www.nytimes.com/interactive/2014/12/19/us/politics/2-Louisiana-and-the-Fight-Over-Outside-Lawyers.html. Accessed February 24, 2018. 44 Anderson AK. Arkansas Becomes 16th State to Pass Sunshine Legislation for State-Hired Private Attorneys. American Legislative Exchange Council. April 17, 2015. https://www.alec.org/article/arkansas-becomes-16th-state-to-pass-sunshine-legislation-for-state-hired-private-attorneys/. Accessed February 24, 2018. In a personal communication on February 9, 2016, with the American Legislative Exchange Council’s Amy Kjose Anderson, it was brought to our attention that two other states, Ohio and Louisiana, had passed such legislation since her article was published in April 2015. 45 More than a year after the March 2016 settlement between New York and Endo over Opana ER, the FDA requested the removal of Opana ER from the U.S. market because “the benefits of the drug may no longer outweigh its risks [of abuse].” It was the first time that the FDA requested that an opioid be removed from the market due to the opioid abuse epidemic. Food and Drug Administration. FDA Requests Removal of Opana ER for Risks Related to Abuse. June 8, 2017. https://www.fda.gov/NewsEvents/Newsroom/PressAnnouncements/ucm562401.htm. Accessed February 24, 2018. 46 Noguchi Y. 41 States To Investigate Pharmaceutical Companies Over Opioids. National Public Radio. September 19, 2017. https://www.npr.org/sections/thetwo-way/2017/09/19/552135830/41-states-to-investigate-pharmaceutical-companies-over-opioids. Accessed February 24, 2018. 47 Centers for Disease Control and Prevention. Opioid Overdose: Understanding the Epidemic. https://www.cdc.gov/drugoverdose/epidemic/index.html. Accessed February 24, 2018.

Public Citizen Pharmaceutical Industry Settlements: 1991-2017
19
accountable opioid manufacturers, the virtual disappearance of single-state settlements involving wrongdoing other than opioid-related fraud is concerning. More aggressive enforcement urgently needed This report found that 37 companies had entered into two or more settlements with the federal government from 1991 through 2017. In a 2015 paper, Marc A. Rodwin, professor at the Suffolk University School of Law, noted that despite a long-standing “epidemic of pharmaceutical firm illegal conduct,” federal officials have to date “sh[ied] away from making use of the stronger sanctions currently available to them.”48 This has likely been a major factor responsible for many drugmakers engaging in repeat misconduct over the years, often for the same violation. Rodwin’s paper provided an extensive overview of current enforcement strategies, centering on two themes: stronger sanctions and greater federal oversight of pharmaceutical manufacturers’ activities to prevent wrongdoing before it occurs. While it may seem like a large sum, the $38.6 billion paid by the pharmaceutical industry from 1991 through 2017 represents a miniscule fraction of drug company profits – just 5% of the $711 billion in net profits made by the 11 largest global drug companies during only 10 of those 27 years (2003-2012).49 This contrast is especially striking in light of the sales figures for the specific drugs involved in fraudulent activity. The third-largest-ever health fraud settlement, in 2013, forced Johnson & Johnson to pay $2 billion for violations involving, among other drugs, Risperdal.50 Risperdal alone brought in $11.7 billion in sales for the company, or almost six times the total settlement amount, in just the first 12 years after its approval (1994-2005).51 In two of the years (2002-2003) during which the criminal off-label promotion occurred,52 DOJ noted that 75-84% of Risperdal use in elderly patients was off-label, with approximately 50% of this use in elderly patients with dementia.53
48 Rodwin MA. Do We Need Stronger Sanctions to Ensure Legal Compliance by Pharmaceutical Firms? Food and Drug Law Journal. 2015; 70(3). 49 Rome E. Big Pharma Pockets $711 Billion in Profits by Robbing Seniors, Taxpayers. Huffington Post. April 8, 2013. https://www.huffingtonpost.com/ethan-rome/big-pharma-pockets-711-bi_b_3034525.html. Accessed February 24, 2018. 50 Department of Justice. Johnson & Johnson to Pay More Than $2.2 Billion to Resolve Criminal and Civil Investigations. November 4, 2013. http://www.justice.gov/opa/pr/johnson-johnson-pay-more-22-billion-resolve-criminal-and-civil-investigations. Accessed February 24, 2018. 51 U.S. District Court, Eastern District of Pennsylvania. United States of America v. Janssen Pharmaceuticals, Inc. Filed November 4, 2013. http://www.justice.gov/sites/default/files/opa/legacy/2013/11/04/janssen-info.pdf. Accessed February 24, 2018. 52 Department of Justice. Johnson & Johnson to Pay More Than $2.2 Billion to Resolve Criminal and Civil Investigations. November 4, 2013. http://www.justice.gov/opa/pr/johnson-johnson-pay-more-22-billion-resolve-criminal-and-civil-investigations. Accessed February 24, 2018. 53 U.S. District Court, Eastern District of Pennsylvania. United States of America v. Janssen Pharmaceuticals, Inc. Filed November 4, 2013. http://www.justice.gov/sites/default/files/opa/legacy/2013/11/04/janssen-info.pdf. Accessed February 24, 2018.

Public Citizen Pharmaceutical Industry Settlements: 1991-2017
20
The inability of paltry financial penalties to serve as a deterrent to further wrongdoing heightens the importance of other enforcement avenues. Prosecution of company executives who oversee systematic fraud is a necessary element to any enforcement program. To date, the federal government has been extremely reluctant to charge executives for wrongdoing. However, there have been some exceptions, including the following cases in the most recent two-year period (2016-2017).54 In December 2016, several executives and managers of the pharmaceutical company Insys were arrested for allegedly paying bribes and kickbacks to health care providers in exchange for prescribing the company’s fentanyl spray, Subsys.55 In October 2017, Insys’ founder and majority owner, John Kapoor, was indicted on similar charges.56 Subsys is FDA-approved only for the treatment of breakthrough pain in cancer patients, but the government alleges that the kickbacks were paid to practitioners in exchange for prescriptions, most of which were not for cancer patients. Earlier, in January 2017, two former executives of generic drug companies, Jason Malek and Jeffrey Glazer, pleaded guilty to the DOJ for “participating in conspiracies to fix prices, rig bids, and allocate customers for certain generic drugs”.57 In two subsequent 2017
54 To our knowledge, prior to 2016, the following cases had resulted in guilty pleas by, or convictions of, executives of pharmaceutical manufacturers: 1) 2007: Three executives from Purdue Pharma pleaded guilty to deceiving doctors and patients about the risks of the lucrative painkiller Oxycontin and paid a total of $34.5 million in fines. 2) 2009: Former InterMune CEO Scott Harkonen was convicted for approving a press release that advertised one of the company’s drugs, Actimmune, for off-label uses, for which he was sentenced to six months of home confinement and forced to pay a $20,000 fine; 3) 2009: Thomas Farina and Mary Holloway, both sales representatives at Pfizer, were convicted for promoting the painkiller Bextra for off-label uses, for which Farina was sentenced to six months of home confinement and Holloway to two years’ probation and a $75,000 fine; 4) 2011: Former KV Pharmaceuticals CEO Marc Hermelin pleaded guilty to two misdemeanors under the FDCA and was ordered to pay $1.9 million in fines and forfeitures and sentenced to 30 days (of which he served 15) in prison for failing to report that some of his company’s tablets were oversized and possibly dangerous. Sources, respectively: Meier B. In Guilty Plea, OxyContin Maker to Pay $600 Million. New York Times. May 10, 2007. http://www.nytimes.com/2007/05/10/business/11drug-web.html; Stohr G. Ex-InterMune CEO Harkonen's Conviction Let Stand by Court. Bloomberg Business. December 16, 2013. http://www.bloomberg.com/news/articles/2013-12-16/ex-intermune-ceo-harkonen-s-conviction-let-stand-by-court; Edwards J. Pfizer Exec Gets 6 Months' Home Confinement for Off-Label Bextra Sales. CBS. July 20, 2009. http://www.cbsnews.com/news/pfizer-exec-gets-6-months-home-confinement-for-off-label-bextra-sales/; Department of Justice. News Release: Former Drug Company Executive Pleads Guilty in Oversized Drug Tablets Case. March 10, 2011. http://www.justice.gov/opa/pr/former-drug-company-executive-pleads-guilty-oversized-drug-tablets-case; and: In the Court of Chancery of the State of Delaware. Marc S. Hermelin vs. K-V Pharmaceutical Company. Civil Action No. 6936-VCG. Opinion decided February 7, 2012. http://courts.delaware.gov/opinions/download.aspx?ID=168260. All sources accessed February 24, 2018. 55 Department of Justice, U.S. Attorney’s Office, District of Massachusetts. Pharmaceutical Executives Charged in Racketeering Scheme. December 8, 2016. https://www.justice.gov/usao-ma/pr/pharmaceutical-executives-charged-racketeering-scheme. Accessed February 24, 2018. 56 Department of Justice, U.S. Attorney’s Office, District of Massachusetts. Founder and Owner of Pharmaceutical Company Insys Arrested and Charged with Racketeering. October 26, 2017. https://www.justice.gov/usao-ma/pr/founder-and-owner-pharmaceutical-company-insys-arrested-and-charged-racketeering. Accessed February 24, 2018. 57 Department of Justice. Division Secures Individual and Corporate Guilty Pleas for Collusion Affecting Millions of American Consumers. Division Update, Spring 2017. https://www.justice.gov/atr/division-

Public Citizen Pharmaceutical Industry Settlements: 1991-2017
21
settlements, the two executives agreed to cooperate with an ongoing multi-state investigation into the collusion, paying only $25,000 each in civil fines to the states as part of the settlements.58 These cases followed the 2015 indictments (shortly after the release of the DOJ’s Yates memorandum59) of former president Carl Reichel and other employees of Warner Chilcott (now owned by Teva60) for, among other charges, paying kickbacks to physicians to prescribe several of the company’s drugs.61 Reichel was acquitted of the kickback charges by a federal jury in June 2016,62 although his company had pleaded guilty to the same charges in a 2015 settlement.63 This example seems to offer another illustration of the difficulty that the federal government faces in holding executives accountable for even admitted wrongdoing by their companies.64
operations/division-update-spring-2017/division-secures-individual-and-corporate-guilty-pleas-collusion-industries-where-products. Accessed February 24, 2018. 58 Office of the Attorney General of Connecticut. AG Jepsen: States Reach Settlements, Cooperation Agreements with Two Former Executives in Generic Drug Multistate Investigation. May 24, 2017. http://members.naag.org/assets/files/Antitrust/files/05-24-2017%20CT%20Generic%20Drug%20Settlement%20with%20Individuals.pdf. Accessed February 26, 2018. 59 This memorandum to federal prosecutors, drafted by then-Deputy Attorney General Sally Yates, announced the DOJ’s intention to hold accountable a company’s employees, including corporate executives, who engage in criminal activities. Apuzzo A, Protess, B. Justice Department Sets Sights on Wall Street Executives. New York Times. September 9, 2015. http://www.nytimes.com/2015/09/10/us/politics/new-justice-dept-rules-aimed-at-prosecuting-corporate-executives.html. Accessed February 24, 2018. 60 Securities and Exchange Commission. Form 8-K: Warner Chilcott Limited. August 4, 2016. https://www.sec.gov/Archives/edgar/data/1620602/000119312516671899/d235481d8k.htm. Accessed February 24, 2018. 61 Department of Justice. Warner Chilcott Agrees to Plead Guilty to Felony Health Care Fraud Scheme and Pay $125 Million to Resolve Criminal Liability and False Claims Act Allegations. October 29, 2015. http://www.justice.gov/opa/pr/warner-chilcott-agrees-plead-guilty-felony-health-care-fraud-scheme-and-pay-125-million. Accessed February 24, 2018. 62 Silverman E. Former Drug Company Executive is Acquitted of Hatching a Kickback Scheme. STAT (Pharmalot). June 20, 2016. https://www.statnews.com/pharmalot/2016/06/20/drug-firm-executive-acquitted-kickback/. Accessed February 24, 2018. 63 Department of Justice. Warner Chilcott Agrees to Plead Guilty to Felony Health Care Fraud Scheme and Pay $125 Million to Resolve Criminal Liability and False Claims Act Allegations. October 29, 2015. http://www.justice.gov/opa/pr/warner-chilcott-agrees-plead-guilty-felony-health-care-fraud-scheme-and-pay-125-million. Accessed February 24, 2018. 64 It is worth noting that, in the Warner Chilcott case, the former employees were charged with participating directly in the illegal activities. The federal government also has the authority to prosecute pharmaceutical executives under the Park Doctrine, a legal precedent that holds company heads responsible for misconduct within their companies, even if they did not have direct knowledge about the specific unlawful acts in question. However, the federal government has been exceedingly reluctant to wield this authority. With the exception of the 2011 case of Marc Hermelin (see footnote 54), we are not aware of any executive of a pharmaceutical manufacturer who has been jailed under the Park Doctrine for overseeing fraudulent activity against the federal government. In 2017, in a decision that may bode well for the federal government’s chances of success in future Park Doctrine cases, the Supreme Court refused to hear a case of executives of a food company who were found guilty of wrongdoing under the Park Doctrine. Thomas JM. The Supreme Court Refuses to Hear Park Doctrine Case. FDA Law Blog (Hyman, Phelps & McNamara). http://www.fdalawblog.net/2017/05/the-supreme-court-refuses-to-hear-park-doctrine-case/. Accessed February 24, 2018.

Public Citizen Pharmaceutical Industry Settlements: 1991-2017
22
Given the seemingly high legal bar necessary to prosecute executives in court, the federal government can impose other penalties on company employees found to have engaged, directly or indirectly, in systematic wrongdoing. In his 2015 paper, Rodwin argues — correctly in our opinion — for legislation that would extend financial penalties to individuals within an offending firm, requiring those responsible for wrongdoing to “forfeit bonuses, stock options and other incentive compensation” to the federal and state governments.65 Financial sanctions against executives have been meted out only rarely and, with the exception of the 2007 Purdue settlement and the 2011 conviction of former KV Pharmaceuticals Chairman and Chief Executive Officer Marc Hermelin, have involved minuscule fines.66 All too often, even when the federal government successfully holds pharmaceutical companies to account for fraudulent activities, the settlements take place years after the wrongdoing occurred. In many cases, the executives and other employees who engaged in, and in some cases may have benefitted from, the fraud have long since moved on from the companies and thus suffer no personal consequences. It stands to reason, therefore, that holding accountable both current and former pharmaceutical executives and other employees who engaged in wrongdoing would deter the systemic fraud responsible for the wave of drug industry settlements over the past 27 years. In addition to stronger sanctions, Rodwin appropriately argues for more rigorous federal monitoring of pharmaceutical manufacturers in order to identify, and ultimately prevent, the sort of systemic fraud that has long been the norm.67 Such oversight is ostensibly the purpose of corporate integrity agreements (CIAs), which pharmaceutical companies enter into with the Department of Health and Human Services’ OIG as part of civil settlements, in exchange for OIG’s agreement not to exclude the companies from federal healthcare programs.68 The agreements require companies to reform their practices and submit annual reports to OIG documenting their newfound compliance. However, multiple companies, such as Pfizer and GlaxoSmithKline, have had repeat settlements while still under previous CIAs.69 Furthermore, the annual reports submitted by companies to OIG are not made public, and despite litigation to force the release of these records, OIG has withheld the bulk of them from public view.70 Rodwin argues that such reports should be made public and that “firms and the OIG [should] have the burden of proving that release of particular information
65 Rodwin MA. Do We Need Stronger Sanctions to Ensure Legal Compliance by Pharmaceutical Firms? Food and Drug Law Journal, 2015;70(3). 66 See footnote 54. 67 Rodwin MA. Do We Need Stronger Sanctions to Ensure Legal Compliance by Pharmaceutical Firms? Food and Drug Law Journal, Vol. 70, No. 3, Fall 2015. 68 Department of Health and Human Services, Office of Inspector General. Corporate Integrity Agreements. http://oig.hhs.gov/compliance/corporate-integrity-agreements/index.asp. Accessed February 24, 2018. 69 Wolfe SM. Escalating Criminal and Civil Violations: Pharma has Corporate Integrity? Not Really. BMJ. 2013;347:f7507. 70 See, e.g., Public Citizen v. Department of Health and Human Services. http://www.citizen.org/litigation/forms/cases/getlinkforcase.cfm?cID=752. Accessed February 23, 2018.
Public Citizen Pharmaceutical Industry Settlements: 1991-2017
23
would result in specific, significant harm to the firm.”71 He also argues for extending the duration of CIAs beyond the current five-year norm. Such moves would be critical in identifying fraud on a more real-time basis and, if combined with far stronger sanctions when systematic wrongdoing is identified, would go a long way toward changing the cost-benefit calculus that has made fraud effectively a business model within the pharmaceutical industry. Limitations and future research Several factors limit the current study, as was similarly the case in the earlier versions. Due to the reliance on publicly available governmental press releases, this data set may not be complete and therefore possibly understates the extent of criminal and civil violations by the pharmaceutical industry. To our knowledge, there is still no official, comprehensive, publicly available source for all state and federal government actions taken against pharmaceutical companies. The lack of such a source is especially important at the state level, as certain states that did not publicize settlements online, or that did not have adequate websites to review, may have been underrepresented in individual state tallies. In addition, the study does not and cannot reflect real-time trends in unlawful behavior by companies, as alleged violations typically precede a settlement’s conclusion by several years. Given this lag time, and the fact that the current study encompassed only two years of additional data, long-term trends in illegal activity and enforcement actions cannot be gleaned from this report. That said, the continued low levels, during the past two years, of the number and size of settlements, especially criminal penalties and those resulting from DOJ investigations, is worrisome. Future research could begin to quantify the harm to patients resulting from the fraudulent activities described in the settlements. Off-label promotion and concealing vital study data, in particular, expose patients to the risks of drugs that may have little to no benefit for their condition.
Conclusion The number and size of federal and state settlements against the pharmaceutical industry remained low in 2016 and 2017, with federal criminal penalties nearly disappearing. Financial penalties continued to pale in comparison to company profits, with the $38.6 billion in penalties from 1991 through 2017 amounting to only 5% of the $711 billion in net profits made by the 11 largest global drug companies during just 10 of those 27 years (2003-2012). To our knowledge, a parent company has never been excluded from participation in Medicare and Medicaid for illegal activities, which endanger the public health and deplete taxpayer-funded programs. Criminal prosecutions of executives leading companies
71 Rodwin MA. Do We Need Stronger Sanctions to Ensure Legal Compliance by Pharmaceutical Firms? Food and Drug Law Journal, Vol. 70, No. 3, Fall 2015.

Public Citizen Pharmaceutical Industry Settlements: 1991-2017
24
engaged in these illegal activities have been extremely rare. Much larger penalties and successful prosecutions of company executives that oversee systemic fraud, including jail sentences if appropriate, are necessary to deter future unlawful behavior. Otherwise, these illegal but profitable activities will continue to be part of companies’ business model.

Public Citizen Pharmaceutical Industry Settlements: 1991-2017
25
Appendix 1: Figures and Tables Figure 1. Number of Pharmaceutical Industry Settlements, 1991 – 2017
*Since the publication of the 2016 report, an additional federal, non-qui-tam settlement with Syncor, in 2002 for $2.5 million ($0.5 million civil penalty; $2 million criminal penalty) for kickbacks, was found and added to the database.
1 1 12
31 1
3 32 3
98 8
10
14
26
36
4244
57
60
21
1817
21
0
10
20
30
40
50
60
70
Nu
mb
er
of
Sett
lem
en
ts
YearSource: Public Citizen, Twenty-Seven Years of Pharmaceutical Industry Criminal and Civil Penalties: 1991-2017. See full report at: https://www.citizen.org/our-work/health-and-safety/pharmaceutical-industry-penalties

Public Citizen Pharmaceutical Industry Settlements: 1991-2017
26
Figure 2. Pharmaceutical Industry Financial Penalties, 1991 – 2017
* Since the publication of the 2016 report, an additional federal, non-qui-tam settlement with Syncor, in 2002 for $2.5 million ($0.5 million civil penalty; $2 million criminal penalty) for kickbacks, was found and added to the database. **An additional multi-state settlement, reached in 2016 with Teva’s Cephalon subsidiary for monopoly practices, involved a $125 million civil monetary fine. However, the entirety of this fine was paid from a previous (2015) $1.2 billion civil settlement payment by Teva’s Cephalon subsidiary to the federal government. Because this $1.2 billion federal financial penalty already was included in our database, we did not include the $125 million multi-state settlement payment so as not to count Teva’s settlement payment twice.
10 22 1 10 7 4 3100
489
889
552
967 9991067
3976
14411429
4412 4339
2338
6348
3500
642
2208
1592
1304
0
1000
2000
3000
4000
5000
6000
7000
Fin
an
cia
l P
en
alt
ies (
$ m
illi
on
s)
YearSource: Public Citizen, Twenty-Seven Years of Pharmaceutical Industry Criminal and Civil Penalties: 1991-2017. See full report at: https://www.citizen.org/our-work/health-and-safety/pharmaceutical-industry-penalties

Public Citizen Pharmaceutical Industry Settlements: 1991-2017
27
Figure 3. Number of Pharmaceutical Industry Settlements, 1991 –2017: Federal vs. State*
*State settlements refer to those in which the federal government neither was involved in the investigation responsible for the settlement nor was a party to the final settlement, as determined through a review of the press release and, when available, the official settlement document. All other cases were classified as federal, including joint federal-state cases (e.g., those involving Medicaid). **Since the publication of the 2016 report, an additional federal, non-qui-tam settlement with Syncor, in 2002 for $2.5 million ($0.5 million civil penalty; $2 million criminal penalty) for kickbacks, was found and added to the database.
1 1 1 12
12 2 2
3
86
53
108
10
1816
1210
8
1113
16
1 1 1 1 1 12
3
7
4
18
2624
28
45
50
13
7
45
0
10
20
30
40
50
60
Nu
mb
er
of
Sett
lem
en
ts
Year
Federal
State
Source: Public Citizen, Twenty-Seven Years of Pharmaceutical Industry Criminal and Civil Penalties: 1991-2017. See full report at: https://www.citizen.org/our-work/health-and-safety/pharmaceutical-industry-penalties

Public Citizen Pharmaceutical Industry Settlements: 1991-2017
28
Figure 4. Pharmaceutical Industry Financial Penalties, 1991 –2017: Federal vs. State*
*State settlements refer to those in which the federal government neither was involved in the investigation responsible for the settlement nor was a party to the final settlement, as determined through a review of the press release and, when available, the official settlement document. All other cases were classified as federal, including joint federal-state cases (e.g., those involving Medicaid). ** Since the publication of the 2016 report, an additional federal, non-qui-tam settlement with Syncor, in 2002 for $2.5 million ($0.5 million civil penalty; $2 million criminal penalty) for kickbacks, was found and added to the database. ***An additional state settlement, reached in 2016 with Teva’s Cephalon subsidiary for monopoly practices, involved a $125 million civil monetary fine. However, the entirety of this fine was paid from a previous (2015) $1.2 billion settlement payment by Teva’s Cephalon subsidiary to the federal government. Because this $1.2 billion financial penalty already was included in our database, we did not include the $125 million settlement payment so as not to count Teva’s settlement payment twice.
10 22 1 8 5 4 58
404
889
552
961 9601045
3872
1410
1122
4002
3812
1712
5555
3123
356
2071
1565
1249
2 2 3 42 856 39 23
10432
307410
527625
793
377
287137
27 55
0
1000
2000
3000
4000
5000
6000
Fin
an
cia
l P
en
alt
ies (
$ m
illi
on
s)
Year
Federal (F)
State (S)
Source: Public Citizen, Twenty-Seven Years of Pharmaceutical Industry Criminal and Civil Penalties: 1991-2017. See full report at: https://www.citizen.org/our-work/health-and-safety/pharmaceutical-industry-penalties

Public Citizen Pharmaceutical Industry Settlements: 1991-2017
29
Figure 5. Number of State Pharmaceutical Industry Settlements, 1991 –2017: Multi-State vs. Single-State*
*Single-state settlements were those in which only one state was a party to the final settlement, as gleaned from the information provided in the press release. All other state settlements were classified as multi-state.
1 1 1 1 1 1 1
32
43
23
5
2 21
2 21 1
24
2
14
2322
25
40
48
11
6
23
0
10
20
30
40
50
60
Nu
mb
er
of
Sett
lem
en
ts
Year
Multi-state
Single-state
Source: Public Citizen, Twenty-Seven Years of Pharmaceutical Industry Criminal and Civil Penalties: 1991-2017. See full report at: https://www.citizen.org/our-work/health-and-safety/pharmaceutical-industry-penalties

Public Citizen Pharmaceutical Industry Settlements: 1991-2017
30
Figure 6. State Pharmaceutical Industry Financial Penalties, 1991 –2017: Multi-State vs. Single-State*
*Single-state settlements were those in which only one state was a party to the final settlement, as gleaned from the information provided in the press release. All other state settlements were classified as multi-state. **An additional multi-state settlement, reached in 2016 with Teva’s Cephalon subsidiary for monopoly practices, involved a $125 million civil monetary fine. However, the entirety of this fine was paid from a previous (2015) $1.2 billion settlement payment by Teva’s Cephalon subsidiary to the federal government. Because this $1.2 billion federal financial penalty already was included in our database, we did not include the $125 million multi-state settlement payment so as not to count Teva’s settlement payment twice.
2 2 3
42
6
36
10
88
28
186
63
192
228
417
12
140
71
20**
47
85
3
13 164
121
347335
397
376365
147
66
8 8
0
50
100
150
200
250
300
350
400
450
Fin
an
cia
l P
en
alt
ies (
$ m
illi
on
s)
Year
Multi-state
Single-state
Source: Public Citizen, Twenty-Seven Years of Pharmaceutical Industry Criminal and Civil Penalties: 1991-2017. See full report at: https://www.citizen.org/our-work/health-and-safety/pharmaceutical-industry-penalties

Public Citizen Pharmaceutical Industry Settlements: 1991-2017
31
Table 1. Single-state Settlement Totals, 1991 –2017
*Calculated by dividing single-state financial penalties (“Total Financial Penalties" column) from October 10, 2000 (FY 2001; the earliest single-state settlement) through 2017 by each state’s Medicaid prescription drug expenditures from FY 2001 through FY 2015 (the most recent year for which data were available from Medicaid’s website with Form 64 data). These figures are merely an approximation, as there is usually a several-year lag between any prescription drug expenditures involved in the fraudulent activity alleged in the settlement and the date on which that settlement is finalized. **Unlike the case of multi-state settlements, financial penalties obtained through single-state settlements presented in this table represent, to our knowledge, a comprehensive list of such penalties. ***Return on Investment (ROI) was calculated by dividing single-state financial penalties (“Total Financial Penalties“ column) from October 10, 2000 (the earliest single-state settlement) through 2017, by the state's total Medicaid Fraud Control Unit (MFCU) budgets from FY 2006 (the earliest year for which data are available) through FY 2017 as obtained from the National Association of Medicaid Fraud Control Units (NAMFCU) 2006-2017 surveys at http://www.namfcu.net/statistical-surveys.php. Only three single-state settlements were finalized prior to FY 2006 (one in CA for $85 million, and two in NY and CT, each for $2.5 million). These ROIs are merely an approximation, as all enforcement activities may not have been conducted by state MFCUs, and there is usually a several-year lag between the time an investigation is initiated and a settlement is finalized. ****False Claims Act (FCA) as of FY 2017, as determined from the NAMFCU 2017 survey (see Appendix 2). Values in red signify that the FCA is Deficit Reduction Act (DRA)-compliant, with strong qui-tam provisions. Note that settlements may have been finalized prior to the enactment of the state’s FCA.
State Recoveries per $1,000
Medicaid prescription
drug expenditures*
Total Financial
Penalties
($ millions)**
Number of
Settlements and
Judgments
ROI (dollars recovered
per enforcement dollar
spent)***
FCA as of
2017****
Hawaii $147.09 $83.75 2 $5.44 Y
New Mexico $89.07 $34.10 2 $1.31 Y
South Carolina $47.64 $169.00 2 $9.66 Y
Texas $35.96 $584.10 19 $2.41 Y
Louisiana $35.89 $298.84 55 $4.45 Y
Pennsylvania $33.85 $163.90 8 $2.16
Idaho $32.65 $38.10 16 $4.54
Kentucky $28.39 $138.54 20 $4.22
Mississippi $26.61 $112.80 14 $3.35
Alabama $24.19 $124.25 9 $10.02
Alaska $18.97 $15.00 1 $1.18 Y
Utah $18.08 $28.50 3 $1.30 Y
West Virginia $14.80 $44.50 2 $2.54 Y
Wisconsin $8.41 $46.25 6 $2.45 Y
Nevada $8.38 $9.50 1 $0.45 Y
Montana $7.84 $5.90 1 $0.67 Y
Massachusetts $7.53 $50.60 9 $0.89 Y
Connecticut $5.64 $27.60 2 $1.55 Y
California $5.61 $163.30 3 $0.42 Y
New Hampshire $4.40 $3.40 1 $0.35 Y
Oregon $4.13 $7.99 5 $0.38 Y
Maryland $4.06 $15.00 1 $0.37 Y
Missouri $3.87 $37.00 3 $1.42 Y
Kansas $3.72 $5.70 2 $0.38 Y
North Carolina $2.11 $25.93 2 $0.40 Y
Iowa $1.58 $4.30 2 $0.33 Y
Illinois $1.56 $18.50 3 $0.14 Y
Ohio $1.26 $12.44 2 $0.15
Florida $1.13 $15.00 2 $0.06 Y
New Jersey $0.22 $1.30 1 $0.02 Y
New York $0.19 $5.58 5 $0.01 Y
Total / Median $7.84 [median] $2,290.67 204 $ 1.18 [median] 25/31

Public Citizen Pharmaceutical Industry Settlements: 1991-2017
32
Table 2. Multi-state Settlement Totals, 1991 –2017
*Financial penalties include an incomplete sample ($909 million, or 57%) of financial penalties from multi-state settlements i.e. only individual state settlement shares that were publicly available in press releases over the time period. Therefore, state performance in multi-state settlement activity is driven by the number of settlements, not the financial penalties, attributed to each state in this table. Some states (Minnesota, North Dakota, Oklahoma, South Carolina, Alabama, and Wyoming) had no individual state shares listed in press releases, explaining the “0” value for financial penalties. **FCA as of FY 2017, as determined from the NAMFCU 2017 survey (see Appendix 2). Values in red signify that the FCA is Deficit Reduction Act (DRA)-compliant, with strong qui-tam provisions. In some cases, settlements may have been finalized prior to the enactment of an FCA.
State Number of
Settlements
and
Judgments
Verifiable
Financial
Penalties
($ millions)*
FCA** State Number of
Settlements
and
Judgments
Verifiable
Financial
Penalties
($ millions)*
FCA**
Arizona 32 $25.25 New Jersey 24 $31.90 Y
Florida 32 $66.17 Y South Dakota 24 $13.24 Y
Texas 32 $109.95 Y Delaware 23 $13.54 Y
Massachusetts 31 $26.12 Y Hawaii 23 $1.18 Y
North Carolina 31 $39.96 Y Nebraska 23 $3.69 Y
Vermont 31 $19.06 Y Minnesota 22 $0.00 Y
California 30 $51.45 Y North Dakota 22 $0.00
Maryland 30 $11.12 Y Colorado 21 $15.70 Y
Wisconsin 30 $17.46 Y Kentucky 21 $11.06
Illinois 29 $51.45 Y New Mexico 21 $4.81 Y
Nevada 29 $17.19 Y Rhode Island 20 $10.50 Y
Tennessee 29 $27.05 Y Montana 19 $4.48 Y
Washington 29 $25.21 Y Oklahoma 18 $0.00 Y
District of Columbia 28 $14.92 Y South Carolina 18 $0.00 Y
Michigan 28 $8.89 Y Indiana 17 $17.98 Y
New York 28 $56.14 Y Alabama 16 $0.00
Ohio 28 $29.76 West Virginia 16 $1.85 Y
Connecticut 27 $14.44 Y Virginia 15 $10.22 Y
Pennsylvania 27 $35.56 Louisiana 13 $2.94 Y
Missouri 26 $22.03 Y Alaska 12 $2.86 Y
Oregon 26 $33.21 Y Mississippi 12 $1.12
Arkansas 25 $9.60 Y New Hampshire 12 $5.00 Y
Idaho 25 $15.64 Utah 12 $1.65 Y
Iowa 25 $12.70 Y Georgia 10 $4.63 Y
Kansas 25 $0.70 Y Wyoming 8 $0.00 Y
Maine 25 $9.88 Y

Public Citizen Pharmaceutical Industry Settlements: 1991-2017
33
Table 3. Overall State Settlement Totals, 1991 –2017
*Financial penalties include an incomplete sample ($909 million, or 57%) of financial penalties from multi-state settlements i.e. only individual state settlement shares that were publicly available in press releases over the time period. Therefore, state performance in overall settlement activity is driven by the number of settlements, not the financial penalties, attributed to each state in this table. Some states (Minnesota, North Dakota, Oklahoma, and Wyoming) had neither individual state shares listed in press releases, nor any single-state settlements or judgments, explaining the “0” value for financial penalties. **FCA as of FY 2017, as determined from the NAMFCU 2017 survey (see Appendix 2). Values in red signify that the FCA is Deficit Reduction Act (DRA)-compliant, with strong qui-tam provisions. In some cases, settlements may have been finalized prior to the enactment of an FCA.
State Number of
Settlements
and
Judgments
Verifiable
Financial
Penalties
($ millions)*
FCA** State Number of
Settlements
and
Judgments
Verifiable
Financial
Penalties
($ millions)*
FCA**
Louisiana 68 $301.78 Y Mississippi 26 $113.92
Texas 51 $694.05 Y New Jersey 25 $33.20 Y
Idaho 41 $53.74 Maine 25 $9.88 Y
Kentucky 41 $149.60 Arkansas 25 $9.60 Y
Massachusetts 40 $76.72 Y Hawaii 25 $84.93 Y
Wisconsin 36 $63.71 Y Alabama 25 $124.25
Pennsylvania 35 $199.46 South Dakota 24 $13.24 Y
Florida 34 $81.17 Y Delaware 23 $13.54 Y
New York 33 $61.72 Y New Mexico 23 $38.91 Y
California 33 $214.75 Y Nebraska 23 $3.69 Y
North Carolina 33 $65.89 Y Minnesota 22 $0 Y
Illinois 32 $69.95 Y North Dakota 22 $0
Arizona 32 $25.25 Colorado 21 $15.70 Y
Oregon 31 $41.20 Y Rhode Island 20 $10.50 Y
Vermont 31 $19.06 Y Montana 20 $10.38 Y
Maryland 31 $26.12 Y South Carolina 20 $169.00 Y
Ohio 30 $42.20 West Virginia 18 $46.35 Y
Nevada 30 $26.69 Y Oklahoma 18 $0 Y
Tennessee 29 $27.05 Y Indiana 17 $17.98 Y
Washington 29 $25.21 Y Virginia 15 $10.22 Y
Missouri 29 $59.03 Y Utah 15 $30.15 Y
Connecticut 29 $42.04 Y New Hampshire 13 $8.40 Y
District of Columbia 28 $14.92 Y Alaska 13 $17.86 Y
Michigan 28 $8.89 Y Georgia 10 $5 Y
Iowa 27 $17.00 Y Wyoming 8 $0 Y
Kansas 27 $6.40 Y

Public Citizen Pharmaceutical Industry Settlements: 1991-2017
34
Figure 7. Number of Pharmaceutical Industry Settlements, 1991 – 2017: Civil vs. Criminal*
*“Civil” refers to all solely civil settlements. “Civil-Criminal” refers to settlements with both a civil and criminal financial penalty. “Criminal” refers to cases with only a criminal component. All criminal and civil-criminal settlements were federal. ** Since the publication of the 2016 report, an additional federal, non-qui-tam, civil-criminal settlement with Syncor, in 2002 for $2.5 million ($0.5 million civil penalty; $2 million criminal penalty) for kickbacks, was found and added to the database. *** The civil and criminal counts displayed for 2011 differ slightly from the values presented in the March 31, 2016 report. This is because a 2011 civil settlement between Johnson and Johnson and the federal Securities and Exchange Commission was misclassified as a criminal settlement. It has now been corrected.
12
31
3 31
2
86 6
910
25
3234
40
52
55
20
1715
19
1 1 1 12 2
13
13
7
24
5
1 1 121 1 1 1 1
21 1
0
10
20
30
40
50
60
Nu
mb
er
of
Sett
lem
en
ts
Year
Civil
Civil-Criminal
Criminal
Source: Public Citizen, Twenty-Seven Years of Pharmaceutical Industry Criminal and Civil Penalties: 1991-2017. See full report at: https://www.citizen.org/our-work/health-and-safety/pharmaceutical-industry-penalties

Public Citizen Pharmaceutical Industry Settlements: 1991-2017
35
Figure 8. Pharmaceutical Industry Financial Penalties, 1991 –2017: Civil vs. Criminal*
*All criminal penalties were federal. In mixed civil-criminal settlements, the civil and criminal portions were separated out and added to their corresponding categories here. ** Since the publication of the 2016 report, an additional federal, non-qui-tam, civil-criminal settlement with Syncor, in 2002 for $2.5 million ($0.5 million civil penalty; $2 million criminal penalty) for kickbacks, was found and added to the database. *** The civil and criminal penalties displayed for 2011 differ slightly from the values presented in the March 31, 2016 report. This is because a 2011 civil settlement between Johnson and Johnson and the federal Securities and Exchange Commission, for $48.6 million, was misclassified as a criminal settlement. It has now been corrected. ****A civil, multi-state settlement, reached in 2016 with Teva’s Cephalon subsidiary for monopoly practices, involved a $125 million civil monetary fine. However, the entirety of this fine was paid from a previous (2015) $1.2 billion civil settlement payment by Teva’s Cephalon subsidiary to the federal government. Because this $1.2 billion federal civil financial penalty already was included in our database, we did not include the $125 million multi-state civil settlement payment so as not to count any portion of Teva’s federal settlement payment twice.
22 10 7 1 3100
489599 550
903
706
918
3796
903
1379
2466
3327
1901
4482
2676
622
2185
1298 1281
10 1 3
290
264
293
149 180
538
50
1946
1012
437
1866
825
21 23
294
23
0
500
1000
1500
2000
2500
3000
3500
4000
4500
5000
Fin
an
cia
l P
en
alt
ies (
$ m
illi
on
s)
Year
Civil (Cv)
Criminal (Cr)
Source: Public Citizen, Twenty-Seven Years of Pharmaceutical Industry Criminal and Civil Penalties: 1991-2017. See full report at: https://www.citizen.org/our-work/health-and-safety/pharmaceutical-industry-penalties

Public Citizen Pharmaceutical Industry Settlements: 1991-2017
36
Figure 9. Federal False Claims Act (FCA): Financial Penalties by Industry, Fiscal Year (FY) 1991 –2017*
*Defense values for FYs 2006-2008 and 2011-2015 have been revised by the U.S. Department of Justice since the publication of the 2016 version of this report. The revised values are presented here. Pharmaceutical totals include only those cases in which the federal portion of the FCA penalty was specified in the press release or in the original settlement document.
285
191113
593
251
14067
221
46
149 136
34
312
32
120
641
53
137
439
267
143 170
52 75
283
122
220
10
560
16184
140
465
599634
1162
961888
2645
1203
974
36
923
622
0
500
1000
1500
2000
2500
3000
Fin
an
cia
l P
en
alt
ies (
$ m
illi
on
s)
Fiscal Year
Defense
Pharmaceutical
Source: Public Citizen, Twenty-Seven Years of Pharmaceutical Industry Criminal and Civil Penalties: 1991-2017. See full report at: https://www.citizen.org/our-work/health-and-safety/pharmaceutical-industry-penalties
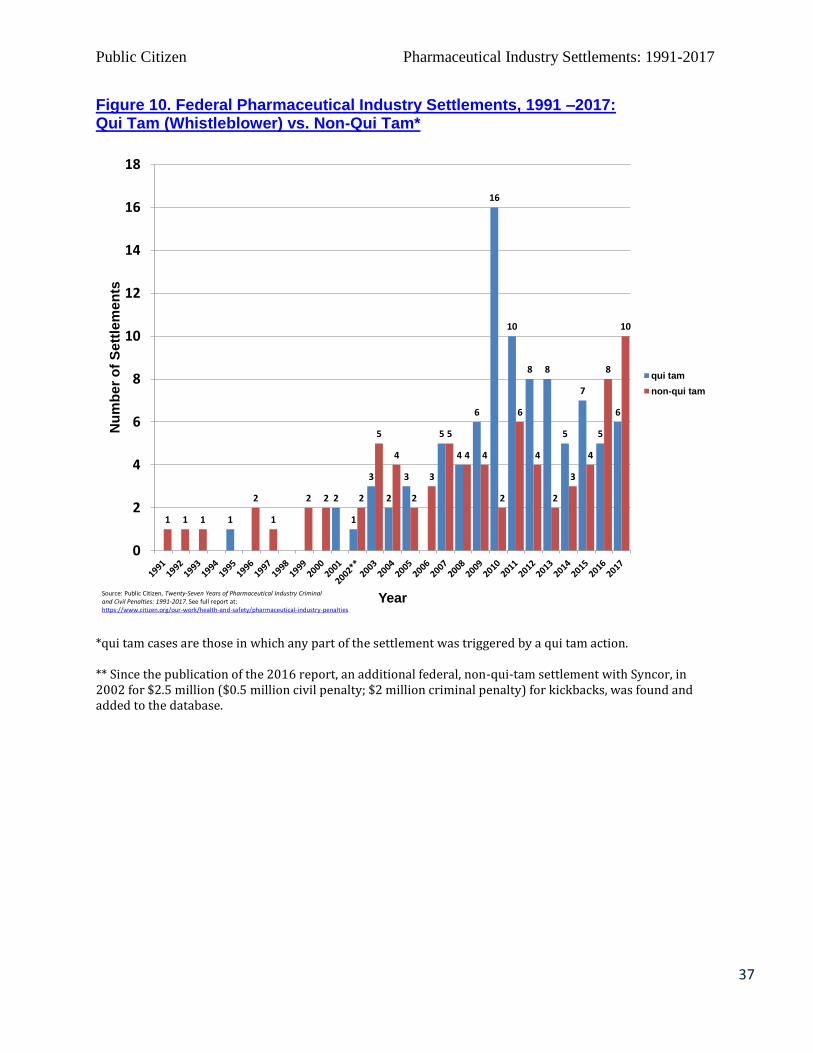
Public Citizen Pharmaceutical Industry Settlements: 1991-2017
37
Figure 10. Federal Pharmaceutical Industry Settlements, 1991 –2017: Qui Tam (Whistleblower) vs. Non-Qui Tam*
*qui tam cases are those in which any part of the settlement was triggered by a qui tam action. ** Since the publication of the 2016 report, an additional federal, non-qui-tam settlement with Syncor, in 2002 for $2.5 million ($0.5 million civil penalty; $2 million criminal penalty) for kickbacks, was found and added to the database.
1
2
1
3
2
3
5
4
6
16
10
8 8
5
7
5
6
1 1 1
2
1
2 2 2
5
4
2
3
5
4 4
2
6
4
2
3
4
8
10
0
2
4
6
8
10
12
14
16
18
Nu
mb
er
of
Sett
lem
en
ts
Year
qui tam
non-qui tam
Source: Public Citizen, Twenty-Seven Years of Pharmaceutical Industry Criminal and Civil Penalties: 1991-2017. See full report at: https://www.citizen.org/our-work/health-and-safety/pharmaceutical-industry-penalties

Public Citizen Pharmaceutical Industry Settlements: 1991-2017
38
Figure 11. Federal Pharmaceutical Industry Financial Penalties, 1991 –2017: Qui Tam (Whistleblower) vs. Non-Qui Tam*
*qui tam cases are those in which any part of the settlement was triggered by a qui tam action. Financial penalties in qui tam settlements presented here include all penalties, including any penalties that may not have been obtained as a result of a qui tam action. ** Since the publication of the 2016 report, an additional federal, non-qui-tam settlement with Syncor, in 2002 for $2.5 million ($0.5 million civil penalty; $2 million criminal penalty) for kickbacks, was found and added to the database.
8
889
49
700775
978 746
1102
38533703
562
5410
3119
328
622
980865
10 22 1 5 4 58
404503
262185
67
3872
663
21149 109
1151
1444 28
1449
585
384
0
1000
2000
3000
4000
5000
6000
Fin
an
cia
l P
en
alt
ies (
$ m
illi
on
s)
Year
qui tam
non-qui tam

Public Citizen Pharmaceutical Industry Settlements: 1991-2017
39
Figure 12. State Pharmaceutical Industry Settlements, 1991 –2017: Qui Tam (Whistleblower) vs. Non-Qui Tam*
*qui tam cases are those in which any part of the settlement was triggered by a qui tam action.
1 1 12
4
2 2
4
1 1 1 1 1 12 2
6
4
17
24
20
26
43
46
13
7
45
0
5
10
15
20
25
30
35
40
45
50
Nu
mb
er
of
Sett
lem
en
ts
Year
qui tam
non-qui tam
Source: Public Citizen, Twenty-Seven Years of Pharmaceutical Industry Criminal and Civil Penalties: 1991-2017. See full report at: https://www.citizen.org/our-work/health-and-safety/pharmaceutical-industry-penalties

Public Citizen Pharmaceutical Industry Settlements: 1991-2017
40
Figure 13. State Pharmaceutical Industry Financial Penalties, 1991 –2017: Qui Tam (Whistleblower) vs. Non-Qui Tam*
*qui tam cases are those in which any part of the settlement was triggered by a qui tam action. Financial penalties in qui tam settlements presented here include all penalties, including any penalties not obtained as a result of a qui tam action. **An additional non-qui-tam multi-state settlement, reached in 2016 with Teva’s Cephalon subsidiary for monopoly practices, involved a $125 million civil monetary fine. However, the entirety of this fine was paid from a previous (2015) $1.2 billion non-qui-tam settlement payment by Teva’s Cephalon subsidiary to the federal government. Because this $1.2 billion federal financial penalty already was included in our database, we did not include the $125 million state non-qui-tam settlement payment so as not to count Teva’s settlement payment twice.
109
28 30
242
203215
56
2 2 3
42
85
6
39
13
95
32
279
380
285
423
578
321
287
137
27
55
0
100
200
300
400
500
600
700
Fin
an
cia
l P
en
alt
ies (
$ m
illi
on
s)
Year
qui tam
non-qui tam

Public Citizen Pharmaceutical Industry Settlements: 1991-2017
41
Table 4. Pharmaceutical Company Penalties: Worst Offenders, 1991-2017
*Parent company at time of settlement. If company is non-existent now, name at time of most recent settlement was used. **Percent of $38.647 billion in overall penalties.
Company* Total Financial
Penalties
($ millions)
Percent of
Total**
Number of
Settlements***
GlaxoSmithKline $7,901 20.4% 32
Pfizer $4,728 12.2% 34
Johnson & Johnson $2,857 7.4% 20
Teva $1,990 5.1% 16
Merck & Co. $1,840 4.8% 22
Abbott $1,840 4.8% 16
Eli Lilly $1,742 4.5% 15
Schering-Plough $1,339 3.5% 6
Novartis $1,275 3.3% 21
Mylan $1,180 3.1% 22
AstraZeneca $1,035 2.7% 13
Amgen $901 2.3% 12
TAP $875 2.3% 1
Bristol-Myers Squibb $815 2.1% 14
Serono $704 1.8% 1
Purdue $646 1.7% 5
Allergan $601 1.6% 2
Daiichi Sankyo $586 1.5% 8
Boehringer Ingelheim $441 1.1% 16
Cephalon $425 1.1% 1
Other**** $4,100 10.6% 196
Total $37,822 97.9% 473

Public Citizen Pharmaceutical Industry Settlements: 1991-2017
42
***Total (473) listed here is greater than the total number of settlements over the 1991 - 2017 time period (412) as 19 settlements involved more than one company. ****Other companies (in order of total penalties paid): Actavis; Forest; Sanofi; Bayer; Celgene; Endo; Par; United Therapeutics; Elan; King; Mallinckrodt; Novo Nordisk; Watson; Merck KGAA; Shire; UCB; Salix; Genentech; KV; BASF; CareFusion; Novelion Therapeutics (Aegerion); Baxter; InterMune; AkzoNobel; BTG (Biocompatibles); Biovail; Bausch+Lomb; DFB; Glenmark Generics; Hi-Tech Pharmacal; Hoffman-La Roche; Sun; Sandoz; Jazz; B. Braun Melsungen; SciClone; Eisai; Victory; Bolar; Dava; Takeda; Cell Therapeutics; Hikma; Medicis; Insys; Astellas; Upsher-Smith; Galena Biopharma; Modern Wholesale Drug Midwest; Warner Chilcott; Barr; Perrigo; Taro; The Harvard Drug Group; Otsuka; Apotex; AVEO; Warner-Lambert; Cypress; Circa; Alpharma; Syncor; Dainippon Sumitomo; Ferring; Pernix; Shionogi; Wockhardt; Lupin; Gilead; Valeant; Andrx; Aventis; Chinook; Crown Laboratories; Evonik; Lonza; Mitsubishi Tanabe; Mitsui; Nepera; Provectus; Solvay; Sumitomo; Vertellus.

Public Citizen Pharmaceutical Industry Settlements: 1991-2017
43
Table 5. Pharmaceutical Company Penalties: Repeat Offenders, 1991-2017*
*Companies with at least two federal settlements from 1991-2017. Note that this is an underestimate of the number of repeat offenders/offenses, as it excludes state settlements involving separate allegations of fraud than those resolved in federal settlements. State settlements were excluded from these tallies because some state settlements (which could not be consistently distinguished based on the limited information in press releases) resolved the same alleged fraudulent activities as those addressed in one or more federal settlements.
Company** Number of
Federal
Settlements
Total Federal
Financial
Penalties
($ millions)
Percent of
Total***
Pfizer 14 $4,416 12.7%
GlaxoSmithKline 9 $7,413 21.3%
Novartis 9 $1,150 3.3%
Bristol-Myers Squibb 8 $747 2.1%
Teva 7 $1,770 5.1%
Merck 7 $1,662 4.8%
Johnson & Johnson 6 $2,246 6.5%
AstraZeneca 6 $936 2.7%
Schering-Plough 5 $1,308 3.8%
Abbott 4 $1,687 4.9%
Mylan 4 $1,012 2.9%
Sanofi 4 $328 0.9%
Novo Nordisk 4 $95 0.3%
Eli Lilly 3 $1,480 4.3%
Amgen 3 $802 2.3%
Daiichi Sankyo 3 $539 1.6%
Bayer 3 $291 0.8%
Endo 3 $232 0.7%
Mallinckrodt 3 $139 0.4%
Hoffman-La Roche 3 $20 0.1%
Others**** 34 (17 different
companies)
$1,586 4.6%
Total 142 $29,858 85.9%

Public Citizen Pharmaceutical Industry Settlements: 1991-2017
44
**Parent company at time of settlement. If company is non-existent now, name at time of most recent settlement was used. ***Percent of $34.766 billion in overall federal penalties. ****Other repeat offenders, all with two federal settlements (in order of total penalties paid): Boehringer Ingelheim; Forest; Par; King; Actavis; Watson; Merck KGAA; UCB; KV; Novelion Therapeutics (Aegerion); Biovail; Bolar; Eisai; Astellas; Perrigo; Alpharma; Aventis.

Public Citizen Pharmaceutical Industry Settlements: 1991-2017
45
Table 6. Twenty Largest Settlements and Judgments, 1991 –2017 (all federal)
*Violations include those alleged in civil settlements, as well as violations to which companies pleaded guilty, in criminal settlements. **If known from the press release; not necessarily a comprehensive list. ***Laws allegedly violated in civil settlements, or those to which companies pleaded guilty to violating in criminal settlements; not necessarily a comprehensive list. FCA (False Claims Act); FDCA (Food, Drug, and Cosmetic Act). ‡Qui tam refers to settlements initiated by whistleblowers. Ven-a-Care is the small pharmacy in the Florida Keys responsible for initiating some of the largest settlements against the pharmaceutical industry.
Company Total Penalty
($ millions)
Year Violation(s)* Major Drug Products Involved
(if applicable and known)**
Laws Violated (if
known)***
Qui
tam‡
GlaxoSmithKline $3,400 2006 Financial violations
GlaxoSmithKline $3,000 2012 Unlawful promotion; Kickbacks;
Concealing data; Overcharging govt.
health programs
Paxil; Wellbutrin; Advair; Lamictal;
Zofran; Imitrex; Lotronex; Flovent;
Valtrex; Avandia
FCA; FDCA Y
Pfizer $2,300 2009 Unlawful promotion ; Kickbacks Bextra; Geodon; Zyvox; Lyrica FCA; FDCA Y
Johnson & Johnson $2,006 2013 Unlawful promotion; Kickbacks;
Concealing data
Risperdal; Invega; Natrecor FCA; FDCA Y
Abbott $1,500 2012 Unlawful promotion; Kickbacks;
Concealing data
Depakote FCA; FDCA; Anti-
Kickback Statute
Y
Eli Lilly $1,415 2009 Unlawful promotion Zyprexa FCA; FDCA Y
Teva $1,200 2015 Monopoly practices Federal Trade
Commission Act
Merck $950 2011 Unlawful promotion Vioxx FCA; FDCA
TAP $875 2001 Overcharging govt. health programs;
Kickbacks
Lupron FCA; Anti-Kickback
Statute; Prescription
Drug Marketing Act
Y
Pfizer (Wyeth) $785 2016 Overcharging govt. health programs Protonix False Claims Act Y
Amgen $762 2012 Unlawful promotion; Kickbacks;
Overcharging govt. health programs
Aranesp; Enbrel; Neulasta FCA; FDCA Y
GlaxoSmithKline $750 2010 Poor manufacturing practices Kytril; Bactroban; Paxil CR;
Avandamet
FCA; FDCA Y
Serono $704 2005 Unlawful promotion; Kickbacks;
Monopoly practices
Serostim FCA Y
Merck $650 2008 Overcharging govt. health programs;
Kickbacks
Zocor; Vioxx; Pepcid FCA; Medicaid Rebate
Statute
Y
Purdue $600 2007 Unlawful promotion Oxycontin FCA
Allergan $600 2010 Unlawful promotion Botox FCA; FDCA Y
AstraZeneca $520 2010 Unlawful promotion; Kickbacks Seroquel FCA; Anti-Kickback
Statute
Y
Bristol-Myers Squibb $515 2007 Kickbacks; Unlawful promotion;
Overcharging govt. health programs
Abilify; Serzone FCA; FDCA Y (Ven-
a-Care)
Schering Plough $500 2002 Poor manufacturing practices FDA Current Good
Manufacturing Practices
Daiichi Sankyo $500 2013 Poor manufacturing practices;
Concealing data
Cefaclor; Cefadroxil; Amoxicillin;
Amoxicillin/Clavulanate; Sotret;
Gabapentin; Ciprofloxacin
FCA; FDCA Y
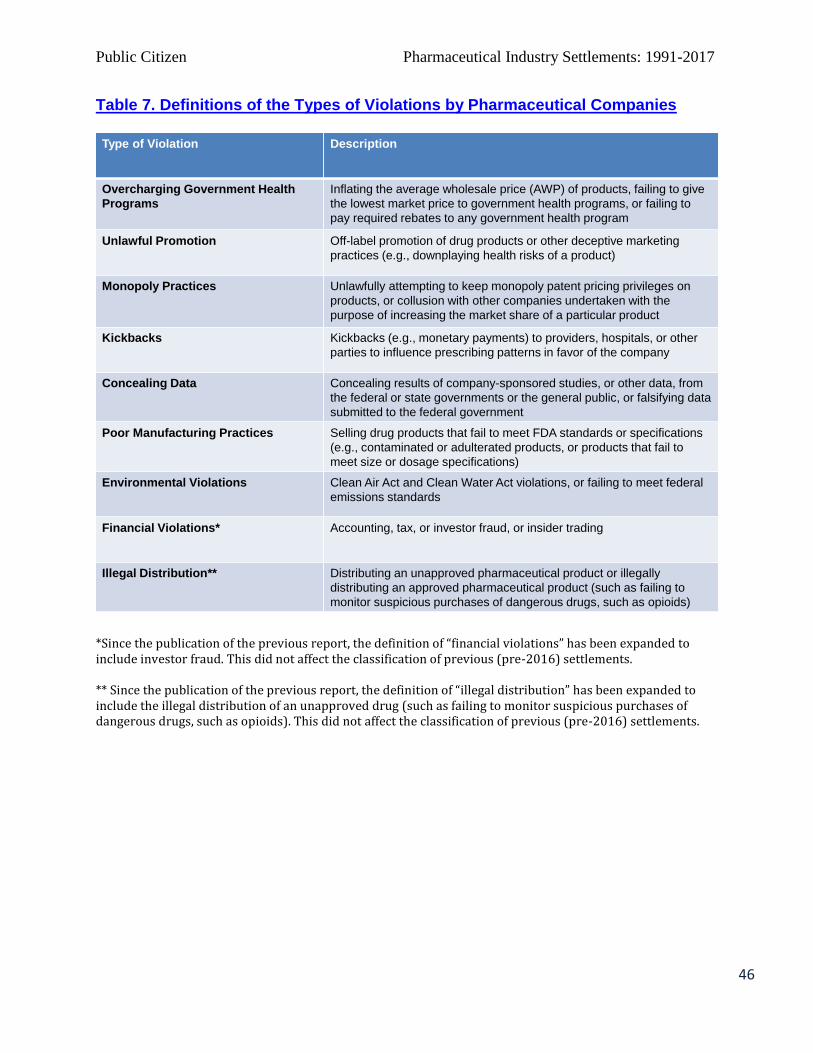
Public Citizen Pharmaceutical Industry Settlements: 1991-2017
46
Table 7. Definitions of the Types of Violations by Pharmaceutical Companies
*Since the publication of the previous report, the definition of “financial violations” has been expanded to include investor fraud. This did not affect the classification of previous (pre-2016) settlements. ** Since the publication of the previous report, the definition of “illegal distribution” has been expanded to include the illegal distribution of an unapproved drug (such as failing to monitor suspicious purchases of dangerous drugs, such as opioids). This did not affect the classification of previous (pre-2016) settlements.
Type of Violation Description
Overcharging Government Health
Programs
Inflating the average wholesale price (AWP) of products, failing to give
the lowest market price to government health programs, or failing to
pay required rebates to any government health program
Unlawful Promotion Off-label promotion of drug products or other deceptive marketing
practices (e.g., downplaying health risks of a product)
Monopoly Practices Unlawfully attempting to keep monopoly patent pricing privileges on
products, or collusion with other companies undertaken with the
purpose of increasing the market share of a particular product
Kickbacks Kickbacks (e.g., monetary payments) to providers, hospitals, or other
parties to influence prescribing patterns in favor of the company
Concealing Data Concealing results of company-sponsored studies, or other data, from
the federal or state governments or the general public, or falsifying data
submitted to the federal government
Poor Manufacturing Practices Selling drug products that fail to meet FDA standards or specifications
(e.g., contaminated or adulterated products, or products that fail to
meet size or dosage specifications)
Environmental Violations Clean Air Act and Clean Water Act violations, or failing to meet federal
emissions standards
Financial Violations* Accounting, tax, or investor fraud, or insider trading
Illegal Distribution** Distributing an unapproved pharmaceutical product or illegally
distributing an approved pharmaceutical product (such as failing to
monitor suspicious purchases of dangerous drugs, such as opioids)

Public Citizen Pharmaceutical Industry Settlements: 1991-2017
47
Figure 14. Types of Pharmaceutical Industry Violations, 1991 –2017*
*Total number of violations (466) exceeds number of settlements (412) as some settlements involved more than one type of violation. ** Since the publication of the 2016 report, an additional federal, non-qui-tam settlement with Syncor, in 2002 for $2.5 million ($0.5 million civil penalty; $2 million criminal penalty) for kickbacks, was found and added to the database.
204
117
63
28
1612
12 8 6 Overcharging Government HealthPrograms (204)
Unlawful Promotion (117)
Kickbacks (63)**
Monopoly Practices (28)
Concealing Data (16)
Poor Manufacturing Practices (12)
Environmental Violations (12)
Financial Violations (8)
Illegal Distribution (6)
Source: Public Citizen, Twenty-Seven Years of Pharmaceutical Industry Criminal and Civil Penalties: 1991-2017. See full report at: https://www.citizen.org/our-work/health-and-safety/pharmaceutical-industry-penalties

Public Citizen Pharmaceutical Industry Settlements: 1991-2017
48
Figure 15. Number of Pharmaceutical Industry Settlements Involving Overcharging of Government Health Programs, 1991 – 2017
1 1
21
4
2
4
6
4
16
19
26
29
37
41
5
3
12
0
5
10
15
20
25
30
35
40
45
Nu
mb
er
of
Sett
lem
en
ts
YearSource: Public Citizen, Twenty-Seven Years of Pharmaceutical Industry Criminal and Civil Penalties: 1991-2017. See full report at: https://www.citizen.org/our-work/health-and-safety/pharmaceutical-industry-penalties

Public Citizen Pharmaceutical Industry Settlements: 1991-2017
49
Figure 16. Pharmaceutical Industry Financial Penalties by Type of Violation, 1991 –2017
*Since the publication of the 2016 report, an additional federal, non-qui-tam settlement with Syncor, in 2002 for $2.5 million ($0.5 million civil penalty; $2 million criminal penalty) for kickbacks, was found and added to the database. ** Settlements that involved more than one type of violation were reviewed and, where possible, individual penalties for each type of violation were determined and added to the totals for that violation. The final total for “multiple violations” represents the sum total that could not be (or was not) attributed to a single violation.
11299
6328
3585
2221
1771
1636
267
232
102
11205
Unlawful Promotion ($11,299)
Overcharging Government HealthPrograms ($6,328)
Financial Violations ($3,585)
Monopoly Practices ($2,221)
Poor Manufacturing Practices($1,771)
Kickbacks ($1,636)*
Concealing Data ($267)
Environmental Violations ($232)
Illegal Distribution ($102)
Multiple Violations ($11,205)**

Public Citizen Pharmaceutical Industry Settlements: 1991-2017
50
Figure 17. Pharmaceutical Industry Financial Penalties (86% federal) for Unlawful Promotion, 1991 – 2017*
* Thirty-six of the 117 settlements involving unlawful promotion also involved other violations. Due to a lack of violation-specific data in most of these settlements, $10.3 billion of the $21.6 billion in financial penalties for settlements (from 1991-2017) involving unlawful promotion either were due to other violations in those settlements ($798 million) or else were not attributable to any single violation ($9.5 billion).
2 2 350
6
430
36 37
676 624
2913
1091
1253
2220
1228
418
101130
79
0
500
1000
1500
2000
2500
3000
3500
Fin
an
cia
l P
en
alt
ies (
$ m
illi
on
s)
YearSource: Public Citizen, Twenty-Seven Years of Pharmaceutical Industry Criminal and Civil Penalties: 1991-2017. See full report at: https://www.citizen.org/our-work/health-and-safety/pharmaceutical-industry-penalties
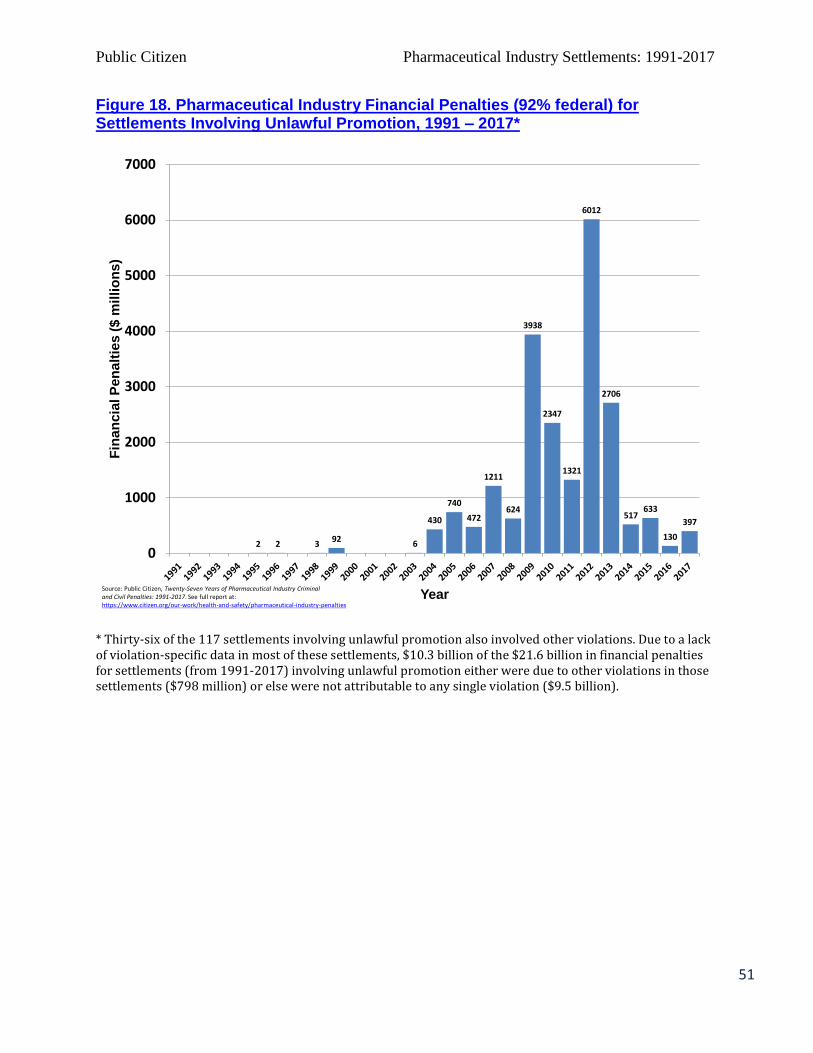
Public Citizen Pharmaceutical Industry Settlements: 1991-2017
51
Figure 18. Pharmaceutical Industry Financial Penalties (92% federal) for Settlements Involving Unlawful Promotion, 1991 – 2017*
* Thirty-six of the 117 settlements involving unlawful promotion also involved other violations. Due to a lack of violation-specific data in most of these settlements, $10.3 billion of the $21.6 billion in financial penalties for settlements (from 1991-2017) involving unlawful promotion either were due to other violations in those settlements ($798 million) or else were not attributable to any single violation ($9.5 billion).
2 2 392
6
430
740
472
1211
624
3938
2347
1321
6012
2706
517633
130
397
0
1000
2000
3000
4000
5000
6000
7000
Fin
an
cia
l P
en
alt
ies (
$ m
illi
on
s)
YearSource: Public Citizen, Twenty-Seven Years of Pharmaceutical Industry Criminal and Civil Penalties: 1991-2017. See full report at: https://www.citizen.org/our-work/health-and-safety/pharmaceutical-industry-penalties

Public Citizen Pharmaceutical Industry Settlements: 1991-2017
52
Appendix 2: Detailed Methodology Inclusion and exclusion criteria
As with the previous reports, only settlements involving companies that were predominantly pharmaceutical manufacturers (e.g., not pharmacy chains or medical device manufacturers) were included. Cases were excluded if the wrongdoing concerned a product that was not a pharmaceutical (e.g., medical devices were excluded; intravenous solutions, on the other hand, were considered pharmaceuticals). If a release mentioned a singular “settlement,” regardless of how many companies or states were involved, it was counted as one settlement in our database. If a release mentioned the plural “settlements” and there was a breakdown of amount paid by company, then each company’s settlement was counted as a separate case. Note that both the current iteration and the most recent, 2016 iteration of this report included all settlements, regardless of the magnitude of the financial penalty. However, for the time period prior to July 19, 2012, only settlements of $1 million or greater were included. We changed our methodology beginning with the 2016 report to include settlements of less than $1 million primarily to ensure that totals for smaller states (which are more likely to have smaller settlements) are not underrepresented. Data sources
For federal cases, the following sources were accessed: 1) the Department of Justice (DOJ) website,72 2) the Securities and Exchange Commission (SEC) website,73 3) the Project on Government Oversight’s (POGO’s) Federal Contractor Misconduct Database,74 and, for the first time, a fourth data source, the FCPA Professor blog (for settlements involving violations or alleged violations of the Foreign Corrupt Practices Act).75 Press releases from the DOJ website were found by going to the “Justice News” section of the website. Almost all federal settlements were found in DOJ press releases. (As in the three previous reports, in a few cases, federal settlements were found during searches of state attorneys general websites, with no corresponding federal agency press release located.) To search the SEC website, the link to “Press Releases” was used. In POGO’s Federal Contractor Misconduct Database, the “Misconduct Filter” was used to access all settlements in 2016 and 2017
72 Department of Justice, Office of Public Affairs. Justice News. http://www.justice.gov/justice-news. Accessed February 26, 2018. 73 Securities and Exchange Commission. Press Releases. http://www.sec.gov/news/press.shtml. Accessed February 26, 2018. 74 Project on Government Oversight. Federal Contractor Misconduct Database. http://www.contractormisconduct.org/misconduct. Accessed February 26, 2018. (No new settlements were found in this database.) 75 FCPA Professor. Section on pharmaceutical industry-related content. http://fcpaprofessor.com/category/pharmaceutical-industry/. Accessed February 22, 2018 and searched all pages up to that date. We found a total of three settlements with no corresponding press release issued by either the DOJ or the SEC. Two of these three settlements occurred during the current 2016-2017 time period, but the third settlement was announced in 2002. This settlement was retroactively added to our database and all 2002 and company-specific totals were then updated to account for this additional settlement.

Public Citizen Pharmaceutical Industry Settlements: 1991-2017
53
involving the Department of Health and Human Services as the contracting party. In addition, for the updated comparison of annual federal False Claims Act (FCA) payouts by the defense and pharmaceutical industries (Figure 9), data on financial penalties recovered by the Department of Defense through FY 2017 were obtained online from DOJ.76 State cases were found through a search of press releases from all 50 state and District of Columbia (D.C.) attorney general websites. For sites that did not display press releases during part, or all, of the relevant time period (2016-2017), the website www.archive.org was accessed to recover past releases, searching for the most current URL (or a variant) for the state attorney general website (explained in detail in the 2010 report). However, two states (New Mexico and Oklahoma) had a gap in time, ranging from two to 14 months, for which press releases were unavailable on either the current or archived state attorney general websites. Two other states (Minnesota and West Virginia) did not have a centralized list of press releases but did have a search function, which were used to find settlements under the search terms “pharmaceutical” and “settlement” (no settlements were found). Data from federal and state press releases were cross-checked with several nongovernmental online databases, previous versions of which were also used to verify the data from the previous iterations of this report.77,78 Criminal vs. civil settlements
Criminal settlements, or criminal components of civil-criminal settlements, were defined as those in which there was a financial penalty labeled a “criminal” fine for violation of a law or for which a penalty was ordered to be paid as part of a plea agreement or deferred-prosecution agreement. All other financial penalties were defined as civil. Civil-criminal settlements were defined as those containing both civil and criminal financial penalties. The False Claims Act, including qui tam provisions, and the Food, Drug, and Cosmetic Act
The False Claims Act (FCA) is a commonly used legal tool to prosecute fraud against the government. Originally enacted in 1863 during the Civil War to combat defense contractor
76 Department of Justice. Fraud Statistics — Department of Defense. October 1, 1986-September 30, 2017. https://www.justice.gov/opa/press-release/file/1020111/download. Accessed February 26, 2018. 77 Taxpayers Against Fraud (TAF). Top 100 FCA Cases. https://taf.org/Public/Home_Page_Buttons/Top_100_Fraud_Cases.aspx. Accessed February 26, 2018. (No new settlements were found in this list.) 78 National Association of Attorneys General. http://app3.naag.org/antitrust/search/. “Search Only Civil Litigation Records” was selected and all cases corresponding to the “Related Industry” categories “health care” and “pharmaceuticals” were searched on February 19, 2018. No new settlements were identified from this database.

Public Citizen Pharmaceutical Industry Settlements: 1991-2017
54
fraud, the FCA has been strengthened through various amendments beginning in 1986.79 These amendments included protection of whistleblowers from employer retaliation and increased financial rewards for coming forward.80 The qui tam (whistleblower) provisions are a key part of the act, allowing private citizens to bring to light illegal activities that may spur prosecution of the offending companies. The 2005 Deficit Reduction Act (DRA) rewarded states that enacted FCAs with strong qui tam provisions and civil penalties with a 10% increase in financial recoveries resulting from an investigation pursued under the state FCA.81 As of FY 2017, 19 states had FCAs that were DRA-compliant.82 Violations of the FCA by pharmaceutical companies have typically resulted in civil, rather than criminal, penalties. The Food, Drug, and Cosmetic Act (FDCA) is the other major federal law used to prosecute illegal pharmaceutical industry behavior. The FDCA, enacted in 1938 and since amended, forms the basis for the regulation of pharmaceuticals, including the prohibition of making false therapeutic claims about a product, including those made regarding unapproved uses (i.e., off-label promotion).83 Violations of the FDCA by pharmaceutical companies have typically resulted in criminal penalties. Other federal laws cited to prosecute pharmaceutical companies include the Anti-Kickback Statute, the Foreign Corrupt Practices Act, and the Clean Air Act. In analyzing FCA violations in the defense and pharmaceutical industries, all totals represent only the portion of the civil settlement paid to the federal government. For pharmaceutical industry totals, settlements in which the federal portion was not specified were excluded. Therefore, the pharmaceutical industry totals by fiscal year in Figure 9 represent underestimates of the total federal FCA payouts made by the industry during those years.
79 Department of Justice. The False Claims Act: A Primer. http://www.justice.gov/sites/default/files/civil/legacy/2011/04/22/C-FRAUDS_FCA_Primer.pdf. Accessed February 6, 2016. 80 Krause JH. Twenty-five years of Health Law Through the Lens of the Civil False Claims Act. Ann Health Law. 2010;19(1 Spec No):13-7. 81 Department of Health and Human Services, Office of Inspector General. Updated OIG Guidelines for Evaluating State False Claims Acts. March 15, 2013. http://www.oig.hhs.gov/fraud/docs/falseclaimsact/guidelines-sfca.pdf. Accessed February 6, 2016. 82 National Association of Medicaid Fraud Control Units. Statistical Survey: State Medicaid Fraud Control Units, 2017. http://www.namfcu.net/assets/files/statistical-survey/Statistics%202017%20-%20expended.pdf. Accessed February 26, 2018. In addition to state FCA laws, several states have laws specifically covering Medicaid fraud (e.g., Texas Medicaid Fraud Prevention Act) and consumer protection (e.g., Louisiana Unfair and Deceptive Trade Practices Act) that have been invoked to hold pharmaceutical companies accountable for allegedly defrauding state Medicaid programs. Sources: Attorney General of Texas. Attorney General Abbott Recovers $39.75 Million for State of Texas, U.S. Medicaid Program. October 16, 2014. https://www.texasattorneygeneral.gov/oagnews/release.php?id=4874; and Office of the Attorney General, State of Louisiana. Attorney General Caldwell Announces $20 Million Settlement With Pharmaceutical Company. April 7, 2010. http://www.ag.state.la.us/Article.aspx?articleID=392&catID=1&printer=1. Both accessed February 26, 2018. 83 Food and Drug Administration. FDA History – Part II: The Food, Drug, and Cosmetic Act. http://www.fda.gov/AboutFDA/WhatWeDo/History/Origin/ucm054826.htm. Accessed February 26, 2018.

Public Citizen Pharmaceutical Industry Settlements: 1991-2017
55
Qui tam cases were typically brought under federal or state FCAs. Settlements classified as qui tam cases were those in which there was any mention in the press release of a qui tam provision being invoked, or of a whistleblower being responsible for triggering any part of the investigation. Company totals
We obtained total settlement amounts by company by reviewing the amount paid by each company in each settlement. For some settlements involving multiple companies, the dollar amount paid by each company could not be determined. These cases (representing just 2% of all financial penalties from 1991 through 2017) were therefore excluded when calculating total financial penalties by company. Settlements were recorded in the database under each company’s parent company at the time of the final settlement. If a settlement was announced after the offending company had been acquired by, or had merged with, another company, then the settlement was attributed to the new parent company, regardless of when the alleged violations took place. When presenting company totals, we used the most current parent company names; for companies not currently existing independently, we used the parent company’s name at the time of the most recent settlement. Violation types
Violations were classified into nine general categories: concealing data, environmental violations, financial violations, illegal distribution, kickbacks, monopoly practices, overcharging government health programs, poor manufacturing practices, and unlawful promotion. Table 7 defines each category. Federal and state settlements
State settlements refer to those in which the federal government neither was involved in the investigation responsible for the settlement nor was a party to the final settlement, as determined through a review of the press release and, when available, the official settlement document. All other cases were classified as federal, including joint federal-state cases (e.g., those involving Medicaid). All state settlements were reviewed to classify the cases as single-state or multi-state settlements. Single-state settlements were those in which only one state was a party to the final settlement, as gleaned from the information provided in the press release. All other state settlements were classified as multi-state. It should be noted that, in both single-state and multi-state settlements involving Medicaid fraud, the federal government generally receives a fraction of the settlement proceeds corresponding to each state’s FMAP, even though the federal government is not a party to these settlements.84
84 Social Security Act: Payment adjustment for health care-acquired conditions, 42 U.S. Code § 1396b (2010).

Public Citizen Pharmaceutical Industry Settlements: 1991-2017
56
Single-state settlements
Complete data on financial penalties attributable to individual states were available for single-state settlements but not for multi-state settlements. Therefore, two analyses were possible for the single-state settlement data: financial recoveries as a proportion of state Medicaid prescription drug expenditures and a return-on-investment (ROI) analysis (Table 1). Both the numerators (financial penalties) and the denominators (Medicaid prescription drug expenditures and Medicaid Fraud Control Unit [MFCU] budgets for the expenditure and ROI analyses, respectively) represent combined federal and state totals, because state shares of financial penalties were not consistently disclosed in the press releases. The federal government has historically funded Medicaid prescription drug expenditures at approximately the same proportion of each state Medicaid program’s FMAP,85 and it shoulders 75% of the costs of every state’s MFCU, with the states funding the remaining 25%.86 For the first analysis, annual Medicaid prescription drug expenditures were obtained from the Centers for Medicare and Medicaid Services (CMS) for all 50 states and the District of Columbia.87 The sum of all prescription drug expenditures from FY 2001 (corresponding to the fiscal year of the earliest single-state settlement) through FY 2015 (the most recent year for which data were available, as of February 12, 2018) was used as the denominator, with total single-state financial penalties from calendar year (CY) 2000 (all of which occurred in FY 2001) through CY 2017 as the numerator. States were ranked in Table 1 by the total recoveries per $1,000 of Medicaid prescription drug expenditures. However, because settlement penalties beyond FY 2015 were included in the numerator, the figures given for settlement recoveries per $1,000 of Medicaid prescription drug expenditures in Table 1 represent overestimates. In the second analysis, ROI values in Table 1 represent the financial return from single-state settlements relative to each state’s Medicaid fraud enforcement expenses. It was assumed that each state’s MFCU was the primary agency responsible for investigating pharmaceutical fraud.88 MFCU annual budgetary data were obtained from annual state
85 Personal communication with the Department of Justice, Civil Division on August 23, 2012, prior to the publication of the 2012 iteration of this report. This was confirmed by comparing FMAPs with the federal/state share of prescription drug expenditures in a sample of Centers for Medicare and Medicaid Services data from several states over multiple years. 86 National Association of Medicaid Fraud Control Units (NAMFCU). MFCU Information. MFCUs receive annual grants from the federal government, which fund 75 percent of the state’s MFCU budget, with the state funding the remainder. http://www.namfcu.net/mfcu-information.php. Accessed February 26, 2018. 87 Centers for Medicare and Medicaid Services (CMS). CMS-64 Quarterly Expense Report. Financial Management Reports from FY2001 through FY 2015 were downloaded. https://www.medicaid.gov/medicaid/financing-and-reimbursement/state-expenditure-reporting/expenditure-reports/index.html. Accessed February 12, 2018. 88 There are at least two exceptions to this rule. North Dakota is the only state without an MFCU (National Association of Medicaid Fraud Control Units. Statistical Survey: State Medicaid Fraud Control Units, 2017. http://www.namfcu.net/assets/files/statistical-survey/Statistics%202017%20-%20expended.pdf. Accessed February 12, 2018), while Texas’ MFCU is not the primary agency responsible for prosecuting civil pharmaceutical fraud cases (as in all other states, pharmaceutical fraud cases in Texas are civil). The Attorney

Public Citizen Pharmaceutical Industry Settlements: 1991-2017
57
surveys by the National Association of Medicaid Fraud Control Units (NAMFCU).89 The sum of all state MFCU budgets from FY 2006 (the earliest year for which data were available) through FY 2017 (the most recent data available) was used as the denominator, with total single-state financial penalties from CYs 2000 (the year of the earliest single-state settlements) through CY 2017 as the numerator. All single-state settlement financial recoveries were obtained during or after FY 2006, with only three exceptions (one settlement in California for $85 million in 2000, and two for $2.5 million each in New York and Connecticut in 2004 and 2005, respectively). Because the total MFCU budget, rather than the portion devoted to prosecuting pharmaceutical fraud, was used as the denominator (potentially underestimating true ROIs), while the financial penalties used for the numerator represent both federal and state settlement shares (potentially overestimating true ROIs), the ROIs presented here are merely approximations of states’ efficiency in pursuing pharmaceutical fraud. A third, descriptive analysis was undertaken to determine whether there exists a rough association between the number of – and financial penalties resulting from – single-state settlements and the presence of a state FCA (as of 2017). A similar analysis was also performed that was limited to those states with FCAs meeting higher federal standards (e.g., those with strong whistleblower provisions) as defined by the 2005 DRA (referred to in this report as DRA-compliant FCAs).90 As state FCA status was based on 2017 FCA data, in some cases, single-state settlements attributed to states with an FCA may have, in fact, preceded the enactment of an FCA in those states. Thus, this analysis may be underestimating the proportion of states that finalized settlements without an FCA. In addition, even in states with an FCA as of 2017, other state laws may have been invoked to prosecute Medicaid fraud by pharmaceutical manufacturers. A note on Medicaid prescription drug expenditure data
Medicaid drug expenditures for fiscal years 2014-2015 were, as with expenditures for FYs 2001-2013 for the previous reports, obtained from the Centers for Medicare and Medicaid Services.91 Expenditures for all years represent only those made by the fee-for-service
General of Texas. Civil Medicaid Fraud. https://texasattorneygeneral.gov/cmf/civil-medicaid-fraud. Accessed February 26, 2018. 89 National Association of Medicaid Fraud Control Units. Statistical Survey: State Medicaid Fraud Control Units, 2017. http://www.namfcu.net/assets/files/statistical-survey/Statistics%202017%20-%20expended.pdf. Accessed February 12, 2018. 90 In the 2005 Deficit Reduction Act (DRA), Congress provided incentives for individual states to enact or strengthen their own FCAs to encourage prosecution of Medicaid fraud. Arguably, the most important provision emphasized in the DRA was whistleblower protection, with states encouraged to increase rewards for whistleblowers in Medicaid fraud settlements to 15-25% of the financial penalties awarded. See House Report 109-362 — Deficit Reduction Act of 2005. Sec. 6032. https://www.congress.gov/congressional-report/109th-congress/house-report/362/1. Accessed February 26, 2018. 91 Centers for Medicare and Medicaid Services. Expenditure Reports from MBES/CBES. https://www.medicaid.gov/medicaid/financing-and-reimbursement/state-expenditure-reporting/expenditure-reports/index.html. Accessed February 26, 2018. The fee-for-service Medicaid prescription drug net expenditures were obtained by adding up the three rows in the source documents titled

Public Citizen Pharmaceutical Industry Settlements: 1991-2017
58
segment of state Medicaid programs and exclude rebates given to Medicaid Managed Care Organizations (MCOs). In addition, expenditures for FYs 2010-2015 exclude the increased prescription drug rebates to Medicaid programs mandated by the Affordable Care Act (ACA), as the entirety of these rebates was remitted to the federal government.
These two categories of data were excluded for the following reasons, following discussions with an official from the Centers for Medicare and Medicaid Services:92
1) The two rows containing MCO rebate amounts reflect not only rebates for drugs but also rebates for other expenditure categories in the managed care plans. Therefore, including these rebates would overly deflate the net expenditure totals. 2) The increased ACA offset rows contain additional rebates mandated by the ACA but paid entirely to the federal government. Therefore, since pharmaceutical settlement penalties are split between the federal and state governments roughly according to the federal/state Medicaid funding split (i.e., the Federal Medical Assistance Percentage [FMAP]), we restricted our prescription drug expenditures and rebates to those categories (i.e., Drug Rebate Offset — National and State) that are, similarly, split roughly along the federal/state FMAP allocations.
Multi-state and overall (multi- and single-state combined) settlements
The number of multi-state settlements and accompanying financial penalties was determined through a search of every state’s attorney general website for press releases from each state involved in a multi-state settlement. A complete list of participating states was not found for two of the 38 multi-state settlements. Therefore, the final settlement tallies for some states in Tables 2 and 3 may be underestimates. In addition, the financial penalties from multi-state settlements presented in this report are certainly underestimates, as many states did not always specify their financial share of the settlement amounts. Only $909 million (57%) of the $1.59 billion in multi-state penalties were attributable to individual states and are included in Table 2. Therefore, for both the multi-state and overall state settlement tables (Tables 2 and 3, respectively), states were ranked by the number of settlements in which they participated, rather than the financial return from those settlements.
“Prescribed Drugs,” “Drug Rebate Offset — National,” and “Drug Rebate Offset — State Sidebar Agreement.” The rows titled “MCO” and “Increased ACA Offset” were excluded. 92 Personal communication with Meagan Khau, health insurance specialist, Centers for Medicare and Medicaid Services. July 13, 2015.