tv market update - hbbtv€¦ · bbc ‘bodyguard’ audience •catch-up drives the live audience...
TRANSCRIPT

© 2018 IHS Markit. All Rights Reserved.
TV Market UpdatePaul Gray, Research Director
HbbTV Symposium, Berlin, November 2018

© 2018 IHS Markit. All Rights Reserved.
Smart TV shipment share by region, Q2 2018
• Globally, smart featuring is now present in 70% of sets shipped in Q2 2018.
• China leads in penetration at 90% Latin America is a strong second, mandates Ginga interactivity.
2
0%
10%
20%
30%
40%
50%
60%
70%
80%
90%
100%
Japan North America Western Europe Eastern Europe China Asia Pacific Latin America Middle East andAfrica
Sh
ipm
en
t S
ha
re 2017 Q2
2017 Q3
2017 Q4
2018 Q1
2018 Q2
Smart TV Penetration Trend
Source: IHS Markit © 2018 IHS Markit

© 2018 IHS Markit. All Rights Reserved.
4K TV shipment share by region, Q2 2018
• 60% of shipments in Western Europe are 4K resolution.
• Japan lags somewhat, due to a preference for smaller (non-4K) screen sizes.
3
0%
10%
20%
30%
40%
50%
60%
70%
Japan North America Western Europe Eastern Europe China Asia Pacific Latin America Middle East andAfrica
Sh
ipm
en
t S
ha
re 2017 Q2
2017 Q3
2017 Q4
2018 Q1
2018 Q2
4K TV Penetration Trend
Source: IHS Markit © 2018 IHS Markit

© 2018 IHS Markit. All Rights Reserved.
Screen size trend: Q2 2018• Western Europe closing rapidly on North America and China, despite very different home sizes.
4
25
30
35
40
45
50
Japan North America WesternEurope
EasternEurope
China Asia Pacific Latin America Middle Eastand Africa
World
Sc
ree
n S
ize
(In
ch
es
)
2017 Q2
2017 Q3
2017 Q4
2018 Q1
2018 Q2
Average screen size shipments (Inches)
Source: IHS Markit © 2018 IHS Markit

© 2018 IHS Markit. All Rights Reserved.
63% of households smart TV in 2022
0%
10%
20%
30%
40%
50%
60%
70%
80%
90%
100%
0
20
40
60
80
100
120
140
160
180
200
2007 2008 2009 2010 2011 2012 2013 2014 2015 2016 2017 2018 2019 2020 2021 2022
UHD
FHD
HD
SD
UHD%
Smart %
Western Europe TV Households
Source: IHS Markit
Ho
useh
old
s (
millio
ns)
© 2018 IHS Markit

© 2018 IHS Markit. All Rights Reserved.
Screen size forecast
25
30
35
40
45
50
55
Japan North America WesternEurope
EasternEurope
China Asia Pacific Latin America Middle Eastand Africa
Grand Total
Sc
ree
n S
ize
(In
ch
es
) 2016
2017
2018
2019
2020
2021
2022
Average screen size forecast (Inches)
Source: IHS Markit © 2018 IHS Markit
© 2018 IHS Markit. All Rights Reserved.
Content consumption

© 2018 IHS Markit. All Rights Reserved.
Device ownership: UHD-positive consumers
• Surprising that Smart TV is not 100% - as all 4K TVs have Smart TV functionality!
• Clearly UHD is a halo factor even for conventional subscribers.
0%
10%
20%
30%
40%
50%
60%
70%
Smart TV ConnectedDVD/BDPlayer
PS4 Xbox 360 PS3 Xbox One/One S
Chromecast Apple Tv PS4 Pro Xbox One X
Ow
ne
rsh
ip r
ep
ort
ed
UHD content is important
UHD content is not important
Devices owned by respondents stating UHD Content important
Source: IHS Markit © 2018 IHS Markit

© 2018 IHS Markit. All Rights Reserved.
Smart TV usage: BBC iPlayer consumption trend
• PC and mobile are gateways to increased TV screen* on-demand viewing.
• Consumers use mobile devices to try new services, transferring viewing to the TV screen for intensive consumption.
> Out-of-home usage does not compete with TV, but a new audience opportunity.
*TV screen viewing by smart TV, streaming box or games console.
9
0
200
400
600
800
1000
1200
1400
1600
1800
2000
7 9 11 1 3 5 7 9 11 1 3 5 7 9 11 1 3 5 7 9 11 1 3 5 7 9 11 1 3 5 7 9 11 1 3 5 7
2012 2013 2014 2015 2016 2017 2018
Mil
lio
n r
eq
ue
sts
TV
PC
Mobile
BBC iPlayer TV content playbacks by device type: rolling year
Source: IHS Markit © 2017 IHS Markit

© 2018 IHS Markit. All Rights Reserved.
120 170 220 270
2016
2017
2016
2017
2016
2017
2016
2017
2016
2017
2016
2017
Big
5A
ve
rag
eU
KF
ran
ce
Ge
rma
ny
Ita
lyS
pain
Linear
PVR time-shifted
Pay TV VoD
Online long-form
Online short-form
Cross-Platform viewing time by country - 2017
Notes: Figures base set to 120 minutes for illustration
Source: IHS Markit. Reference BARB, Mediametrie, AGF, Auditel, Kantar © 2018 IHS Markit
Time spent (mins/person/day)
• Viewing shifting to on-demand, on many devices, in and out of home.
• Daily viewing time in the EU 5 relatively stable for past six years.
• Linear viewing time declined across all five.
• PVR time-shifted viewing plateau in all market
> except UK: second year of decline.
• Limited evidence of cord-cutting in Europe
• Online share of viewing time increased, average:
> + 10 minutes /person/day of online short-form content,
> + 8 minutes long-form content.
• TV providers need to be innovative to retain customers, audience shares and revenues.
Source: IHS Markit annual Cross-Platform Viewing Time report
TV viewing trends
© 2018 IHS Markit. All Rights Reserved.© 2018 IHS Markit. All Rights Reserved.

© 2018 IHS Markit. All Rights Reserved.
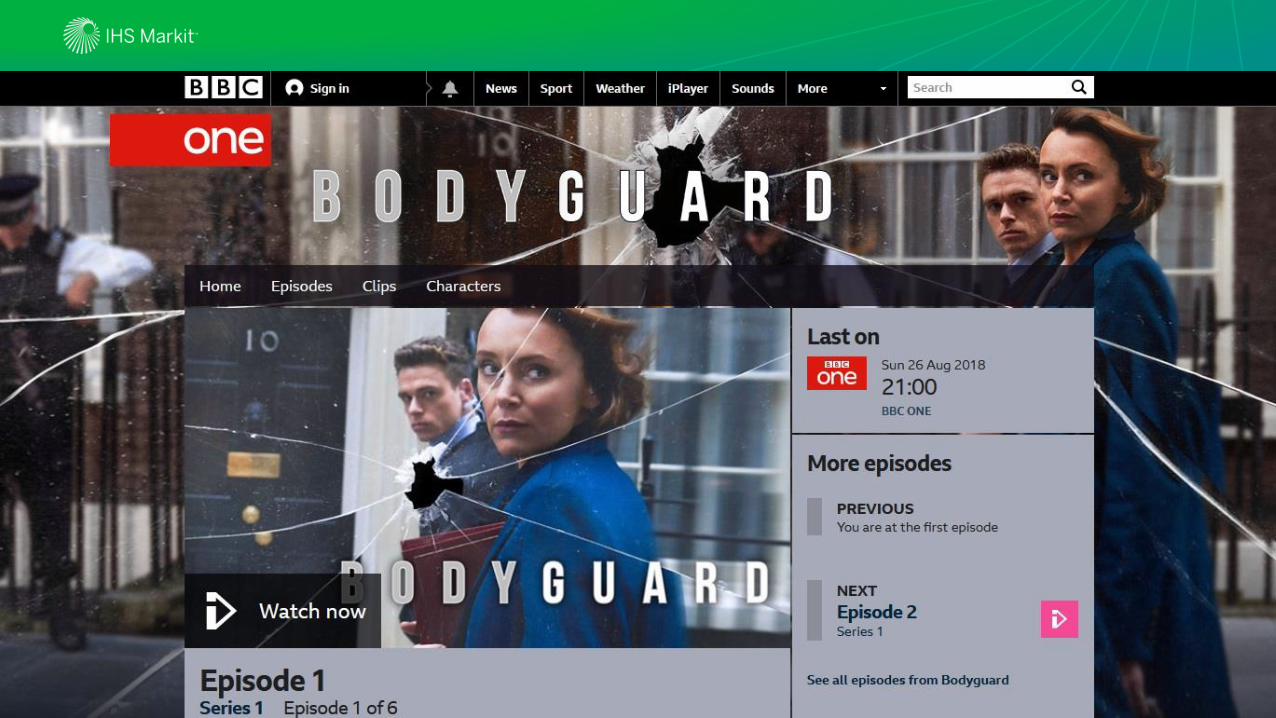
BBC ‘Bodyguard’ audience
• Catch-up drives the live audience
• Viewers recruited via catch-up (iPlayer): joined the live audience later in series.
• On-demand driving linear viewing
• 35 million downloads of the Bodyguard on iPlayer. Box set viewing afterwards.
• Biggest total audience since 2002!
• HbbTV key technology for audience development.
0
2
4
6
8
10
12
14
16
18
1 3 5 6
Mil
lio
n v
iew
ers
Catch-up Live
‘Bodyguard' audience; Sunday episodes
Source: IHS Markit, BARB © 2018 IHS Markit

© 2018 IHS Markit. All Rights Reserved.
UK & Germany: Consumer Behaviours
13
• Low pricing, original/exclusive content and wide distribution of OTT services have resulted in rapid uptake, consumers taking multiple subscriptions.
• Consumers increasingly go first to OTT video providers for content.
> Figures even more alarming by age group, nearly 90% of 17-24 year olds in Germany and 66% in the UK turn to YouTube and Netflix first.
• Pay TV operators must continue to drive value amongst subscribers to retain subscriptions, revenues and viewing time.
• Households with an existing pay TV subscription more likely to have an OTT subscription.
> Overlap between Sky TV customers with Netflix doubles for 17-24 year olds compared to the average across all age groups.
• OTT video subscribers also more likely to engage with their pay TV service and regularly use additional pay TV features such as VoD and multiscreen.
Sky TV
YouTube
YouTube
Amazon
iPlayer
Netflix
Virgin TV
Sky De
Netflix
KD
0% 20% 40% 60% 80% 100%
UK
Germany
UK & Germany: First choice of video service for content
Notes: n=4,802 nationally representative internet users, survey conducted April 2018. Q. 31. On an average day, which of the
following devices and services is your first choice when looking for something to watch?
Source: IHS Markit © 2018 IHS Markit
% of respondents
0%
2%
4%
6%
8%
10%
12%
14%
16%
18%
UK & Germany: Devices attached to Primary TV Screen
Source: IHS Markit © 2018 IHS Markit
% r
es
po
nd
en
ts
Source: Connected Devices & Media Consumption, Q1 2018. N=4,802 nationally representative internet users.

© 2018 IHS Markit. All Rights Reserved.© 2018 IHS Markit. All Rights Reserved.
14
Thank you!
Paul Gray, [email protected]
+44 7810 854646