tutorials and workshops kick off ieee globecom...
TRANSCRIPT

Welcome to IEEE GLOBECOM 2012and this year’s schedule consisting of approximately 1,500 keynotes, businesspanels, industry forums and technical sessions. The conference initiated itspremier international agenda with the first of more than 30 workshops and tutorials dedicated to topics ranging from digital gaming and small cell wirelessnetworks to LTE and beyond 4G emerging technologies. Included in these efforts were the presentations of global communications experts representingscores of countries.
Among Monday’s 11 workshops was the first-half of the session on “CloudBase-station and Large-scale Cooperative Communications,” which began withthe introductory keynote of Dr. Jesse Fang of Intel Corp. on “Challenges & Opportunities in the Age of Mobile Internet.” During his presentation, Dr. Fangspoke extensively about the cloud’s role in developing future basic station architectures that focus on the fulfillment of user experiences as a measure of success. This included emphasizing the use of ICT technologies for data
distribution and improving the mobile network itself to overcome problems like poor user plane services and core network congestion. Otherrecommendations entailed the building of ecosystems supporting billions of subscribers through the drive for enhanced standardization andpolicy making.
Shortly afterwards were also several tutorials that included the well-attended sessions on “Digital Games for People Networking – Challenges& Opportunities” and “Small Cell & Heterogeneous Network (HetNet) Deployment.” In the session on “Gaming,” Ross Smith of Microsoft spokeabout “gamification” and the effort to integrate game features into work environments as a method for developing organizational trust, facilitatinginteractions, breaking cultural barriers and introducing fun into the creative aspects of work. He also highlighted the “magic circle of play” andits ability to support risk taking and experimentation among employees, who are already working well beyond the regular hours of business.Among these individuals are the nearly 70 million individuals in the U.S., who classify themselves as social gamers and the average 18 – 24year old, who is sending and receiving 100 or more texts a day.
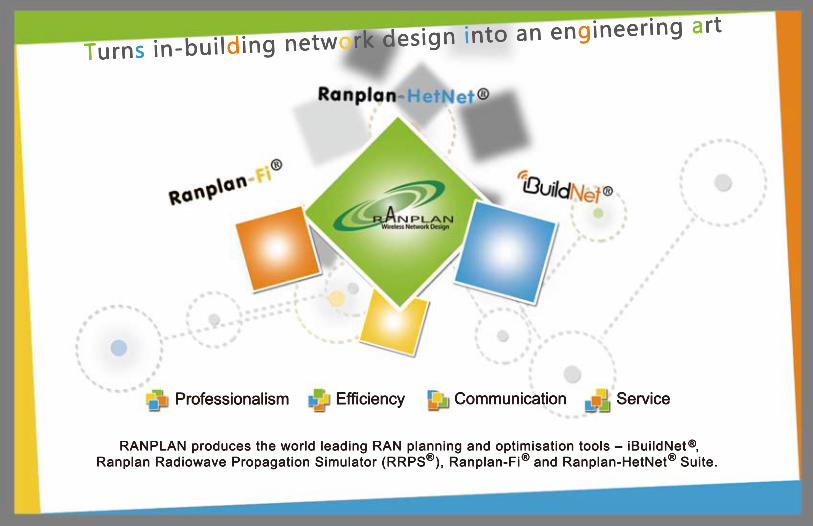
Highlights of the HetNet industry tutorial included an explanation of the Ranplan Radio Propagation Simulator used for modeling an entire campus, indoor and outdoor, within different types of environments ranging from residential areas to stadiums and airports. Described as oneof the most powerful tools of its kind for creating superior 3D building models, the Ranplan optimization tool was also featured as an intelligent method for supporting the real-time collection and measurement of data as well as the improved performance of indoor cells.
Programming for the first day of IEEE GLOBECOM 2012 concluded with the second half of the morning’s workshops and three more industryforums on “Programmable Cloud Computing,” “Internet as a New Paradigm,” and “Software Testing in the Network Environment.”
Tutorials and Workshops kick off IEEE GLOBECOM 2012
TABLE OF CONTENTS
Program Spotlight . . . . . . . . . .2
Events of the Day . . . . . . . . . .5
Program Updates . . . . . . . . . .6
Featured Articles . . . . . . . . . .6
Exhibit Essentials . . . . . . . . .11
Yesterday’s News . . . . . . . . .13
Best Papers . . . . . . . . . . . . . .15
Issue 2Tuesday, 4 December 2012
PAPER SMART CONFERENCEIEEE GLOBECOM 2012 is a paper smart conference.
There will be no printed final programs distributed onsite at the conference. The final program is available at http://www.ieee-globecom.org/2012/finalprogram.html
in PDF and FlipBook searchable formats.
The conference venues, Disneyland® Hotel and Grand Californian Hotel, will both be equipped with wireless access points. There will also be computer stations available in the registration and exhibit hall areas for thosewho may need to view the conference program.
The only printed material is the Program Guide found in your badge holder.
•2•
PROGRAM SPOTLIGHT
Opening & Keynote SessionTuesday, 4 December 2012 • 08:00 – 09:30
Henry SamueliCo-Founder, Chairman & CTOBroadcom Corporation
Connecting Everything: Dream Becomes Reality
Twenty years ago Broadcom’s tagline, ’Connecting everything’ was just a dream, but thanks to dramatic advances in technology, that dreamhas now become reality. The semiconductor industry is the primary technology enabler for this connected universe, demonstrating profoundand sustained impact on the entire equipment and services value chain. Our insatiable thirst for rich multimedia content is driving explosivedemand for bandwidth over our global communications networks. From broadband access networks to the home, to corporate enterprisenetworks, to global infrastructure networks, we are seeing capabilities improve by leaps and bounds. Today we also recognize that mobilityis central; our smart devices are always on and always with us, perform non-stop, and are expected to adapt to the context and locationsin which we are using them. This talk will cover some historical perspectives on how communications technology has evolved to where itis today; will review the current state-of-the-art, and will also give some conjectures on where it might take us in the future.
IF7: Executive Forum: New Technologies to WatchTuesday, 4 December 201210:00 – 12:00
It is easy to see that the communication industry continues to evolve and change. New technologies, novel processes and innovative toolsmake bandwidth broader, production easier, cost lower and friendlier to end-users. This session is aimed to look at the future and impactof new communication technologies.
During the panel, the executives will explore various emerging technologies and address questions important to the future of our communication industry.
Invited Guest Speakers:Glenn Wellbrock, Director, Optical Transport Network -Architecture, Design & Planning, Verizon, USAEmerging Technologies That Will Shape Our FutureChen Chang, Founder & CEO, BeeCube, USASo Many Users, So Many Opportunities, So Little Spectrum, So Little TimePatrick Diamond, Founder, Patrick Diamond Consulting, USATechniques for Precise Time Transfer over Optical NetworksYong Kwan Park, CEO & President, OE Solutions, KoreaIntelligent Optical Transceivers for Efficient Telecom Network OperationDean Sirovica, VP, Business Development, Huawai Technologies, China (Keynote)New Technologies & their Impact
Glenn Wellbrock Chen Chang Patrick Diamond Yong Kwan Park Dean Sirovica
Sponsored by
•3•
PROGRAM SPOTLIGHT
IF15: Dialogue with Industry LeadersTuesday, 4 December 201219:00 – 20:30
Chairs: Hamid Ahmadi, VP & Head, Advanced System Engineering Lab, Samsung Information Technology America, USAGlenn Wellbrock, Director, Optical Transport Network -Architecture, Design & Planning, Verizon, USA
This roundtable will provide an excellent opportunity for attendees to participate in cutting-edge discussions and unmatched peer-to-peernetworking as they hear real world solutions from various industry leaders that will help better manage their business.
Sponsored by
Hamid Ahmadi Glenn Wellbrock Joe Berthold Yong Kwan Park
Pat Diamond Geoffrey Mattson Flavio Bonomi Mahbubul Alam
Dean Sirovica
Steve Gray
Panelists:Joe Berthold, VP, Network Architecture, CIENA Corporation, USADean Sirovica, VP, Business Development, Huawai Technologies, USAYong Kwan Park, CEO & President, OE Solutions, KoreaPat Diamond, Founder, Patrick Diamond Consulting, USAGeoffrey Mattson, VP Architecture, Platform Systems DivisionCTO, Juniper Networks, USA
Flavio Bonomi, VP & Head, Advanced Architecture and ResearchOrganization, Cisco Systems, USASteve Gray, CTO, CSR, USAMahbubul Alam, Head of M2M/IoTs, ITS Infrastructure and AutoManufacturing Connected Industries Group, Cisco, USA
New to IEEE GLOBECOM!
IF23: Lightning Talks SessionThursday, 6 December 2012 • 16:00 – 18:00North Ballroom A
A lightning talk session is concluding the Industry Forums portion of the conference.Lightning talks are short five minute talks on technical topics. Any conference relatedsubject can be presented (thoughts triggered by a presentation, a nifty algorithm trick,a thesis project, open source software project, company product, etc.). From 20 to 24talks will be presented in this 120 minute session.
Rules: 1. Sign up at conference registration before Thursday at noon.Speaking slots assigned in order of sign up.2. Speakers must be present at start of session or slot is forfeited to the next speaker signed up.3. Each speaker is permitted five minutes to speaka. Use from zero to three slides.b. Please no animation on the slides.c. Use of URLs within the presentations is encouraged.4. The five minute time limit on talks will be strictly enforced. Speakers should be prepared to present a concise talk.5. Email slides to [email protected] following the session, if you desire them to be posted on the conference web site.

•5•
EVENTS OF THE DAY
08:00 – 09:30OPENING & KEYNOTE SESSION Henry Samueli, BroadcomCenter Ballroom/North Ballroom A/B
09:30 – 10:00COFFEE BREAK / South Exhibit HallPrize Drawing (must be present to win)
10:00 – 12:00 INDUSTRY FORUMSIF7: Executive Forum: New Technologies to Watch/ South Ballroom AIF8: M2M/IoT: What are the Futures in Communication?/ North Ballroom A
TECHNICAL SESSIONSAHSN01: Ad Hoc Routing / North Exhibit Hall AAHSN10: VANETs I / North Exhibit Hall BCISS01: Social Network Security / North Exhibit Hall CCogRN01: CRN Applications & Implementation/ North Exhibit Hall DCQ01: Energy Saving in Communication Networks & Equipment/ Magic Kingdom Ballroom 4CSSM01: Multimedia Quality of Service / North Exhibit Hall GCT01: Theoretical Aspects of Communication Systems/ North Exhibit Hall HNGNI01: Data Centers & Cloud Computing / North Exhibit Hall JONS01: Physical Layer Issues & Technologies / Castle ASAC-GNCS1: Green Systems, Designs and Applications / Castle BSPC01: MIMO I / Monorail ASPC02: Compressed Sensing / Monorail BWC01: Resource Allocation / Monorail CWC02: Modulation & Coding I / Magic Kingdom Ballroom 1WC03: UWB I / Castle CWN01: Femto-cell Networks / North Exhibit Hall IWN02: Smart Grid Communications / North Exhibit Hall F
12:00 – 13:45AWARDS LUNCHEON / Center Ballroom
13:45 – 15:30 INDUSTRY FORUMSIF9: Disruption Tolerant Networks / South Ballroom AIF10: Smart Enterprise: Next Generation Internet/ North Exhibit Hall EIF11: Green Communication & Computing / North Ballroom A
TECHNICAL SESSIONSAHSN02: Data Mules & Mobile Sinks / North Exhibit Hall AAHSN11: Network Coding / North Exhibit Hall BCISS02: Security in Cloud Computing & Storage/ North Exhibit Hall CCogRN02: Energy Management of Cognitive Radio Networks /North Exhibit Hall DCQ02: Network Layer Modeling & Design / North Exhibit Hall FCSSM02: Multimedia Quality of Experience / North Exhibit Hall GCT08: Cognitive Radio / North Exhibit Hall HNGNI02: Router Architecture & Switch Design / North Exhibit Hall IONS03: Optical Spectrum Management / North Exhibit Hall JSAC-ASN1: DSL, RoF & Misc. / Castle ASAC-GNCS2: Green Hardware & Chip Designs / Castle BSPC03: Relay / Castle CWC04: Cooperative Communications I / Monorail AWC05: Heterogeneous Network / Monorail BWC06: UWB II / Monorail CWN03: Cellular Networks I / Magic Kingdom Ballroom 1WN04: 802.11 Wireless Networks / Magic Kingdom Ballroom 4
15:30 – 16:00COFFEE BREAK / South Exhibit HallPrize Drawing (must be present to win)
16:00 – 18:00 INDUSTRY FORUMSIF12: Social Networks: Impact on Quality of Life/ South Ballroom AIF13: Future Networks, IPv6 Deployment: World Views/ North Exhibit Hall EIF14: The Grand Debate: Internet vs. Telecommunications/ North Ballroom A
TECHNICAL SESSIONSAHSN03: Wireless Sensor Network Routing I / North Exhibit Hall AAHSN12: VANETs II / North Exhibit Hall BCISS03: Physical Security / North Exhibit Hall CCogRN03: Resource Allocation / North Exhibit Hall DCogRN09: Spectrum Sharing / Magic Kingdom Ballroom 4CQ03: Cloud Computing & Communication TechnologyNorth Exhibit Hall FCSSM03: Peer-to-Peer Service / North Exhibit Hall HCT02: Pilot Design & Channel Estimation / North Exhibit Hall INGNI03: Mobile & Wireless Networks / North Exhibit Hall JSAC-GNCS3: Green Wireline Communications / Castle BSAC-PL 1: Power Line Communications & Smart Grid I / Castle ASPC04: OFDM & Multicarrier Systems / Castle CWC07: Cooperative Communications II / Monorail AWC08: Modulation & Coding II / Monorail BWC09: Interference Management I / Monorail CWN05: Handover & Mobility Management/ Magic Kingdom Ballroom 1WN06: Delay Tolerant Networks / North Exhibit Hall G
19:00 – 20:30DIALOGUE WITH INDUSTRY LEADERS / South Exhibit Hall

•6•
PROGRAM UPDATES
Tuesday, 4 December 2012IF8: M2M/IoT: What are the Futures in Communication?from 10:00 – 12:00 will now be held in North Ballroom A.IF11: Green Communication & Computingfrom 13:45 – 15:30 will now be held in North Ballroom A.IF14: The Grand Debate: Internet vs. Telecommunicationsfrom 16:00 – 18:00 will now be held in North Ballroom A.
Wednesday, 5 December 2012IF17: Next Generation Cellular & Satellite Communication Ifrom 10:00 – 12:00 will now be held in North Ballroom A.IF18: Next Generation Cellular & Satellite Communication IIfrom 13:30 – 15:30 will now be held in North Ballroom A.IF22: Education Forumfrom 16:00 – 18:00 will now be held in North Ballroom A.
Thursday, 6 December 2012IF25: Cable Industry Access Technologyfrom 16:00 – 18:00 will now be held in North Ballroom A.IF28: Optical Wireless Access from 13:30 – 15:30 will now be held in North Ballroom A.IF23: Lightning Talksfrom 16:00 – 18:00 will now be held in North Ballroom A.
Friday, 7 December 2012T9: Opportunistic Communicationfrom 09:00 – 12:00 will now be held in Magic Kingdom Ballroom 1/4.T12: Cooperative Spectrum Sensingfrom 14:00 – 17:00 will now be held in Magic Kingdom Ballroom 1/4.
The following are updates to the program guide found in your badge holder. These updates appear in the online final program.
FEATURED ARTICLES
The “Internet of Things” based on IPv6By Latif Ladid, President IPv6 Forum, University of Luxembourg
Introduction The public IPv4 address space managed by IANA (http://www.iana.org) has been completely depleted by Feb 1st, 2011.This creates by itself an interesting challenge when adding new things and enabling new services on the Internet. Withoutpublic IP addresses, the Internet of Things capabilities would greatly be reduced. Most discussions about IoT have been
based on the illusionary assumption that the IP address space is an unlimited resource or it’s even taken for granted that IP is like oxygen producedfor free by nature. Hopefully, the next generation of Internet Protocol, also known as IPv6 brings a solution.
In early 90s, IPv6 was designed by the IETF IPng (Next Generation) Working Group and promoted by the IPv6 Forum since 1999. Expanding theIPv4 protocol suite with larger address space and defining new capabilities restoring end to end connectivity, and end to end services, several IETFworking groups have worked on many deployment scenarios with transition models to interact with IPv4 infrastructure and services. They havealso enhanced a combination of features that were not tightly designed or scalable in IPv4 like IP mobility, ad hoc services; etc catering the extremescenario where IP becomes a commodity service enabling lowest cost networking deployment of large scale sensor networks, RFID, IP in the car,to any imaginable scenario where networking adds value to commodity.
With the exception of very few IPv6 experts, none of the previous discussions or research papers talked explicitly about the IPv4 address crunchand its impact on IoT or the open standards needed for its scalability, let alone ever mentioning IPv6 and its advanced IETF developments such asIPv6 adaptation layer over IEEE 802.15.4 (including header compression) known as 6LoWPAN or IPv6 Routing Protocol for Low power and LossyNetworks (RPL) as the way forward. This paper wishes to restore some sanity in this area.
Open and Scalable Architectural ModelWhen embedding networking capabilities in “things”, there are architectural decisions to be made that guarantees the “Internet of Things” isscalable, inclusive of several communication media, secure, future proof and viable for businesses and end-users. Several models can be discussed,(as reviewed below) but one clearly emerges as the best approach.
1. Closed or monolithic architecturesToday, when studying market segments already integrating networking capabilities in “things”, one finds many ad-hoc alliances, proprietary, monolithic or closed protocols. Most of these focus only on the lower layers (Physical and Datalink) of the OSI model to transmit data or elsedefine a complete network stack including application layers that only work on a single communication medium. Fortunately (or unfortunately), itwas demonstrated long ago that the Earth is not flat, meaning in our context that a truly scalable network needs more than a single physical anddata link layer to fit all of the needs and requirements of a diverse set of applications and use cases.
• A proprietary or monolithic protocol installation requires the upgrade of all networking components when moving to new technologies• Markets remain fragmented with no interoperability unless done on the obvious protocol of choice-- the Internet Protocol or IP.• Mix & match of proprietary protocols are costly and inefficient, requiring protocol translation gateways for each protocol stack. Once again, it calls for translation to IP, but use of protocol translation gateways has been proven to be difficult to operate, manage and scale.
Continued next page >>

•7•
FEATURED ARTICLES
2. Why not a new protocol suite?As the “Internet of Things” clearly represents a new generation of devices and applications, some people may think it would be better to beginfrom scratch and create a new architectural model. Although this may look attractive at first glance, such a proposal has a number of known issues:• The “Internet of Things” is going to involve not only interactions between things, but also interaction between humans and their computers or their personal devices, as in the case with remote monitoring or remote control applications. By developing an “Internet of Things” separate from the actual Internet it will encourage market fragmentations as well as a “Balkanization” between both the existing Internet and “Internet of Things” in contrast to the convergence to IP that is now happening in areas such as telephony and TV.
• In addition, open standards are key to the success of any protocol. It generally takes between 5 and 10 years from inception to production implementations. An entirely new architecture will delay the “Internet of Things” and be an obstacle to rapid market adoption.
3. The Internet Protocol (IP)Although certainly not 100% perfect, expecting researchers and others to enhance the protocol suite, the TCP/IP model has demonstrated: • Capacity to be deployed on a very large scale, aka “The Internet”• Centralized (i.e.: an Intranet) or distributed (i.e.: The Internet) deployment models• Versatility to handle all types of traffic, including critical traffic such as voice and video.• Extensive interoperability as IP runs over most if not all available industry standard network links – wireless (802.15.4/6LoWPAN, Wi-Fi, 3G, WiMax,…) and wired (Ethernet, Sonet/SDH, serial,…).
• Open process of standardizations through the IETF and associated standard bodies, enabling consensus on enhancements and interoperability.• Future proofing through the adoption of a next generation of IP protocol, aka IPv6.• Established application level data model and services which are well understood by software developers and widely known to the public through worldwide web applications. The diversity of applications with the web services paradigm is a prominent one thanks to its enablement of distributed computing across platforms, operating systems, programming languages, and of course vendors and products.
• Established network services and architectures for higher-level services and scalable deployments:- Naming, addressing, translation, routing, services discovery, load balancing, caching, and mobility. - Diversity of well understood security mechanisms at different layers and different scopes.- Diversity of network management tools and applications.
Internet Protocol VersionOnce it is agreed that IP is the appropriate architectural model, comes the question of recommending an IP version. The Internet today is goingthrough a transition due to the IPv4 address space exhaustion [OECD, IPv4add-report]. With little existing legacy in the “Internet of Things”, thereis an opportunity to promote IP version 6 (IPv6) as the de-facto IP version for the “Internet of Things”. This recommendation would be fully aligned,such as:
• U.S. OMB and FAR• European Commission IPv6 recommendations• Regional Internet Registry recommendations• IPv4 address depletion countdown
Adoption of IPv6 for the “Internet of Things” benefits from:• A huge address space accommodating any expected multi-millions of deployed “things”. • “Plug & Play” capabilities as IPv6 protocol suite enhance provisioning mechanisms suitable to “Things”. Flexibility of address
configuration as demonstrated by- Stateless IPv6 address configuration- DHCP Individual address configuration- DHCPv6 Prefix Delegation + Stateless IPv6 configuration
• IPv6 is the future IP addressing standard: De facto IP version supported by new physical and data link layers such as IEEE 802.15.4 and IEEE P1901.2 through the standardized IP adaptation layer – IETF 6LoWPAN WG – which only defines IPv6 as protocol version. No IPv4 standard equivalent has been specified.
• De facto IP version for the standardized IETF Routing Protocol for Low Power and Lossy Networks (RPL) – IETF RoLL WG – as it is an IPv6-only protocol.
• If needed, IPv6 over IPv4 tunnelling or IPv6-IPv4 translation could be achieved when “things” would need to communicate with legacy back-end systems not supporting IPv6. It should be noted that all recent operating systems do support the new IP protocol version [OS], making the “translation” requirement as the least preferable solution.
However, an IPv6 address is not a unique identifier and should not be considered to identify a “thing” as the address is expected to change whenthat “thing” gets connected in a different location or network.
Security and PrivacyBy adopting the TCP/IP architecture for the “Internet of Things”, all the lessons from years spent to secure private and public IP infrastructures willapply to the new environments. However, some may consider the “Internet” concept as unsecured or lacking privacy. For this reason, it is importantto remind people that security and privacy are a multi-faceted challenge.
• Security of “things”
Continued next page >>

•8•
FEATURED ARTICLES
As for any device attached to a network, security represents a multi-layered challenge to get addressed by owners or network managers. It rangesfrom
- Securing the physical access to a “thing”.- Authenticating the data link, network and application access.- Encrypting data on data links and network links when necessary – in accordance with regulations.
All existing mechanisms today require appropriate documentation and enhancements for true plug & play.• Network security
Connecting “things” to an IP environment means all network design and policy already defined in an intranet or when providing access the Internetwill apply to the additional sub-networks hosting those “things”. It means that at day one, authentication, access control, firewall and intrusion detection mechanisms should fully be operational for the “Internet of Things”.
• PrivacyThe “Internet of Things” is no more than an additional layer of devices connecting to the Internet. The fact that “things” implement an IP stackdoes not mean they have to be fully reachable over the Internet. As for any node, it is the responsibility of the owner or network manager to decideif the “things” fully participate in the Internet or stays isolated on an intranet.
In addition, when “things” are fully reachable over the Internet, it is still important to decide who can communicate with them, including new mechanisms where “things” could share a physical network, but be managed and accessed by dedicated entities. Once again, similar mechanismsand policies already set-up for intranet and Internet accesses apply. However, additional standards may be required to see new business modeland usage benefiting from the “Internet of Things”. For example, imagine smart meters for electricity, gas and water sharing the same end-user’sbroadband connection. It certainly does not mean that all entities want to share data related to their business between each other. At the sametime, they may want to allow access by the “end-user’s things” to some of the information capture by the smart meters allowing local actions tobe taken for energy savings. This would require new standards efforts to create such models. For example, Zigbee/IP selected an IPv6(6LoWPAN/RPL) stack for its Smart Energy Profile 2.0
Applications & ServicesA successful adoption of the “Internet of Things” will be largely dependent of the availability of applications and services. Similarly to the actual Internet, traffic flows are expected to range from:
• “Things” to back-end servers• “Things” to end-user’s browsers• “Things” to “things”
Ease of use is a key criteria to address mass market. It cannot be expected that an average end-user would manually enter IP(v6) addresses wheninstalling new “things” on a network. Likewise, it may not be assumed that “things” can permanently store all addresses of other “things” in a network. For those reasons, it is believed there is a strong need to develop and standardize naming services for the “Internet of Things.” However,considering the range of traffic flow, naming services must accept address/name resolution for all kind of communications as previously listed. Itcannot be envisaged that an “Internet of Things” naming services would be established disconnected from the existing DNS.
Today, the success of the Internet is largely due to the adoption of worldwide web tools, the new generation of collaborative tools or web 2.0 nowrepresenting the next step. It is expected that standard web services will be widely implemented by the first generation of applications on the“Internet of Things”, especially for management, data presentation and analysis. Some applications may not be web-oriented per se, but wouldenable communications between two “things,” satisfied with a given definition at the application layer.
In some application domains, do exist applications layers that describe device profiles and capabilities in an optimized fashion for low-resourceenvironments. Often times, they are specific to certain devices and interaction types (control-oriented apps like lighting and temperature setting).The IETF CoRE WG and Extended XML (EXI) are examples of enabling such highly optimized and very descriptive application layers to run on anyIP device, including those that are resource-constrained – where 6LoWPAN may be used to provide the underlying IP connectivity – as well asthose that have more traditional resource footprints like computers, handhelds, and servers.
ConclusionDefinition and adoption of standards-compliant IPv6 stack and standards-compliant Web Services are the key enablers for a “thing” to be effectivelyoperated and managed in the broader “Internet of Things.”
References[1] The Internet Assigned Numbers Authority (IANA), http://www.iana.org[1] Executive Office of the President, Office of Management and Budget, “Memorandum for the chief information officers”, Washington D.C., August 2, 2005, http://www.whitehouse.gov/sites/default/files/omb/assets/omb/memoranda/fy2005/m05-22.pdf[2] Department of Defense, General Services Administration, National Aeronautics and Space Administration, “Federal Acquisition Regulation;FAR Case 2005-041, Internet Protocol Version 6 (IPv6)”, Volume 74, Nmb 236, pp 65605-65607, December 10, 2009,http://edocket.access.gpo.gov/2009/E9-28931.htm[3] European Commission IPv6 recommendations, http://ec.europa.eu/information_society/policy/ipv6/index_en.htm[4] American Registry for Internet Numbers (ARIN), “IPv4/IPv5: The Bottom Line”, https://www.arin.net/knowledge/v4-v6.html[5] The IPv4 Depletion Site, http://www.ipv4depletion.com/?page_id=147

•9•
FEATURED ARTICLES
Green Communications and Computing: Questions, Reasons, Issues, Challenges, Approaches, and TrendsBy Jinsong Wu, Bell Laboratories, Shanghai
Recently, the topics on green communications and computing have received many attentions from both industrial and academic researchers. Generally, the importance of green topics comes from globally environmental concerns, including theconcerns of not only energy issues but also resource issues. The urgent needs and challenges of resource-sustainable and/orenergy-efficient green communications and computing are the results of two simultaneously increasing trends of energy/resource costs and communications bandwidths impacting ecological and economic activities around the world. Substantialreduction of energy and resource consumption in the information & communications technology sectors is expected to beachieved through the innovative use of new architectures, protocols, and algorithms, which may fundamentally change concepts, structures, and designs of conventional communication and computing systems. Research in green communications and computing is inter-disciplinary in nature, since the motivation is to obtain energy and resource efficiencies from various areas and levels of communication infrastructures and systems, and the complex communication systems that are a large-scale network composed of a number of interdependent and independent wired orwireless nodes. As the dedicated organizational support in the IEEE Communications Society, the Technical Subcommittee onGreen Communications and Computing (TSCGCC) was established (http://www.comsoc.org/about/committees/emerging#gcc, https://sites.google.com/site/gcccomsoc/) in December 2011. The TSCGCC has established four Special Interest Groups (https://sites.google.com/site/gcccomsoc/sig), including SIG on Green Cellular Networks, SIG on Green SmartGrid Communications, SIG on Green Data Center and Cloud Computing, and SIG on Green Cognitive Communications andComputing Networks. As one of the online community supports, the TSCGCC also has created LinkedIn IEEE Green Communications and Computing (GCC) Group (http://www.linkedin.com/groups?gid=4233179), which currently includes 7 subgroups:
Green Smart Grid Communications (http://www.linkedin.com/groups?gid=4673294), Green Cognitive Communications and Computing (http://www.linkedin.com/groups?gid=4673298), Green Data Center and Cloud Computing (http://www.linkedin.com/groups?gid=4710147), Energy Harvesting (http://www.linkedin.com/groups?gid=4673300), Cloud RAN (Radio Access Network) (http://www.linkedin.com/groups?gid=4673292), Green Wireline Communications and Networking(http://www.linkedin.com/groups?gid=4726456), and Green Standardizations(http://www.linkedin.com/groups?gid=4726224).
As the continuing efforts of Green Panels in IEEE ICC 2012 (http://www.ieee-icc.org/2012/program/indforums/wed_1615.html)and IEEE INFOCOM 2012 (http://www.ieee-infocom.org/2012/panels.html), we continue our promotion efforts on green topicsin IEEE GLOBECOM 2012 Green Communication & Computing Forum (http://www.ieee-globecom.org/2012/indforum1.html),where there are several leading experts in the promising and important topics on Green Communication & Computing, whowould discuss a number of paradigm-shifting topics can be expected, including but not limited to sustainable and/or green network architecture and approaches, sustainable and/or green hardware or chip designs, sustainable and/or green computing,green electricity transmission and distribution systems, green standardizations. The IEEE GLOBECOM 2012 Green Forum maybring the broad and in-depth vision of the emerging areas to the audiences in both industrial and academic perspectives. ThisForum would address the relevant research trends, practical needs, issues, open problems and possible solutions on greencommunications and computing. As one of the leading enthusiastic efforts in promoting the research and development of greencommunications and computing, it is definitely expected that this forum would be both informative and entertaining the IEEEGLOBECOM 2012 audiences.


•11•
EXHIBIT ESSENTIALS
The Exhibit Hall is a hub of activity, with Poster Sessions and refreshment breaks taking place here. The Exhibit Hall provides the perfect placeto mix and mingle with colleagues and friends, and to meet your suppliers.
Prize drawings will be held during the morning and afternoon coffee breaks in the Exhibit Hall. Drop your ticket (included in your registrationpacket) or business card in the ticket tumbler on the stage in the Exhibit Hall. One prize per attendee. Must be present to win.
Check out the monitor in the Exhibit Hall showcasing the #GLOBECOM Twitter Wall, Yammer comments and ComSoc Presidents' RecollectionsVideo, which can also be found at http://www.ieee-globecom.org/presidents/.
Visit the booths and explore an exciting marketplace of services, tools and new technology all designed for your needs.
BEEcube Inc.Booth Number: 14BEEcube is the leading provider of All Programmable Equipment forresearch, development, prototyping and deployment. BEEcube is atthe forefront of technology innovation within Telecom and MILCOMwith applications like LTE-Advanced Remote Radio Units and Baseband Units, MIMO Wi-Fi, backhaul links in E-band radio, SoftwareDefined Radio, Software Defined Networking, Military WLAN, SyntheticAperture Radar, and Phased Array Radar.
Cambridge University PressBooth Number: 18Cambridge University Press is a leading publisher in telecommunications,producing authoritative books and journals for students, researchers,and practitioners. Visit our booth to see a range of new titles including‘Networked Life: 20 Questions and Answers’, by Mung Chang, ‘Principles of Cognitive Radio’, by Ezio Biglieri et al., ‘OFDMA MobileBroadband Communications’, by Junyi Li, Xinzhou Wu, and RajivLaroia, and ‘Detection and Estimation for Communication and RadarSystems’, by Kung Yao, Flavio Lorenzelli, and Chiao-En Chen, and theopen access journal, “APSIPA Transactions on Signal and InformationProcessing.”
CienaBooth Number: 10Ciena is the network specialist. We collaborate with customers worldwide to unlock the strategic potential of their networks and fundamentally change the way they perform and compete. Ciena leverages its deep expertise in packet and optical networking and distributed software automation to delivering solutions in alignmentwith OPn, its approach for building open next-generation networks.We enable a high-scale, programmable infrastructure that can be controlled and adapted by network-level applications, and provideopen interfaces to coordinate computing, storage and network resources in a unified, virtualized environment. We routinely post recent news, financial results and other important announcements andinformation about Ciena on our website, http://www.ciena.com.
General PhotonicsTable #2General Photonics is the leading supplier of timing and polarizationproducts to the telecommunications, photonics and medical imagingmarkets. General Photonics supplies a full line of components, modules and instruments that manage and measure polarized light,including a complete suite of emulation instruments for testing the polarization performance of coherent detection systems.
IEEE Cloud Computing InitiativeBooth Number: Table # 1The IEEE Cloud Computing Initiative is a broad based collaborativeproject sponsored by the IEEE. The initiative is organized across multiple areas that are interdependent. These include big data, conferences, education, publications, standards and a testbed. A webportal serves as a resource that provides news about the initiative’sprogress, articles from the IEEE Xplore digital library, conferencessponsored by IEEE and other organizations, standards, educationalmaterials, interviews from experts, and other relevant information. Information will be available on the overall initiative.
IEEE GLOBECOM 2013Booth Number: 21The 2013 IEEE Global Communications Conference (GLOBECOM) willbe held in Atlanta, GA at the Hilton Hotel, in the heart of downtown’sfinest eating and tourism establishments. Please join us December 9– 13, 2013 an unforgettable conference experience. IEEE GLOBECOM2013 will offer cutting edge communications technology symposia,forums, panel discussions, tutorials, workshops, industry exhibits andrenowned industry CEOs & CTOs in panel sessions and keynotespeeches. And be sure to schedule some time for yourself and yourloved ones to experience many of the nearby family-friendly attractions, such as the largest indoor aquarium in the US, numerousmuseums for art, history, and science (and Coca Cola, of course!), aswell as one of the finest restaurant scenes in North America.
IEEE GLOBECOM 2014Booth Number: 1Austin is proud to host the IEEE Communications Society’s IEEE GlobalCommunications Conference (GLOBECOM) in the heart of Silicon Hills(technology corridor of the Southwest) from December 8 – 12, 2014at the Austin Hilton Hotel Complex. IEEE GLOBECOM 2014 will offerthe latest technology research for the technical community along withan innovative program for industry management and engineers. Austinhas a great music scene, nightlife, weather, and the conference will beheld right in the heart of the most vibrant downtown in the southernUnited States, and one of America's fastest growing, youngest, andmost desirable cities.
IEEE ICC 2013Booth Number: 15IEEE ICC 2013 will be held in the charming city of Budapest, Hungaryfrom June 9 – 13, 2013. The conference will be hosted in three adjacent five-star hotels in the very heart of the city, on the banks ofthe river Danube. The hotels offer magnificent panoramic views acrossthe river, the Gellert Hill and the Royal Castle District, part of the UNESCO World Heritage. Submissions to the technical symposia havenow been closed. However, you can still submit your contribution to28 topical workshops held in conjunction with the main conference.We much look forward to an enlightening and enjoyable event withyou!

•12•
EXHIBIT ESSENTIALS
IEEE ICC 2014Booth Number: 2The 2014 IEEE International Conference on Communications (ICC) willbe held in the beautiful city of Sydney, Australia from June 16 – 20,2014. Themed “Communications: The Centrepoint of Digital Economy,” this flagship conference of IEEE Communications Societywill feature a comprehensive technical program including twelve Symposia and a number of Tutorials and Workshops. IEEE ICC 2014will also include an exceptional expo program including keynote speakers and Industry Forum & Exhibitions.
IEEE ICC 2015Booth Number: 3The 2015 IEEE International Conference on Communications (ICC) willbe hosted in June 2015 in ExCel London, the largest convention centerin the United Kingdom. London is the largest metropolitan area in theUnited Kingdom and the largest urban zone in the European Union. It is a leading global city, with strengths in the arts, commerce, education, entertainment, fashion, finance, healthcare, media, professional services, research and development, tourism and transport. London has become the first city to host the SummerOlympics three times. For more information, please contact ExecutiveChairman Professor Jiangzhou Wang of University of Kent [email protected].
IEEE Women in Engineering (WIE)Booth Number: 16The mission of IEEE WIE is to facilitate the recruitment and retentionof women in technical disciplines globally. IEEE WIE envisions a vibrant community of IEEE women and men collectively using their diverse talents to innovate for the benefit of humanity. Goals includefacilitating the development of programs and activities that promotethe entry into and retention of women in engineering programs andenhancing the career advancement of women in the profession.
National InstrumentsBooth Number: 9Since 1976, National Instruments has equipped engineers and scientists with tools that accelerate productivity, innovation, and discovery. NI’s graphical system design approach to engineering provides an integrated software and hardware platform that speedsthe development of any system needing measurement and control.With NI software defined radio (SDR) solutions, engineers can buildpowerful, flexible systems spanning design to test applications. NILabVIEW software offers a single platform that abstracts hardwarecomplexities to shorten user learning curves without sacrificing flexibility. The unique integrated flow encompasses heterogeneousmultiprocessing, allowing for scalable solutions. NI also delivers a newapproach to RF and communications education through affordableSDR solutions by providing opportunities for hands-on implementation and exploration of a working communications systemwith live signals.
RANPLAN Wireless Network Design Ltd.Booth Number: 17RANPLAN Wireless Network Design Ltd. is a wireless technology company that produces the world leading in-building wireless networkplanning and optimisation (P&O) software tool – iBuildNet®, a worldleading radio propagation tool Ranplan Radiowave Propagation Simulator (RRPS), and world leading WiFi and small cell/HetNet optimization tools Ranplan-Fi® and Ranplan-HetNet® Suite. For moreinformation about RANPLAN and the services and products it provides, please visit www.ranplan.co.uk.
SaracenBooth Number: 8The SARACEN (Socially Aware, collaboRative, scAlable Coding mEdiadistribution) EU project will demonstrate the results of the work performed in multimedia networking, towards the definition and prototype implementation of a platform for streaming media deliveryover P2P architectures, featuring social networking capabilities. Thedemonstration will rely on the exhibition of a working prototype whichwill be able to stream content over P2P and use a DLNA compatibledevice to reproduce it in a home environment. In parallel, demonstration of a smart switching between 2D and 3D based on theautomatic detection of use (or not) of 3D glasses will be demonstrated.
Finally, in order to demonstrate the social networking capabilities ofthe platform, IEEE GLOBECOM participants will be invited to participatein a User Generated Content contest in which videos having as topicthe conference will be able to be uploaded, commented and taggedthrough the SARACEN Social Networking API.
SpringerBooth Number: 19Springer is a leading publisher of books, journals and electronic products. Visit us to purchase our latest publications at a 20% conference discount. Our publishers are available to answer any questions you may have. Visit springer.com/engineering for more information on our latest products.
Wiley-BlackwellBooth Number: 7Wiley's Scientific, Technical, Medical, and Scholarly (STMS) business,also known as Wiley-Blackwell, serves the world's research and scholarly communities, and is the largest publisher for professionaland scholarly societies. Wiley-Blackwell's programs encompass journals, books, major reference works, databases, and laboratorymanuals, offered in print and electronically. Through Wiley Online Library, we provide online access to a broad range of STMS content:over 4 million articles from 1,500 journals, 9,000+ books, and manyreference works and databases.

•13•
YESTERDAY’S NEWS
First Day of IEEE GLOBECOM 2012 Concluded with Evening of Fine Dining, Good Company & Entertainment
Hundreds of IEEE GLOBECOM 2012 participants mingled and socialized during Monday night’s first-ever, First Time Attendee Reception heldat the Sleeping Beauty Pavilion in the Fantasy Tower of the Disneyland Hotel. Leading the welcome to this flagship conference of the IEEE Communications Society was Bruce Worthman, the society’s Director, Conferences, Finance & Administration IEEE Communications, whothanked all the new-comers for their attendance, while introducing the evening’s speakers.
In addition to the opportunity to meet and greet new and existing friends, IEEE ComSoc President Vijay Bhargava spoke of the first IEEE GLOBCOM he attended in 1972 and cited the society’s 60th anniversary as an example of its ongoing dedication to the advance of communications worldwide. Paul Hartmann, IEEE ComSoc’s acting GIMS Committee Chair then followed the comments of IEEE ComSoc VicePresident of Conferences Abbas Jamalipour by reinforcing IEEE GLOBECOM’s global status as a premier venue for watching technologies growand collaborating with colleagues who deeply share their interests and expertise.
Afterwards, IEEE GLOBECOM 2012 Executive Chair Pierre Perra offered all the attendees the opportunity to experience the wealth of knowledgeoffered by the hundreds of sessions, tutorial and workshops comprising this year’s agenda. He also invited everyone to share their commentswith global colleagues, friends and family through the conference’s Twitter, Facebook Yammer and LinkedIn sites located at www.ieee-globecom.org/2012.
Immediately following this introductory get-together, IEEE GLOBECOM 2012 attendees filled the South Exhibit Hall of the Disney Hotel’s FantasyTower for the Annual Welcome Reception & Exhibition Hall Grand Opening. After the welcoming remarks of IEEE ComSoc President Vijay Bhargava and IEEE GLOBECOM 2012 Executive Chair Pierre Perra, participants toured the exhibits of leading companies like Ciena, RanplanWireless Net Design, Cambridge University Press and Springer, while dining on roast beef, turkey, sushi, pasta, chicken ravioli and an assortmentof chocolate-covered deserts. In the background, Ryan Andreas, the 2011 “America’s Got Talent” competitor serenaded the audience with themusic of Elton John and numerous other leading singers and composers.
Monday Afternoon Industry Tutorials Detailed New M2M, Cloud Computing & Cognitive Radio Advances
Yesterday afternoon, a full room of attendees participating in the “M2M Smart Grid & Smart Cities” industry tutorial learned of the latest effortsto seamlessly connect billions of subscribers to trillions of objects in real-time, while maximizing energy efficiencies and minimizing the production of harmful hydrocarbons. Described as the “Industrial Internet,” Mischa Dohler of the Centre Tecnològic de Telecomunicacions deCatalunya (CTTC) in Spain addressed the ongoing efforts to connect the two worlds of ICT and energy and seamlessly gather cross domainsof data that will produce, smarter and cleaner methods for supporting the world’s population. This includes the one out of two individuals thatlive in cities worldwide and the two million people that die annually from pollution-related events.
Highlighted in his discussion was an in-depth introduction to M2M systems, standards compliant low-power multihop networking designs aswell as low power Wifi and their combined ability to automate instrumentation capable of monitoring parking, traffic, trash bins and publiclighting in an attempt to reduce the manpower and energy accompanying these activities. According to Dohler, the key to this future energylandscape is the development of standards and flat architectures that link the various worlds in this ecosystem, while creating applications thatbenefit widespread industrial and humanitarian purposes.
Other afternoon sessions on Monday drew hundreds of attendees to the industry tutorials on “Programmable Cloud Computing & Networking,”“Wireless Cognitive Radio,” “Internet as a New Paradigm and “Software Testing in the Network Environment.” In his session highlightingInternet paradigms, Bob Frankston, IEEE Fellow, detailed the principles enabling innovations in connectivity within homes and other venues,while the “Quality of Service Provisioning in Wireless Cognitive Radio Network” presentation addressed scores of participants about the rapidemergence of cognitive radio technologies and the new methods for increasing spectrum efficiency and driving the advance of QoS-assurancewireless cognitive radio networks.


•15•
IEEE GLOBECOM 2012 BEST PAPERS
On the following pages, the 3 of 15 papers featured are from Symposia on Communications QoS, Reliability, and Modeling, Signal Processing for Communications and Next Generation Networking and Internet.
1
A Robust WiMAX Scheduler for EPON-WiMAX
NetworksMariana P. Dias and Nelson L. S. da Fonseca
Institute of Computing, University of Campinas
Abstract—The integration of WiMAX networks with EPONnetworks capitalizes on the large availability of bandwidth inoptical access networks with the mobility provided by wirelesstechnologies. In this integration, a WiMAX scheduler needs totake into account the variability of the channel capacity providedby the EPON scheduler. This paper evaluates the performance ofthe Deficit Based QoS Uplink Scheduler (DBQUS) mechanism, astandard-compliant WiMAX uplink scheduler designed to oper-ate in ONU-BS, under different EPON service cycle durations.The evaluation is conducted using integrated simulators for theWiMAX and for the EPON components. Results show that theproposed scheduler is able to provide QoS to the subscriberstations under different EPON service cycles. As the traffic loadincreases, the bandwidth received by the BE service flow isreduced due to the service provided to classes of service withhigher priority.
Index Terms—WiMAX, EPON, Quality of Service, Scheduling,Integrated Network.
I. INTRODUCTION
The integration of wireless and optical access networks
capitalizes on the advantage of large bandwidth availability
of optical networks as well as on the mobility provided by
wireless networks.
Among the broadband access technologies the Worldwide
Interoperability for Microwave Access (WiMAX) [1] and
optical Ethernet Passive Optical Network (EPON) [2] tech-
nologies have been successfully deployed in several countries
and can be easily integrated since the majority of WiMAX
Base Stations comes with an ethernet port that can be plugged
into Optical Network Unit (ONU). WiMAX is a broadband
wireless access network that provides Quality of Service
(QoS), wide coverage, low cost infrastructure and high speed
access while EPON is an optical access network with no active
elements which provides large amount of bandwidth to the
users.
These two technologies have several similarities. They can
work in point to multipoint infrastructures and they adopt
polling bandwidth granting protocol. Both EPON and WiMAX
employ a request/grant mechanism for bandwidth allocation.
In EPON, the Optical Line Terminal (OLT) polls the ONU
for bandwidth requests while in WiMAX networks the base
stations (BS) poll the subscriber stations (SSs).
Different architectures for this integration have been pro-
posed [3]. In the hybrid architecture, the WiMAX base station
is a client of the EPON network and it is connected to an ONU
of the EPON, denoted as ONU-BS. In the EPON network,
the OLT distributes the available bandwidth among the ONUs
in a cyclical way, at every round of bandwidth granting, the
EPON protocol decides the amount of bandwidth each ONU
will receive. In addition, the bandwidth granted to the ONU-
BS must be distributed among the SSs.
In such integrated network, the bandwidth received by the
BS changes at every round of the EPON bandwidth granting
cycle. Therefore, the WiMAX scheduler located at the ONU-
BS should take into account this variability when providing
transmission opportunities to its SSs. It is possible that the
BS receives less bandwidth in a round than the necessary to
support the QoS requirements of its connections. Therefore,
special WiMAX scheduler needs to be defined for dealing with
such variabilities to provide QoS support to its connections.
Indeed, the bandwidth granting cycle of these two networks
can be different which imposes extra challenges to the QoS
provisioning to the WiMAX SSs.
This paper evaluates the DBQUS WiMAX scheduler for
integrated EPON-WiMAX [4] networks, a standard compliant
scheduler, in scenarios in which there are differences between
bandwidth cycles duration. Most of existing work [5] [6]
[7] [8] [9] [10] proposes changes or even new bandwidth
granting protocols for the EPON part of the integrated network.
Conversely, the DBQUS scheduler has the great advantage
of being independent of the EPON protocol adopted. This
facilitates the deployment of EPON-WiMAX networks since
no change is needed in the EPON network. Results derived via
simulation show that the new DBQUS scheduler is capable to
provide the QoS requirements of the WiMAX connections as
well it is robust to the differences between bandwidth granting
cycle duration of these two networks.
This paper is organized as follows. Section II shows related
work. Section III describes the integrated EPON-WiMAX
network design and operation. Section IV presents the DBQUS
scheduling mechanism. Section V gives details on how the
simulation experiments were conducted. Section VI shows the
analysis of the results obtained. Section VII draws conclusions.
II. RELATED WORK
Several scheduling mechanisms have been proposed to
integrated EPON-WiMAX networks.
In [5], the authors proposed the QoS-based Dynamic Band-
width Allocation (QDBA) together with the Prediction-based
Fair Excessive Bandwidth Allocation (PFEBA) scheme to
enhance the system performance in EPONs. In QDBA, each
2
ONU handles three queues with different priorities and it also
classifies WiMAX traffics into these three priority levels for
assigning the traffic to different queues.
The dynamic bandwidth allocation scheme in [6], consid-
ered an integrated network to enable data transmission across
optical and wireless networks, and an end-to-end differentiated
service for diverse QoS requirements. This QoS-aware scheme
supports bandwidth fairness at the ONU-BS level and class of
service at the WiMAX subscriber station level. The authors
had also evaluated the integrated network by examining the
effect of EPON service cycle and WiMAX frame duration
under different SS numbers.
A QoS-aware scheduling mechanism for the integrated
EPON-WiMAX network is proposed in [9] but it does not
consider the size of the ONU queues.
In [10], a two-level scheduling scheme for the integrated
EPON-WiMAX network was proposed which takes into con-
sideration the queue length and head-of-line (HoL) delays. In
this scheme, it is used proportional fairness scheduling for
the SSs and a centralized mechanism at OLT that connects to
multiple ONU-BSs.
None of these bandwidth allocation mechanisms support all
service flows defined in the WiMAX standards. The scheduler
proposed here is for the ONU-BS and it has the great ad-
vantage of being independent of the EPON protocol adopted.
This facilitates the deployment of EPON-WiMAX networks
and increases its benefits.
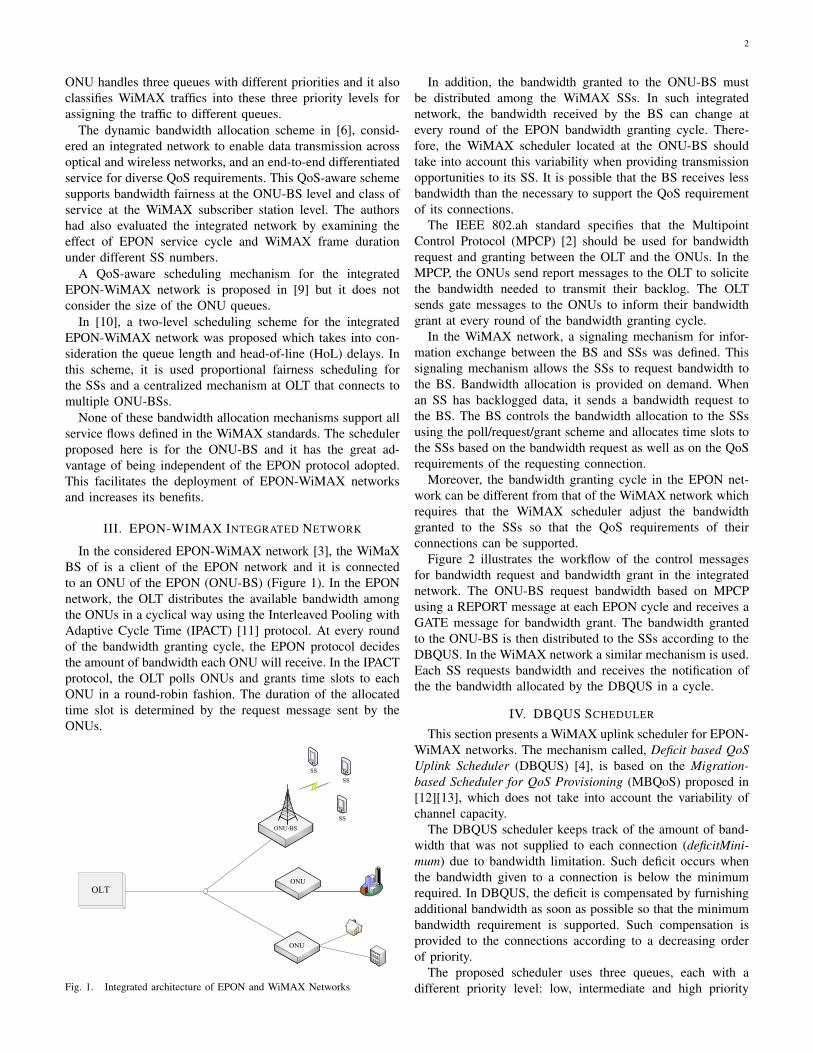
III. EPON-WIMAX INTEGRATED NETWORK
In the considered EPON-WiMAX network [3], the WiMaX
BS of is a client of the EPON network and it is connected
to an ONU of the EPON (ONU-BS) (Figure 1). In the EPON
network, the OLT distributes the available bandwidth among
the ONUs in a cyclical way using the Interleaved Pooling with
Adaptive Cycle Time (IPACT) [11] protocol. At every round
of the bandwidth granting cycle, the EPON protocol decides
the amount of bandwidth each ONU will receive. In the IPACT
protocol, the OLT polls ONUs and grants time slots to each
ONU in a round-robin fashion. The duration of the allocated
time slot is determined by the request message sent by the
ONUs.
Fig. 1. Integrated architecture of EPON and WiMAX Networks
In addition, the bandwidth granted to the ONU-BS must
be distributed among the WiMAX SSs. In such integrated
network, the bandwidth received by the BS can change at
every round of the EPON bandwidth granting cycle. There-
fore, the WiMAX scheduler located at the ONU-BS should
take into account this variability when providing transmission
opportunities to its SS. It is possible that the BS receives less
bandwidth than the necessary to support the QoS requirement
of its connections.
The IEEE 802.ah standard specifies that the Multipoint
Control Protocol (MPCP) [2] should be used for bandwidth
request and granting between the OLT and the ONUs. In the
MPCP, the ONUs send report messages to the OLT to solicite
the bandwidth needed to transmit their backlog. The OLT
sends gate messages to the ONUs to inform their bandwidth
grant at every round of the bandwidth granting cycle.
In the WiMAX network, a signaling mechanism for infor-
mation exchange between the BS and SSs was defined. This
signaling mechanism allows the SSs to request bandwidth to
the BS. Bandwidth allocation is provided on demand. When
an SS has backlogged data, it sends a bandwidth request to
the BS. The BS controls the bandwidth allocation to the SSs
using the poll/request/grant scheme and allocates time slots to
the SSs based on the bandwidth request as well as on the QoS
requirements of the requesting connection.
Moreover, the bandwidth granting cycle in the EPON net-
work can be different from that of the WiMAX network which
requires that the WiMAX scheduler adjust the bandwidth
granted to the SSs so that the QoS requirements of their
connections can be supported.
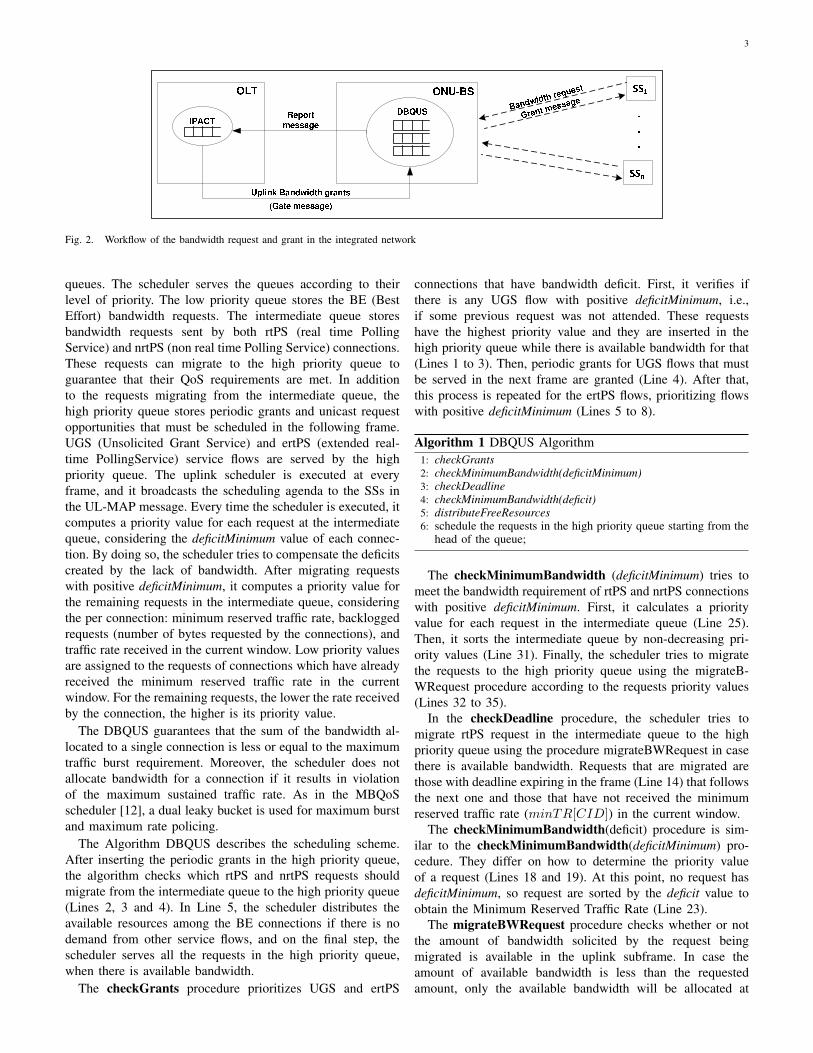
Figure 2 illustrates the workflow of the control messages
for bandwidth request and bandwidth grant in the integrated
network. The ONU-BS request bandwidth based on MPCP
using a REPORT message at each EPON cycle and receives a
GATE message for bandwidth grant. The bandwidth granted
to the ONU-BS is then distributed to the SSs according to the
DBQUS. In the WiMAX network a similar mechanism is used.
Each SS requests bandwidth and receives the notification of
the the bandwidth allocated by the DBQUS in a cycle.
IV. DBQUS SCHEDULER
This section presents a WiMAX uplink scheduler for EPON-
WiMAX networks. The mechanism called, Deficit based QoS
Uplink Scheduler (DBQUS) [4], is based on the Migration-
based Scheduler for QoS Provisioning (MBQoS) proposed in
[12][13], which does not take into account the variability of
channel capacity.
The DBQUS scheduler keeps track of the amount of band-
width that was not supplied to each connection (deficitMini-
mum) due to bandwidth limitation. Such deficit occurs when
the bandwidth given to a connection is below the minimum
required. In DBQUS, the deficit is compensated by furnishing
additional bandwidth as soon as possible so that the minimum
bandwidth requirement is supported. Such compensation is
provided to the connections according to a decreasing order
of priority.
The proposed scheduler uses three queues, each with a
different priority level: low, intermediate and high priority
3
Fig. 2. Workflow of the bandwidth request and grant in the integrated network
queues. The scheduler serves the queues according to their
level of priority. The low priority queue stores the BE (Best
Effort) bandwidth requests. The intermediate queue stores
bandwidth requests sent by both rtPS (real time Polling
Service) and nrtPS (non real time Polling Service) connections.
These requests can migrate to the high priority queue to
guarantee that their QoS requirements are met. In addition
to the requests migrating from the intermediate queue, the
high priority queue stores periodic grants and unicast request
opportunities that must be scheduled in the following frame.
UGS (Unsolicited Grant Service) and ertPS (extended real-
time PollingService) service flows are served by the high
priority queue. The uplink scheduler is executed at every
frame, and it broadcasts the scheduling agenda to the SSs in
the UL-MAP message. Every time the scheduler is executed, it
computes a priority value for each request at the intermediate
queue, considering the deficitMinimum value of each connec-
tion. By doing so, the scheduler tries to compensate the deficits
created by the lack of bandwidth. After migrating requests
with positive deficitMinimum, it computes a priority value for
the remaining requests in the intermediate queue, considering
the per connection: minimum reserved traffic rate, backlogged
requests (number of bytes requested by the connections), and
traffic rate received in the current window. Low priority values
are assigned to the requests of connections which have already
received the minimum reserved traffic rate in the current
window. For the remaining requests, the lower the rate received
by the connection, the higher is its priority value.
The DBQUS guarantees that the sum of the bandwidth al-
located to a single connection is less or equal to the maximum
traffic burst requirement. Moreover, the scheduler does not
allocate bandwidth for a connection if it results in violation
of the maximum sustained traffic rate. As in the MBQoS
scheduler [12], a dual leaky bucket is used for maximum burst
and maximum rate policing.
The Algorithm DBQUS describes the scheduling scheme.
After inserting the periodic grants in the high priority queue,
the algorithm checks which rtPS and nrtPS requests should
migrate from the intermediate queue to the high priority queue
(Lines 2, 3 and 4). In Line 5, the scheduler distributes the
available resources among the BE connections if there is no
demand from other service flows, and on the final step, the
scheduler serves all the requests in the high priority queue,
when there is available bandwidth.
The checkGrants procedure prioritizes UGS and ertPS
connections that have bandwidth deficit. First, it verifies if
there is any UGS flow with positive deficitMinimum, i.e.,
if some previous request was not attended. These requests
have the highest priority value and they are inserted in the
high priority queue while there is available bandwidth for that
(Lines 1 to 3). Then, periodic grants for UGS flows that must
be served in the next frame are granted (Line 4). After that,
this process is repeated for the ertPS flows, prioritizing flows
with positive deficitMinimum (Lines 5 to 8).
Algorithm 1 DBQUS Algorithm
1: checkGrants2: checkMinimumBandwidth(deficitMinimum)3: checkDeadline4: checkMinimumBandwidth(deficit)5: distributeFreeResources6: schedule the requests in the high priority queue starting from the
head of the queue;
The checkMinimumBandwidth (deficitMinimum) tries to
meet the bandwidth requirement of rtPS and nrtPS connections
with positive deficitMinimum. First, it calculates a priority
value for each request in the intermediate queue (Line 25).
Then, it sorts the intermediate queue by non-decreasing pri-
ority values (Line 31). Finally, the scheduler tries to migrate
the requests to the high priority queue using the migrateB-
WRequest procedure according to the requests priority values
(Lines 32 to 35).
In the checkDeadline procedure, the scheduler tries to
migrate rtPS request in the intermediate queue to the high
priority queue using the procedure migrateBWRequest in case
there is available bandwidth. Requests that are migrated are
those with deadline expiring in the frame (Line 14) that follows
the next one and those that have not received the minimum
reserved traffic rate (minTR[CID]) in the current window.
The checkMinimumBandwidth(deficit) procedure is sim-
ilar to the checkMinimumBandwidth(deficitMinimum) pro-
cedure. They differ on how to determine the priority value
of a request (Lines 18 and 19). At this point, no request has
deficitMinimum, so request are sorted by the deficit value to
obtain the Minimum Reserved Traffic Rate (Line 23).
The migrateBWRequest procedure checks whether or not
the amount of bandwidth solicited by the request being
migrated is available in the uplink subframe. In case the
amount of available bandwidth is less than the requested
amount, only the available bandwidth will be allocated at
4
Algorithm 2 Procedures
1: checkGrants2: for each UGS connection u do3: if availableBW > 0 and deficitMinimum[u] > 0 then4: MigrateBWRequest(u);5: Insert the UGS grants while availableBW > 06: for each ertPS connection e do7: if availableBW > 0 and deficitMinimum[e] > 0 then8: MigrateBWRequest(e);9: Insert the ertPS grants while availableBW > 0
10: checkDeadline11: for each request i at the intermediate queue do12: if avilableBW == 0 then13: break;14: if service[CID] == rtPS then15: frame[i] = ⌊(deadline[i] - currentTime) / frameDuration⌋;16: if frame[i] == 3 and TwndTR[CID] < minTR[CID] then17: MigrateBWRequest(i);18: checkMinimumBandwidth (priority type)19: for each connection of type rtPS ou nrtPS do20: backlogged tmp[CID] = backlogged[CID];21: TwndTR tmp[CID] = TwndTR[CID];22: bucket2 tmp[CID] = bucket2[CID];23: for each request i at the intermediate queue do24: if minTR[CID] ≤ TwndTR tmp[CID] or bucket2 tmp[CID]
== 0 then25: priority[i] = 0;26: else27: if priorityType == deficitMinimum then28: priority[i] = backlogged tmp[CID] -
(TwndTR tmp[CID] - minTR[CID]);29: else30: priority[i] = minTR[CID] - TwndTR tmp[CID];31: TwndTR tmp[CID] = TwndTR tmp[CID] + BR[i];32: bucket2 tmp[CID] = bucket2 tmp[CID] + BR[i];33: backlogged tmp[CID] = backlogged tmp[CID] - BR[i];34: Sort the intermediate queue by priority in non-decreasing order.35: for each request i at the intermediate queue do36: if avilableBW == 0 or (priorityType == deficitMinimum and
priority[i] ≤ 0 ) then37: break;38: MigrateBWRequest(i);39: DistributeFreeResources40: for each connection of type BE do41: if avilableBW = 0 then42: break;43: MigrateBWRequest(i);44: MigrateBWRequest(i)45: if BR[i] > avilableBW then46: grantSize = availbleBw;47: else48: grantSize = BR[i];49: if grantSize > bucket2[CID] then50: grantSize = bucket2[CID];51: if 0 < grantSize < BR[i] then52: Create a new request j for connection CID with BR[j] = BR[i]
- grantSize;53: Insert request j in the end of the intermediate queue;54: BR[i] = grantSize;55: Move the request i to the high priority queue;56: TwndTR[CID] = TwndTR[CID] + grantSize;57: bucket2[CID] = bucket2[CID] - grantSize;58: backlogged[CID] = backlogged[CID] - grantSize;59: availableBW = availableBW - grantSize;
this scheduling time (Line 43). The allocation of part of the
requested bandwidth will be deferred in case it results in
violation of the maximum traffic burst requirement. Once the
amount of bandwidth that can be allocated to the request is
defined (grantSize) and if the grantSize value is less than
the bandwidth requested by a connection, a new request is
created with size equal to the amount of bandwidth that will
be migrated and, after that, it is inserted at the end of the
intermediate queue (Lines 46 to 48). The amount of bandwidth
solicited by a request is updated to grantSize and the request
is migrated to the high priority queue (Line 50).
The distributeFreeResources procedure distributes the
available bandwidth, if any, among the BE requests by mi-
grating the chosen requests from the low priority queue to the
high priority queue (Lines 36 to 39).
V. SIMULATION
The effectiveness of the DBQUS was assessed by simulation
using the WiMAX module of the Network Simulator (NS-3)
[14]. The EPON module was designed in Java. The duration
of each simulation was 1200 seconds. Confidence interval
with 95% confidence level were derived by the method of
independent replication.
The simulated network consisted of 15 ONUs, 1 ONU-BS
and a set of 25 SSs. The capacity of the ONU-BS is 30Mbps
and the EPON channel is 1Gbps. Each SS has only one service
flow. The experiments used different types of traffic: voice,
voice with silence suppression, video and FTP, which were
associated with UGS, ertPS, rtPS and nrtPS services.
The traffic was generated in the WiMAX network as fol-
lows. The voice model used was an exponential on/off model.
The mean duration of the on and of the off periods equals to
1.2 s and 1.8 s, respectively. During the on periods, 66-byte
packets are generated at every 20-ms. The voice with silence
suppression model used the Enhanced Variable Rate Codec
(EVRC) [15], with packets generated every 20 ms employing
Rate 1 (171 bits/packet), Rate 1/2 (80 bits/packet), Rate 1/4
(40 bits/packet) or Rate 1/8 (16 bits/packet). Video traffic was
generated by real video traces [16]. FTP traffic was generated
using an exponential distribution with a mean of 512 KBytes.
To generate the ONU’s traffic, CBR sources generate 24
byte packets at every 125µs as well as ON-OFF pareto sources.
Inter burst generation time is exponential distributed and the
burst duration is Pareto distributed and packet lengths were of
594 and 1518 bytes long [17].
The maximum latency requirement for rtPS connections was
300 ms. Each connection had its own minimum reserved traffic
rate requirement and maximum sustained traffic rate which
varied according to the rate of the transmitted video. The
nrtPS service reserved traffic rate requirement and maximum
sustained traffic rate requirement are 200Kbps and 800 Kbps,
respectively. The unsolicited grant interval requirement for
UGS and ertPS was 20ms. The BE service does not have any
QoS requirement.
VI. NUMERICAL RESULTS
This section evaluates the robustness of the proposed sched-
uler via simulation. The aim of these experiments is to assess
5
TABLE ISIMULATION PARAMETERS
Number of ONUs 15
Number of ONU-BS 1
Number of SSs 25
WiMAX maximum data rate 30Mbps
EPON maximum data rate 1Gbps
Buffer size in ONU 10Mbyte
WiMAX frame length 5ms
PON cycle time 2ms and 10ms
the DBQUS ability to support QoS requirements of the SSs
connections under variable bandwidth furnished by the EPON
scheduler. In additional objective is to evaluate the DBQUS ca-
pacities of supporting QoS when there is a mismatch between
the bandwidth granting cycle of the EPON network and the
granting cycle of the WiMAX network.
The simulation scenario includes one ONU-BS and 25 SSs
in steps of 5 units (one new SS for each type of service). Table
I shows the simulation parameters used in the simulation.
Figures 3 and 4 show, respectively, the throughput and delay
per SS as a function of the number of SSs for different values
of the EPON cycle duration.
As expected the per station throughput decreases as the
number of SSs increases, having a sharper decrease in net-
works with 20 SSs given the saturation of the network. More-
over, the longer the EPON cycle, the higher is the throughput
achieved by the SSs given the reduced overhead for granting
the required bandwidth by the SSs.
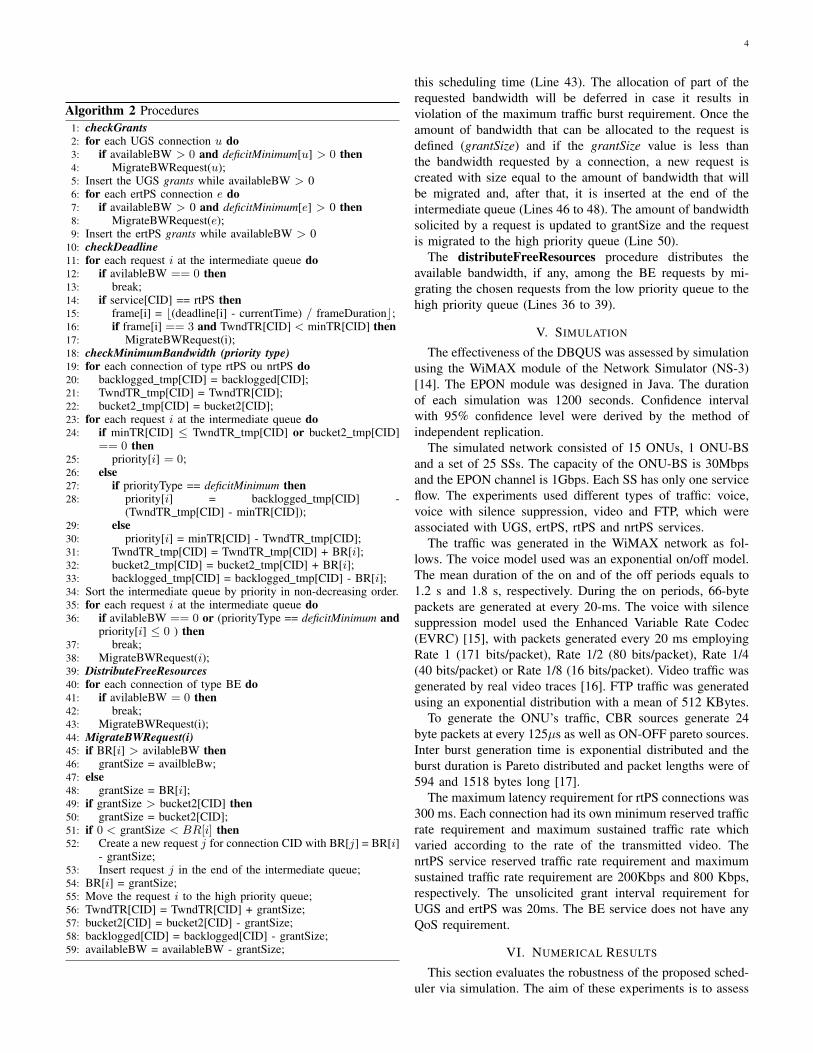
The delay (Figure 4) increases with the increase of the
duration of the EPON cycle since the SSs have to wait longer
to receive their bandwidth grant. With 20 SSs, the network is
saturated and the delay starts to increase sharply. However, as
will be shown in the following figures, the QoS requirements
of the connections are supported regardless the aggregated
increase of the delay.
Fig. 3. Throughput of SSs under different EPON cycle time
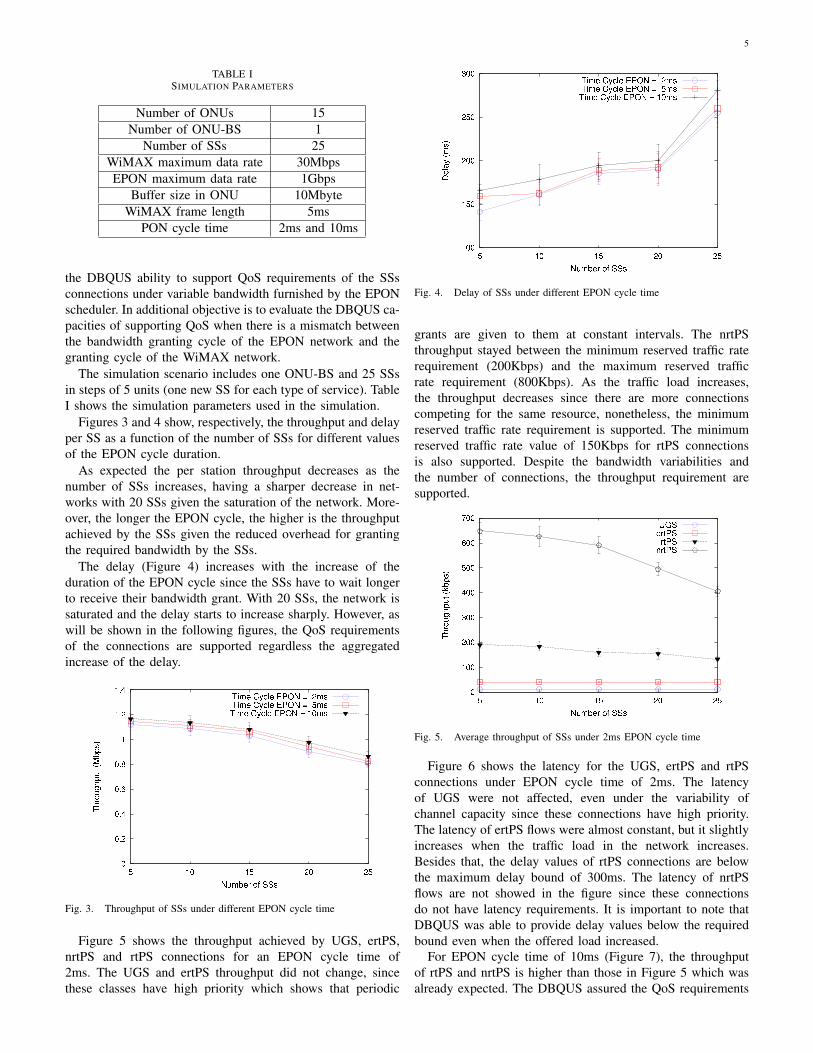
Figure 5 shows the throughput achieved by UGS, ertPS,
nrtPS and rtPS connections for an EPON cycle time of
2ms. The UGS and ertPS throughput did not change, since
these classes have high priority which shows that periodic
Fig. 4. Delay of SSs under different EPON cycle time
grants are given to them at constant intervals. The nrtPS
throughput stayed between the minimum reserved traffic rate
requirement (200Kbps) and the maximum reserved traffic
rate requirement (800Kbps). As the traffic load increases,
the throughput decreases since there are more connections
competing for the same resource, nonetheless, the minimum
reserved traffic rate requirement is supported. The minimum
reserved traffic rate value of 150Kbps for rtPS connections
is also supported. Despite the bandwidth variabilities and
the number of connections, the throughput requirement are
supported.
Fig. 5. Average throughput of SSs under 2ms EPON cycle time
Figure 6 shows the latency for the UGS, ertPS and rtPS
connections under EPON cycle time of 2ms. The latency
of UGS were not affected, even under the variability of
channel capacity since these connections have high priority.
The latency of ertPS flows were almost constant, but it slightly
increases when the traffic load in the network increases.
Besides that, the delay values of rtPS connections are below
the maximum delay bound of 300ms. The latency of nrtPS
flows are not showed in the figure since these connections
do not have latency requirements. It is important to note that
DBQUS was able to provide delay values below the required
bound even when the offered load increased.
For EPON cycle time of 10ms (Figure 7), the throughput
of rtPS and nrtPS is higher than those in Figure 5 which was
already expected. The DBQUS assured the QoS requirements
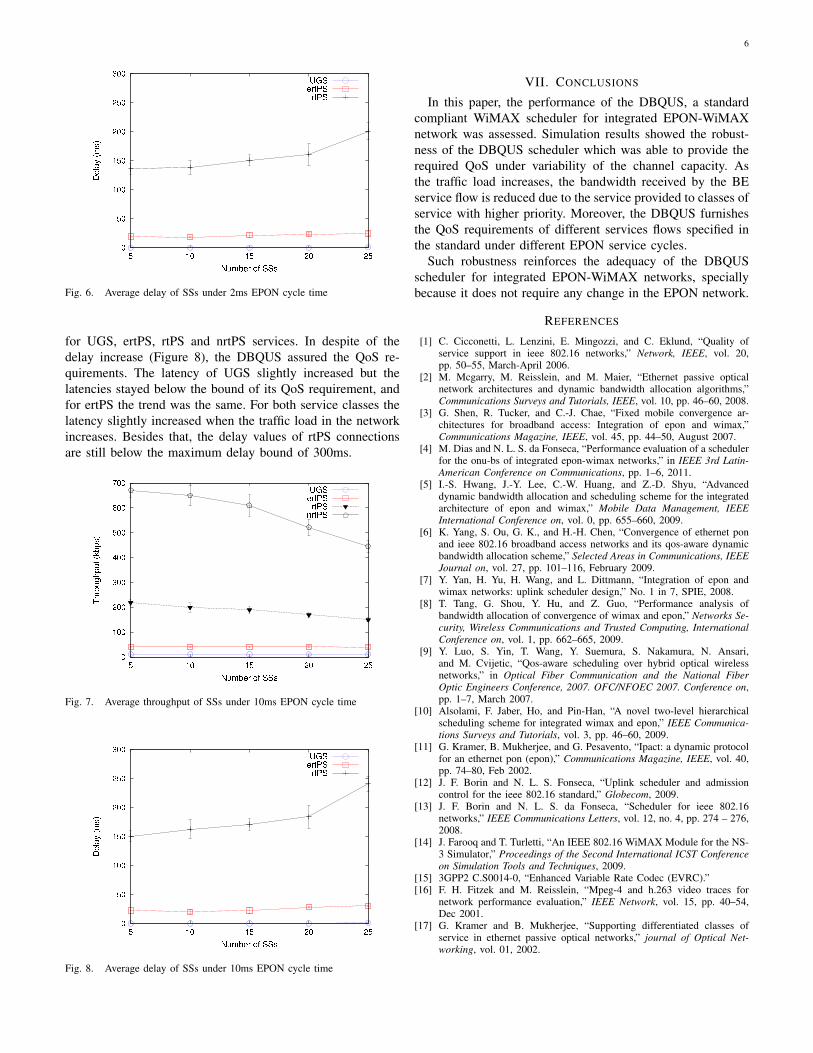
6
Fig. 6. Average delay of SSs under 2ms EPON cycle time
for UGS, ertPS, rtPS and nrtPS services. In despite of the
delay increase (Figure 8), the DBQUS assured the QoS re-
quirements. The latency of UGS slightly increased but the
latencies stayed below the bound of its QoS requirement, and
for ertPS the trend was the same. For both service classes the
latency slightly increased when the traffic load in the network
increases. Besides that, the delay values of rtPS connections
are still below the maximum delay bound of 300ms.
Fig. 7. Average throughput of SSs under 10ms EPON cycle time
Fig. 8. Average delay of SSs under 10ms EPON cycle time
VII. CONCLUSIONS
In this paper, the performance of the DBQUS, a standard
compliant WiMAX scheduler for integrated EPON-WiMAX
network was assessed. Simulation results showed the robust-
ness of the DBQUS scheduler which was able to provide the
required QoS under variability of the channel capacity. As
the traffic load increases, the bandwidth received by the BE
service flow is reduced due to the service provided to classes of
service with higher priority. Moreover, the DBQUS furnishes
the QoS requirements of different services flows specified in
the standard under different EPON service cycles.
Such robustness reinforces the adequacy of the DBQUS
scheduler for integrated EPON-WiMAX networks, specially
because it does not require any change in the EPON network.
REFERENCES
[1] C. Cicconetti, L. Lenzini, E. Mingozzi, and C. Eklund, “Quality ofservice support in ieee 802.16 networks,” Network, IEEE, vol. 20,pp. 50–55, March-April 2006.
[2] M. Mcgarry, M. Reisslein, and M. Maier, “Ethernet passive opticalnetwork architectures and dynamic bandwidth allocation algorithms,”Communications Surveys and Tutorials, IEEE, vol. 10, pp. 46–60, 2008.
[3] G. Shen, R. Tucker, and C.-J. Chae, “Fixed mobile convergence ar-chitectures for broadband access: Integration of epon and wimax,”Communications Magazine, IEEE, vol. 45, pp. 44–50, August 2007.
[4] M. Dias and N. L. S. da Fonseca, “Performance evaluation of a schedulerfor the onu-bs of integrated epon-wimax networks,” in IEEE 3rd Latin-
American Conference on Communications, pp. 1–6, 2011.[5] I.-S. Hwang, J.-Y. Lee, C.-W. Huang, and Z.-D. Shyu, “Advanced
dynamic bandwidth allocation and scheduling scheme for the integratedarchitecture of epon and wimax,” Mobile Data Management, IEEE
International Conference on, vol. 0, pp. 655–660, 2009.[6] K. Yang, S. Ou, G. K., and H.-H. Chen, “Convergence of ethernet pon
and ieee 802.16 broadband access networks and its qos-aware dynamicbandwidth allocation scheme,” Selected Areas in Communications, IEEE
Journal on, vol. 27, pp. 101–116, February 2009.[7] Y. Yan, H. Yu, H. Wang, and L. Dittmann, “Integration of epon and
wimax networks: uplink scheduler design,” No. 1 in 7, SPIE, 2008.[8] T. Tang, G. Shou, Y. Hu, and Z. Guo, “Performance analysis of
bandwidth allocation of convergence of wimax and epon,” Networks Se-
curity, Wireless Communications and Trusted Computing, International
Conference on, vol. 1, pp. 662–665, 2009.[9] Y. Luo, S. Yin, T. Wang, Y. Suemura, S. Nakamura, N. Ansari,
and M. Cvijetic, “Qos-aware scheduling over hybrid optical wirelessnetworks,” in Optical Fiber Communication and the National Fiber
Optic Engineers Conference, 2007. OFC/NFOEC 2007. Conference on,pp. 1–7, March 2007.
[10] Alsolami, F. Jaber, Ho, and Pin-Han, “A novel two-level hierarchicalscheduling scheme for integrated wimax and epon,” IEEE Communica-
tions Surveys and Tutorials, vol. 3, pp. 46–60, 2009.[11] G. Kramer, B. Mukherjee, and G. Pesavento, “Ipact: a dynamic protocol
for an ethernet pon (epon),” Communications Magazine, IEEE, vol. 40,pp. 74–80, Feb 2002.
[12] J. F. Borin and N. L. S. Fonseca, “Uplink scheduler and admissioncontrol for the ieee 802.16 standard,” Globecom, 2009.
[13] J. F. Borin and N. L. S. da Fonseca, “Scheduler for ieee 802.16networks,” IEEE Communications Letters, vol. 12, no. 4, pp. 274 – 276,2008.
[14] J. Farooq and T. Turletti, “An IEEE 802.16 WiMAX Module for the NS-3 Simulator,” Proceedings of the Second International ICST Conference
on Simulation Tools and Techniques, 2009.[15] 3GPP2 C.S0014-0, “Enhanced Variable Rate Codec (EVRC).”[16] F. H. Fitzek and M. Reisslein, “Mpeg-4 and h.263 video traces for
network performance evaluation,” IEEE Network, vol. 15, pp. 40–54,Dec 2001.
[17] G. Kramer and B. Mukherjee, “Supporting differentiated classes ofservice in ethernet passive optical networks,” journal of Optical Net-
working, vol. 01, 2002.
Reduced Dimension Policy Iteration for Wireless
Network Control via Multiscale Analysis
Marco Levorato∗†, Sunil Narang†, Urbashi Mitra† and Antonio Ortega†
∗ Dept. of Electrical Engineering, Stanford University, Stanford, CA 94305 USA
† Dept. of Electrical Engineering, University of Southern California, Los Angeles, USA.
{ }
Abstract— A novel framework for the analysis and optimiza-tion of wireless networks operations is proposed. The temporalevolution of the state of the network is modeled as the trajectoryof the state of a Finite State Machine (FSM). The state space ofthe FSM and the statistics of state transition are represented asa directed graph. Graph reduction and transform techniques areproposed to reduce the dimension of the graph associated withthe FSM and analyze the properties of functions defined on itsstate space. The proposed methodology is based on the intrinsicmulti-dimensional/multi-scale structure of the state space of theFSM and enables the analysis and minimization of cost-to-gofunctions, i.e., functions measuring the expected long-term costassociated with a control strategy, on coarser versions of theoriginal graph.
I. INTRODUCTION
As wireless communication systems evolve and advance,
accurate modeling and thus system optimization becomes
more complex and computationally expensive. Heterogeneity
of mobile devices and standards further exacerbates the prob-
lem. Smart transmission strategies (e.g., [1]–[3]) have been
proposed to adapt the operations of wireless terminals to the
surrounding networking and natural environment. Increasingly,
wireless networks are cyberphysical systems coupling the
natural environment with an engineered one. Learning the
environment (including the behavior of interfering users) and
optimizing the strategy in real-world scenarios is prohibitively
demanding in terms of observation time and computational
complexity. We propose a novel framework for the analysis
and optimization of transmission strategies for wireless net-
works based on graph wavelet transforms, graph reduction,
and sparse approximation.
The methodology presented herein is based on the repre-
sentation of the Finite State Machine (FSM) modeling the
temporal evolution of the network as a multi-dimensional
graph. The vertices of the graph are states of the FSM and
the edges are allowed state transitions. FSMs have been tradi-
tionally used to model the operations of wireless networks,
see [4]–[8]. Cost-to-go functions [9] measure the expected
long-term cost incurred by the network given a transmission
strategy and a cost function defined on the state space of the
FSM. These functions can be defined to measure performance
metrics of interest (e.g., throughput, packet delivery rate, buffer
congestion) and are intimately connected to the behavior of
the network and the structure of the stochastic processes
Prof. Mitra’s and M. Levorato’s work was supported in part by the NationalScience Foundation (NSF) under Grant CCF-0917343 and by the AFOSRunder grant FA9550-12-1-0215. Prof. Ortega’s and S. Narang work waspartially supported by the NSF under grant CCF-1018977.
determining the trajectory of the network within the state space
of the FSM.
Due to the complexity of the operations of the network, the
state space of the FSM is extremely large, and the analysis
of the behavior of the network is prohibitively complex.
Therefore, instead of operating on the original graph, it would
be desirable to find and operate on smaller graphs with fewer
nodes and a function representing a smooth approximation of
the original cost-to-go function. Moreover, such systems need
to employ localized operations which could be computed at
each node by using data from a small neighborhood of nodes
around it. Multi-channel wavelet filterbanks, widely used as a
signal processing tool for the sparse representation of signals,
possess both these features (i.e. smooth approximations and lo-
calized operations). While wavelet transform-based techniques
would seem well suited to provide efficient local analysis,
a major obstacle to their application to FSM graphs is that
unlike images, the nodes connected via links in these graphs
are not immediate neighbors. Therefore, standard wavelet
transforms which are based on analyzing immediate neighbor-
hoods around each pixel, are not appropriate to analyze these
graphs, and so we require graph based wavelet transforms.
In [10] we showed that, thanks to the intrinsic structure of
the FSM induced by transmission and networking protocols, a
concise representation of cost-to-go functions is achieved by
projecting these functions onto graph diffusion wavelet [11]
domains. A major shortcoming of diffusion wavelets is that
they form an over-complete basis, and do not provide an
intuitive understanding of the wavelet coefficients obtained
in the transform. In this paper, we propose a framework
based on the structure of the FSM, which allows the cost-
to-go functions to be analyzed like regular multi-dimensional
signals, such as images. The framework is based on the
critically sampled two-channel wavelet filterbanks presented
in [12]–[14]. Specifically, we exploit the multi-dimensional
regular structure of the state space of the FSM, to design sub-
sampling (graph reduction) and graph filtering techniques to
analyze stochastic processes, tracking the behavior of wire-
less networks. Our methodology facilitates the reduction of
analysis and computational complexity associated with cost-
to-go functions and enables the design of practical, adaptive
control algorithms for wireless networks. The contributions
of the present paper are: 1) the first framework connecting
the graphical structure of the stochastic processes modeling
wireless network operation to image processing-like analysis
tools; 2) design of a graph reduction and filtering technique for
these graphical structures based on [12]–[14]; 3) construction
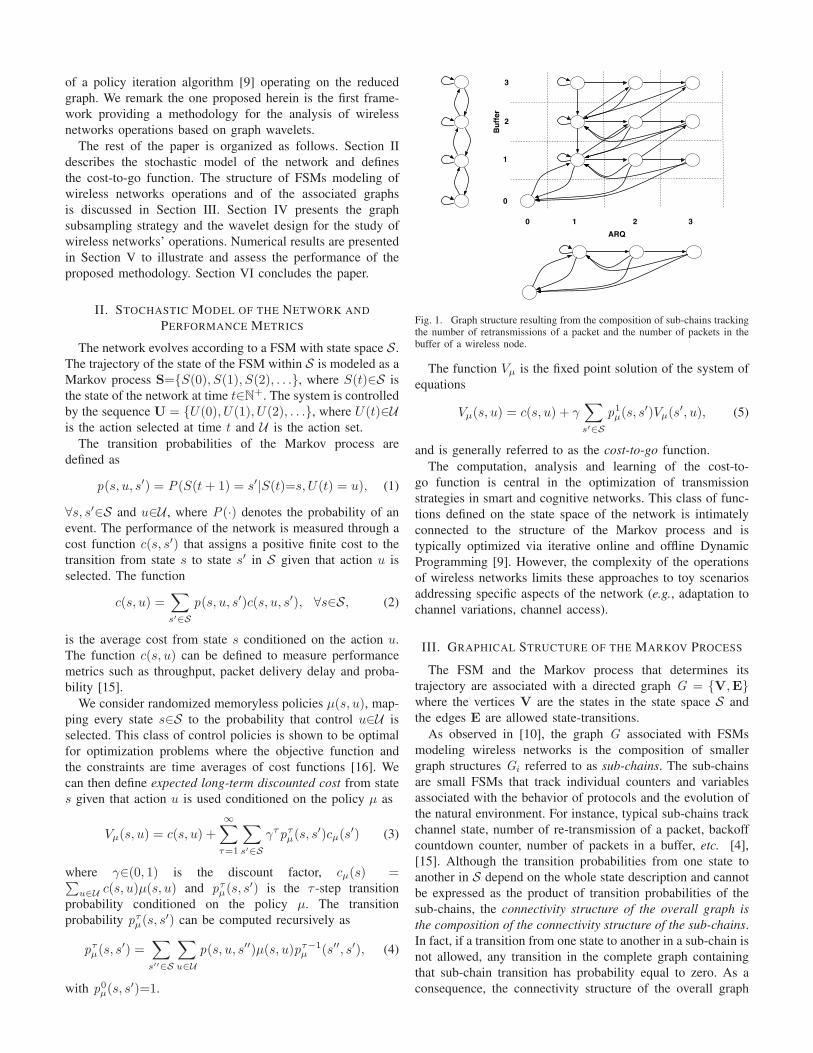
of a policy iteration algorithm [9] operating on the reduced
graph. We remark the one proposed herein is the first frame-
work providing a methodology for the analysis of wireless
networks operations based on graph wavelets.
The rest of the paper is organized as follows. Section II
describes the stochastic model of the network and defines
the cost-to-go function. The structure of FSMs modeling of
wireless networks operations and of the associated graphs
is discussed in Section III. Section IV presents the graph
subsampling strategy and the wavelet design for the study of
wireless networks’ operations. Numerical results are presented
in Section V to illustrate and assess the performance of the
proposed methodology. Section VI concludes the paper.
II. STOCHASTIC MODEL OF THE NETWORK AND
PERFORMANCE METRICS
The network evolves according to a FSM with state space S.
The trajectory of the state of the FSM within S is modeled as a
Markov process S={S(0), S(1), S(2), . . .}, where S(t)∈S is
the state of the network at time t∈N+. The system is controlled
by the sequence U = {U(0), U(1), U(2), . . .}, where U(t)∈Uis the action selected at time t and U is the action set.
The transition probabilities of the Markov process are
defined as
p(s, u, s′) = P(S(t + 1) = s′|S(t)=s, U(t) = u), (1)
∀s, s′∈S and u∈U , where P(·) denotes the probability of an
event. The performance of the network is measured through a
cost function c(s, s′) that assigns a positive finite cost to the
transition from state s to state s′ in S given that action u is
selected. The function
c(s, u) =∑
s′∈S
p(s, u, s′)c(s, u, s′), ∀s∈S, (2)
is the average cost from state s conditioned on the action u.
The function c(s, u) can be defined to measure performance
metrics such as throughput, packet delivery delay and proba-
bility [15].
We consider randomized memoryless policies µ(s, u), map-
ping every state s∈S to the probability that control u∈U is
selected. This class of control policies is shown to be optimal
for optimization problems where the objective function and
the constraints are time averages of cost functions [16]. We
can then define expected long-term discounted cost from state
s given that action u is used conditioned on the policy µ as
Vµ(s, u) = c(s, u) +
∞∑
τ=1
∑
s′∈S
γτpτµ(s, s′)cµ(s′) (3)
where γ∈(0, 1) is the discount factor, cµ(s) =∑
u∈Uc(s, u)µ(s, u) and pτ
µ(s, s′) is the τ -step transition
probability conditioned on the policy µ. The transition
probability pτµ(s, s′) can be computed recursively as
pτµ(s, s′) =
∑
s′′∈S
∑
u∈U
p(s, u, s′′)µ(s, u)pτ−1µ (s′′, s′), (4)
with p0µ(s, s′)=1.
0
1
2
3
0 1 2 3
ARQ
Buffer
Fig. 1. Graph structure resulting from the composition of sub-chains trackingthe number of retransmissions of a packet and the number of packets in thebuffer of a wireless node.
The function Vµ is the fixed point solution of the system of
equations
Vµ(s, u) = c(s, u) + γ∑
s′∈S
p1µ(s, s′)Vµ(s′, u), (5)
and is generally referred to as the cost-to-go function.
The computation, analysis and learning of the cost-to-
go function is central in the optimization of transmission
strategies in smart and cognitive networks. This class of func-
tions defined on the state space of the network is intimately
connected to the structure of the Markov process and is
typically optimized via iterative online and offline Dynamic
Programming [9]. However, the complexity of the operations
of wireless networks limits these approaches to toy scenarios
addressing specific aspects of the network (e.g., adaptation to
channel variations, channel access).
III. GRAPHICAL STRUCTURE OF THE MARKOV PROCESS
The FSM and the Markov process that determines its
trajectory are associated with a directed graph G = {V,E}where the vertices V are the states in the state space S and
the edges E are allowed state-transitions.
As observed in [10], the graph G associated with FSMs
modeling wireless networks is the composition of smaller
graph structures Gi referred to as sub-chains. The sub-chains
are small FSMs that track individual counters and variables
associated with the behavior of protocols and the evolution of
the natural environment. For instance, typical sub-chains track
channel state, number of re-transmission of a packet, backoff
countdown counter, number of packets in a buffer, etc. [4],
[15]. Although the transition probabilities from one state to
another in S depend on the whole state description and cannot
be expressed as the product of transition probabilities of the
sub-chains, the connectivity structure of the overall graph is
the composition of the connectivity structure of the sub-chains.
In fact, if a transition from one state to another in a sub-chain is
not allowed, any transition in the complete graph containing
that sub-chain transition has probability equal to zero. As a
consequence, the connectivity structure of the overall graph
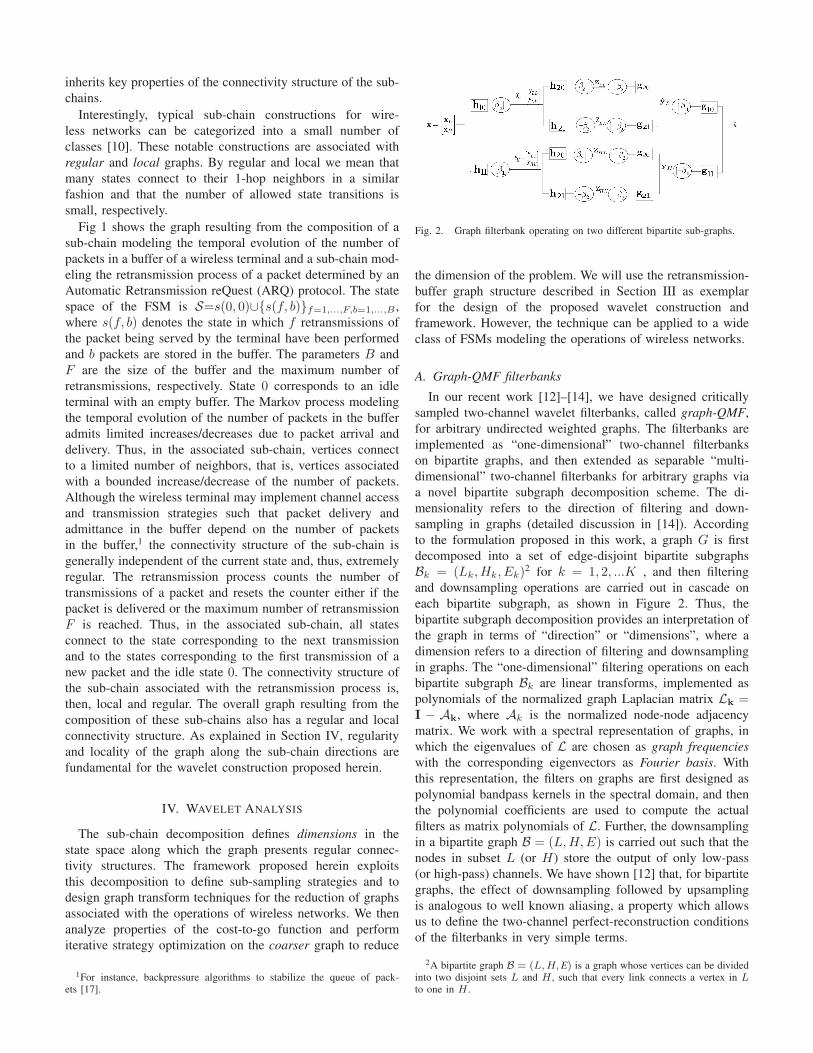
inherits key properties of the connectivity structure of the sub-
chains.
Interestingly, typical sub-chain constructions for wire-
less networks can be categorized into a small number of
classes [10]. These notable constructions are associated with
regular and local graphs. By regular and local we mean that
many states connect to their 1-hop neighbors in a similar
fashion and that the number of allowed state transitions is
small, respectively.
Fig 1 shows the graph resulting from the composition of a
sub-chain modeling the temporal evolution of the number of
packets in a buffer of a wireless terminal and a sub-chain mod-
eling the retransmission process of a packet determined by an
Automatic Retransmission reQuest (ARQ) protocol. The state
space of the FSM is S=s(0, 0)∪{s(f, b)}f=1,...,F,b=1,...,B ,
where s(f, b) denotes the state in which f retransmissions of
the packet being served by the terminal have been performed
and b packets are stored in the buffer. The parameters B and
F are the size of the buffer and the maximum number of
retransmissions, respectively. State 0 corresponds to an idle
terminal with an empty buffer. The Markov process modeling
the temporal evolution of the number of packets in the buffer
admits limited increases/decreases due to packet arrival and
delivery. Thus, in the associated sub-chain, vertices connect
to a limited number of neighbors, that is, vertices associated
with a bounded increase/decrease of the number of packets.
Although the wireless terminal may implement channel access
and transmission strategies such that packet delivery and
admittance in the buffer depend on the number of packets
in the buffer,1 the connectivity structure of the sub-chain is
generally independent of the current state and, thus, extremely
regular. The retransmission process counts the number of
transmissions of a packet and resets the counter either if the
packet is delivered or the maximum number of retransmission
F is reached. Thus, in the associated sub-chain, all states
connect to the state corresponding to the next transmission
and to the states corresponding to the first transmission of a
new packet and the idle state 0. The connectivity structure of
the sub-chain associated with the retransmission process is,
then, local and regular. The overall graph resulting from the
composition of these sub-chains also has a regular and local
connectivity structure. As explained in Section IV, regularity
and locality of the graph along the sub-chain directions are
fundamental for the wavelet construction proposed herein.
IV. WAVELET ANALYSIS
The sub-chain decomposition defines dimensions in the
state space along which the graph presents regular connec-
tivity structures. The framework proposed herein exploits
this decomposition to define sub-sampling strategies and to
design graph transform techniques for the reduction of graphs
associated with the operations of wireless networks. We then
analyze properties of the cost-to-go function and perform
iterative strategy optimization on the coarser graph to reduce
1For instance, backpressure algorithms to stabilize the queue of pack-ets [17].
Fig. 2. Graph filterbank operating on two different bipartite sub-graphs.
the dimension of the problem. We will use the retransmission-
buffer graph structure described in Section III as exemplar
for the design of the proposed wavelet construction and
framework. However, the technique can be applied to a wide
class of FSMs modeling the operations of wireless networks.
A. Graph-QMF filterbanks
In our recent work [12]–[14], we have designed critically
sampled two-channel wavelet filterbanks, called graph-QMF,
for arbitrary undirected weighted graphs. The filterbanks are
implemented as “one-dimensional” two-channel filterbanks
on bipartite graphs, and then extended as separable “multi-
dimensional” two-channel filterbanks for arbitrary graphs via
a novel bipartite subgraph decomposition scheme. The di-
mensionality refers to the direction of filtering and down-
sampling in graphs (detailed discussion in [14]). According
to the formulation proposed in this work, a graph G is first
decomposed into a set of edge-disjoint bipartite subgraphs
Bk = (Lk,Hk, Ek)2 for k = 1, 2, ...K , and then filtering
and downsampling operations are carried out in cascade on
each bipartite subgraph, as shown in Figure 2. Thus, the
bipartite subgraph decomposition provides an interpretation of
the graph in terms of “direction” or “dimensions”, where a
dimension refers to a direction of filtering and downsampling
in graphs. The “one-dimensional” filtering operations on each
bipartite subgraph Bk are linear transforms, implemented as
polynomials of the normalized graph Laplacian matrix Lk =I − Ak, where Ak is the normalized node-node adjacency
matrix. We work with a spectral representation of graphs, in
which the eigenvalues of L are chosen as graph frequencies
with the corresponding eigenvectors as Fourier basis. With
this representation, the filters on graphs are first designed as
polynomial bandpass kernels in the spectral domain, and then
the polynomial coefficients are used to compute the actual
filters as matrix polynomials of L. Further, the downsampling
in a bipartite graph B = (L,H,E) is carried out such that the
nodes in subset L (or H) store the output of only low-pass
(or high-pass) channels. We have shown [12] that, for bipartite
graphs, the effect of downsampling followed by upsampling
is analogous to well known aliasing, a property which allows
us to define the two-channel perfect-reconstruction conditions
of the filterbanks in very simple terms.
2A bipartite graph B = (L, H, E) is a graph whose vertices can be dividedinto two disjoint sets L and H , such that every link connects a vertex in L
to one in H .
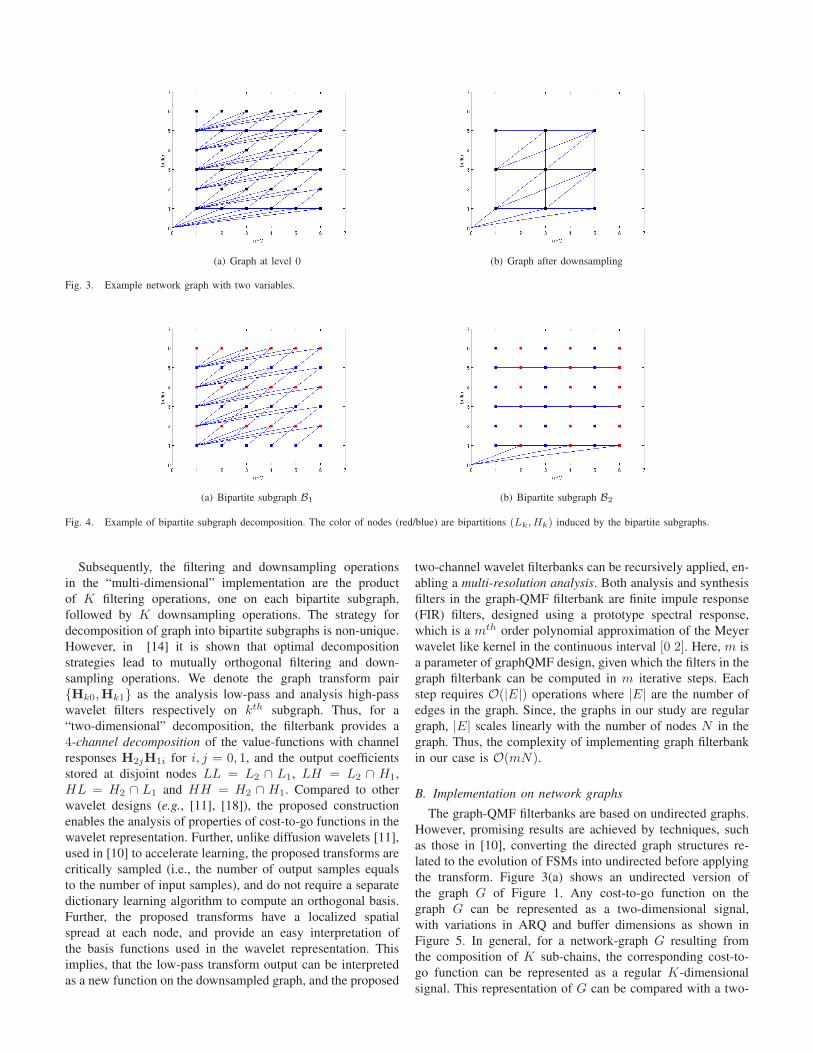
(a) Graph at level 0 (b) Graph after downsampling
Fig. 3. Example network graph with two variables.
(a) Bipartite subgraph B1 (b) Bipartite subgraph B2
Fig. 4. Example of bipartite subgraph decomposition. The color of nodes (red/blue) are bipartitions (Lk, Hk) induced by the bipartite subgraphs.
Subsequently, the filtering and downsampling operations
in the “multi-dimensional” implementation are the product
of K filtering operations, one on each bipartite subgraph,
followed by K downsampling operations. The strategy for
decomposition of graph into bipartite subgraphs is non-unique.
However, in [14] it is shown that optimal decomposition
strategies lead to mutually orthogonal filtering and down-
sampling operations. We denote the graph transform pair
{Hk0,Hk1} as the analysis low-pass and analysis high-pass
wavelet filters respectively on kth subgraph. Thus, for a
“two-dimensional” decomposition, the filterbank provides a
4-channel decomposition of the value-functions with channel
responses H2jH1i for i, j = 0, 1, and the output coefficients
stored at disjoint nodes LL = L2 ∩ L1, LH = L2 ∩ H1,
HL = H2 ∩ L1 and HH = H2 ∩ H1. Compared to other
wavelet designs (e.g., [11], [18]), the proposed construction
enables the analysis of properties of cost-to-go functions in the
wavelet representation. Further, unlike diffusion wavelets [11],
used in [10] to accelerate learning, the proposed transforms are
critically sampled (i.e., the number of output samples equals
to the number of input samples), and do not require a separate
dictionary learning algorithm to compute an orthogonal basis.
Further, the proposed transforms have a localized spatial
spread at each node, and provide an easy interpretation of
the basis functions used in the wavelet representation. This
implies, that the low-pass transform output can be interpreted
as a new function on the downsampled graph, and the proposed
two-channel wavelet filterbanks can be recursively applied, en-
abling a multi-resolution analysis. Both analysis and synthesis
filters in the graph-QMF filterbank are finite impule response
(FIR) filters, designed using a prototype spectral response,
which is a mth order polynomial approximation of the Meyer
wavelet like kernel in the continuous interval [0 2]. Here, m is
a parameter of graphQMF design, given which the filters in the
graph filterbank can be computed in m iterative steps. Each
step requires O(|E|) operations where |E| are the number of
edges in the graph. Since, the graphs in our study are regular
graph, |E| scales linearly with the number of nodes N in the
graph. Thus, the complexity of implementing graph filterbank
in our case is O(mN).
B. Implementation on network graphs
The graph-QMF filterbanks are based on undirected graphs.
However, promising results are achieved by techniques, such
as those in [10], converting the directed graph structures re-
lated to the evolution of FSMs into undirected before applying
the transform. Figure 3(a) shows an undirected version of
the graph G of Figure 1. Any cost-to-go function on the
graph G can be represented as a two-dimensional signal,
with variations in ARQ and buffer dimensions as shown in
Figure 5. In general, for a network-graph G resulting from
the composition of K sub-chains, the corresponding cost-to-
go function can be represented as a regular K-dimensional
signal. This representation of G can be compared with a two-
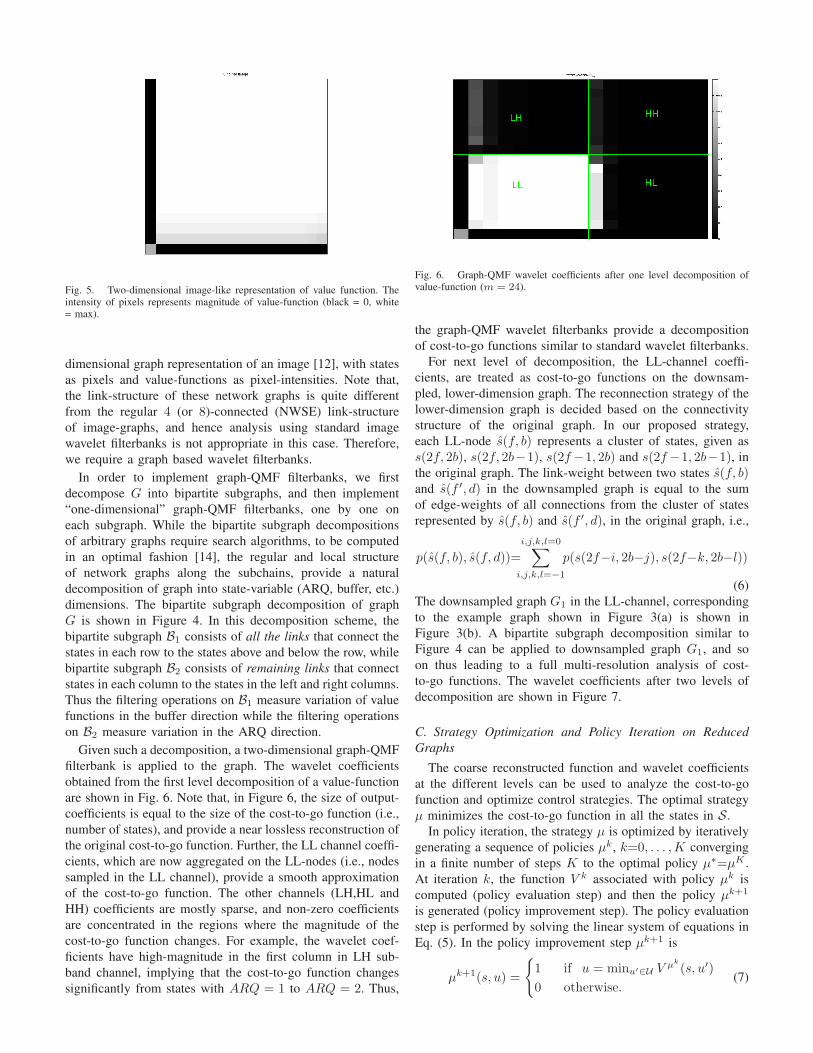
Fig. 5. Two-dimensional image-like representation of value function. Theintensity of pixels represents magnitude of value-function (black = 0, white= max).
dimensional graph representation of an image [12], with states
as pixels and value-functions as pixel-intensities. Note that,
the link-structure of these network graphs is quite different
from the regular 4 (or 8)-connected (NWSE) link-structure
of image-graphs, and hence analysis using standard image
wavelet filterbanks is not appropriate in this case. Therefore,
we require a graph based wavelet filterbanks.
In order to implement graph-QMF filterbanks, we first
decompose G into bipartite subgraphs, and then implement
“one-dimensional” graph-QMF filterbanks, one by one on
each subgraph. While the bipartite subgraph decompositions
of arbitrary graphs require search algorithms, to be computed
in an optimal fashion [14], the regular and local structure
of network graphs along the subchains, provide a natural
decomposition of graph into state-variable (ARQ, buffer, etc.)
dimensions. The bipartite subgraph decomposition of graph
G is shown in Figure 4. In this decomposition scheme, the
bipartite subgraph B1 consists of all the links that connect the
states in each row to the states above and below the row, while
bipartite subgraph B2 consists of remaining links that connect
states in each column to the states in the left and right columns.
Thus the filtering operations on B1 measure variation of value
functions in the buffer direction while the filtering operations
on B2 measure variation in the ARQ direction.
Given such a decomposition, a two-dimensional graph-QMF
filterbank is applied to the graph. The wavelet coefficients
obtained from the first level decomposition of a value-function
are shown in Fig. 6. Note that, in Figure 6, the size of output-
coefficients is equal to the size of the cost-to-go function (i.e.,
number of states), and provide a near lossless reconstruction of
the original cost-to-go function. Further, the LL channel coeffi-
cients, which are now aggregated on the LL-nodes (i.e., nodes
sampled in the LL channel), provide a smooth approximation
of the cost-to-go function. The other channels (LH,HL and
HH) coefficients are mostly sparse, and non-zero coefficients
are concentrated in the regions where the magnitude of the
cost-to-go function changes. For example, the wavelet coef-
ficients have high-magnitude in the first column in LH sub-
band channel, implying that the cost-to-go function changes
significantly from states with ARQ = 1 to ARQ = 2. Thus,
Fig. 6. Graph-QMF wavelet coefficients after one level decomposition ofvalue-function (m = 24).
the graph-QMF wavelet filterbanks provide a decomposition
of cost-to-go functions similar to standard wavelet filterbanks.
For next level of decomposition, the LL-channel coeffi-
cients, are treated as cost-to-go functions on the downsam-
pled, lower-dimension graph. The reconnection strategy of the
lower-dimension graph is decided based on the connectivity
structure of the original graph. In our proposed strategy,
each LL-node s(f, b) represents a cluster of states, given as
s(2f, 2b), s(2f, 2b−1), s(2f −1, 2b) and s(2f −1, 2b−1), in
the original graph. The link-weight between two states s(f, b)and s(f ′, d) in the downsampled graph is equal to the sum
of edge-weights of all connections from the cluster of states
represented by s(f, b) and s(f ′, d), in the original graph, i.e.,
p(s(f, b), s(f, d))=
i,j,k,l=0∑
i,j,k,l=−1
p(s(2f−i, 2b−j), s(2f−k, 2b−l))
(6)
The downsampled graph G1 in the LL-channel, corresponding
to the example graph shown in Figure 3(a) is shown in
Figure 3(b). A bipartite subgraph decomposition similar to
Figure 4 can be applied to downsampled graph G1, and so
on thus leading to a full multi-resolution analysis of cost-
to-go functions. The wavelet coefficients after two levels of
decomposition are shown in Figure 7.
C. Strategy Optimization and Policy Iteration on Reduced
Graphs
The coarse reconstructed function and wavelet coefficients
at the different levels can be used to analyze the cost-to-go
function and optimize control strategies. The optimal strategy
µ minimizes the cost-to-go function in all the states in S.
In policy iteration, the strategy µ is optimized by iteratively
generating a sequence of policies µk, k=0, . . . ,K converging
in a finite number of steps K to the optimal policy µ∗=µK .
At iteration k, the function V k associated with policy µk is
computed (policy evaluation step) and then the policy µk+1
is generated (policy improvement step). The policy evaluation
step is performed by solving the linear system of equations in
Eq. (5). In the policy improvement step µk+1 is
µk+1(s, u) =
{
1 if u = minu′∈U V µk
(s, u′)
0 otherwise.(7)
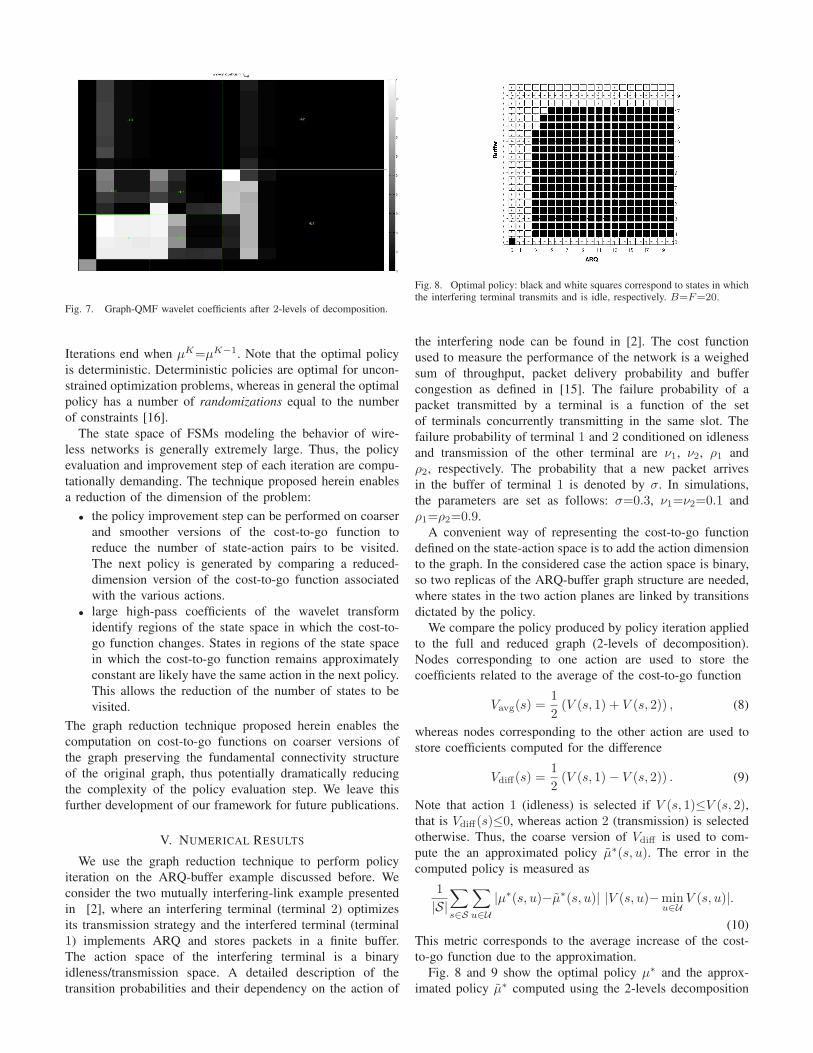
Fig. 7. Graph-QMF wavelet coefficients after 2-levels of decomposition.
Iterations end when µK=µK−1. Note that the optimal policy
is deterministic. Deterministic policies are optimal for uncon-
strained optimization problems, whereas in general the optimal
policy has a number of randomizations equal to the number
of constraints [16].
The state space of FSMs modeling the behavior of wire-
less networks is generally extremely large. Thus, the policy
evaluation and improvement step of each iteration are compu-
tationally demanding. The technique proposed herein enables
a reduction of the dimension of the problem:
• the policy improvement step can be performed on coarser
and smoother versions of the cost-to-go function to
reduce the number of state-action pairs to be visited.
The next policy is generated by comparing a reduced-
dimension version of the cost-to-go function associated
with the various actions.
• large high-pass coefficients of the wavelet transform
identify regions of the state space in which the cost-to-
go function changes. States in regions of the state space
in which the cost-to-go function remains approximately
constant are likely have the same action in the next policy.
This allows the reduction of the number of states to be
visited.
The graph reduction technique proposed herein enables the
computation on cost-to-go functions on coarser versions of
the graph preserving the fundamental connectivity structure
of the original graph, thus potentially dramatically reducing
the complexity of the policy evaluation step. We leave this
further development of our framework for future publications.
V. NUMERICAL RESULTS
We use the graph reduction technique to perform policy
iteration on the ARQ-buffer example discussed before. We
consider the two mutually interfering-link example presented
in [2], where an interfering terminal (terminal 2) optimizes
its transmission strategy and the interfered terminal (terminal
1) implements ARQ and stores packets in a finite buffer.
The action space of the interfering terminal is a binary
idleness/transmission space. A detailed description of the
transition probabilities and their dependency on the action of
Fig. 8. Optimal policy: black and white squares correspond to states in whichthe interfering terminal transmits and is idle, respectively. B=F=20.
the interfering node can be found in [2]. The cost function
used to measure the performance of the network is a weighed
sum of throughput, packet delivery probability and buffer
congestion as defined in [15]. The failure probability of a
packet transmitted by a terminal is a function of the set
of terminals concurrently transmitting in the same slot. The
failure probability of terminal 1 and 2 conditioned on idleness
and transmission of the other terminal are ν1, ν2, ρ1 and
ρ2, respectively. The probability that a new packet arrives
in the buffer of terminal 1 is denoted by σ. In simulations,
the parameters are set as follows: σ=0.3, ν1=ν2=0.1 and
ρ1=ρ2=0.9.
A convenient way of representing the cost-to-go function
defined on the state-action space is to add the action dimension
to the graph. In the considered case the action space is binary,
so two replicas of the ARQ-buffer graph structure are needed,
where states in the two action planes are linked by transitions
dictated by the policy.
We compare the policy produced by policy iteration applied
to the full and reduced graph (2-levels of decomposition).
Nodes corresponding to one action are used to store the
coefficients related to the average of the cost-to-go function
Vavg(s) =1
2(V (s, 1) + V (s, 2)) , (8)
whereas nodes corresponding to the other action are used to
store coefficients computed for the difference
Vdiff(s) =1
2(V (s, 1) − V (s, 2)) . (9)
Note that action 1 (idleness) is selected if V (s, 1)≤V (s, 2),that is Vdiff(s)≤0, whereas action 2 (transmission) is selected
otherwise. Thus, the coarse version of Vdiff is used to com-
pute the an approximated policy µ∗(s, u). The error in the
computed policy is measured as
1
|S|
∑
s∈S
∑
u∈U
|µ∗(s, u)−µ∗(s, u)| |V (s, u)−minu∈U
V (s, u)|.
(10)
This metric corresponds to the average increase of the cost-
to-go function due to the approximation.
Fig. 8 and 9 show the optimal policy µ∗ and the approx-
imated policy µ∗ computed using the 2-levels decomposition
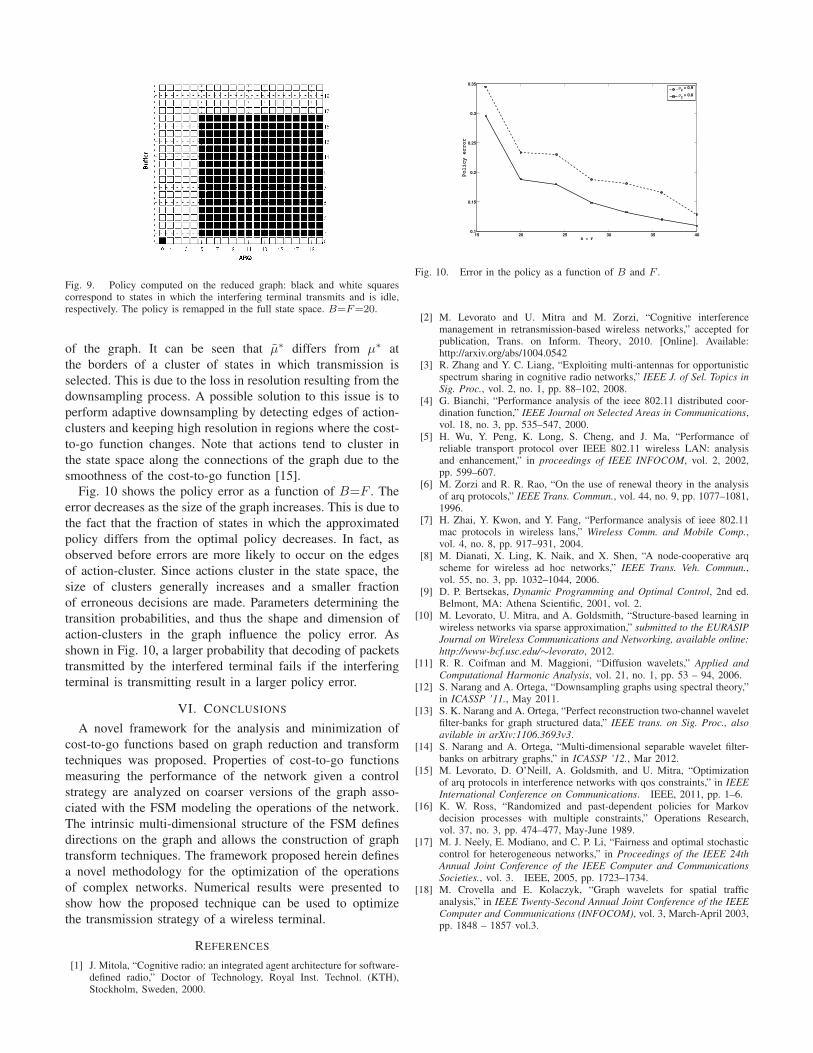
Fig. 9. Policy computed on the reduced graph: black and white squarescorrespond to states in which the interfering terminal transmits and is idle,respectively. The policy is remapped in the full state space. B=F=20.
of the graph. It can be seen that µ∗ differs from µ∗ at
the borders of a cluster of states in which transmission is
selected. This is due to the loss in resolution resulting from the
downsampling process. A possible solution to this issue is to
perform adaptive downsampling by detecting edges of action-
clusters and keeping high resolution in regions where the cost-
to-go function changes. Note that actions tend to cluster in
the state space along the connections of the graph due to the
smoothness of the cost-to-go function [15].
Fig. 10 shows the policy error as a function of B=F . The
error decreases as the size of the graph increases. This is due to
the fact that the fraction of states in which the approximated
policy differs from the optimal policy decreases. In fact, as
observed before errors are more likely to occur on the edges
of action-cluster. Since actions cluster in the state space, the
size of clusters generally increases and a smaller fraction
of erroneous decisions are made. Parameters determining the
transition probabilities, and thus the shape and dimension of
action-clusters in the graph influence the policy error. As
shown in Fig. 10, a larger probability that decoding of packets
transmitted by the interfered terminal fails if the interfering
terminal is transmitting result in a larger policy error.
VI. CONCLUSIONS
A novel framework for the analysis and minimization of
cost-to-go functions based on graph reduction and transform
techniques was proposed. Properties of cost-to-go functions
measuring the performance of the network given a control
strategy are analyzed on coarser versions of the graph asso-
ciated with the FSM modeling the operations of the network.
The intrinsic multi-dimensional structure of the FSM defines
directions on the graph and allows the construction of graph
transform techniques. The framework proposed herein defines
a novel methodology for the optimization of the operations
of complex networks. Numerical results were presented to
show how the proposed technique can be used to optimize
the transmission strategy of a wireless terminal.
REFERENCES
[1] J. Mitola, “Cognitive radio: an integrated agent architecture for software-defined radio,” Doctor of Technology, Royal Inst. Technol. (KTH),Stockholm, Sweden, 2000.
15 20 25 30 35 400.1
0.15
0.2
0.25
0.3
0.35
B = F
Policy error
ρ2 = 0.9
ρ2 = 0.8
Fig. 10. Error in the policy as a function of B and F .
[2] M. Levorato and U. Mitra and M. Zorzi, “Cognitive interferencemanagement in retransmission-based wireless networks,” accepted forpublication, Trans. on Inform. Theory, 2010. [Online]. Available:http://arxiv.org/abs/1004.0542
[3] R. Zhang and Y. C. Liang, “Exploiting multi-antennas for opportunisticspectrum sharing in cognitive radio networks,” IEEE J. of Sel. Topics in
Sig. Proc., vol. 2, no. 1, pp. 88–102, 2008.[4] G. Bianchi, “Performance analysis of the ieee 802.11 distributed coor-
dination function,” IEEE Journal on Selected Areas in Communications,vol. 18, no. 3, pp. 535–547, 2000.
[5] H. Wu, Y. Peng, K. Long, S. Cheng, and J. Ma, “Performance ofreliable transport protocol over IEEE 802.11 wireless LAN: analysisand enhancement,” in proceedings of IEEE INFOCOM, vol. 2, 2002,pp. 599–607.
[6] M. Zorzi and R. R. Rao, “On the use of renewal theory in the analysisof arq protocols,” IEEE Trans. Commun., vol. 44, no. 9, pp. 1077–1081,1996.
[7] H. Zhai, Y. Kwon, and Y. Fang, “Performance analysis of ieee 802.11mac protocols in wireless lans,” Wireless Comm. and Mobile Comp.,vol. 4, no. 8, pp. 917–931, 2004.
[8] M. Dianati, X. Ling, K. Naik, and X. Shen, “A node-cooperative arqscheme for wireless ad hoc networks,” IEEE Trans. Veh. Commun.,vol. 55, no. 3, pp. 1032–1044, 2006.
[9] D. P. Bertsekas, Dynamic Programming and Optimal Control, 2nd ed.Belmont, MA: Athena Scientific, 2001, vol. 2.
[10] M. Levorato, U. Mitra, and A. Goldsmith, “Structure-based learning inwireless networks via sparse approximation,” submitted to the EURASIP
Journal on Wireless Communications and Networking, available online:
http://www-bcf.usc.edu/∼levorato, 2012.[11] R. R. Coifman and M. Maggioni, “Diffusion wavelets,” Applied and
Computational Harmonic Analysis, vol. 21, no. 1, pp. 53 – 94, 2006.[12] S. Narang and A. Ortega, “Downsampling graphs using spectral theory,”
in ICASSP ’11., May 2011.[13] S. K. Narang and A. Ortega, “Perfect reconstruction two-channel wavelet
filter-banks for graph structured data,” IEEE trans. on Sig. Proc., also
avilable in arXiv:1106.3693v3.[14] S. Narang and A. Ortega, “Multi-dimensional separable wavelet filter-
banks on arbitrary graphs,” in ICASSP ’12., Mar 2012.[15] M. Levorato, D. O’Neill, A. Goldsmith, and U. Mitra, “Optimization
of arq protocols in interference networks with qos constraints,” in IEEE
International Conference on Communications. IEEE, 2011, pp. 1–6.[16] K. W. Ross, “Randomized and past-dependent policies for Markov
decision processes with multiple constraints,” Operations Research,vol. 37, no. 3, pp. 474–477, May-June 1989.
[17] M. J. Neely, E. Modiano, and C. P. Li, “Fairness and optimal stochasticcontrol for heterogeneous networks,” in Proceedings of the IEEE 24th
Annual Joint Conference of the IEEE Computer and Communications
Societies., vol. 3. IEEE, 2005, pp. 1723–1734.[18] M. Crovella and E. Kolaczyk, “Graph wavelets for spatial traffic
analysis,” in IEEE Twenty-Second Annual Joint Conference of the IEEE
Computer and Communications (INFOCOM), vol. 3, March-April 2003,pp. 1848 – 1857 vol.3.
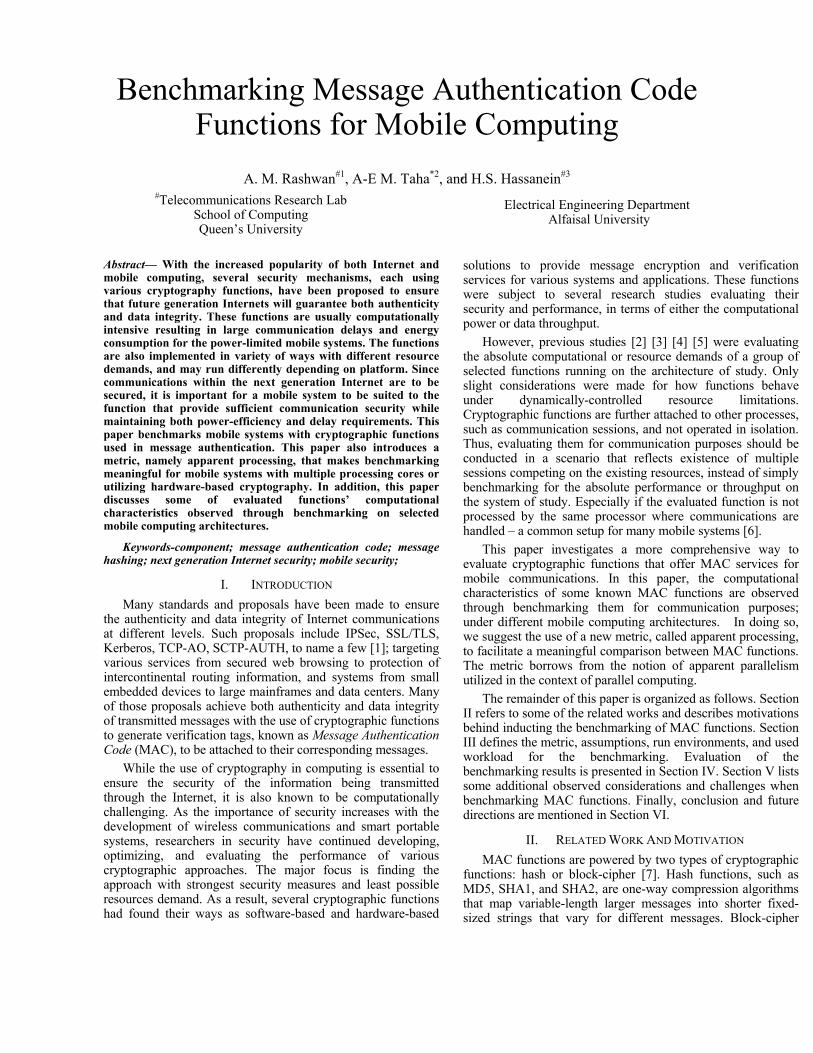
Benchmarking Message Authentication Code Functions for Mobile Computing
A. M. Rashwan#1, A-E M. Taha*2, and H.S. Hassanein#3
#Telecommunications Research Lab School of Computing Queen’s University
*
Electrical Engineering Department Alfaisal University
Abstract— With the increased popularity of both Internet and mobile computing, several security mechanisms, each using various cryptography functions, have been proposed to ensure that future generation Internets will guarantee both authenticity and data integrity. These functions are usually computationally intensive resulting in large communication delays and energy consumption for the power-limited mobile systems. The functions are also implemented in variety of ways with different resource demands, and may run differently depending on platform. Since communications within the next generation Internet are to be secured, it is important for a mobile system to be suited to the function that provide sufficient communication security while maintaining both power-efficiency and delay requirements. This paper benchmarks mobile systems with cryptographic functions used in message authentication. This paper also introduces a metric, namely apparent processing, that makes benchmarking meaningful for mobile systems with multiple processing cores or utilizing hardware-based cryptography. In addition, this paper discusses some of evaluated functions’ computational characteristics observed through benchmarking on selected mobile computing architectures.
Keywords-component; message authentication code; message hashing; next generation Internet security; mobile security;
I. INTRODUCTION Many standards and proposals have been made to ensure
the authenticity and data integrity of Internet communications at different levels. Such proposals include IPSec, SSL/TLS, Kerberos, TCP-AO, SCTP-AUTH, to name a few [1]; targeting various services from secured web browsing to protection of intercontinental routing information, and systems from small embedded devices to large mainframes and data centers. Many of those proposals achieve both authenticity and data integrity of transmitted messages with the use of cryptographic functions to generate verification tags, known as Message Authentication Code (MAC), to be attached to their corresponding messages.
While the use of cryptography in computing is essential to ensure the security of the information being transmitted through the Internet, it is also known to be computationally challenging. As the importance of security increases with the development of wireless communications and smart portable systems, researchers in security have continued developing, optimizing, and evaluating the performance of various cryptographic approaches. The major focus is finding the approach with strongest security measures and least possible resources demand. As a result, several cryptographic functions had found their ways as software-based and hardware-based
solutions to provide message encryption and verification services for various systems and applications. These functions were subject to several research studies evaluating their security and performance, in terms of either the computational power or data throughput.
However, previous studies [2] [3] [4] [5] were evaluating the absolute computational or resource demands of a group of selected functions running on the architecture of study. Only slight considerations were made for how functions behave under dynamically-controlled resource limitations. Cryptographic functions are further attached to other processes, such as communication sessions, and not operated in isolation. Thus, evaluating them for communication purposes should be conducted in a scenario that reflects existence of multiple sessions competing on the existing resources, instead of simply benchmarking for the absolute performance or throughput on the system of study. Especially if the evaluated function is not processed by the same processor where communications are handled – a common setup for many mobile systems [6].
This paper investigates a more comprehensive way to evaluate cryptographic functions that offer MAC services for mobile communications. In this paper, the computational characteristics of some known MAC functions are observed through benchmarking them for communication purposes; under different mobile computing architectures. In doing so, we suggest the use of a new metric, called apparent processing, to facilitate a meaningful comparison between MAC functions. The metric borrows from the notion of apparent parallelism utilized in the context of parallel computing.
The remainder of this paper is organized as follows. Section II refers to some of the related works and describes motivations behind inducting the benchmarking of MAC functions. Section III defines the metric, assumptions, run environments, and used workload for the benchmarking. Evaluation of the benchmarking results is presented in Section IV. Section V lists some additional observed considerations and challenges when benchmarking MAC functions. Finally, conclusion and future directions are mentioned in Section VI.
II. RELATED WORK AND MOTIVATION MAC functions are powered by two types of cryptographic
functions: hash or block-cipher [7]. Hash functions, such as MD5, SHA1, and SHA2, are one-way compression algorithms that map variable-length larger messages into shorter fixed-sized strings that vary for different messages. Block-cipher
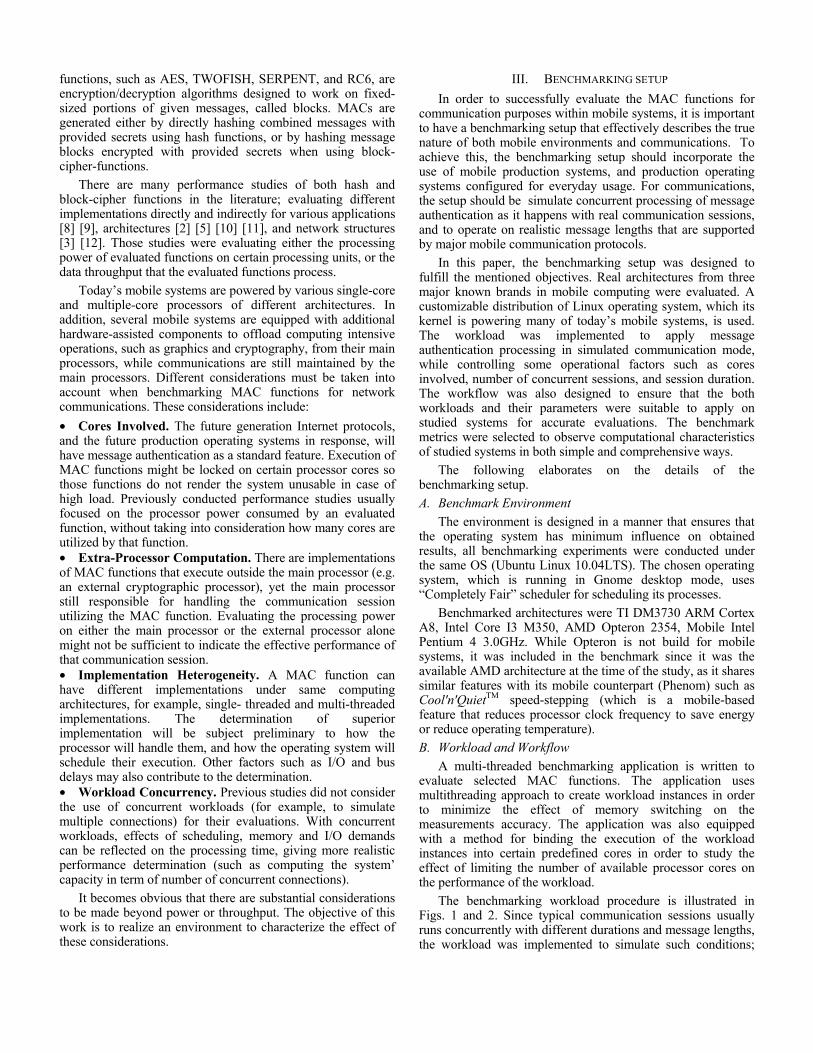
functions, such as AES, TWOFISH, SERPENT, and RC6, are encryption/decryption algorithms designed to work on fixed-sized portions of given messages, called blocks. MACs are generated either by directly hashing combined messages with provided secrets using hash functions, or by hashing message blocks encrypted with provided secrets when using block-cipher-functions.
There are many performance studies of both hash and block-cipher functions in the literature; evaluating different implementations directly and indirectly for various applications [8] [9], architectures [2] [5] [10] [11], and network structures [3] [12]. Those studies were evaluating either the processing power of evaluated functions on certain processing units, or the data throughput that the evaluated functions process.
Today’s mobile systems are powered by various single-core and multiple-core processors of different architectures. In addition, several mobile systems are equipped with additional hardware-assisted components to offload computing intensive operations, such as graphics and cryptography, from their main processors, while communications are still maintained by the main processors. Different considerations must be taken into account when benchmarking MAC functions for network communications. These considerations include: • Cores Involved. The future generation Internet protocols, and the future production operating systems in response, will have message authentication as a standard feature. Execution of MAC functions might be locked on certain processor cores so those functions do not render the system unusable in case of high load. Previously conducted performance studies usually focused on the processor power consumed by an evaluated function, without taking into consideration how many cores are utilized by that function. • Extra-Processor Computation. There are implementations of MAC functions that execute outside the main processor (e.g. an external cryptographic processor), yet the main processor still responsible for handling the communication session utilizing the MAC function. Evaluating the processing power on either the main processor or the external processor alone might not be sufficient to indicate the effective performance of that communication session. • Implementation Heterogeneity. A MAC function can have different implementations under same computing architectures, for example, single- threaded and multi-threaded implementations. The determination of superior implementation will be subject preliminary to how the processor will handle them, and how the operating system will schedule their execution. Other factors such as I/O and bus delays may also contribute to the determination. • Workload Concurrency. Previous studies did not consider the use of concurrent workloads (for example, to simulate multiple connections) for their evaluations. With concurrent workloads, effects of scheduling, memory and I/O demands can be reflected on the processing time, giving more realistic performance determination (such as computing the system’ capacity in term of number of concurrent connections).
It becomes obvious that there are substantial considerations to be made beyond power or throughput. The objective of this work is to realize an environment to characterize the effect of these considerations.
III. BENCHMARKING SETUP In order to successfully evaluate the MAC functions for
communication purposes within mobile systems, it is important to have a benchmarking setup that effectively describes the true nature of both mobile environments and communications. To achieve this, the benchmarking setup should incorporate the use of mobile production systems, and production operating systems configured for everyday usage. For communications, the setup should be simulate concurrent processing of message authentication as it happens with real communication sessions, and to operate on realistic message lengths that are supported by major mobile communication protocols.
In this paper, the benchmarking setup was designed to fulfill the mentioned objectives. Real architectures from three major known brands in mobile computing were evaluated. A customizable distribution of Linux operating system, which its kernel is powering many of today’s mobile systems, is used. The workload was implemented to apply message authentication processing in simulated communication mode, while controlling some operational factors such as cores involved, number of concurrent sessions, and session duration. The workflow was also designed to ensure that the both workloads and their parameters were suitable to apply on studied systems for accurate evaluations. The benchmark metrics were selected to observe computational characteristics of studied systems in both simple and comprehensive ways.
The following elaborates on the details of the benchmarking setup. A. Benchmark Environment
The environment is designed in a manner that ensures that the operating system has minimum influence on obtained results, all benchmarking experiments were conducted under the same OS (Ubuntu Linux 10.04LTS). The chosen operating system, which is running in Gnome desktop mode, uses “Completely Fair” scheduler for scheduling its processes.
Benchmarked architectures were TI DM3730 ARM Cortex A8, Intel Core I3 M350, AMD Opteron 2354, Mobile Intel Pentium 4 3.0GHz. While Opteron is not build for mobile systems, it was included in the benchmark since it was the available AMD architecture at the time of the study, as it shares similar features with its mobile counterpart (Phenom) such as Cool'n'QuietTM speed-stepping (which is a mobile-based feature that reduces processor clock frequency to save energy or reduce operating temperature). B. Workload and Workflow
A multi-threaded benchmarking application is written to evaluate selected MAC functions. The application uses multithreading approach to create workload instances in order to minimize the effect of memory switching on the measurements accuracy. The application was also equipped with a method for binding the execution of the workload instances into certain predefined cores in order to study the effect of limiting the number of available processor cores on the performance of the workload.
The benchmarking workload procedure is illustrated in Figs. 1 and 2. Since typical communication sessions usually runs concurrently with different durations and message lengths, the workload was implemented to simulate such conditions;
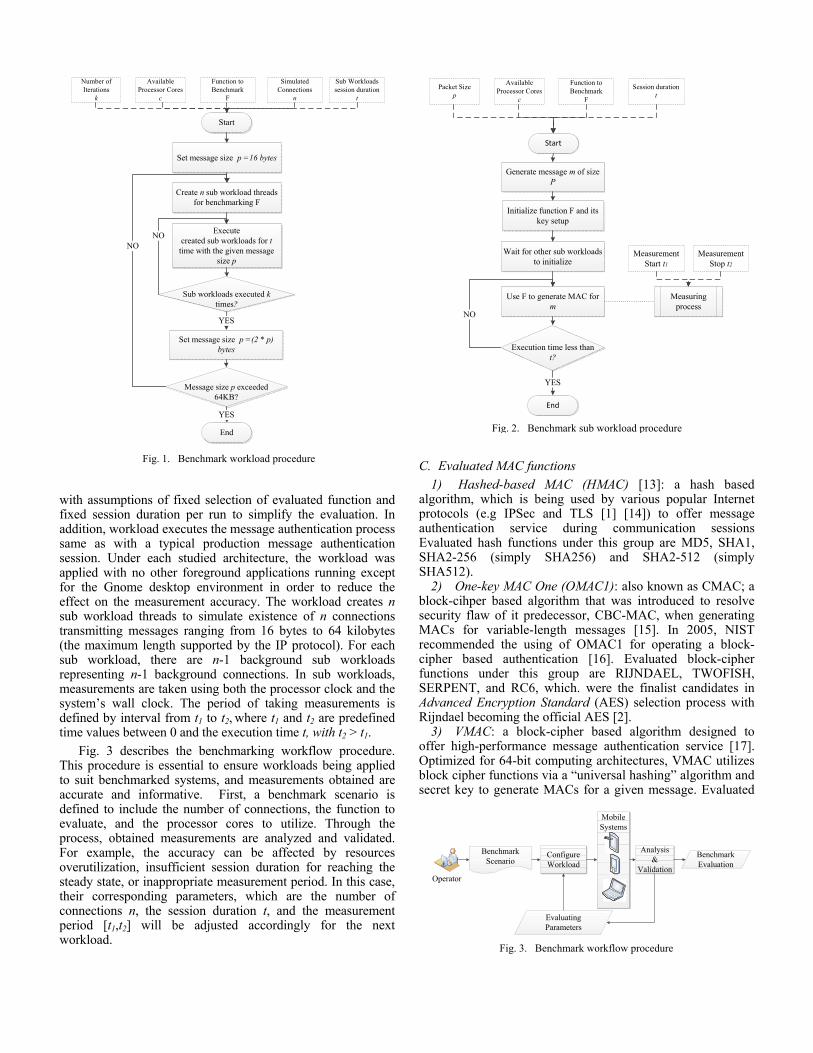
Create n sub workload threads for benchmarking F
Start
Available Processor Cores
c
Function to Benchmark
F
Simulated Connections
n
Set message size p =16 bytes
Executecreated sub workloads for ttime with the given message
size p
Sub workloads executed k times?
Number of Iterations
k
Set message size p =(2 * p) bytes
Message size p exceeded 64KB?
End
Sub Workloads session duration
t
NO
YES
YES
NO
Fig. 1. Benchmark workload procedure
Start
Available Processor Cores
c
Function to Benchmark
F
Session durationt
Packet Sizep
Wait for other sub workloads to initialize
Generate message m of size P
Initialize function F and its key setup
Use F to generate MAC for m
Execution time less than t?
End
Measuring process
YES
NO
Measurement Start t1
Measurement Stop t2
Fig. 2. Benchmark sub workload procedure
MobileSystems
Benchmark Scenario
Configure Workload
Evaluating Parameters
Analysis &
Validation
BenchmarkEvaluation
OperatorOperator
Fig. 3. Benchmark workflow procedure
with assumptions of fixed selection of evaluated function and fixed session duration per run to simplify the evaluation. In addition, workload executes the message authentication process same as with a typical production message authentication session. Under each studied architecture, the workload was applied with no other foreground applications running except for the Gnome desktop environment in order to reduce the effect on the measurement accuracy. The workload creates n sub workload threads to simulate existence of n connections transmitting messages ranging from 16 bytes to 64 kilobytes (the maximum length supported by the IP protocol). For each sub workload, there are n-1 background sub workloads representing n-1 background connections. In sub workloads, measurements are taken using both the processor clock and the system’s wall clock. The period of taking measurements is defined by interval from t1 to t2, where t1 and t2 are predefined time values between 0 and the execution time t, with t2 > t1.
Fig. 3 describes the benchmarking workflow procedure. This procedure is essential to ensure workloads being applied to suit benchmarked systems, and measurements obtained are accurate and informative. First, a benchmark scenario is defined to include the number of connections, the function to evaluate, and the processor cores to utilize. Through the process, obtained measurements are analyzed and validated. For example, the accuracy can be affected by resources overutilization, insufficient session duration for reaching the steady state, or inappropriate measurement period. In this case, their corresponding parameters, which are the number of connections n, the session duration t, and the measurement period [t1,t2] will be adjusted accordingly for the next workload.
C. Evaluated MAC functions 1) Hashed-based MAC (HMAC) [13]: a hash based
algorithm, which is being used by various popular Internet protocols (e.g IPSec and TLS [1] [14]) to offer message authentication service during communication sessions Evaluated hash functions under this group are MD5, SHA1, SHA2-256 (simply SHA256) and SHA2-512 (simply SHA512).
2) One-key MAC One (OMAC1): also known as CMAC; a block-cihper based algorithm that was introduced to resolve security flaw of it predecessor, CBC-MAC, when generating MACs for variable-length messages [15]. In 2005, NIST recommended the using of OMAC1 for operating a block-cipher based authentication [16]. Evaluated block-cipher functions under this group are RIJNDAEL, TWOFISH, SERPENT, and RC6, which. were the finalist candidates in Advanced Encryption Standard (AES) selection process with Rijndael becoming the official AES [2].
3) VMAC: a block-cipher based algorithm designed to offer high-performance message authentication service [17]. Optimized for 64-bit computing architectures, VMAC utilizes block cipher functions via a “universal hashing” algorithm and secret key to generate MACs for a given message. Evaluated
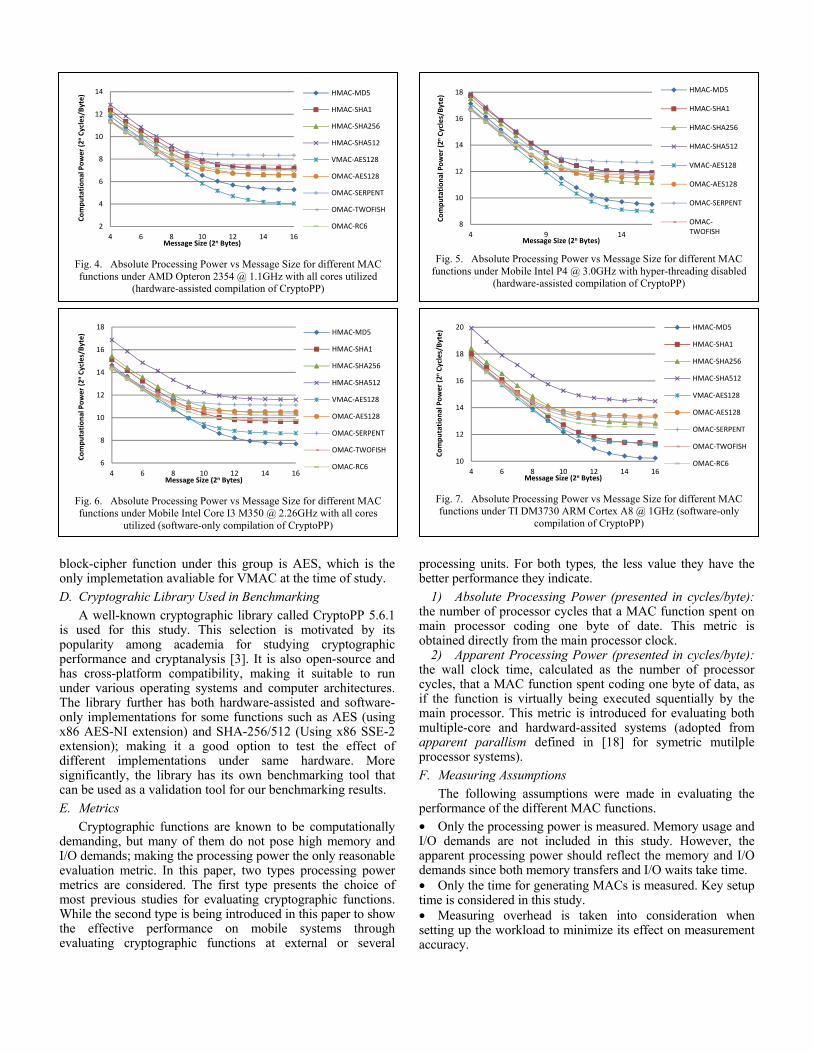
Fig. 4. Absolute Processing Power vs Message Size for different MAC functions under AMD Opteron 2354 @ 1.1GHz with all cores utilized
(hardware-assisted compilation of CryptoPP)
2
4
6
8
10
12
14
4 6 8 10 12 14 16
Com
puta
tion
al P
ower
(2n
Cycl
es/B
yte)
Message Size (2n Bytes)
HMAC-MD5
HMAC-SHA1
HMAC-SHA256
HMAC-SHA512
VMAC-AES128
OMAC-AES128
OMAC-SERPENT
OMAC-TWOFISH
OMAC-RC6
Fig. 6. Absolute Processing Power vs Message Size for different MAC functions under Mobile Intel Core I3 M350 @ 2.26GHz with all cores
utilized (software-only compilation of CryptoPP)
6
8
10
12
14
16
18
4 6 8 10 12 14 16
Com
puta
tion
al P
ower
(2n
Cycl
es/B
yte)
Message Size (2n Bytes)
HMAC-MD5
HMAC-SHA1
HMAC-SHA256
HMAC-SHA512
VMAC-AES128
OMAC-AES128
OMAC-SERPENT
OMAC-TWOFISH
OMAC-RC6
Fig. 5. Absolute Processing Power vs Message Size for different MAC
functions under Mobile Intel P4 @ 3.0GHz with hyper-threading disabled (hardware-assisted compilation of CryptoPP)
8
10
12
14
16
18
4 9 14
Com
puta
tion
al P
ower
(2n
Cycl
es/B
yte)
Message Size (2n Bytes)
HMAC-MD5
HMAC-SHA1
HMAC-SHA256
HMAC-SHA512
VMAC-AES128
OMAC-AES128
OMAC-SERPENT
OMAC-TWOFISH
Fig. 7. Absolute Processing Power vs Message Size for different MAC functions under TI DM3730 ARM Cortex A8 @ 1GHz (software-only
compilation of CryptoPP)
10
12
14
16
18
20
4 6 8 10 12 14 16
Com
puta
tion
al P
ower
(2n
Cycl
es/B
yte)
Message Size (2n Bytes)
HMAC-MD5
HMAC-SHA1
HMAC-SHA256
HMAC-SHA512
VMAC-AES128
OMAC-AES128
OMAC-SERPENT
OMAC-TWOFISH
OMAC-RC6
block-cipher function under this group is AES, which is the only implemetation avaliable for VMAC at the time of study. D. Cryptograhic Library Used in Benchmarking
A well-known cryptographic library called CryptoPP 5.6.1 is used for this study. This selection is motivated by its popularity among academia for studying cryptographic performance and cryptanalysis [3]. It is also open-source and has cross-platform compatibility, making it suitable to run under various operating systems and computer architectures. The library further has both hardware-assisted and software-only implementations for some functions such as AES (using x86 AES-NI extension) and SHA-256/512 (Using x86 SSE-2 extension); making it a good option to test the effect of different implementations under same hardware. More significantly, the library has its own benchmarking tool that can be used as a validation tool for our benchmarking results. E. Metrics
Cryptographic functions are known to be computationally demanding, but many of them do not pose high memory and I/O demands; making the processing power the only reasonable evaluation metric. In this paper, two types processing power metrics are considered. The first type presents the choice of most previous studies for evaluating cryptographic functions. While the second type is being introduced in this paper to show the effective performance on mobile systems through evaluating cryptographic functions at external or several
processing units. For both types, the less value they have the better performance they indicate.
1) Absolute Processing Power (presented in cycles/byte): the number of processor cycles that a MAC function spent on main processor coding one byte of date. This metric is obtained directly from the main processor clock.
2) Apparent Processing Power (presented in cycles/byte): the wall clock time, calculated as the number of processor cycles, that a MAC function spent coding one byte of data, as if the function is virtually being executed squentially by the main processor. This metric is introduced for evaluating both multiple-core and hardward-assited systems (adopted from apparent parallism defined in [18] for symetric mutilple processor systems). F. Measuring Assumptions
The following assumptions were made in evaluating the performance of the different MAC functions. • Only the processing power is measured. Memory usage and I/O demands are not included in this study. However, the apparent processing power should reflect the memory and I/O demands since both memory transfers and I/O waits take time. • Only the time for generating MACs is measured. Key setup time is considered in this study. • Measuring overhead is taken into consideration when setting up the workload to minimize its effect on measurement accuracy.
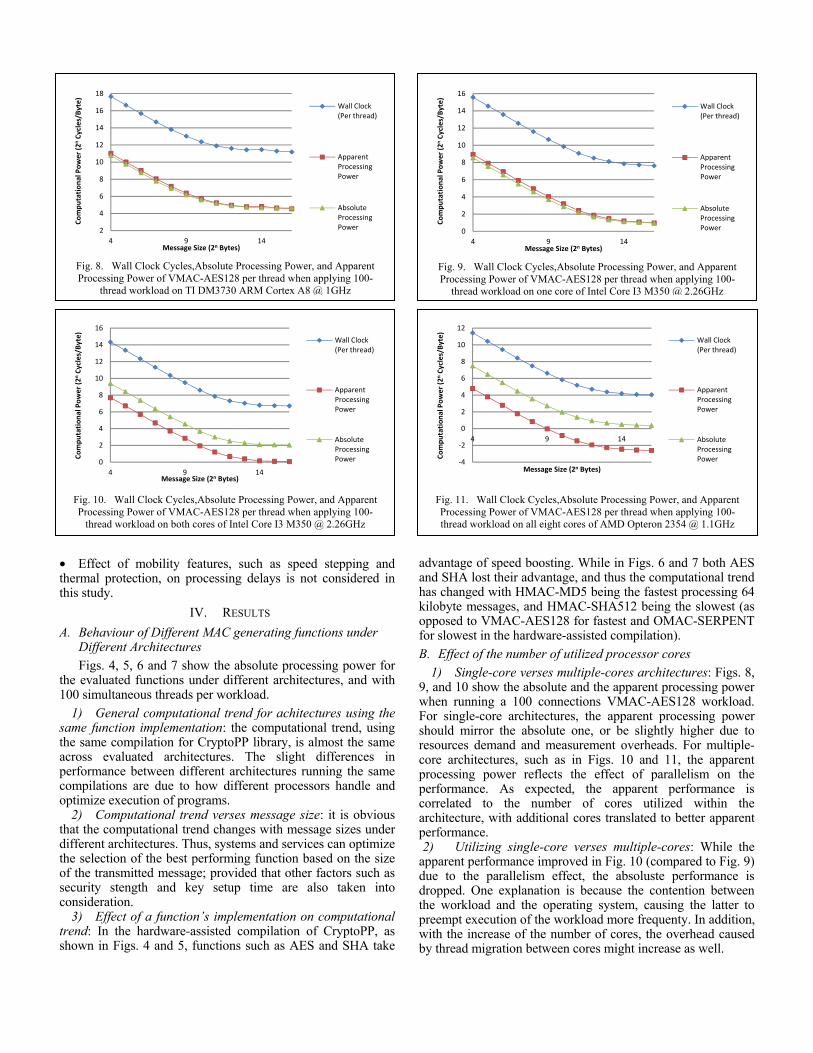
Fig. 8. Wall Clock Cycles,Absolute Processing Power, and Apparent Processing Power of VMAC-AES128 per thread when applying 100-
thread workload on TI DM3730 ARM Cortex A8 @ 1GHz
2
4
6
8
10
12
14
16
18
4 9 14
Com
puta
tion
al P
ower
(2n
Cycl
es/B
yte)
Message Size (2n Bytes)
Wall Clock (Per thread)
Apparent Processing Power
Absolute Processing Power
Fig. 9. Wall Clock Cycles,Absolute Processing Power, and Apparent Processing Power of VMAC-AES128 per thread when applying 100-
thread workload on one core of Intel Core I3 M350 @ 2.26GHz
0
2
4
6
8
10
12
14
16
4 9 14
Com
puta
tion
al P
ower
(2n
Cycl
es/B
yte)
Message Size (2n Bytes)
Wall Clock (Per thread)
Apparent Processing Power
Absolute Processing Power
Fig. 10. Wall Clock Cycles,Absolute Processing Power, and Apparent Processing Power of VMAC-AES128 per thread when applying 100-
thread workload on both cores of Intel Core I3 M350 @ 2.26GHz
0
2
4
6
8
10
12
14
16
4 9 14
Com
puta
tion
al P
ower
(2n
Cycl
es/B
yte)
Message Size (2n Bytes)
Wall Clock (Per thread)
Apparent Processing Power
Absolute Processing Power
Fig. 11. Wall Clock Cycles,Absolute Processing Power, and Apparent Processing Power of VMAC-AES128 per thread when applying 100-thread workload on all eight cores of AMD Opteron 2354 @ 1.1GHz
-4
-2
0
2
4
6
8
10
12
4 9 14Co
mpu
tati
onal
Pow
er (2
nCy
cles
/Byt
e)
Message Size (2n Bytes)
Wall Clock (Per thread)
Apparent Processing Power
Absolute Processing Power
• Effect of mobility features, such as speed stepping and thermal protection, on processing delays is not considered in this study.
IV. RESULTS A. Behaviour of Different MAC generating functions under
Different Architectures Figs. 4, 5, 6 and 7 show the absolute processing power for
the evaluated functions under different architectures, and with 100 simultaneous threads per workload.
1) General computational trend for achitectures using the same function implementation: the computational trend, using the same compilation for CryptoPP library, is almost the same across evaluated architectures. The slight differences in performance between different architectures running the same compilations are due to how different processors handle and optimize execution of programs.
2) Computational trend verses message size: it is obvious that the computational trend changes with message sizes under different architectures. Thus, systems and services can optimize the selection of the best performing function based on the size of the transmitted message; provided that other factors such as security stength and key setup time are also taken into consideration.
3) Effect of a function’s implementation on computational trend: In the hardware-assisted compilation of CryptoPP, as shown in Figs. 4 and 5, functions such as AES and SHA take
advantage of speed boosting. While in Figs. 6 and 7 both AES and SHA lost their advantage, and thus the computational trend has changed with HMAC-MD5 being the fastest processing 64 kilobyte messages, and HMAC-SHA512 being the slowest (as opposed to VMAC-AES128 for fastest and OMAC-SERPENT for slowest in the hardware-assisted compilation). B. Effect of the number of utilized processor cores
1) Single-core verses multiple-cores architectures: Figs. 8, 9, and 10 show the absolute and the apparent processing power when running a 100 connections VMAC-AES128 workload. For single-core architectures, the apparent processing power should mirror the absolute one, or be slightly higher due to resources demand and measurement overheads. For multiple-core architectures, such as in Figs. 10 and 11, the apparent processing power reflects the effect of parallelism on the performance. As expected, the apparent performance is correlated to the number of cores utilized within the architecture, with additional cores translated to better apparent performance. 2) Utilizing single-core verses multiple-cores: While the
apparent performance improved in Fig. 10 (compared to Fig. 9) due to the parallelism effect, the absoluste performance is dropped. One explanation is because the contention between the workload and the operating system, causing the latter to preempt execution of the workload more frequenty. In addition, with the increase of the number of cores, the overhead caused by thread migration between cores might increase as well.
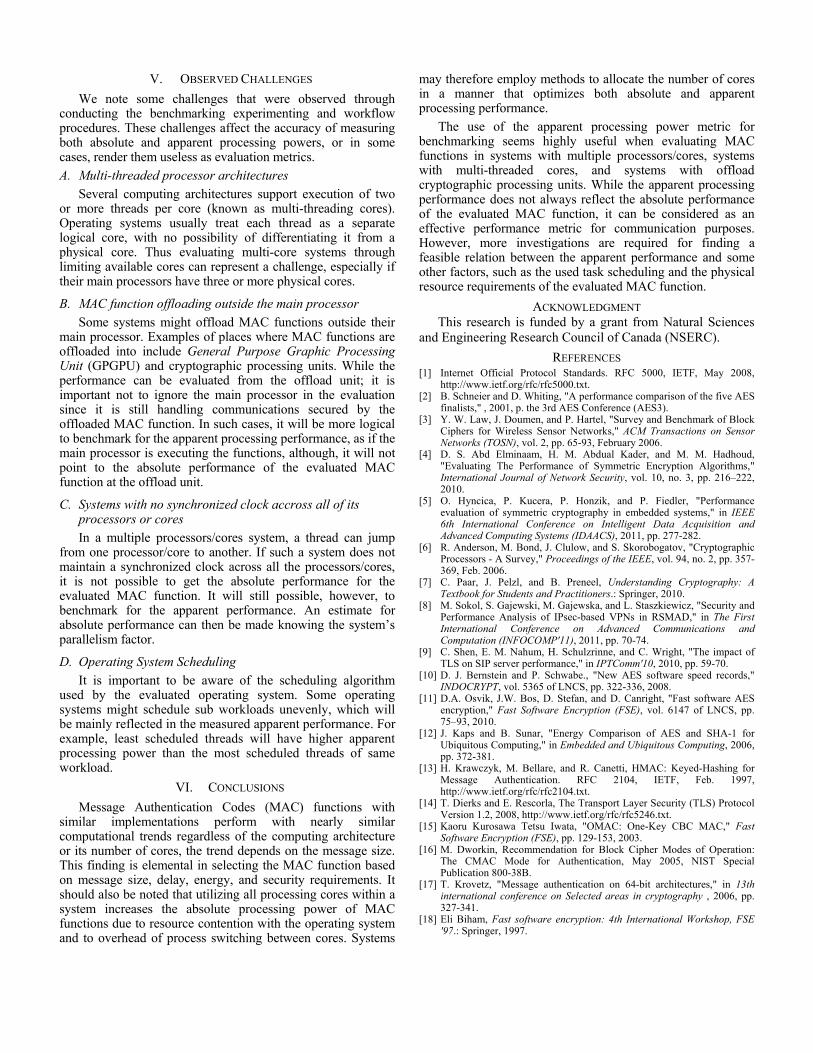
V. OBSERVED CHALLENGES We note some challenges that were observed through
conducting the benchmarking experimenting and workflow procedures. These challenges affect the accuracy of measuring both absolute and apparent processing powers, or in some cases, render them useless as evaluation metrics. A. Multi-threaded processor architectures
Several computing architectures support execution of two or more threads per core (known as multi-threading cores). Operating systems usually treat each thread as a separate logical core, with no possibility of differentiating it from a physical core. Thus evaluating multi-core systems through limiting available cores can represent a challenge, especially if their main processors have three or more physical cores.
B. MAC function offloading outside the main processor Some systems might offload MAC functions outside their
main processor. Examples of places where MAC functions are offloaded into include General Purpose Graphic Processing Unit (GPGPU) and cryptographic processing units. While the performance can be evaluated from the offload unit; it is important not to ignore the main processor in the evaluation since it is still handling communications secured by the offloaded MAC function. In such cases, it will be more logical to benchmark for the apparent processing performance, as if the main processor is executing the functions, although, it will not point to the absolute performance of the evaluated MAC function at the offload unit.
C. Systems with no synchronized clock accross all of its processors or cores In a multiple processors/cores system, a thread can jump
from one processor/core to another. If such a system does not maintain a synchronized clock across all the processors/cores, it is not possible to get the absolute performance for the evaluated MAC function. It will still possible, however, to benchmark for the apparent performance. An estimate for absolute performance can then be made knowing the system’s parallelism factor.
D. Operating System Scheduling It is important to be aware of the scheduling algorithm
used by the evaluated operating system. Some operating systems might schedule sub workloads unevenly, which will be mainly reflected in the measured apparent performance. For example, least scheduled threads will have higher apparent processing power than the most scheduled threads of same workload.
VI. CONCLUSIONS Message Authentication Codes (MAC) functions with
similar implementations perform with nearly similar computational trends regardless of the computing architecture or its number of cores, the trend depends on the message size. This finding is elemental in selecting the MAC function based on message size, delay, energy, and security requirements. It should also be noted that utilizing all processing cores within a system increases the absolute processing power of MAC functions due to resource contention with the operating system and to overhead of process switching between cores. Systems
may therefore employ methods to allocate the number of cores in a manner that optimizes both absolute and apparent processing performance.
The use of the apparent processing power metric for benchmarking seems highly useful when evaluating MAC functions in systems with multiple processors/cores, systems with multi-threaded cores, and systems with offload cryptographic processing units. While the apparent processing performance does not always reflect the absolute performance of the evaluated MAC function, it can be considered as an effective performance metric for communication purposes. However, more investigations are required for finding a feasible relation between the apparent performance and some other factors, such as the used task scheduling and the physical resource requirements of the evaluated MAC function.
ACKNOWLEDGMENT This research is funded by a grant from Natural Sciences
and Engineering Research Council of Canada (NSERC). REFERENCES
[1] Internet Official Protocol Standards. RFC 5000, IETF, May 2008, http://www.ietf.org/rfc/rfc5000.txt.
[2] B. Schneier and D. Whiting, "A performance comparison of the five AES finalists," , 2001, p. the 3rd AES Conference (AES3).
[3] Y. W. Law, J. Doumen, and P. Hartel, "Survey and Benchmark of Block Ciphers for Wireless Sensor Networks," ACM Transactions on Sensor Networks (TOSN), vol. 2, pp. 65-93, February 2006.
[4] D. S. Abd Elminaam, H. M. Abdual Kader, and M. M. Hadhoud, "Evaluating The Performance of Symmetric Encryption Algorithms," International Journal of Network Security, vol. 10, no. 3, pp. 216–222, 2010.
[5] O. Hyncica, P. Kucera, P. Honzik, and P. Fiedler, "Performance evaluation of symmetric cryptography in embedded systems," in IEEE 6th International Conference on Intelligent Data Acquisition and Advanced Computing Systems (IDAACS), 2011, pp. 277-282.
[6] R. Anderson, M. Bond, J. Clulow, and S. Skorobogatov, "Cryptographic Processors - A Survey," Proceedings of the IEEE, vol. 94, no. 2, pp. 357-369, Feb. 2006.
[7] C. Paar, J. Pelzl, and B. Preneel, Understanding Cryptography: A Textbook for Students and Practitioners.: Springer, 2010.
[8] M. Sokol, S. Gajewski, M. Gajewska, and L. Staszkiewicz, "Security and Performance Analysis of IPsec-based VPNs in RSMAD," in The First International Conference on Advanced Communications and Computation (INFOCOMP'11), 2011, pp. 70-74.
[9] C. Shen, E. M. Nahum, H. Schulzrinne, and C. Wright, "The impact of TLS on SIP server performance," in IPTComm'10, 2010, pp. 59-70.
[10] D. J. Bernstein and P. Schwabe., "New AES software speed records," INDOCRYPT, vol. 5365 of LNCS, pp. 322-336, 2008.
[11] D.A. Osvik, J.W. Bos, D. Stefan, and D. Canright, "Fast software AES encryption," Fast Software Encryption (FSE), vol. 6147 of LNCS, pp. 75–93, 2010.
[12] J. Kaps and B. Sunar, "Energy Comparison of AES and SHA-1 for Ubiquitous Computing," in Embedded and Ubiquitous Computing, 2006, pp. 372-381.
[13] H. Krawczyk, M. Bellare, and R. Canetti, HMAC: Keyed-Hashing for Message Authentication. RFC 2104, IETF, Feb. 1997, http://www.ietf.org/rfc/rfc2104.txt.
[14] T. Dierks and E. Rescorla, The Transport Layer Security (TLS) Protocol Version 1.2, 2008, http://www.ietf.org/rfc/rfc5246.txt.
[15] Kaoru Kurosawa Tetsu Iwata, "OMAC: One-Key CBC MAC," Fast Software Encryption (FSE), pp. 129-153, 2003.
[16] M. Dworkin, Recommendation for Block Cipher Modes of Operation: The CMAC Mode for Authentication, May 2005, NIST Special Publication 800-38B.
[17] T. Krovetz, "Message authentication on 64-bit architectures," in 13th international conference on Selected areas in cryptography , 2006, pp. 327-341.
[18] Eli Biham, Fast software encryption: 4th International Workshop, FSE '97.: Springer, 1997.