tutorial for using the entity detail report
TRANSCRIPT
Entity Detail Report Tutorial Page | 1
Tutorial for Using the Entity Detail Report
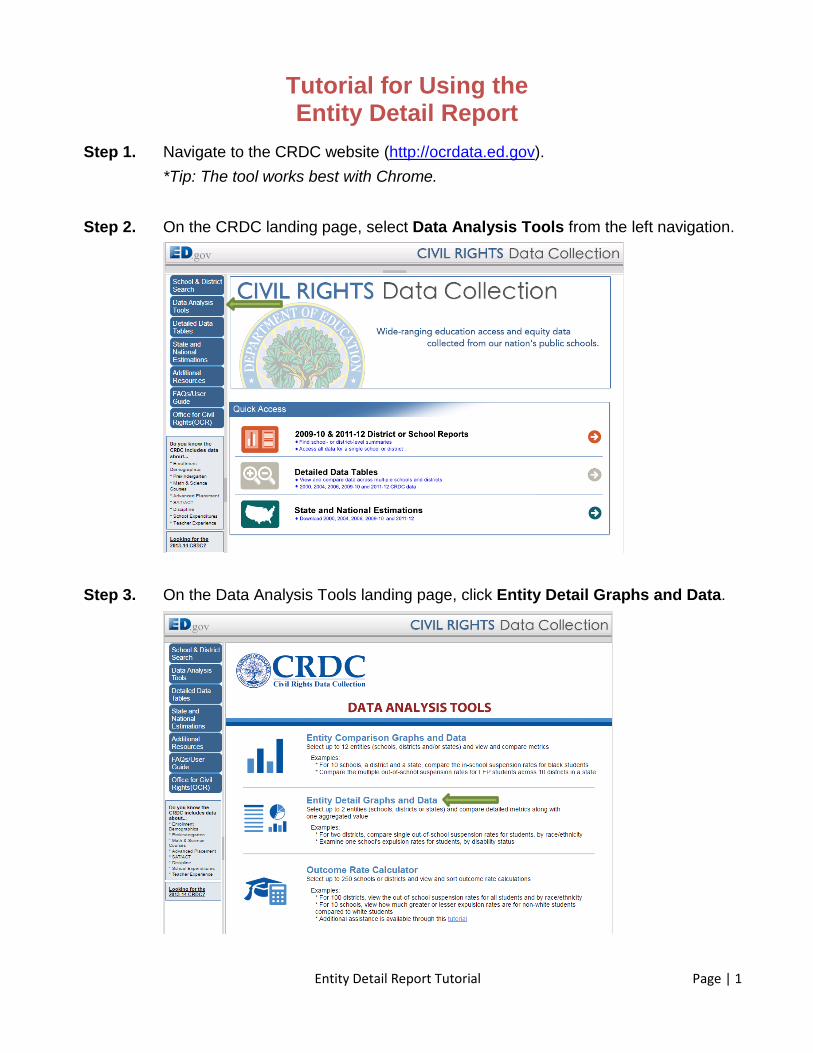
Step 1. Navigate to the CRDC website (http://ocrdata.ed.gov). *Tip: The tool works best with Chrome.
Step 2. On the CRDC landing page, select Data Analysis Tools from the left navigation.
Step 3. On the Data Analysis Tools landing page, click Entity Detail Graphs and Data.

Entity Detail Report Tutorial Page | 2
Step 4. On the Entity Detail Report landing page, select the appropriate data element, collection year, and level of data (school, district, or state) to include in your analysis.
Step 5. Select up to 2 schools, districts and/or states to further refine your report. There are several ways to add schools, districts, or states to your analysis. The various ways of adding data are outlined in separate steps.
• To add schools by school name, go to Step 6a. • To add schools by district name, go to Step 7a. • To add schools by state, go to Step 8a. • To add schools by data element criteria, go to Step 9a. • To add districts by district name, go to Step 10a. • To add districts by state, go to Step 11a. • To add districts by data element criteria, go to Step 12a. • To add states, go to Step 13a.

Entity Detail Report Tutorial Page | 3
Step 6a. Click School for the level of data.
Step 6b. Click Find Schools by Name, District or State.

Entity Detail Report Tutorial Page | 4
Step 6c. Enter the School Name (e.g., “Mifflin”). Click Find. A list of schools will appear. *Tip: Use broad search terms and then narrow your selection. Do not include terms like “elementary” or “high school” in your search.

Entity Detail Report Tutorial Page | 5
Step 6d. Select the schools to include in your analysis by checking the corresponding boxes on the left. To select all the schools, check Select all. Click Add to Data Set to add all of the selected schools to your analysis.
Proceed to Step 14.

Entity Detail Report Tutorial Page | 6
Step 7a. Click School for the level of data.
Step 7b. Click Find Schools by Name, District or State.

Entity Detail Report Tutorial Page | 7
Step 7c. Enter the District Name (e.g., “Columbus City”). Click Find. A list of districts will appear. *Note: ID and State can be used to help narrow the results.

Entity Detail Report Tutorial Page | 8
Step 7d. Select the appropriate district by clicking on the name. A list of schools within the district will appear. Select the schools to include in your analysis by checking the corresponding boxes on the left. To select all the schools, check Select all. Click Add to Data Set to add all of the selected schools to your analysis.
Proceed to Step 14.

Entity Detail Report Tutorial Page | 9
Step 8a. Click School for the level of data.
Step 8b. Click Find Schools by Name, District or State.
Entity Detail Report Tutorial Page | 10
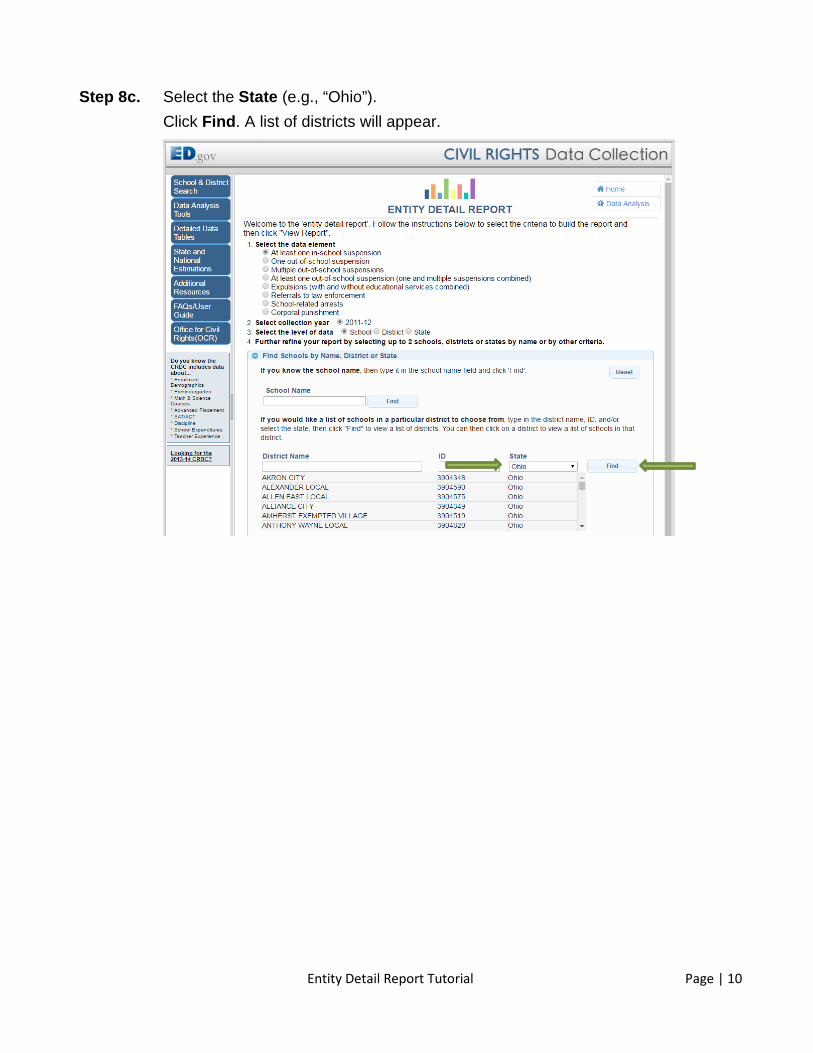
Step 8c. Select the State (e.g., “Ohio”). Click Find. A list of districts will appear.

Entity Detail Report Tutorial Page | 11
Step 8d. Select the appropriate district by clicking on the name. A list of schools within the district will appear. Select the schools to include in your analysis by checking the corresponding boxes on the left. To select all the schools, check Select all. Click Add to Data Set to add all of the selected schools to your analysis.
Proceed to Step 14.

Entity Detail Report Tutorial Page | 12
Step 9a. Click School for the level of data.
Step 9b. Click Find Search for Schools Based on Data Element Criteria.

Entity Detail Report Tutorial Page | 13
Step 9c.
Select criteria from Characteristics, Membership, Staffing and Finance; College and Career Readiness; or Discipline tab to refine your search. Click Find. *Note: A combination of criteria from any of the tabs can be selected. It is not necessary for you to enter a School Name, District Name or State. If you leave those fields empty, all schools are considered. For example, for a list of middle schools in Ohio with less than 500 students and that are not juvenile justice facilities, select “Ohio” for the State; select grades “6”, “7”, and “8” for the Grades Offered; select “No” for Juvenile Justice Facility; and then enter “Less Than 500” for Enrollment Total.

Entity Detail Report Tutorial Page | 14
Step 9d. Select the schools to include in your analysis by checking the corresponding boxes on the left. To select all the schools, check Select all. Click Add to Data Set to add all of the selected schools to your analysis.
Proceed to Step 14.
Entity Detail Report Tutorial Page | 15
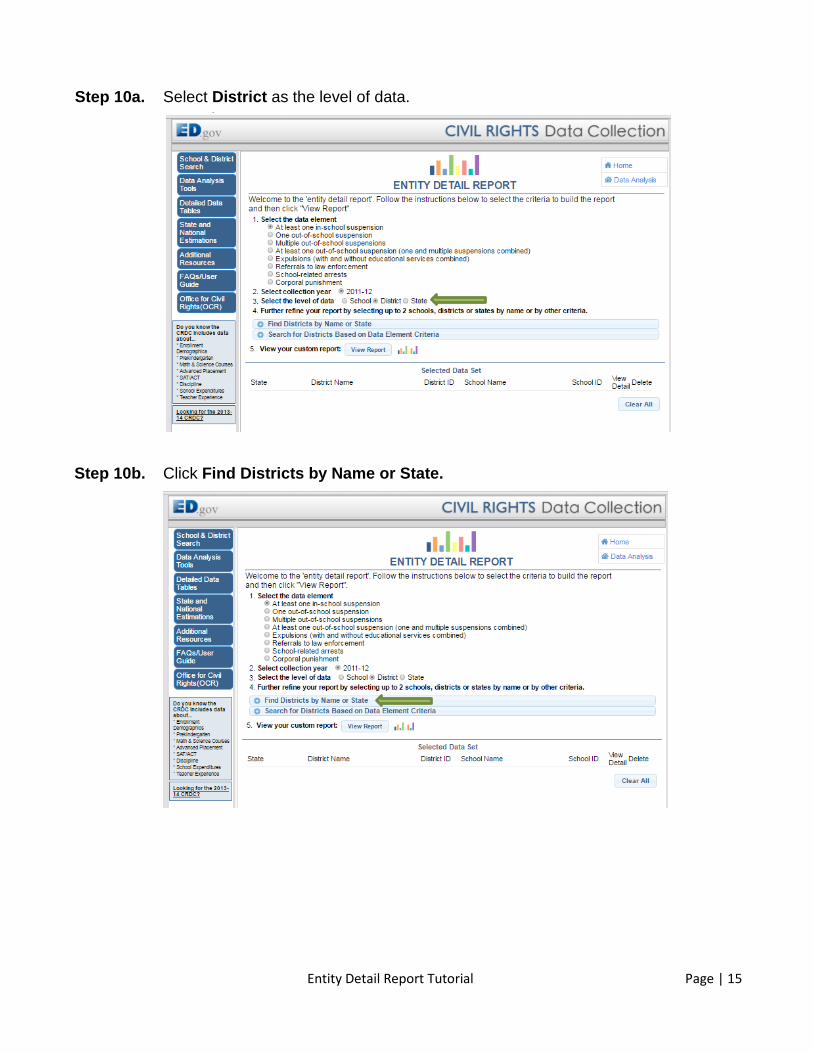
Step 10a. Select District as the level of data.
Step 10b. Click Find Districts by Name or State.

Entity Detail Report Tutorial Page | 16
Step 10c. Enter the District Name (e.g., “Columbus City”). Click Find. A list of districts will appear. *Note: ID and State can be used to help narrow the results.
Entity Detail Report Tutorial Page | 17
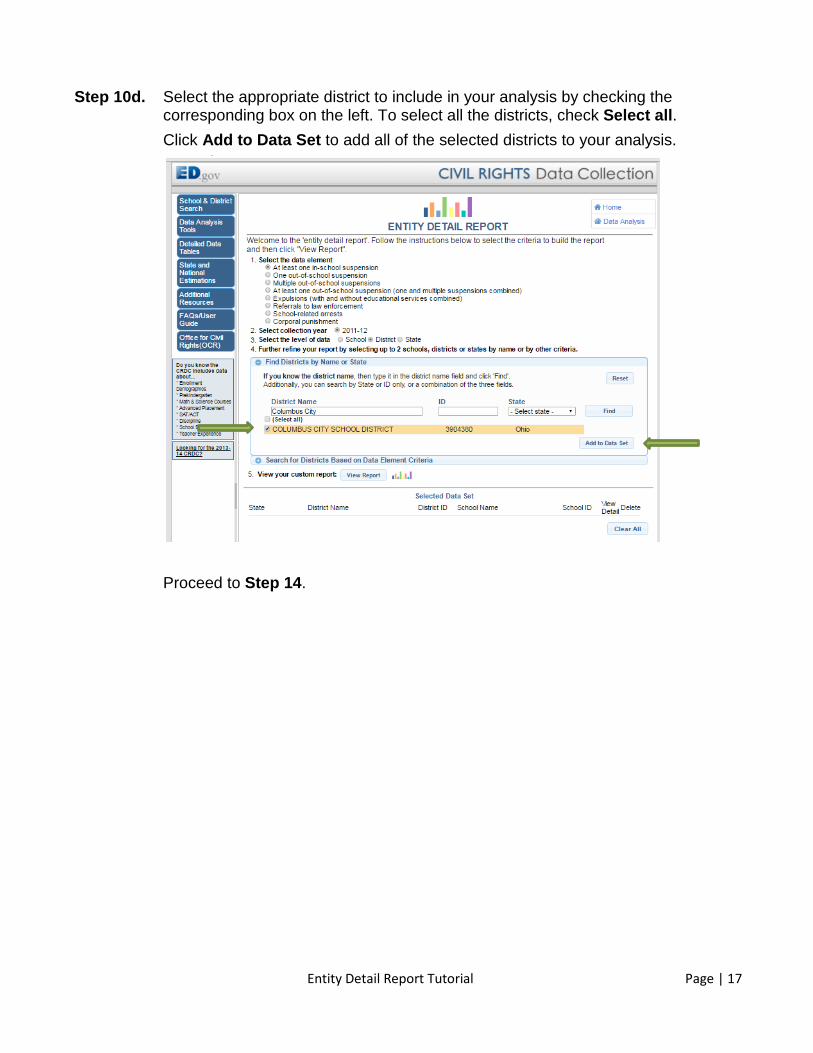
Step 10d. Select the appropriate district to include in your analysis by checking the corresponding box on the left. To select all the districts, check Select all. Click Add to Data Set to add all of the selected districts to your analysis.
Proceed to Step 14.

Entity Detail Report Tutorial Page | 18
Step 11a. Select District as the level of data.
Step 11b. Click Find Districts by Name or State.

Entity Detail Report Tutorial Page | 19
Step 11c. Select the State (e.g., “Ohio”). Click Find. A list of districts will appear. *Note: ID can be used to help narrow the results.

Entity Detail Report Tutorial Page | 20
Step 11d. Select the districts to include in your analysis by checking the corresponding boxes on the left. To select all the districts, check Select all. Click Add to Data Set to add all of the selected districts to your analysis.
Proceed to Step 14.
Step 12a. Select District as the level of data.

Entity Detail Report Tutorial Page | 21
Step 12b. Click Search for Districts Based on Data Element Criteria.
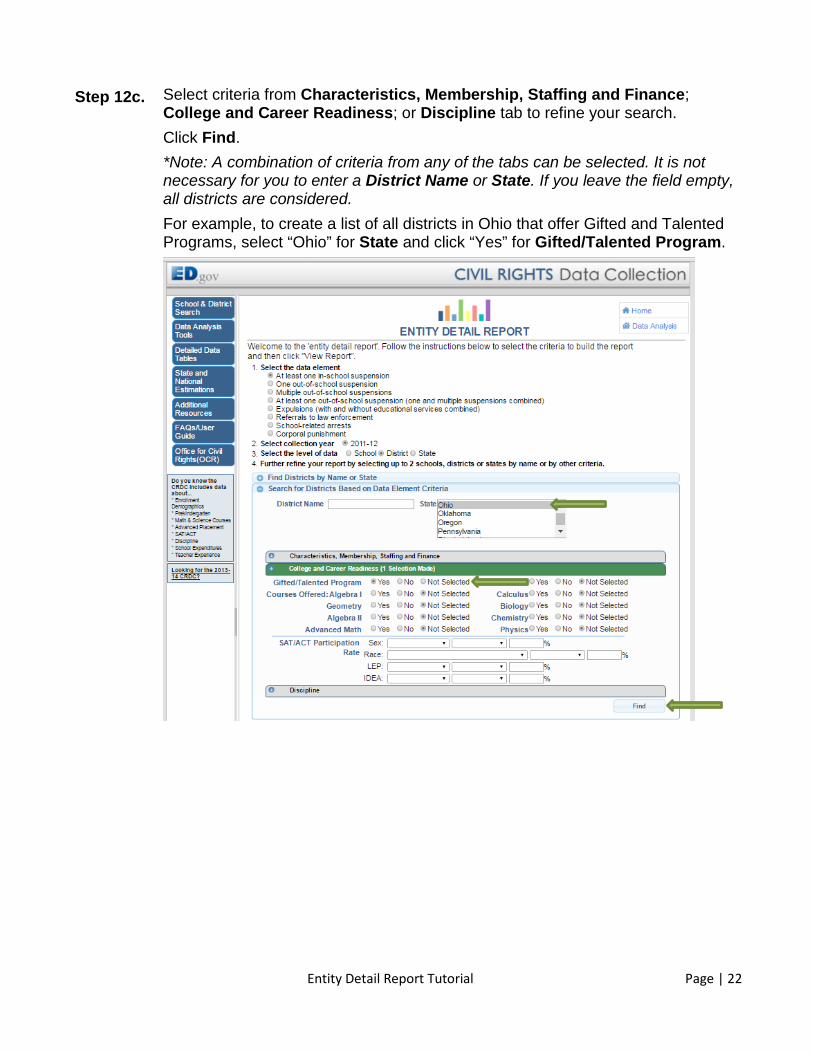
Entity Detail Report Tutorial Page | 22
Step 12c. Select criteria from Characteristics, Membership, Staffing and Finance; College and Career Readiness; or Discipline tab to refine your search. Click Find. *Note: A combination of criteria from any of the tabs can be selected. It is not necessary for you to enter a District Name or State. If you leave the field empty, all districts are considered. For example, to create a list of all districts in Ohio that offer Gifted and Talented Programs, select “Ohio” for State and click “Yes” for Gifted/Talented Program.

Entity Detail Report Tutorial Page | 23
Step 12d. Select the districts to include in your analysis by checking the corresponding boxes on the left. To select all the districts, check Select all. Click Add to Data Set to add all of the selected districts to your analysis.
Proceed to Step 14.

Entity Detail Report Tutorial Page | 24
Step 13a. Click Add State(s).
Step 13b. Select the state (e.g., Ohio). Click Add to Data Set to add the entire state to the analysis.
Proceed to Step 14.

Entity Detail Report Tutorial Page | 25
Step 14. Click View Report.
Step 15. View your generated report. Use the scroll bar to view the information presented on the far right of the graphics. To interpret the analysis, see Interpreting the Results from the Entity Detail Report section on the next page.

Entity Detail Report Tutorial Page | 26
Using and Interpreting the Results from the Entity Detail Report
A short example was created to explain how to use and interpret the results from the Entity Detail Report. A portion of the example reports are included on the following pages. Comparisons were made for ‘at least one in-school suspension’ (ISS) in Cincinnati City and Columbus City school districts. Notice there is a chart (i.e., graphical visualization) of the results and data (i.e., data table representation) of the results. To toggle between the two outputs while using the tool, Click Chart->Data button in the upper right of the output. The chart view displays five separate bar charts. Each chart contains a set of student variables that can be selected for analysis. The default view displays separate sections for each entity included in the report (for this example, Cincinnati City school district on the left and Columbus City school district on the right). To filter the data, click the radio buttons on the bottom of the bar charts. Suppose we want to compare the male students of color between the two districts. To do such, click the Students of Color and the Male radio buttons under the first bar chart. Notice how the chart adjusts accordingly. The output shows that the Cincinnati City school district has a slightly higher percentage of ISS for male students of color compared to Columbus City school district. Now change the chart to show the ISS for all disability students. Notice that male and female IDEA students in the Cincinnati City school district are in-school suspended most often. While in the Columbus City school district male and female 504 students are suspended most often. A formula is provided at the top of the chart to aid in interpretation. The formula states: % = At least one in-school suspension student counts / student enrollment count. For example, in Cincinnati City schools, female students of color have a data value of 9.0%. This tells us that 9% of the female students of color enrolled in Cincinnati City schools received at least one in-school suspension. Now click on Chart->Data to display the data view. Notice there are no options to filter the data report, as with the bar charts. You must customize the data view from the chart view. The corresponding results will display in both views. There is a table that corresponds to each of the bar charts. The tables show the raw data used to compute the corresponding bar charts. The Data Set View and Export is the last table. It displays the detailed raw data for each of the entities. The columns can be sorted by clicking on the blue column header. Also, to group on a variable drag the blue header to the white space above the header row. The data will adjust automatically.

Entity Detail Report Tutorial Page | 27
To export the report from the data view, click the Export button on the upper right of the Data Set View and Export table.

Entity Detail Report Tutorial Page | 28

Entity Detail Report Tutorial Page | 29