tutorial 9 creating a map layout - university of sheffield/file/tutorial9.pdf · the ‘data...
TRANSCRIPT
1
Tutorial 9: Creating Layout Plans and Printing
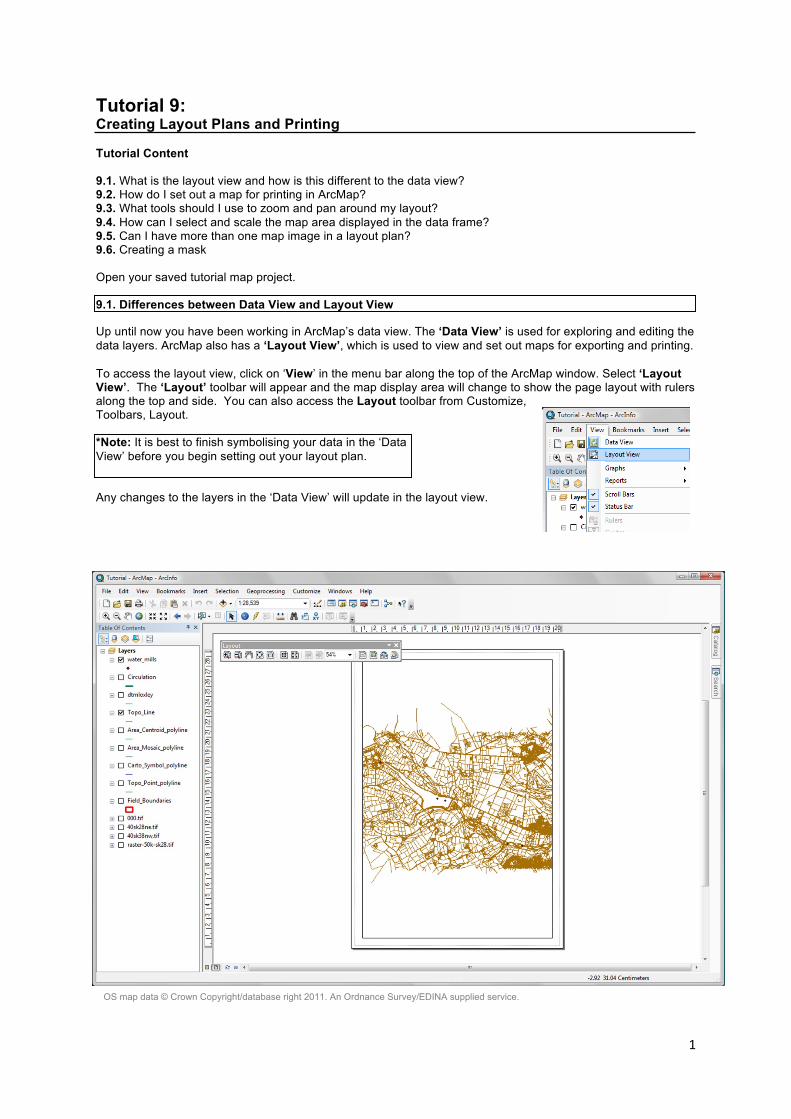
Tutorial Content 9.1. What is the layout view and how is this different to the data view? 9.2. How do I set out a map for printing in ArcMap? 9.3. What tools should I use to zoom and pan around my layout? 9.4. How can I select and scale the map area displayed in the data frame? 9.5. Can I have more than one map image in a layout plan? 9.6. Creating a mask Open your saved tutorial map project. 9.1. Differences between Data View and Layout View Up until now you have been working in ArcMap’s data view. The ‘Data View’ is used for exploring and editing the data layers. ArcMap also has a ‘Layout View’, which is used to view and set out maps for exporting and printing. To access the layout view, click on ‘View’ in the menu bar along the top of the ArcMap window. Select ‘Layout View’. The ‘Layout’ toolbar will appear and the map display area will change to show the page layout with rulers along the top and side. You can also access the Layout toolbar from Customize, Toolbars, Layout. *Note: It is best to finish symbolising your data in the ‘Data View’ before you begin setting out your layout plan. Any changes to the layers in the ‘Data View’ will update in the layout view.
OS map data © Crown Copyright/database right 2011. An Ordnance Survey/EDINA supplied service.

2
9.2. Setting out a Layout Plan for Printing
a) Page and Print Setup To access the page and print set up, right click anywhere in the white background of the layout view. Select Page and Print Setup . . . You can also access Page and Print Setup from the File menu.
The ‘Page and Print Setup’ window will appear. Make sure that under ‘Map Page Size’ the option to ‘Use printer Paper Settings’ is not ticked. You will then be able to select a page size and paper orientation. You do not have to select a printer at this stage. Set the layout’s page size and orientation using the options under ‘Map Page Size’. The option at the bottom of the window ‘Scale Map Elements proportionally to changes in Paper Size’ will rescale your data to fit your new page size. When you are happy with your settings, click OK. The layout page and rulers will change according to the new page size and orientation. In this case the paper size has been increased and the orientation has been changed from portrait to landscape.
OS map data © Crown Copyright/database right 2009. An Ordnance Survey/EDINA supplied service.
3
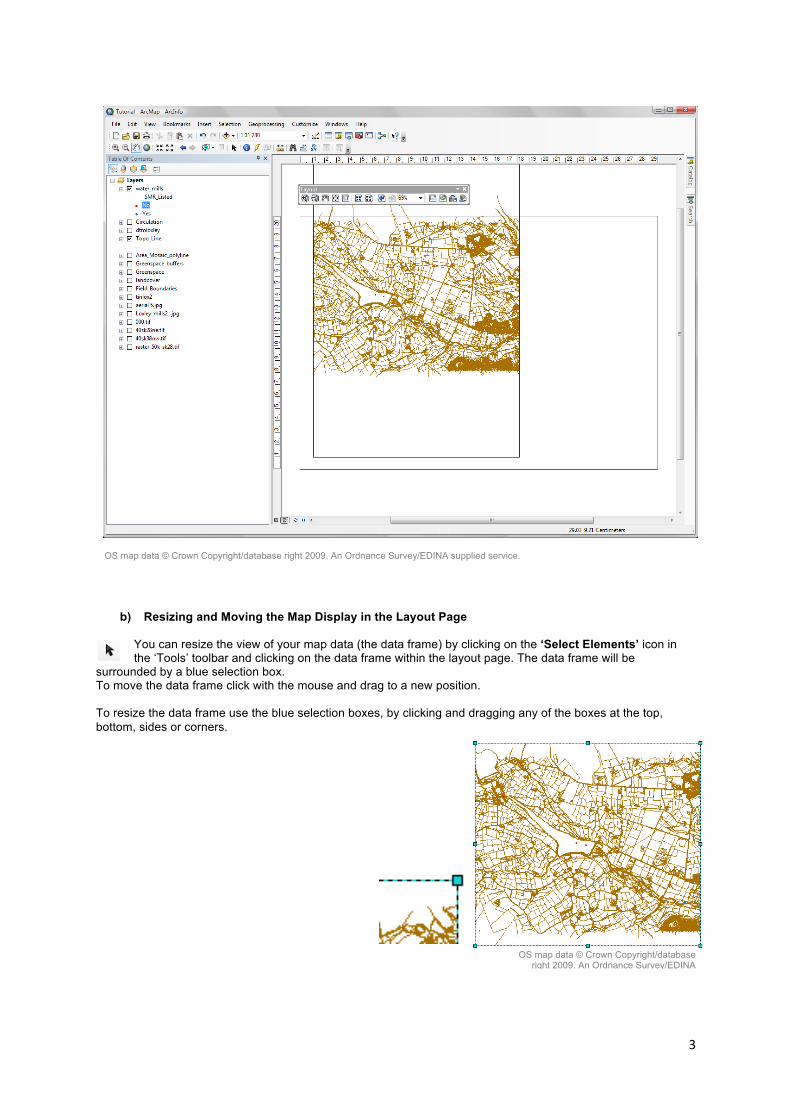
b) Resizing and Moving the Map Display in the Layout Page
You can resize the view of your map data (the data frame) by clicking on the ‘Select Elements’ icon in the ‘Tools’ toolbar and clicking on the data frame within the layout page. The data frame will be
surrounded by a blue selection box. To move the data frame click with the mouse and drag to a new position. To resize the data frame use the blue selection boxes, by clicking and dragging any of the boxes at the top, bottom, sides or corners.
OS map data © Crown Copyright/database right 2009. An Ordnance Survey/EDINA supplied service.
OS map data © Crown Copyright/database right 2009. An Ordnance Survey/EDINA
supplied service.
4
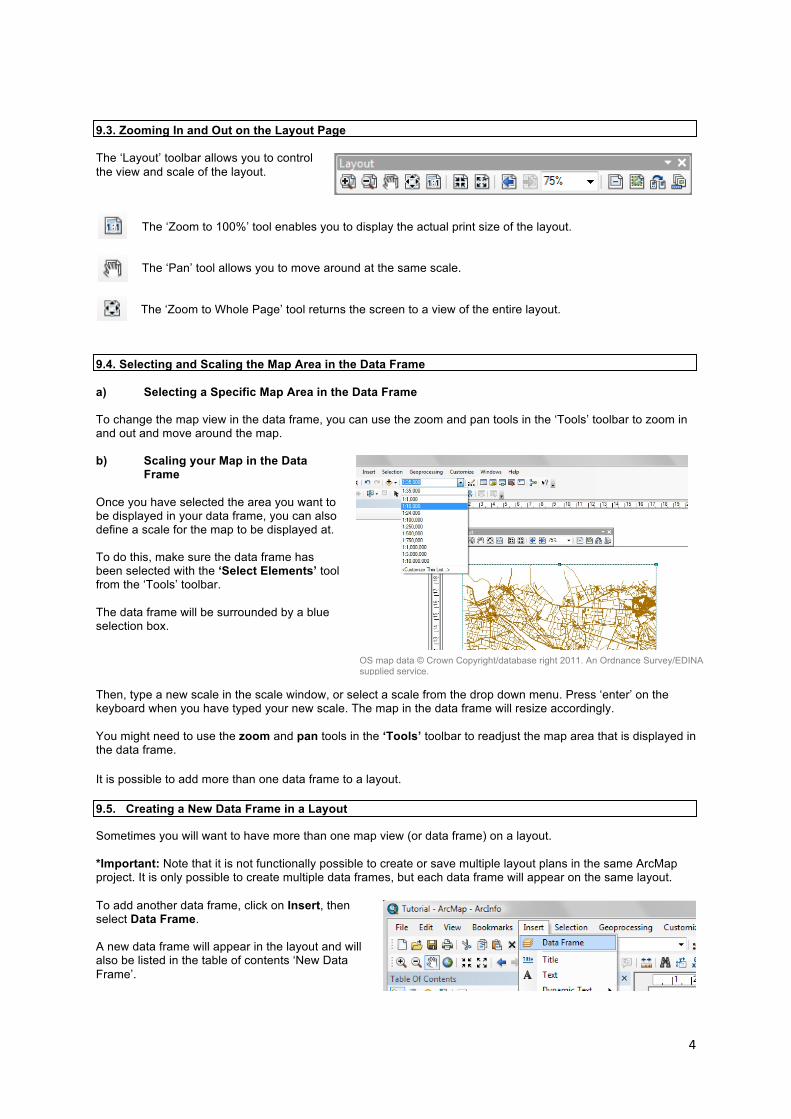
9.3. Zooming In and Out on the Layout Page The ‘Layout’ toolbar allows you to control the view and scale of the layout.
The ‘Zoom to 100%’ tool enables you to display the actual print size of the layout. The ‘Pan’ tool allows you to move around at the same scale. The ‘Zoom to Whole Page’ tool returns the screen to a view of the entire layout.
9.4. Selecting and Scaling the Map Area in the Data Frame a) Selecting a Specific Map Area in the Data Frame To change the map view in the data frame, you can use the zoom and pan tools in the ‘Tools’ toolbar to zoom in and out and move around the map. b) Scaling your Map in the Data
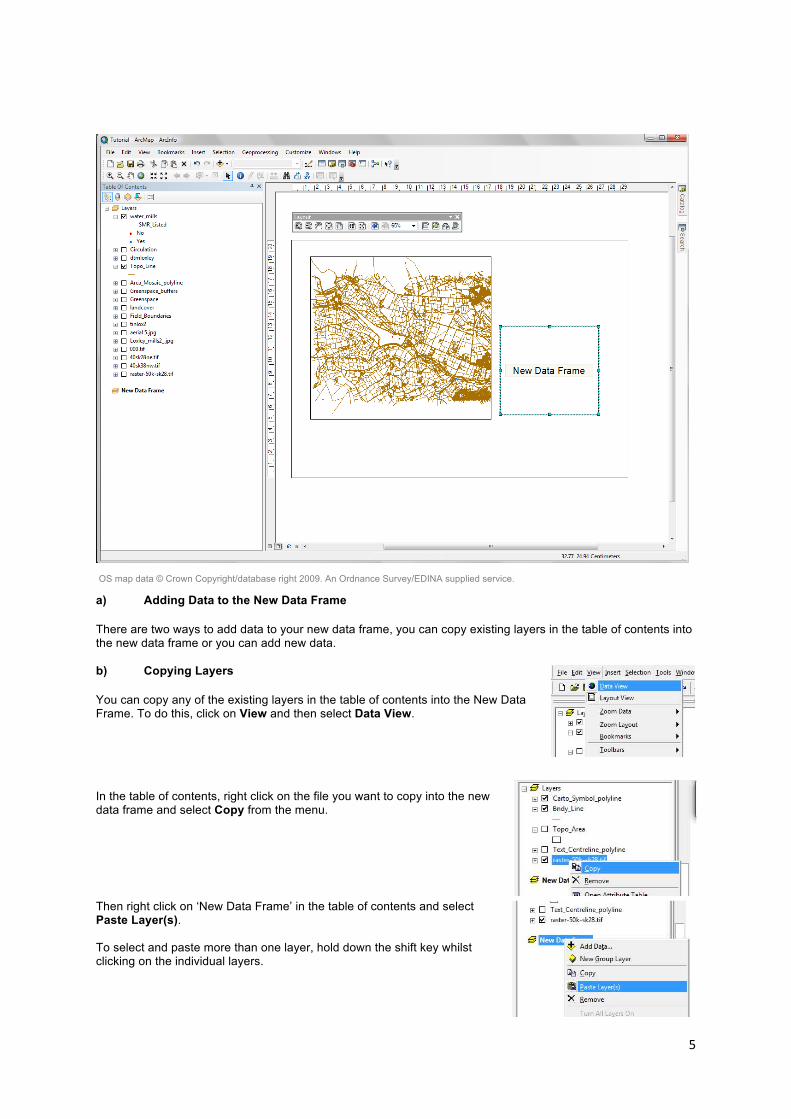
Frame Once you have selected the area you want to be displayed in your data frame, you can also define a scale for the map to be displayed at. To do this, make sure the data frame has been selected with the ‘Select Elements’ tool from the ‘Tools’ toolbar. The data frame will be surrounded by a blue selection box. Then, type a new scale in the scale window, or select a scale from the drop down menu. Press ‘enter’ on the keyboard when you have typed your new scale. The map in the data frame will resize accordingly. You might need to use the zoom and pan tools in the ‘Tools’ toolbar to readjust the map area that is displayed in the data frame. It is possible to add more than one data frame to a layout. 9.5. Creating a New Data Frame in a Layout Sometimes you will want to have more than one map view (or data frame) on a layout. *Important: Note that it is not functionally possible to create or save multiple layout plans in the same ArcMap project. It is only possible to create multiple data frames, but each data frame will appear on the same layout. To add another data frame, click on Insert, then select Data Frame. A new data frame will appear in the layout and will also be listed in the table of contents ‘New Data Frame’.
OS map data © Crown Copyright/database right 2011. An Ordnance Survey/EDINA supplied service.
5
a) Adding Data to the New Data Frame
There are two ways to add data to your new data frame, you can copy existing layers in the table of contents into the new data frame or you can add new data. b) Copying Layers
You can copy any of the existing layers in the table of contents into the New Data Frame. To do this, click on View and then select Data View. In the table of contents, right click on the file you want to copy into the new data frame and select Copy from the menu. Then right click on ‘New Data Frame’ in the table of contents and select Paste Layer(s). To select and paste more than one layer, hold down the shift key whilst clicking on the individual layers.
OS map data © Crown Copyright/database right 2009. An Ordnance Survey/EDINA supplied service.
6
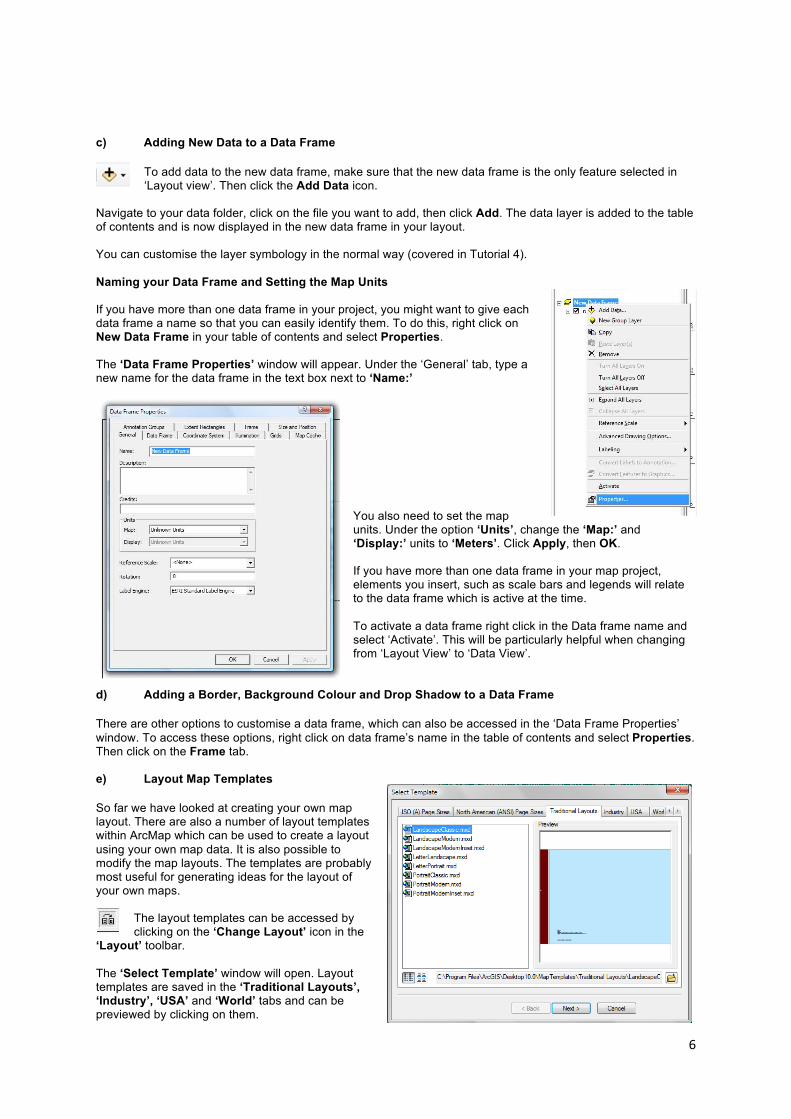
c) Adding New Data to a Data Frame
To add data to the new data frame, make sure that the new data frame is the only feature selected in ‘Layout view’. Then click the Add Data icon.
Navigate to your data folder, click on the file you want to add, then click Add. The data layer is added to the table of contents and is now displayed in the new data frame in your layout. You can customise the layer symbology in the normal way (covered in Tutorial 4). Naming your Data Frame and Setting the Map Units If you have more than one data frame in your project, you might want to give each data frame a name so that you can easily identify them. To do this, right click on New Data Frame in your table of contents and select Properties. The ‘Data Frame Properties’ window will appear. Under the ‘General’ tab, type a new name for the data frame in the text box next to ‘Name:’
You also need to set the map units. Under the option ‘Units’, change the ‘Map:’ and ‘Display:’ units to ‘Meters’. Click Apply, then OK. If you have more than one data frame in your map project, elements you insert, such as scale bars and legends will relate to the data frame which is active at the time. To activate a data frame right click in the Data frame name and select ‘Activate’. This will be particularly helpful when changing from ‘Layout View’ to ‘Data View’.
d) Adding a Border, Background Colour and Drop Shadow to a Data Frame
There are other options to customise a data frame, which can also be accessed in the ‘Data Frame Properties’ window. To access these options, right click on data frame’s name in the table of contents and select Properties. Then click on the Frame tab. e) Layout Map Templates
So far we have looked at creating your own map layout. There are also a number of layout templates within ArcMap which can be used to create a layout using your own map data. It is also possible to modify the map layouts. The templates are probably most useful for generating ideas for the layout of your own maps.
The layout templates can be accessed by clicking on the ‘Change Layout’ icon in the
‘Layout’ toolbar. The ‘Select Template’ window will open. Layout templates are saved in the ‘Traditional Layouts’, ‘Industry’, ‘USA’ and ‘World’ tabs and can be previewed by clicking on them.

7
9.6. Creating a Mask
If you want to show only whatever is within your boundary, i.e. hide everything outside the site boundary; you need to create a polygon feature that will work as a “mask”. These are the steps to follow:
-You need a “polygon” shapefile, which is the site area, or boundary, name it boundary. Add it your .mxd map.
-Zoom out your map at least the double of your site boundary so you could have a bigger mask.
-Using your “editor” toolbar start an editing session, make sure your target layer is “boundary”. Then “create a new feature or feature template” as required.
-Using the “pencil” tool draw a large box around the map, covering the entire map. In the attribute table of “boundary” you should have 2 polygons (the site and a big coloured box covering the map). Save your edits and stop editing.
-Now open “Arc toolbox” this icon is a red “toolbox”. This will open a menu, from this menu double click on Analysis tools, another menu will expand, then double click “overlay” and then double click “Union”. Here we are going to create a shapefile that “joins” the two features in “boundary” (the site and a big coloured box) creating a new layer.
-In the “union” window that opens, set:
“Input Features” = “boundary” In the “output feature class” window select where to save it (U: driver) and rename it as “mask” instead of “boundary_union.shp” which is the default name. Click OK and add your new layer: “mask” to the map.
-Turf off your other layers and keep “mask” on. You will see the site and the box surrounding it.
-Now select the polygon that contains your site-boundary. When selected, start an “editing session” and make sure your “target” layer is “mask”, and then delete your “site-boundary” polygon, so you will only see the box, and your site-boundary will be missing, like a hole. This is your “mask area”. Save your editing and then stop editing.
-Make sure that “mask” layer is on the top of all the layers in the “table of contents” and change its colour to white. Turn on all the layers and you will be able to see everything inside your boundary and the box will cover everything outside.
-Finally you can chose what layers will be hidden from your mask and which not. Right click on “Layer” (in the table of contents) and from the menu select: “advance drawing options”, it will open a window, then in the left column select which layer is your mask, in this case is “mask” and in the right column select which layers will be covered by your mask.