tusome revised baseline study - united states …pdf.usaid.gov/pdf_docs/pa00mr51.pdf · tusome ....
TRANSCRIPT

TUSOME REVISED BASELINE STUDY
October 2015 (Revised January 2016) This study is made possible through the support of Management Systems International (MSI). The contents of this
study are the sole responsibility of MSI and do not necessarily reflect the views of USAID or the U.S. Government.

TUSOME REVISED BASELINE STUDY
OCTOBER 5, 2015 (REVISED JANUARY 25, 2016)
Originally contracted under No. AID-623-I-12-00001 (Task Order No. AID-623-TO-14-00004) Kenya Support Program (KSP)
Implemented by Management Systems International
Cover Photo: Research Solutions Africa (RSA) Kenya
DISCLAIMER
This study is made possible through the support of Management Systems International (MSI). The
contents of this study are the sole responsibility of MSI and do not necessarily reflect the views of USAID
or the U.S. Government.

TUSOME REVISED BASELINE STUDY i
CONTENTS
Executive Summary ........................................................................................................................ 1
Overview ................................................................................................................................................................. 1 Research Questions .............................................................................................................................................. 2 Methodology ........................................................................................................................................................... 2
Tool and Surveys ................................................................................................................................................................. 2 Validity ................................................................................................................................................................................. 3 Sampling ................................................................................................................................................................................ 3 Data Collection .................................................................................................................................................................... 3 Data Analysis ....................................................................................................................................................................... 4 Test Reliability ...................................................................................................................................................................... 4
Findings ..................................................................................................................................................................... 4 Reading Levels ..................................................................................................................................................................... 5 Reading at Grade Level ..................................................................................................................................................... 7 Factors Associated with Reading .................................................................................................................................... 8
Main Report .................................................................................................................................... 10
Introduction .......................................................................................................................................................... 10 Background ............................................................................................................................................................ 10 Methodology ......................................................................................................................................................... 11
Tool and Surveys .............................................................................................................................................................. 11 Test Validity ....................................................................................................................................................................... 12 Sampling Procedures....................................................................................................................................................... 13 Data Collection ................................................................................................................................................................. 14 Data Analysis .................................................................................................................................................................... 15 Test Reliability ................................................................................................................................................................... 15 Subtask Quality and Reliability..................................................................................................................................... 15 Actual Sample ................................................................................................................................................................... 17
Findings ................................................................................................................................................................... 18 Question 1: What are the levels of pupils on the reading subtasks? ............................................................... 19 Question 2: What proportion of pupils can read grade-level text? ................................................................... 23 Question 3: What factors are associated with reading outcomes? ................................................................... 26
Conclusions ........................................................................................................................................................... 34 Methodology ...................................................................................................................................................................... 34 Findings .............................................................................................................................................................................. 35
Recommendations ............................................................................................................................................... 36
Annexes .......................................................................................................................................... 39
Annex 1: Activity Work Plan ............................................................................................................................ 39 Annex 2: Descriptions of the English and Kiswahili Subtasks ................................................................... 42 Annex 3: Modifications to the English and Kiswahili Subtasks .................................................................. 43 Annex 4: Psychometric Analyses ..................................................................................................................... 44 Annex 5: Sampled Counties .............................................................................................................................. 49 Annex 6: Histograms of Fluency Scores ........................................................................................................ 50
TUSOME REVISED BASELINE STUDY ii
TABLES AND FIGURES
Table 1. English and Kiswahili Subtasks ........................................................................................................................ 2
Table 2. English Class 1 Reading Scores ....................................................................................................................... 5
Table 3. English Class 2 Reading Scores ....................................................................................................................... 6
Table 4. Kiswahili Class 1 Reading Scores ................................................................................................................... 7
Table 5. Kiswahili Class 2 Reading Scores ................................................................................................................... 7
Table 6. Draft ORF Performance Categories by Language ..................................................................................... 7
Table 7. Percentage of English ORF Scores by Performance Category ............................................................... 8
Table 8. Percentage of Kiswahili ORF Scores by Performance Category ............................................................ 8
Table 9. English and Kiswahili Subtasks and Score Ranges .................................................................................... 12
Table 10. Sampling Stages and Targets ....................................................................................................................... 14
Table 11. English and Kiswahili Test Reliabilities by Grade ................................................................................... 15
Table 12. English Subtask-Total Correlations and Alpha Coefficients ................................................................ 16
Table 13. Kiswahili Subtask-Total Correlations and Alpha Coefficients ............................................................ 16
Table 14. Pupil Sample by Class and Gender ............................................................................................................ 17
Table 15. Teacher and Head Teacher Samples by Class and Gender ................................................................ 18
Table 16. School, Pupil, Teacher, and Head Teacher Samples by (Former) Province .................................... 18
Table 17. English Reading Scores by Class................................................................................................................. 20
Table 18. English Class 1 Reading Scores................................................................................................................... 20
Table 19. English Class 2 Reading Scores................................................................................................................... 21
Table 20. English Reading Accuracy Rates by Class ................................................................................................ 21
Table 21. Kiswahili Reading Scores by Class ............................................................................................................. 22
Table 22. Kiswahili Class 1 Reading Scores ............................................................................................................... 22
Table 23. Kiswahili Class 2 Reading Scores ............................................................................................................... 23
Table 24. Kiswahili Reading Accuracy Rates by Class ............................................................................................. 23
Table 25. Draft ORF Performance Categories for English and Kiswahili ........................................................... 23
Table 26. English ORF Scores by Performance Category and Class ................................................................... 24
Table 27. English ORF Scores by Performance Category, Class, and School Type ......................................... 25
Table 28. English ORF Scores by Performance Category, Class, and Gender ................................................. 25
Table 29. Kiswahili ORF Scores by Performance Category and Class ............................................................... 25
Table 30. Kiswahili ORF Scores by Performance Category, Class, and School Type ..................................... 26
Table 31. Kiswahili ORF Scores by Performance Category, Class, and Gender .............................................. 26
Table 32. Pupil Characteristics ..................................................................................................................................... 27
Table 33. Pupil Reading and Materials......................................................................................................................... 28
Table 34. Pupil-School Characteristics ....................................................................................................................... 28
Table 35. Teacher Characteristics ............................................................................................................................... 29
Table 36. Teacher Reading Materials and Instruction ............................................................................................. 30
Table 37. Teacher-School Characteristics ................................................................................................................. 32
Table 38. Head Teacher Characteristics .................................................................................................................... 32
Table 39. Head Teacher Training and Instructional Supervision .......................................................................... 33
TUSOME REVISED BASELINE STUDY iii
Table 40. Head Teacher-School Characteristics ...................................................................................................... 34
Table 41. English Class 1 Correlation Coefficients ................................................................................................. 44
Table 42. English Class 2 Correlation Coefficients ................................................................................................. 45
Table 43. English Phoneme Segmentation Item Statistics ...................................................................................... 45
Table 44. English Vocabulary Item Statistics.............................................................................................................. 46
Table 45. English Reading Comprehension Item Statistics .................................................................................... 46
Table 46. Kiswahili Class 1 Correlation Coefficients .............................................................................................. 47
Table 47. Kiswahili Class 2 Correlation Coefficients .............................................................................................. 47
Table 48. Kiswahili Reading Comprehension Item Statistics ................................................................................. 48
Table 49. Kiswahili Listening Comprehension Item Statistics ............................................................................... 48
Table 50. School, Pupil, Teacher, and Head Teacher Samples by County ......................................................... 49
Figure 1. English Passage Reading (A) ......................................................................................................................... 50
Figure 2. English Passage Reading (B) .......................................................................................................................... 51
Figure 3. Kiswahili Passage Reading ............................................................................................................................. 51
TUSOME REVISED BASELINE STUDY iv
ACRONYMS & ABBREVIATIONS
APBET Alternative Provision of Basic Education and Training
CWPM Correct Words per Minute
DFID UK Department for International Development
EGR Early Grade Reading
EGRA Early Grade Reading Assessment
FO Field Office
GOK Government of Kenya
HO Home Office
IT Information Technology
IRR Inter-Rater Reliability
KNEC Kenya National Examinations Council
MDE Minimum Detectable Effects
MOEST Ministry of Education, Science and Technology
MSI Management Systems International
MT Master Trainer
NER Net Enrollment Rate
ORF Oral Reading Fluency
P1 Certificate in Primary Teacher Education
PM Project Manager
PTA Parent-Teacher Association
PRIMR Primary Math and Reading
QCO Quality Control Officer
RFQ Request for Quotes
RSA Research Solutions Africa
RTI RTI International
S1 Diploma in Education
SACMEQ Southern Africa Consortium for Monitoring Educational Quality
SAGA Semi-Autonomous Government Agencies
SES Socio-Economic Status
TAC Teacher Advisory Centre
TOR Terms of Reference
TSC Teacher Service Commission
Tusome “Let’s Read” in Kiswahili
USAID U.S. Agency for International Development
Uwezo “Capability” in Kiswahili

TUSOME REVISED BASELINE STUDY v
ACKNOWLEDGEMENTS
The Management Systems International (MSI) team would like to thank the officials at the Kenyan Ministry
of Education, Science, and Technology for their support and encouragement during the revised early
grade reading assessment (EGRA) baseline. This includes people from the central level, counties, districts,
teacher advisory centres, and schools.
In addition, we would like to thank the officials at the U.S. Agency for International Development (USAID)
who approved the operationalization of the revised baseline and provided support throughout the
process.
We would also like to thank our colleagues at RTI International, who collaborated in supplying assessment
tools, school lists, enumerator lists, and other information.
Finally, we would like to thank our colleagues at Research Solutions Africa (RSA) Kenya who implemented
the EGRA and surveys in the field.
We hope that the results will provide beneficial information to the MOEST, USAID, the Tusome project,
and especially to the head teachers, teachers, and pupils of Kenya.
The MSI Team:
Assessment Specialist (international)
Assessment Coordinator (national)
Reading Specialist (national)
Psychometricians (international)
Statistician (international)
Master Trainers (national)
Quality Control Officers (national)
IT Specialists (international)
Project Managers (international)
Project Associates (national)

TUSOME REVISED BASELINE STUDY 1
EXECUTIVE SUMMARY
Overview
The Tusome Early Grade Reading Program (“Tusome”) is a national effort to scale up a proven model for
improving early grade literacy. Based on positive findings from a rigorous impact evaluation of the three-
year (2011-2014) Primary Math and Reading (PRIMR) pilot, the Government of Kenya (GOK) asked
USAID/Kenya and DFID/Kenya to support a nationwide rollout to improve reading skills and increase the
capacity of the GOK to deliver early grade reading (EGR) services. The two donor agencies awarded
$53.8 million to an implementing partner, RTI International, for the four-year (2014-2018) program.
Tusome, which means “Let’s Read” in Kiswahili, is designed to improve the reading outcomes of 5.4
million pupils in Classes 1 and 2. It is targeting 23,000 public and APBET (Alternative Provision of Basic
Education and Training) schools by providing them with textbooks and reading materials. More than
50,000 teachers will receive training on improved methods for teaching reading. Other beneficiaries will
include 23,000 head teachers, 1,099 Teacher Advisory Centre (TAC) tutors, and 300 senior education
personnel. Under this initiative, the plan is to fully transition implementation of the EGR activities by its
fourth year to the Ministry of Education, Science, and Technology (MOEST) via government-to-
government mechanisms and technical assistance, though the transition timeline is dependent on the
MOEST’s absorption of the EGR activities. Tusome will assist the GOK at the technical and policy levels
to sustain improved reading skills beyond the span of the activity.
The purpose of the baseline study is to establish initial values on program outcome measures that will be
reassessed during and at the end of the Tusome activity period. The baseline study is the first part of a
non-experimental cross-sectional study to determine whether results at scale are comparable to those
found during the pilot activity. This approach includes a sample-based assessment of the reading skills of
Class 1 and 2 pupils at baseline (pre-test) and midline/endline (post-tests) using the Early Grade Reading
Assessment (EGRA). Comparing the pre- and post-test reading outcomes will allow the MOEST, USAID,
and DFID to examine the impact of the Tusome program on a national basis. In addition, the baseline
includes a short pupil survey, a teacher questionnaire, and a head teacher questionnaire that will be used
to examine pupil-, teacher-, and school-related factors associated with reading scores.
The baseline was originally conducted in March 2014. However, issues with the test administration caused
problems with some of the data. Management Systems International (MSI), the evaluation partner that led
the baseline, requested USAID to allow for the recollection of the baseline data. Following a period of
planning, tool trans-adaptation, piloting, training, electronic application development, and government
approvals and validation, the revised baseline data were collected in July 2015.
It is important to note that the revised baseline took place after the interventions had started for the
Class 1 pupils in the 2015 school year. The activities for Class 1 included the following: 1) launch by
President Kenyatta in January 2015; 2) sensitizations in early 2015; 3) training of TAC tutors (to support
Classes 1 and 2); 4) training of head teachers; 5) training of teachers in reading methodologies; and 6)
distribution of reading materials to all schools. The Class 2 interventions had not yet started at the time
of baseline data collection. Following the submission of this report, there will be discussions between
USAID, MOEST, RTI, and MSI on making adjustments to the Class 1 (and Class 2, if appropriate) scores
to compensate for the lateness in the baseline data collection relative to the start of the interventions.
All information provided in this executive summary is explained in more detail in the main report.

TUSOME REVISED BASELINE STUDY 2
Research Questions
The three research questions addressed by this baseline study (and future evaluations) are the following:
1. What are the levels of Classes 1 and 2 pupils on reading subtasks?
2. What proportions of Classes 1 and 2 pupils can read grade-level text?
3. What pupil-, teacher-, and school-related factors are associated with reading outcomes?
Methodology
The methodology consisted of developing the EGRA tool and surveys, establishing the validity of the tool,
sampling the counties and schools, administering the tool and surveys, analyzing the data, and examining
the reliability of the tool, and writing the report. These steps are briefly described below.
Tool and Surveys
In consultation with the MOEST, the MSI team developed a version of EGRA with 14 subtasks, including
eight in English and six in Kiswahili (Table 1). The tool was similar to the version used by RTI for the
DFID PRIMR endline in October 2014. The subtasks are listed below.
Table 1. English and Kiswahili Subtasks
Subtask English Kiswahili
Phoneme segmentation (untimed) X
Letter sound knowledge (timed) X X
Syllable fluency (timed) X
Invented/non-word decoding (timed) X X
Vocabulary (untimed) X
Passage reading (A) (timed) X X
Reading comprehension (A) (untimed) X X
Passage reading (B) (timed) X
Reading comprehension (B) (untimed) X
Listening comprehension (untimed) X
At the request of the MOEST, MSI expanded the passage reading and reading comprehension subtasks in
English to include two sets of passages and comprehension subtasks. With the first set of subtasks, the
pupils read the passage orally and then answered the comprehension questions without referring back to
the passage. With the second set, the pupils read the passage orally, read it again silently, and then
referred back to the passage when answering the comprehension questions. The MOEST’s rationale was
that both sets of passages and comprehension subtasks reflected Tusome instructional strategies but
measured different reading skills.
Indicated in the table for each subtask is whether it was untimed or timed. For the untimed tasks, the
pupils were presented with a series of items, such as identifying vocabulary words or answering
comprehension questions, and provided with a reasonable amount of time to complete the subtask. For
the timed tasks, the pupils were given one minute to perform a subtask such as naming letter sounds or
orally reading a passage. (See Annex 2: English and Kiswahili Subtasks for descriptions of the subtasks.)

TUSOME REVISED BASELINE STUDY 3
In addition to the EGRA tool, surveys were prepared for pupils, teachers, and head teachers in order to
gather contextual information for simultaneous analysis with the reading data.
Validity
Validity of the EGRA tool was assured through close collaboration between the MOEST and MSI in the
test development process, which included Tusome objectives review, model test selection, a test
development workshop, pilot testing, test revision, and a test validation workshop. The MSI
psychometricians, the assessment specialist, and a local reading expert led and/or participated in these
activities. The process was critical in creating a version of EGRA that measured reading skills, in English
and Kiswahili, in the Kenyan context. The test also complied with USAID requirements for setting a
baseline that would allow for measuring progress towards the global Goal 1 indicator. (See Annex 3:
Modifications to the English and Kiswahili Subtasks for a detail on the changes that were made to the
subtasks based on the MOEST inputs and the piloting results.)
Sampling
Through discussions with USAID, MOEST, and RTI, the MSI team created the sampling frameworks and
set up the design for the national sample. Using a three-stage cluster sampling procedure from a sampling
frame of 22,154 public schools and 1,000 APBET (Alternative Provision of Basic Education and Training)
schools, the MSI statistician drew a random sample of 1) 26 (out of 47) counties covering all eight of the
(former) provinces; 2) 204 schools comprised of 174 public and 30 APBET schools; and 3) 24 pupils per
school, with 12 (6 boys and 6 girls) pupils in each of Classes 1 and 2. This resulted in a target of 4,896
total pupils comprised of 2,448 boys and 2,448 girls in the two classes for the EGRA. The Classes 1 and 2
teachers (one per class) and the head teacher were also targeted for surveys from each school.
The actual numbers of schools and pupils were close to the target numbers. All 204 schools were reached
during data collection. A total of 4,866 pupils were tested (99 percent of the target), along with surveys
for 384 teachers (94 percent of the target) and 199 head teachers (98 percent of the target). A minimum
of 15 and a maximum of 37 schools were sampled from each of the eight (former) provinces, depending
on the number of counties, schools, and pupils in each province. The largest number of assessed pupils
was in the Rift Valley province (909) and the smallest number in the North Eastern (348) province. At
least five schools were sampled from each of the 26 counties. (See Annex 4: Sampled Counties for the
counties and the schools, pupils, teachers, and head teachers per county.)
Prior to the data analysis, the MSI statistician applied sampling weights to the EGRA and survey data so
that the data sets would be nationally representative.
Data Collection
MSI information technology (IT) specialists adapted an electronic data collection application that they had
developed internally for another USAID-funded project. With support from a team of MSI-hired quality
control officers (QCOs), the MSI specialists loaded the application and its content on tablets purchased in
Nairobi. The data collection system, tools, and surveys were piloted in Kenyan schools, and revisions
were made prior to the operational (full) test administration. The MOEST approved these revisions in a
validation workshop organized by MSI.
MSI selected a local subcontractor, Research Solutions Africa (RSA), to administer the tools and surveys.
With guidance and approval from MSI, RSA used a list provided by RTI to recruit their supervisors and
enumerators. The MSI assessment specialist, assessment coordinator, and QCOs provided extensive
training to the RSA teams so that the tests and surveys would be administered according to international
standards of quality. There were ample sessions during the training – including role-playing between

TUSOME REVISED BASELINE STUDY 4
enumerators and practice testing of pupils by enumerators in schools – devoted to checking the accuracy
of the test administration and making immediate corrections so that all enumerators and supervisors
reached a standard of agreement with scoring by the experts in videos.
The team considered the possibility of conducting an inter-rater reliability (IRR) in during the operational
data collection, but this was not implemented due to three factors: 1) MSI was still in the process of
developing IRR methods based on new USAID guidelines; 2) the MSI team was confident of accurate
administration of the tools and surveys due to the extensive training; 3) the vast majority of the
enumerators had previously administered EGRA multiple times under the PRIMR pilot. The data analyses
(below) showed that the test reliability was high, indicating consistent data collection by the enumerators.
In order to ensure efficiency during the fieldwork, the MOEST approved advance visits by the QCOs. This
approval was communicated to the county education offices. The QCOs visited all of the sampled
counties to inform the county education officials about the process, solicit their cooperation, and discuss
any issues. These visits also allowed the QCOs to share the list of sampled schools and verify that 1) the
schools existed; 2) there were sufficient numbers of pupils in the schools for adequately meeting the
targets in the sampling design, and 3) the schools were in areas with minimal or no security concerns.
A total of 12 QCOs, 23 supervisors, and 72 enumerators working in 23 teams conducted the data
collection in the schools over the three weeks from 13 to 29 July 2015, i.e., near the end of the second
term of the academic year. As mentioned above, some of the Tusome activities, particularly with Class 1,
had started by this time. (See Annex 1: Activity Work Plan for a detailed list of the activities and dates.)
Data Analysis
The MSI assessment specialist, IT specialist, statistician, and psychometricians conducted daily monitoring
of the data, both in Kenya and the U.S., by accessing the data in real time as they were collected and
uploaded from the tablets to a cloud server. In addition, the numbers of pupils, teachers, head teachers,
and schools were confirmed through daily calls between the QCOs in the field and the project associates
in Nairobi. This process improved quality control and reduced the need for data cleaning.
The MSI statistician analyzed the data using Stata statistical software, with quality assurance by the MSI
psychometricians. Tables were created in Excel for this technical report. (See Annex 3: Psychometric
Analyses for more information on subtask correlations and item statistics.)
Test Reliability
The main indicator of reliability for psychometric tests is Cronbach’s alpha, or the alpha coefficient, which
estimates the internal consistency reliability of a test for a particular administration. The range for the
alpha coefficient is 0.00 to 1.00, with higher values indicating better (or more desirable) reliability. Values
of 0.80 and above are considered acceptable for these types of tests. MSI calculated the alpha coefficient
separately for each language and grade level using percent correct scores. For English, the values were
0.92 for Class 1 and 0.92 for Class 2. For Kiswahili, the values were 0.89 for Class 1 and 0.90 for Class 2.
These values indicate strong reliability, especially considering that estimates are generally lower with a
relatively small number of subtasks, i.e., with eight subtasks in English and six in Kiswahili.
Findings
Using the methodology described above, a baseline was set for each research question. A summary of the
baseline findings is presented below. The MSI statistician calculated both descriptive and inferential
statistics for the pupil data, and descriptive statistics for the teacher, head teacher, and school data.

TUSOME REVISED BASELINE STUDY 5
For the pupil data, the main descriptive statistics were average raw scores, or the average number of
correct responses. For the timed tasks, an adjustment was made so that the average number of correct
responses was adjusted for any time that a pupil had remaining before the end of one minute; these were
also called fluency scores. Accuracy rates, or the average number correct out of the number attempted,
were also calculated for the timed tasks. The inferential statistics (t-tests) were run on the pupils’ scores
disaggregated by group variables, e.g., school type and gender, to statistically compare those results. The
statistical significance level was set at p < .05, which was used in the power calculations and is a typical
significance level given the sample sizes of the groups.1 In the tables, statistically significant findings were
indicated with an asterisk next to the average score of the higher performing group.
For the teacher, head teacher, and school data, descriptive statistics were presented percentages of
respondents by category and the associated pupils’ oral reading fluency (ORF) scores for the participants
(i.e., the teachers or head teachers). Inferential statistics were not reported due to small sample sizes of
the teacher, head teacher, and school categories. Additional statistics are available in the main report.
Reading Levels
English
Tables 2 and 3 show the pupils’ reading levels on the English subtasks by class. The overall scores for each
subtask were disaggregated by type of school (public and APBET) and gender (male and female).
The scores for the pupils were generally higher for Class 2 than Class 1, for APBET schools than public
schools, and for females than males. For instance, the ORF scores were about 14 CWPM higher for Class
2 than Class 1, about 17 CWPM (in Class 1) and 37 CWPM (in Class 2) higher for APBET than public, and
about 3 CWPM (in Class 1) and 4 CWPM (in Class 2) higher for females than males. The pupils had
higher scores in Class 1 than Class 2 in phoneme segmentation and letter sound knowledge. This was
likely due to the timing of the revised baseline data collection, which, as mentioned above, took place
after the initial interventions had started in Class 1.
Even though scores were higher in Class 2 than Class 1, the scores were low on many of the subtasks in
both grade levels. Class 1 pupils were able to answer correctly only about 1 out of 10 phoneme
segmentation items, 16 out of 100 letter sounds, 6 out of 50 non-words, 6 out of 20 vocabulary words,
and less than 1/2 out of 5 comprehension questions. Class 2 pupils were only able to answer about 1 out
of 10 phoneme segmentation items, 11 out of 100 letter sounds, 11 out of 50 non-words, and 9 out of 20
vocabulary words, and less than 1 out of 5 comprehension questions.
Note that the scores by pupils in the public schools had a much greater effect on the overall scores than
those by pupils in the APBET schools. This was due to the much higher sample size of the public schools.
For instance, in Class 1, the overall letter sound knowledge score was 15.8, while the score for public
schools was 15.3 (a small difference of 0.5 from the overall score) and the score for the APBET schools
was 31.7 (a large difference of 15.9 from the overall score).
Table 2. English Class 1 Reading Scores
Subtask Overall School Type Gender
Public APBET Male Female
Phoneme segmentation 1.3 1.2 4.4 * 1.2 1.4
Letter sound knowledge 15.8 15.3 31.7 * 14.8 16.8 *
1 Thompson, B. (1994). The concept of statistical significance testing. Practical Assessment, Research & Evaluation, 4(5).

TUSOME REVISED BASELINE STUDY 6
Table 2. English Class 1 Reading Scores
Subtask Overall School Type Gender
Public APBET Male Female
Invented/non-word decoding 6.3 5.9 16.6 * 5.7 6.8 *
Vocabulary 6.2 6.0 11.8 * 6.2 6.1
Passage reading (A) 11.9 11.1 38.0 * 10.7 13.2 *
Reading comprehension (A) 0.3 0.2 1.5 * 0.2 0.3
Passage reading (B) 11.0 10.2 35.1 * 9.8 12.1 *
Reading comprehension (B) 0.3 0.2 1.7 * 0.2 0.3
Table 3. English Class 2 Reading Scores
Subtask Overall School Type Gender
Public APBET Male Female
Phoneme segmentation 0.7 0.6 3.0 * 0.7 0.7
Letter sound knowledge 10.7 10.3 23.8 * 10.1 11.4
Invented/non-word decoding 11.2 10.8 24.6 * 10.4 11.9 *
Vocabulary 8.6 8.4 14.5 * 8.5 8.6
Passage reading (A) 25.8 24.7 61.9 * 23.7 28.0 *
Reading comprehension (A) 0.6 0.5 2.8 * 0.6 0.6
Passage reading (B) 23.8 22.8 58.2 * 22.1 25.6 *
Reading comprehension (B) 0.7 0.6 3.4 * 0.7 0.7
Kiswahili
Tables 4 and 5 show the pupils’ reading levels on the Kiswahili subtasks by class. The overall scores for
each subtask were disaggregated by type of school and gender.
The scores for the pupils in Kiswahili were generally higher for Class 2 than Class 1, for APBET schools
than public schools, and for girls than boys. However, the differences were about half as large as they
were in English. For instance, the ORF scores were about 9 CWPM higher for Class 2 than Class 1, about
10 CWPM (in Class 1) and 15 CWPM (in Class 2) higher for APBET than public, and about 1 CWPM (in
Class 1) and 2 CWPM (in Class 2) higher for girls than boys. The pupils had slightly higher scores in Class
1 than Class 2 in letter sound knowledge. This was likely due to the timing of the revised baseline data
collection, which, as mentioned above, took place after the initial interventions had started in Class 1.
Even though scores were higher in Class 2 than Class 1, the scores were low on many of the subtasks in
both grade levels. Class 1 pupils were only able to answer correctly about 1 out of 10 phoneme
segmentation items, 18 out of 100 letter sounds, 12 out of 100 syllables, 5 out of 50 non-words, 1/2 out
of 5 reading comprehension questions, and 1 out of 5 listening comprehension questions. Class 2 pupils
were only able to answer about 17 out of 100 letter sounds, 22 out of 100 syllables, 11 out of 50 non-
words, 1 out of 5 reading comprehension questions, and 2 out of 5 listening comprehension questions.

TUSOME REVISED BASELINE STUDY 7
Table 4. Kiswahili Class 1 Reading Scores
Subtask Overall School Type Gender
Public APBET Male Female
Letter sound knowledge 17.7 17.0 39.2 * 16.2 19.1 *
Syllable fluency 11.9 11.3 30.8 * 11.0 12.9 *
Invented/non-word decoding 5.1 4.9 13.4 * 4.7 5.6 *
Passage reading 5.4 5.1 15.7 * 4.7 6.1 *
Reading comprehension 0.4 0.4 1.4 * 0.4 0.4
Listening comprehension 1.3 1.3 2.5 * 1.3 1.3
Table 5. Kiswahili Class 2 Reading Scores
Subtask Overall School Type Gender
Public APBET Male Female
Letter sound knowledge 17.4 16.7 40.4 * 16.3 18.6 *
Syllable fluency 22.1 21.5 41.4 * 20.3 23.9 *
Invented/non-word decoding 10.9 10.6 21.7 * 10.0 11.8 *
Passage reading 14.3 13.9 29.6 * 13.2 15.5 *
Reading comprehension 1.1 1.1 2.6 * 1.1 1.2
Listening comprehension 2.0 1.9 3.2 * 2.0 1.9
As with English, note that the scores by pupils in the public schools had a much greater effect on the
overall scores than those by pupils in the APBET schools. This was due to the much higher sample size of
the public schools. For instance, in Class 1, the overall letter sound knowledge score was 17.7, while the
score for public schools was 17.0 (a small difference of 0.7 from the overall score) and the score for the
APBET schools was 39.2 (a large difference of 21.5 from the overall score).
Reading at Grade Level
During the PRIMR pilot, RTI and MOEST established draft benchmarks for passage reading (or ORF), in
English and Kiswahili, expressed in CWPM. The benchmarks were set with three cut-scores – beginning,
emergent, and fluent – which were then used for placing each pupil’s performance into one of four
reading categories – zero, beginning, emergent, and fluent (Table 6).
Table 6. Draft ORF Performance Categories by Language
Category English CWPM Kiswahili CWPM
Zero reader 0 0
Beginning reader 1-29 1-16
Emergent reader 30-64 17-44
Fluent reader 65+ 45+
The fluency benchmarks were used to determine whether pupils were reading at grade level, i.e., whether
they could read a grade level text with fluency. The benchmarks were higher for English than for

TUSOME REVISED BASELINE STUDY 8
Kiswahili, with the English fluency benchmark set at 65 CWPM and the Kiswahili fluency benchmark at 45
CWPM. Although the benchmarks differed by language, they were the same for all pupils regardless of
whether they were in Class 1 or 2.
The ORF scores from the English passage A and the Kiswahili passage were used to determine the
percentages of pupil scores by performance category. As seen in Tables 7 and 8, the percentages varied
by class and language.
First, the percentage of pupils in Class 1 who could not read a single word correctly (i.e., the zero or non-
readers) was about 50 percent in English and 68 per cent in Kiswahili. These percentages were lower in
Class 2, with about 36 percent of non-reading pupils in English and 41 percent in Kiswahili.
Second, only about 3 percent of the Class 1 pupils were fluent in English reading and about 1 percent in
Kiswahili. This was higher at Class 2, with about 14 percent of pupils reading fluently in English and 5
percent in Kiswahili.
Third, it is possible to combine the emergent and fluent categories into a passing, or proficient, category.
For this combined categories, the percentages of pupils at the proficient/passing level in English were
about 14 percent in Class 1 and 37 percent in Class 2. The percentages in Kiswahili were about 14
percent in Class 1 and 40 percent in Class 2. Note that these percentages are either the same or higher in
Kiswahili than in English, but the Kiswahili cut-scores are lower.
Table 7. Percentage of English ORF Scores by Performance Category
Class Zero Beginning Emergent Fluent
1 50.3% 35.6% 11.2% 2.9%
2 35.8% 27.6% 23.1% 13.5%
Table 8. Percentage of Kiswahili ORF Scores by Performance Category
Class Zero Beginning Emergent Fluent
1 67.6% 18.2% 13.4% 0.8%
2 41.3% 18.9% 35.0% 4.8%
The percentages of pupils in each category by class and language disaggregated by school type and gender
are provided in the main report. (See Annex 5: Histograms of Fluency Scores for the ORF score
distributions for the two English passages and the one Kiswahili passage.)
Factors Associated with Reading
In addition to the EGRA data, the enumerators collected survey data from pupils, teachers, and head
teachers. The pupil questionnaire had a basic information section (e.g., with questions on school shift,
multi-grade class, gender, and age) and 21 survey items on issues such as language, reading, and socio-
economic status (SES). The teacher questionnaire had a basic information section and 36 items on issues
such as qualifications, years of experience, and approaches to reading instruction. The head teacher
questionnaire had a basic information section and 27 items on issues such as qualification, years of
experience, administrative training, and school characteristics.
The MSI statistician ran descriptive statistics on all of the survey data (i.e., percentages of respondents by
category, some of which were grouped). In addition, the average ORF scores (reading fluency rates) are
TUSOME REVISED BASELINE STUDY 9
provided for each category. Finally, there is a statistical analysis of group differences for the pupil data. As
mentioned above, the numbers of teachers and head teachers is too small for an inferential analysis,
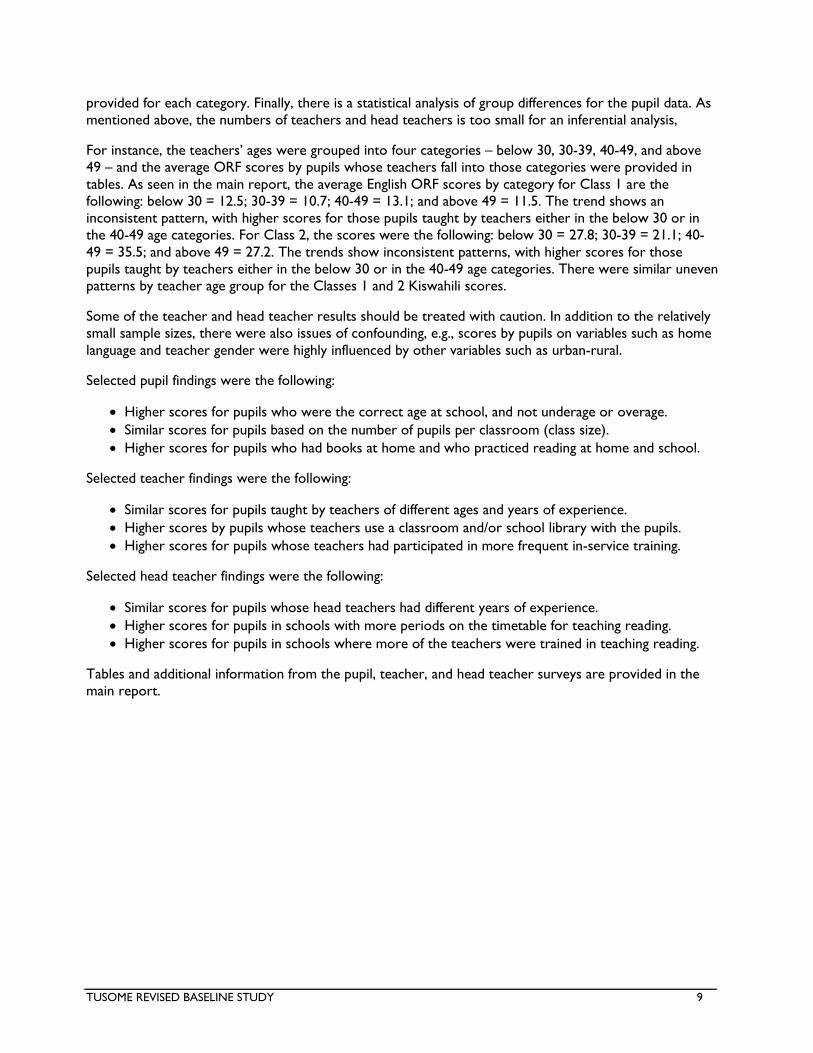
For instance, the teachers’ ages were grouped into four categories – below 30, 30-39, 40-49, and above
49 – and the average ORF scores by pupils whose teachers fall into those categories were provided in
tables. As seen in the main report, the average English ORF scores by category for Class 1 are the
following: below 30 = 12.5; 30-39 = 10.7; 40-49 = 13.1; and above 49 = 11.5. The trend shows an
inconsistent pattern, with higher scores for those pupils taught by teachers either in the below 30 or in
the 40-49 age categories. For Class 2, the scores were the following: below 30 = 27.8; 30-39 = 21.1; 40-
49 = 35.5; and above 49 = 27.2. The trends show inconsistent patterns, with higher scores for those
pupils taught by teachers either in the below 30 or in the 40-49 age categories. There were similar uneven
patterns by teacher age group for the Classes 1 and 2 Kiswahili scores.
Some of the teacher and head teacher results should be treated with caution. In addition to the relatively
small sample sizes, there were also issues of confounding, e.g., scores by pupils on variables such as home
language and teacher gender were highly influenced by other variables such as urban-rural.
Selected pupil findings were the following:
Higher scores for pupils who were the correct age at school, and not underage or overage.
Similar scores for pupils based on the number of pupils per classroom (class size).
Higher scores for pupils who had books at home and who practiced reading at home and school.
Selected teacher findings were the following:
Similar scores for pupils taught by teachers of different ages and years of experience.
Higher scores by pupils whose teachers use a classroom and/or school library with the pupils.
Higher scores for pupils whose teachers had participated in more frequent in-service training.
Selected head teacher findings were the following:
Similar scores for pupils whose head teachers had different years of experience.
Higher scores for pupils in schools with more periods on the timetable for teaching reading.
Higher scores for pupils in schools where more of the teachers were trained in teaching reading.
Tables and additional information from the pupil, teacher, and head teacher surveys are provided in the
main report.

TUSOME REVISED BASELINE STUDY 10
MAIN REPORT
Introduction
The purpose of the baseline study is to establish initial measurements for an evaluation of the four-year
(2014-2018) Tusome (“Let’s Read” in Kiswahili) program. The evaluation is a non-experimental cross-
sectional study with measurements at three time points: baseline, midline, and endline. Activity impact will
be evaluated by comparing reading outcomes at the baseline (pre-test) to those at the midline/endline
(post-test). In addition, pupil, teacher, head teacher, and school factors will be examined for their
relationships to reading outcomes and any changes in those relationships over time.
The main audiences for the study are the following groups: 1) the Government of Kenya (GOK) and
Ministry of Education, Science, and Technology (MOEST); 2) USAID and DFID; 3) RTI International (the
implementing partner, or IP). Other stakeholders include the Teachers Service Commission (TSC),
semiautonomous government agencies (SAGAs), and county governments.
The three research questions addressed by this baseline study and the future evaluation are the following:
1. What are the levels of Classes 1 and 2 pupils on reading subtasks?
2. What proportions of Classes 1 and 2 pupils can read grade-level text?
3. What pupil-, teacher-, and school-related factors are associated with reading outcomes?
Background
In response to requests from the GOK to implement an activity focused on early grade reading (EGR),
USAID and DFID have awarded $53.8 million for a basic education initiative led by USAID/Kenya’s Office
of Education and Youth to improve pupils’ reading skills. The Tusome program is intended to 1) scale up
the previous (2011-2014) Primary Math and Reading Initiative (PRIMR) pilot activity and 2) increase the
capacity of the GOK to deliver and administer EGR programs nationwide. Tusome will transition
implementation of activities to GOK via capacity building activities and government-to-government
mechanisms.
Tusome is starting with reading activities in Class 1 and will expand to Class 2 thereafter. The project will
support approximately 23,000 public and APBET primary schools in Kenya’s 47 counties. About 22,000 of
these schools are public schools, located in urban and rural areas, and 1,000 are APBET schools, located
mostly in urban areas. Tusome aims to benefit 1) 5.4 million primary school pupils; 2) 50,000 Classes 1
and 2 teachers; 3) 23,000 primary school head teachers; 4) 1,099 Teacher Advisory Centre (TAC) tutors;
and 5) 300 senior education personnel.
Since 2005, USAID/Kenya has supported MOEST efforts to improve access to quality education, build the
capacity of education personnel and institutions, sponsor HIV/AIDS and life skills education projects, and
collaborate with the private sector to maximize information and communication technologies (ICT) to
improve education. Tusome represents continued collaboration between MOEST and USAID to improve
access to quality education in Kenya.
While access to education in Kenya has clearly improved over the past 10-15 years, there are some
indicators that the quality of education has declined. After the GOK passed a reform package in 2003 that
guaranteed free primary education, pupil enrollment increased dramatically. The total number ballooned
from 5.9 million public and private primary school pupils in 2002 to 9.8 million pupils in 2011. While this
amounts to an impressive primary school net enrollment rate (NER) of 95.7 percent, with near gender
parity, the effect of such drastic change in enrollment on service delivery and instructional quality —

TUSOME REVISED BASELINE STUDY 11
including in the core skill of reading — was an overall negative effect on learning outcomes. Problems
have included teacher shortages, a lack of teaching and learning materials, and inadequate physical facilities.
In addition, many of the new pupils came from disadvantaged backgrounds and often had low levels of
knowledge and skills when they started school. Kenya's ranking on reading performance in primary
schools dropped over a seven-year period (2000–2007) from second to fifth of the 15 African countries
participating in the Southern Africa Consortium for Monitoring Educational Quality (SACMEQ).2 An
assessment by Uwezo (“Capability” in Kiswahili) Kenya reported that only 30 percent of Class 3 pupils
could read a story at the Class 2 level in English or Kiswahili.3
Reading is a foundational skill, as poor reading ability links to higher pupil dropout rates, more grade
repetition, and underperformance in other content areas. The 2011 USAID Global Education Strategy
recognizes the importance of developing strong early grade readers: “Given limited resources ... the most
strategic impact [the Agency] can make in basic education is to address EGR as an outcome that is critical
to sustain and ensure learning for children.” The strategy continues: “In stable, well-performing countries
with unmet needs in basic education, the priority focus will be on assuring learning outcomes for primary-
grade children, especially in reading.” The GOK, along with USAID/Kenya and DFID/Kenya, are
supporting Tusome to address national priorities and donor strategic objectives.
Methodology
Management Systems International (MSI) led the Tusome baseline study using multiple data collection
methods, including an early grade reading assessment (EGRA) and surveys of pupils, teachers, and head
teachers. The methodology consisted of selecting and trans-adapting the EGRA assessment tool and
surveys, establishing the validity of the tool and surveys, developing and implementing the sampling
procedures, recruiting and training supervisors and enumerators, administering the tool and surveys in the
sample schools, ensuring quality control, establishing the reliability of the assessment tool, and analyzing
the data. These steps are described below.
Tool and Surveys
MSI began the process of EGRA tool and survey development by consulting with RTI on the instruments
that were used for the PRIMR endline evaluation. Then, in collaboration with the MOEST, the MSI team
used the PRIMR instruments as a model for developing, piloting, revising, and validating a version of EGRA
with 14 subtasks, including eight in English and six in Kiswahili (Table 9). The main tools development
took place during a two-day workshop in mid-June, which was led by an MSI-hired local reading expert.
The workshop was followed by a validation workshop with MOEST officials, who further reviewed and
revised the tools. (See Annex 2: Descriptions of the English and Kiswahili Subtasks for more information
on all of the subtasks.)
After training a team of enumerators, MSI led the piloting of the tools in several public schools in districts
in the greater Nairobi area, as identified by the MOEST, in late June. The MSI statistician analyzed the pilot
data and then the MSI assessment specialist, MSI local reading expert, and the quality control officers
(QCOs) made minor revisions to the tools. The operational tools were then finalized following a revision
workshop with the MOEST. (See Annex 3: Modifications to the English and Kiswahili Subtasks for changes
that were made as a result of MOEST inputs and the piloting results.)
For English, there were four pre-reading subtasks (phoneme segmentation, letter sound knowledge,
invented/non-word decoding, and vocabulary) and four reading subtasks (two passages each with passage
reading and comprehension). Kiswahili had four pre-reading subtasks (letter sound knowledge, syllable
2 Hungi, N. et al. (2010). SACMEQ III project results: Pupil achievement levels in reading and mathematics. Paris: SACMEQ.
3 Uwezo Kenya (2011). Are our children learning? Annual learning assessment report. Nairobi: Uwezo.

TUSOME REVISED BASELINE STUDY 12
fluency, invented/non-word decoding, and listening comprehension) and two reading subtasks (passage
reading and reading comprehension). For the untimed tasks, the pupils were presented with a series of
items, e.g., identifying vocabulary words or answering comprehension questions. For the timed tasks, the
pupils were given one minute to perform a subtask, e.g., naming letter sounds or orally reading a passage.
Note that the raw score range for the timed subtasks reflects the number of items. The scores on these
subtasks were adjusted if the pupil completed the subtask prior to the end of one minute, making it
possible to exceed the upper end of the raw score range. The actual score ranges for the Passage Reading
subtasks (which measure Oral Reading Fluency, or ORF) are shown in the annex. (See Annex 6:
Histograms of Fluency Scores for distributions of the ORF scores by class and language.)
Table 9. English and Kiswahili Subtasks and Score Ranges
Language and Subtask Stimulus Raw Score Range
English
1. Phoneme segmentation 10 words (untimed) 0-10
2. Letter sound knowledge 100 letters (timed) 0-100
3. Invented/non-word decoding 50 non-words (timed) 0-50
4. Vocabulary 20 words (untimed) 0-20
5a. Passage reading (A) 70 words (timed) 0-70
5b. Reading comprehension (A) 6 questions (untimed) 0-6
6a. Passage reading (B) 70 words (timed) 0-70
6b. Reading comprehension (B) 6 questions (untimed) 0-6
Kiswahili
1. Letter sound knowledge 100 letters (timed) 0-100
2. Syllable fluency 100 syllables (timed) 0-100
3. Invented/non-word decoding 50 non-words (timed) 0-50
4a. Passage reading 68 words (timed) 0-68
4b. Reading comprehension 6 questions (untimed) 0-6
5. Listening comprehension 5 questions (untimed) 0-5
In addition to the EGRA tool, surveys were prepared for pupils, teachers, and head teachers in order to
collect contextual information that could be analyzed simultaneously with the test data. The pupil
questionnaire had a basic information section (e.g., school shift, multi-grade class, gender, and age) and 21
survey items on issues such as language, reading, and socio-economic status (SES). The teacher
questionnaire had a basic information section (similar to the pupil section) and 36 items on issues such as
qualification, years of experience, and approach to reading instruction. The head teacher questionnaire
had a basic information section (similar to the teacher section) and 27 items on issues such as
qualification, years of experience, administrative training, and school characteristics.
Test Validity
Validity was assured through the test development process that involved close collaboration between the
MOEST and MSI. The MOEST and an MSI-hired local reading specialist (who had a technical role in the
development of the PRIMR and Tusome materials) provided information on the Tusome reading program
and its objectives. They also made suggestions for the tools such as simplifying the Kiswahili instructions,

TUSOME REVISED BASELINE STUDY 13
revising some of the reading passages and comprehension questions, and standardizing the wording and
formats of the subtasks.
The model test selection, a test development workshop, pilot testing, test revision, and a test validation
workshop with the MOEST were also critical to establishing test validity. The MSI psychometrician and
the MSI assessment specialist led and/or participated in the test development process and workshops. The
process was critical in creating a version of EGRA that measured reading skills, in English and Kiswahili,
for the Kenyan context. The test also complied with USAID requirements for setting a baseline that
would allow for measuring progress towards the global Goal 1 indicators.
Similarly, the survey instruments were adapted by the team of experts, piloted, and then revised based on
feedback from QCOs, supervisors, and enumerators.4 Revisions were made in collaboration with the
MOEST prior to the operational testing. (See Annex 3: Modifications to English and Kiswahili Subtasks for
more information.)
Sampling Procedures
Through discussions with USAID, MOEST, and RTI, the MSI team designed and implemented a sampling
process to determine the appropriate sample size and select the schools for the baseline. The objective
was to produce a sample that would be nationally representative. The process involved six steps:
Step 1: Define the sampling frame using lists of public and APBET schools.
Step 2: Develop a set of design parameters to determine the sample size.
Step 3: Enter the parameters into sampling software to calculate the sample size.
Step 4: Select a nationally representative sample of schools equal to the sample size.
Step 5: Check on the feasibility of the sample and verify the schools in the field.
Step 6: Replace a limited number of schools (if needed) and finalize the sample.
The sampling frameworks, which were provided by RTI, included 22,154 public schools and 1,000 APBET
(Alternative Provision of Basic Education and Training) schools. There was information on school name,
administrative units (county, sub-county, and zone), school code, and number of pupils in class 1.
It is important to ensure that the study is sufficiently powered to detect effects. In determining whether
the statistical power is sufficient for the study, it is most critical to randomize an adequate number of
groups (e.g., schools) – much more so than the number of individuals per group (e.g., pupils).5 Values for
several parameters (listed below) were assumed in order to reach a level of minimum detectable effects
(MDE) for the study. The MDE is the smallest true effect that has a good chance of having statistical
significance. We typically define an MDE as the effect that has 80 percent power for a two-tailed test of
statistical significance of 0.05 (alpha level) for all comparisons. A typical MDE target is 0.20 for randomized
groups with approximately 10 to 15 individuals per group.
Our parameters below were set using typical values for statistical power and statistical significance, along
with the number of counties that would be reasonable to reach within the time and resource constraints
of the revised baseline. The design parameters were as follows:
1. Representative set of counties (K = 24 out of 47 total)
2. Number of pupils per class per school (n = 12)
3. Statistical power set to 0.80
4. Alpha (statistical significance) level set to 0.05
4 Research Solutions Africa (2015). Piloting report for the Kenya Tusome Baseline Study. (Submitted to MSI.) 5 Bloom, H. (2007). Sample design for group-randomized trials. Prepared for the U.S. Institute of Educational Sciences/National Center for
Educational Research (IES/NCER) Summer Research Training Institute.

TUSOME REVISED BASELINE STUDY 14
5. Intra-class correlation (rho) set at 0.23 (from the RTI PRIMR pilot results)
Based on these design parameters, the MSI statistician used Optimal Design software to calculate the
number of schools for the sample. We found that an average of 8.5 schools for each of the 24 clusters
(counties) would result in an MDE = 0.20. This led to a total sample size of 204 schools in Kenya for the
EGRA baseline, i.e., 8.5 x 24 = 204 schools, with 12 pupils per class per school. Out of the 204 schools,
174 were public schools and 30 were APBET schools. Based on a desire for more representation in some
of the former provinces, we increased the number of counties (K = 26) for an average of 7.85 schools per
county (Table 10).
Using a three-stage cluster sampling procedure with the frameworks, MSI drew random samples. The 204
schools were selected proportionally from each of the sampled counties, with independent samples for
public and APBET schools based on their respective sampling frames. School-level samples were 24 pupils,
with 12 (6 boys and 6 girls) in each of Classes 1 and 2.The sampling plan resulted in a target of 4,896 total
pupils with 2,448 boys and 2,448 girls, along with two teachers and the head teacher from each school.6
Table 10. Sampling Stages and Targets
Stage Procedure
Stage 1 26 sample counties (out of 47 counties in all 8 former provinces)
Stage 2 204 sample schools (174 public and 30 APBET out of out of 22,154 and 1,000 respectively)
Stage 3 12 sample pupils per class (6 boys and 6 girls in each of Classes 1 and 2)
The MSI assessment coordinator and QCOs, with collaboration from MOEST officials, verified the sample
schools in the counties. This helped in achieving actual numbers of schools and pupils that were close to
the target numbers, including all 204 of the schools. A total of 4,866 pupils were tested (99 percent of
target), along with surveys for 384 teachers (94 percent of target, some of whom were in multi-grade
classrooms or taught both Classes 1 and 2) and 199 head teachers (98 percent of target). A minimum of
15 and a maximum of 37 schools were sampled from each of the eight (former) provinces. The largest
number of pupils was assessed in the Rift Valley province (909) and the smallest number in the North
Eastern (348) provinces. At least five schools were sampled from each of the 26 counties.
Prior to the data analysis, the MSI statistician applied sampling weights to the EGRA and survey data so
that the data set would be nationally representative.
Data Collection
MSI information technology (IT) specialists adapted an electronic data collection application that they had
developed for another USAID-funded project. The MSI team, including the QCOs, piloted the application
and the IT specialists made corrections prior to the operational (full) test administration. We selected a
local subcontractor, Research Solutions Africa (RSA), to administer the tests and surveys. With guidance
and approval from MSI, RSA used a list of 130 experienced EGRA administrators provided by RTI to
recruit their supervisors and enumerators.
MSI assessment specialists (international and local) and QCOs provided extensive training to the RSA
leadership team, supervisors, and enumerators so that the tests and surveys would be administered
according to international standards of quality. This training took place in a four-day workshop prior to
the operational testing. It included scripted practice during which MSI provided detailed training, checked
the enumerators’ inter-rater reliability (IRR), and retrained those enumerators whose ratings did not
6 MSI (2015). Kenya revised EGRA baseline sampling process. (Submitted to the MOEST and USAID.)

TUSOME REVISED BASELINE STUDY 15
agree with the gold standards as determined by the specialists and QCOs. In general, the retraining was
minor since nearly all of the QCOs, supervisors, and enumerators had previously participated in training
with IRR-type agreement analysis with RTI during the PRIMR EGRA data collections. In addition, their
experience with prior data collection applications was helpful when they received training on the current
tools. Further retraining took place during practice sessions with pupils in four Nairobi schools.
A total of 12 QCOs, 23 supervisors, and 72 enumerators working in 23 teams were selected to conduct
the data collection in the schools over a period of three weeks in July 2015 (13 to 29 July), i.e., at the end
of the second term of the academic year. Each QCOs, supervisor, and enumerator had a locally procured
tablet with the electronic data collection application. The MSI assessment coordinator and RSA supervisor
developed a logistics plan that detailed all school visits, protocols, and other arrangements (e.g.,
transportation and lodging). (See Annex 1: Activity Work Plan for details on the activities, sub-activities,
and timelines.)
Data Analysis
The MSI assessment specialist, IT specialist, statistician, and psychometrician provided daily monitoring of
the data collection process by accessing the figures on a cloud server. The MSI assessment specialist and
statistician developed pivot tables to track the progress of the teams in the field. MSI hired two project
associates in Nairobi to call the QCOs on a daily basis to gather field figures, which the team then
matched up with the figures from the cloud server. Discrepancies were immediately addressed between
MSI, RSA, the QCOs, and the data collection teams. This process improved quality control and reduced
the need for data cleaning.
The MSI statistician analyzed the data using Stata statistical software, with quality assurance by the MSI
psychometrician. Tables were created in Excel for use in the preparation of this technical report. The
statistician, psychometrician, and assessment specialist reviewed the tables for this report.
Test Reliability
The main indicator of reliability for psychometric tests is Cronbach’s alpha, which estimates the internal
consistency reliability of a test for a particular test administration. It indicates the extent to which
subtasks or items that are designed to measure a particular construct are able to deliver consistent
scores. The range for Cronbach’s alpha is 0.00 to 1.00, with higher values indicating better (or more
desirable) reliability. Values of 0.80 and above are considered acceptable. We calculated the alphas
separately for each grade level and language with percent correct scores for the subtasks (Table 11).
Table 11. English and Kiswahili Test Reliabilities by Grade
Language Number of Subtasks Class 1 Class 2
English 8 0.92 0.92
Kiswahili 6 0.89 0.90
For English, the values were 0.92 for Class 1 and Class 2. For Kiswahili, the values were 0.89 for Class 1
and 0.90 for Class 2. These values indicate strong reliability for each of the languages and grade levels,
especially considering that reliability estimates are generally lower when the number of subtasks is
smaller, such as with the eight English and six Kiswahili subtasks on this version of EGRA.
Subtask Quality and Reliability

TUSOME REVISED BASELINE STUDY 16
At the subtask level, we calculated two statistics: 1) subtask-total correlations for the quality (or
discrimination) of the subtasks and 2) Cronbach’s alpha for the reliability of the untimed subtasks.
The subtask-total correlation provides an indication of whether the subtask is able to discriminate
between high and low achieving pupils. For each language, these were calculated by correlating the
percent correct scores for each subtask and the grand mean for all subtasks (total score). Subtasks are
considered as having acceptable quality if this correlation is 0.20 or above.
Cronbach’s alpha for the subtasks is similar to the alpha for the test, except that we treat the subtask as a
test. It is calculated using the items within the subtask as opposed to the subtasks within the test. For
instance, with phoneme segmentation, we calculate the alpha using the percent correct scores for each
item and the percent correct score for the subtask. Since these are subtasks instead of tests, values of
0.70 and above are considered acceptable. Note that the coefficients were only calculated for the untimed
tasks since the similarity of the items on the timed tasks will always lead to high alphas.
Subtask-total correlations and the alpha coefficients were calculated separately for each grade level and
language (Tables 12 and 13). For English, all subtask-total correlations were well above the minimum
standard, indicating high quality subtasks. All of the alpha coefficients (for the untimed subtasks only) were
above 0.70, indicating strong internal consistency reliability at the subtask level.
Table 12. English Subtask-Total Correlations and Alpha Coefficients
Subtask
Class 1 Class 2
Subtask-
Total
Alpha
Coefficient
Subtask-
Total
Alpha
Coefficient
1. Phoneme segmentation 0.60 0.94 0.49 0.92
2. Letter sound knowledge 0.67 -- 0.56 --
3. Invented/non-word decoding 0.90 -- 0.89 --
4. Vocabulary 0.75 0.88 0.75 0.89
5a. Passage reading (A) 0.94 -- 0.93 --
5b. Reading comprehension (A) 0.75 0.77 0.77 0.82
6a. Passage reading (B) 0.94 -- 0.94 --
6b. Reading comprehension (B) 0.78 0.86 0.82 0.88
For Kiswahili, the subtasks were also of high quality, with correlations well above 0.20 for all of the six
subtasks. The alphas (again for the untimed subtasks only) were above 0.70, indicating good internal
consistency reliability.
Table 13. Kiswahili Subtask-Total Correlations and Alpha Coefficients
Subtask
Class 1 Class 2
Subtask-
Total
Alpha
Coefficient
Subtask-
Total
Alpha
Coefficient
1. Letter sound knowledge 0.79 -- 0.74 --
2. Syllable fluency 0.90 -- 0.87 --
3. Invented/non-word decoding 0.86 -- 0.87 --
4a. Passage reading 0.88 -- 0.90 --

TUSOME REVISED BASELINE STUDY 17
Table 13. Kiswahili Subtask-Total Correlations and Alpha Coefficients
Subtask
Class 1 Class 2
Subtask-
Total
Alpha
Coefficient
Subtask-
Total
Alpha
Coefficient
4b. Reading comprehension 0.82 0.71 0.86 0.77
5. Listening comprehension 0.60 0.73 0.61 0.73
For the untimed tasks, we also calculated item-subtask correlations. These correlations indicated the
quality of the items that made up the subtasks. For instance, the 20 items on the untimed English
phoneme segmentation subtask each had an item-subtask correlation. Out of all the items on the untimed
subtasks (i.e., the items on the four untimed English subtasks and the two untimed Kiswahili subtasks),
only Kiswahili comprehension item number 6 for Class 1 had an item-subtask correlation of below 0.20.
The reason for this low correlation was that the percentage of pupils answering the item correctly was
very low, which meant that there was almost no variation. All other items had item-subtask correlations
above the minimum requirement, which meant that they had acceptable quality. (See Annex 3:
Psychometric Analyses for more information on the correlations between the subtasks and the item
statistics for the untimed subtasks.)
Actual Sample
Table 14 shows the number of pupils by gender and class. Also provided is the percentage of the sampling
target that was reached. All pupils took both the English and Kiswahili subtasks.
Out of the total of 4,866 pupils, 50.6 percent were boys and 49.4 percent were girls. The actual samples
were very close to the targets, as the boys exceeded their target by three pupils (100.1 percent) and the
girls were 31 pupils below their target (98.7 percent). In total, the baseline reached 99.4 percent of the
target number of pupils.
Table 14. Pupil Sample by Class and Gender
Class Sample Male Female Total
Class 1 Pupils 1,225 1,202 2,427
% of Target 100.1% 98.2% 99.1%
Class 2 Pupils 1,226 1,213 2,439
% of Target 100.2% 99.1% 99.6%
Total Pupils 2,451 2,415 4,866
% of Target 100.1% 98.7% 99.4%
For the teachers and head teachers, the percentage of target was also high, though both numbers were
lower than targeted due to 1) a few instances of absenteeism and 2) some teachers either serving in
multi-grade classrooms or teaching Classes 1 and 2 separately (Table 15). There were 384 teachers out of
408 (94.1 percent of the target) who responded to the survey. Of these teachers, 20.3 percent (78) were
male and 79.7 percent (306) were female. There were 199 head teachers out of 204 (97.5 percent of the
target) in the survey. Of these, 75.9 percent (151) were male and 24.6 percent (48) were female.

TUSOME REVISED BASELINE STUDY 18
Table 15. Teacher and Head Teacher Samples by Class and Gender
Teachers Head
Teachers Class Class 1 Class 2 Total
Male 42 36 196 151
Female 154 152 188 48
Total 196 188 384 199
% of Target 96.1% 92.2% 94.1% 97.5%
Finally, the assessments and surveys were conducted in all eight of the (former) provinces. The samples
are presented below for the pupils, teachers, and head teachers by class (Table 16). Due to differences in
the number of schools in each province, the Rift Valley province had the highest number of pupils,
teachers, and head teachers (909 pupils, 74 teachers, and 37 head teachers) while the North Eastern (348
pupils, 24 teachers, and15 head teachers) had the lowest numbers. (See Annex 4: Sampled Counties for a
list of the counties, along with the numbers of schools, pupils, teachers, and head teachers by county.)
Table 16. School, Pupil, Teacher, and Head Teacher Samples by (Former) Province
(Former)
Province Schools
Pupils Teachers Head
Teachers Class 1 Class 2 Total Class 1 Class 2 Total
Central 24 285 290 575 24 23 47 23
Coast 29 343 346 689 28 24 52 28
Eastern 27 322 322 644 26 24 50 26
Nairobi 27 319 330 649 26 25 51 27
North Eastern 15 173 175 348 11 13 24 15
Nyanza 29 350 344 694 29 27 56 29
Rift Valley 38 456 453 909 37 37 74 37
Western 15 179 179 358 15 15 30 14
Total 204 2,427 2,439 4,866 196 188 384 199
Please note that sampling weights were applied prior to producing the findings (in the next section).
Findings
After assessing the pupils and administering the survey questionnaires, the MSI statistician and
psychometrician analyzed the EGRA tool and survey data to produce a baseline for each of the three
research questions. A summary of the baseline findings is presented below.
The findings establish an initial level of EGR achievement, which will be compared to the levels at midline
and endline. All data are disaggregated by grade level and language. For each language, the findings for
Classes 1 and 2 are presented together, either in the same tables or in adjacent tables, in order to
compare the levels of pupils by grade level. Prior to intervention, we would expect the levels to be lower
in Class 1 than in Class 2 on all subtasks. The results by language are presented in separate tables since
these results should not be compared. English and Kiswahili have different structures so pupils might learn
at different rates even if they had the same level of instruction. The results for the (former) provinces and

TUSOME REVISED BASELINE STUDY 19
counties should not be compared, either, since the sample sizes are not large enough for those
comparisons to be valid.
Some of the data were also disaggregated by other variables. In particular, the pupil data were
disaggregated by school type (public and APBET) and gender (male and female). The teacher and head
teacher data were disaggregated by demographics (gender, qualifications, years of experience, etc.) and by
survey variables (instructional methods, facilities, etc.). All results were analyzed using descriptive statistics
(frequencies, percentages, raw score means, etc.). For the pupils, inferential statistics (t-tests) were used
to compare results on the group variables. The significance level was set at p < .05 based on the level
used in the power calculations for the sampling. Statistically significant findings were indicated with an
asterisk next to the mean score of the higher performing group. Inferential statistical tests (t-tests and
ANOVAs) on the teacher and head teacher data were not reported due to small sample sizes.
Question 1: What are the levels of pupils on the reading subtasks?
Reading skills refer to building blocks as well as reading fluency and comprehension. As shown in Table 9
above, these skills are measured by EGRA and range from phonemic awareness to reading
comprehension. Once children learn to apply sounds to letter symbols, they must practice the process to
ensure that their reading becomes quick and accurate. They also must practice understanding what they
have read and extracting information so that they can develop and demonstrate comprehension skills.
In a change from previous EGRAs in Kenya, the MOEST requested two sets of reading passages and
questions in English (only). These sets were similar except that they were administered using different
methods. For English passage A, the administration was traditional in that the pupils had one minute to
read the passage aloud (for the ORF calculation), the passage was removed from them, and then they
were asked the comprehension questions. For English passage B, the pupils had one minute to read the
passage aloud (for another ORF calculation), a second minute to read the passage silently, and then they
were asked the comprehension questions while maintaining access to the passage. The goal of passage B
was to assess the pupils using a subtask that would reflect a key type of reading instruction from the
Tusome project.
The scores for the untimed tasks are reported in terms of raw scores, i.e., the number correct. The
scores for the timed tasks are reported in terms of adjusted raw scores; these scores were adjusted
upwards if the pupil completed the task prior to the end of one minute. The timed task scores include
reading fluency, or ORF in CWPM. (See Annex 5: Histograms of Fluency Scores for distributions of ORF
scores, including the adjustments to the CWPM scale.)
An additional analysis was produced on the accuracy of the pupils’ responses for the timed tasks. This
statistic calculates a percentage by dividing the number of items answered correctly for each subtask by
the number of items that the pupil attempted. Accuracy is important since many pupils, particularly at the
lower grade levels, do not attempt many of the items on a subtask. In the raw score calculations, the non-
attempted items are scored as incorrect; however, in the accuracy calculations, all the non-attempted
item are not considered.
The following tables provide the results from the pupils’ reading assessments in the two languages. The
results are disaggregated by school type (public and APBET) and gender (male and female).
English
For English, the pupils generally had higher scores in Class 2 than in Class 1. Exceptions were for
phoneme segmentation and letter sound knowledge, where the Class 1 pupils scored higher than the
Class 2 pupils (Table 17).

TUSOME REVISED BASELINE STUDY 20
The higher scores by the Class 1 pupils in phoneme segmentation and letter sound knowledge were likely
due to the Class 1 instruction supported by the Tusome project during the initial implementation stage.
On all other subtasks, the scores of the Class 2 pupils were higher. For instance, the ORF scores were
about 13-14 CWPM higher for Class 2 than Class 1.
As compared to the total number of items on each subtask, the scores at both grade levels were low at
baseline. Class 1 pupils were able to answer correctly only about 1 out of 10 phoneme segmentation
items, 16 out of 100 letter sounds, 6 out of 50 non-words, 6 out of 20 vocabulary words, and less than
1/2 out of 5 comprehension questions. The subtask scores for the Class 2 pupils were somewhat higher,
but they were still only able to answer about 1 out of 10 phoneme segmentation items, 11 out of 100
letter sounds, 11 out of 50 non-words, and 9 out of 20 vocabulary words, and less than 1 out of 5
comprehension questions.
Table 17. English Reading Scores by Class
Subtask Class 1 Class 2 Difference
(Class 2 – Class 1)
Phoneme segmentation 1.3 0.7 -0.6
Letter sound knowledge 15.8 10.7 -5.1
Invented/non-word decoding 6.3 11.2 4.9
Vocabulary 6.2 8.6 2.4
Passage reading (A) 11.9 25.8 13.9
Reading comprehension (A) 0.3 0.6 0.3
Passage reading (B) 11.0 23.8 12.8
Reading comprehension (B) 0.3 0.7 0.4
Within Classes 1 and 2, the fluency scores on passages A and B were about the same, indicating that the
passages were of similar difficulty. For comprehension, the additional exposure to the reading passage did
not seem to make a difference. In other words, for passage B, providing an extra minute to read the
passage silently and allowing the pupil to refer to the passage when presented with the questions did not
lead to higher scores on reading comprehension at baseline.
The analysis by group showed that the scores by the pupils in the APBET schools were substantially
higher than those from the public schools, with statistically significant differences on all subtasks. For
instance, the ORF scores were about 8 CWPM (in Class 1) and 16 CWPM (in Class 2) higher for APBET
schools. Female pupils generally outscored their male counterparts; about half of the differences in scores
by gender were statistically significant. The ORF scores were about 2-3 CWPM (in Class 1) and 3-4
CWPM (in Class 2) higher for females than for males (Tables 18 and 19).
Table 18. English Class 1 Reading Scores
Subtask Overall School Type Gender
Public APBET Male Female
Phoneme segmentation 1.3 1.2 4.4 * 1.2 1.4
Letter sound knowledge 15.8 15.3 31.7 * 14.8 16.8 *
Invented/non-word decoding 6.3 5.9 16.6 * 5.7 6.8 *
Vocabulary 6.2 6.0 11.8 * 6.2 6.1

TUSOME REVISED BASELINE STUDY 21
Table 18. English Class 1 Reading Scores
Subtask Overall School Type Gender
Public APBET Male Female
Passage reading (A) 11.9 11.1 38.0 * 10.7 13.2 *
Reading comprehension (A) 0.3 0.2 1.5 * 0.2 0.3
Passage reading (B) 11.0 10.2 35.1 * 9.8 12.1 *
Reading comprehension (B) 0.3 0.2 1.7 * 0.2 0.3
Table 19. English Class 2 Reading Scores
Subtask Overall School Type Gender
Public APBET Male Female
Phoneme segmentation 0.7 0.6 3.0 * 0.7 0.7
Letter sound knowledge 10.7 10.3 23.8 * 10.1 11.4
Invented/non-word decoding 11.2 10.8 24.6 * 10.4 11.9 *
Vocabulary 8.6 8.4 14.5 * 8.5 8.6
Passage reading (A) 25.8 24.7 61.9 * 23.7 28.0 *
Reading comprehension (A) 0.6 0.5 2.8 * 0.6 0.6
Passage reading (B) 23.8 22.8 58.2 * 22.1 25.6 *
Reading comprehension (B) 0.7 0.6 3.4 * 0.7 0.7
Note that the scores by pupils in the public schools had a much greater effect on the overall scores than
those by pupils in the APBET schools. This was due to the larger sample size of the public schools. For
instance, in Class 1, the overall reading passage score was 15.8, while the score for public schools was
15.3 (a difference of 0.5 from the overall score) and the score for the APBET schools was 31.7 (a
difference of 15.9 from the overall score).
Finally, for English, the accuracy rates were generally below 50 percent for each subtask and grade level,
and about 30 percent for Class 1 pupils on most of the subtasks. The only subtask with higher accuracy
for Class 1 than Class 2 was letter sound knowledge. This was expected, since similar trends were seen in
the raw scores. As noted above, the difference was likely due to an emphasis on letter sounds in Class 1
at the early stages of the Tusome project. The other accuracy rates, i.e., for invented/non-word decoding,
passage reading A, and passage reading B, were all at least 13 percentage points higher for Class 2 than
Class 1 (Table 20).
Table 20. English Reading Accuracy Rates by Class
Subtask Class 1 Class 2 Difference
Letter sound knowledge 44.1% 29.5% -14.6
Invented/non-word decoding 29.8% 43.1% 13.3
Passage reading (A) 34.3% 50.7% 16.4
Passage reading (B) 31.5% 47.6% 16.1
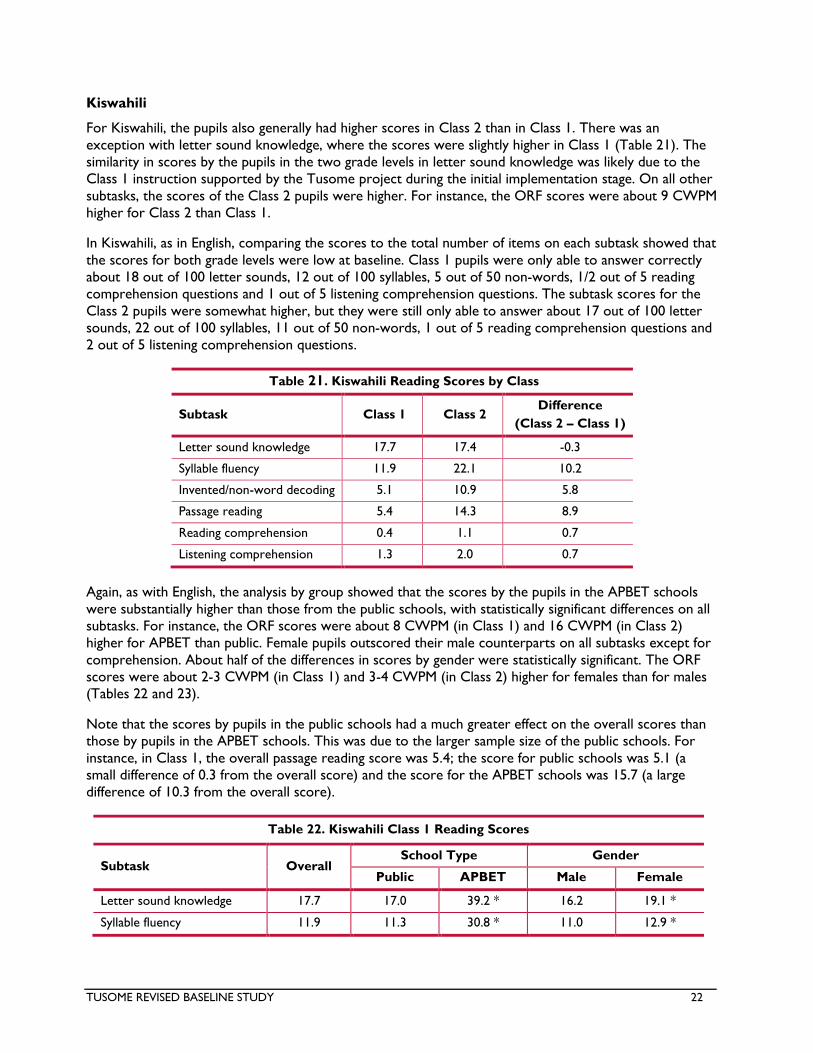
TUSOME REVISED BASELINE STUDY 22
Kiswahili
For Kiswahili, the pupils also generally had higher scores in Class 2 than in Class 1. There was an
exception with letter sound knowledge, where the scores were slightly higher in Class 1 (Table 21). The
similarity in scores by the pupils in the two grade levels in letter sound knowledge was likely due to the
Class 1 instruction supported by the Tusome project during the initial implementation stage. On all other
subtasks, the scores of the Class 2 pupils were higher. For instance, the ORF scores were about 9 CWPM
higher for Class 2 than Class 1.
In Kiswahili, as in English, comparing the scores to the total number of items on each subtask showed that
the scores for both grade levels were low at baseline. Class 1 pupils were only able to answer correctly
about 18 out of 100 letter sounds, 12 out of 100 syllables, 5 out of 50 non-words, 1/2 out of 5 reading
comprehension questions and 1 out of 5 listening comprehension questions. The subtask scores for the
Class 2 pupils were somewhat higher, but they were still only able to answer about 17 out of 100 letter
sounds, 22 out of 100 syllables, 11 out of 50 non-words, 1 out of 5 reading comprehension questions and
2 out of 5 listening comprehension questions.
Table 21. Kiswahili Reading Scores by Class
Subtask Class 1 Class 2 Difference
(Class 2 – Class 1)
Letter sound knowledge 17.7 17.4 -0.3
Syllable fluency 11.9 22.1 10.2
Invented/non-word decoding 5.1 10.9 5.8
Passage reading 5.4 14.3 8.9
Reading comprehension 0.4 1.1 0.7
Listening comprehension 1.3 2.0 0.7
Again, as with English, the analysis by group showed that the scores by the pupils in the APBET schools
were substantially higher than those from the public schools, with statistically significant differences on all
subtasks. For instance, the ORF scores were about 8 CWPM (in Class 1) and 16 CWPM (in Class 2)
higher for APBET than public. Female pupils outscored their male counterparts on all subtasks except for
comprehension. About half of the differences in scores by gender were statistically significant. The ORF
scores were about 2-3 CWPM (in Class 1) and 3-4 CWPM (in Class 2) higher for females than for males
(Tables 22 and 23).
Note that the scores by pupils in the public schools had a much greater effect on the overall scores than
those by pupils in the APBET schools. This was due to the larger sample size of the public schools. For
instance, in Class 1, the overall passage reading score was 5.4; the score for public schools was 5.1 (a
small difference of 0.3 from the overall score) and the score for the APBET schools was 15.7 (a large
difference of 10.3 from the overall score).
Table 22. Kiswahili Class 1 Reading Scores
Subtask Overall School Type Gender
Public APBET Male Female
Letter sound knowledge 17.7 17.0 39.2 * 16.2 19.1 *
Syllable fluency 11.9 11.3 30.8 * 11.0 12.9 *

TUSOME REVISED BASELINE STUDY 23
Table 22. Kiswahili Class 1 Reading Scores
Subtask Overall School Type Gender
Public APBET Male Female
Invented/non-word decoding 5.1 4.9 13.4 * 4.7 5.6 *
Passage reading 5.4 5.1 15.7 * 4.7 6.1 *
Reading comprehension 0.4 0.4 1.4 * 0.4 0.4
Listening comprehension 1.3 1.3 2.5 * 1.3 1.3
Table 23. Kiswahili Class 2 Reading Scores
Subtask Overall School Type Gender
Public APBET Male Female
Letter sound knowledge 17.4 16.7 40.4 * 16.3 18.6 *
Syllable fluency 22.1 21.5 41.4 * 20.3 23.9 *
Invented/non-word decoding 10.9 10.6 21.7 * 10.0 11.8 *
Passage reading 14.3 13.9 29.6 * 13.2 15.5 *
Reading comprehension 1.1 1.1 2.6 * 1.1 1.2
Listening comprehension 2.0 1.9 3.2 * 2.0 1.9
For Kiswahili, the accuracy rates were around 30 percent for Class 1 pupils on the subtasks. The only
subtask with higher accuracy for Class 1 than Class 2 was letter sound knowledge, with a difference of
about 5 percentage points. This was expected since similar trends were seen in the raw scores. As noted
above, the difference was likely due to an emphasis on letter sounds in Class 1 at the early stages of the
Tusome project. The other accuracy rates, i.e., for syllable fluency, invented/non-word decoding, and
passage reading, were at least 17 percentage points higher for Class 2 than for Class 1 pupils (Table 24).
Table 24. Kiswahili Reading Accuracy Rates by Class
Subtask Class 1 Class 2 Difference
Letter sound knowledge 46.4% 41.5% -4.9
Syllable fluency 35.4% 52.9% 17.5
Invented/non-word decoding 24.9% 42.8% 17.9
Passage reading 23.3% 47.6% 24.3
Question 2: What proportion of pupils can read grade-level text?
In 2012, the RTI PRIMR pilot team collaborated with the MOEST and the Kenya National Examinations
Council (KNEC) in setting benchmarks. After discussing and analyzing options, they established draft
benchmarks for reading fluency, or ORF, in English and Kiswahili, expressed in CWPM (Table 25).
Table 25. Draft ORF Performance Categories for English and Kiswahili
Category English CWPM Kiswahili CWPM
Zero reader 0 0
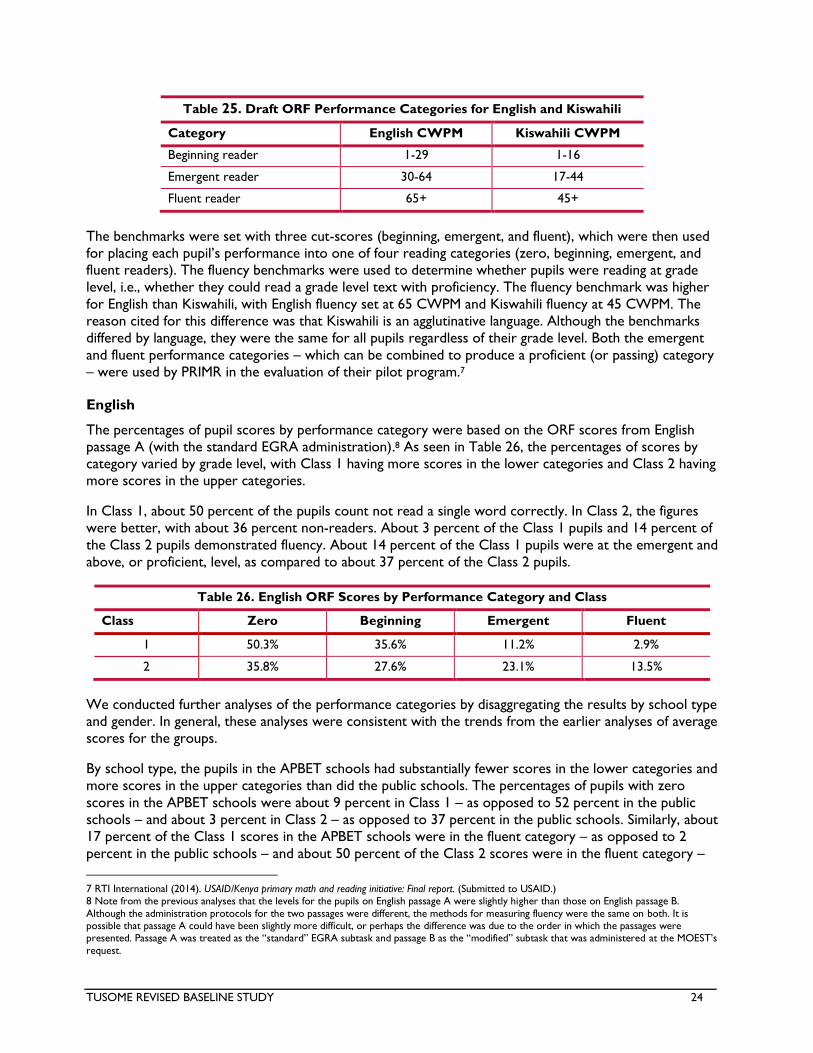
TUSOME REVISED BASELINE STUDY 24
Table 25. Draft ORF Performance Categories for English and Kiswahili
Category English CWPM Kiswahili CWPM
Beginning reader 1-29 1-16
Emergent reader 30-64 17-44
Fluent reader 65+ 45+
The benchmarks were set with three cut-scores (beginning, emergent, and fluent), which were then used
for placing each pupil’s performance into one of four reading categories (zero, beginning, emergent, and
fluent readers). The fluency benchmarks were used to determine whether pupils were reading at grade
level, i.e., whether they could read a grade level text with proficiency. The fluency benchmark was higher
for English than Kiswahili, with English fluency set at 65 CWPM and Kiswahili fluency at 45 CWPM. The
reason cited for this difference was that Kiswahili is an agglutinative language. Although the benchmarks
differed by language, they were the same for all pupils regardless of their grade level. Both the emergent
and fluent performance categories – which can be combined to produce a proficient (or passing) category
– were used by PRIMR in the evaluation of their pilot program.7
English
The percentages of pupil scores by performance category were based on the ORF scores from English
passage A (with the standard EGRA administration).8 As seen in Table 26, the percentages of scores by
category varied by grade level, with Class 1 having more scores in the lower categories and Class 2 having
more scores in the upper categories.
In Class 1, about 50 percent of the pupils count not read a single word correctly. In Class 2, the figures
were better, with about 36 percent non-readers. About 3 percent of the Class 1 pupils and 14 percent of
the Class 2 pupils demonstrated fluency. About 14 percent of the Class 1 pupils were at the emergent and
above, or proficient, level, as compared to about 37 percent of the Class 2 pupils.
Table 26. English ORF Scores by Performance Category and Class
Class Zero Beginning Emergent Fluent
1 50.3% 35.6% 11.2% 2.9%
2 35.8% 27.6% 23.1% 13.5%
We conducted further analyses of the performance categories by disaggregating the results by school type
and gender. In general, these analyses were consistent with the trends from the earlier analyses of average
scores for the groups.
By school type, the pupils in the APBET schools had substantially fewer scores in the lower categories and
more scores in the upper categories than did the public schools. The percentages of pupils with zero
scores in the APBET schools were about 9 percent in Class 1 – as opposed to 52 percent in the public
schools – and about 3 percent in Class 2 – as opposed to 37 percent in the public schools. Similarly, about
17 percent of the Class 1 scores in the APBET schools were in the fluent category – as opposed to 2
percent in the public schools – and about 50 percent of the Class 2 scores were in the fluent category –
7 RTI International (2014). USAID/Kenya primary math and reading initiative: Final report. (Submitted to USAID.) 8 Note from the previous analyses that the levels for the pupils on English passage A were slightly higher than those on English passage B.
Although the administration protocols for the two passages were different, the methods for measuring fluency were the same on both. It is possible that passage A could have been slightly more difficult, or perhaps the difference was due to the order in which the passages were presented. Passage A was treated as the “standard” EGRA subtask and passage B as the “modified” subtask that was administered at the MOEST’s
request.
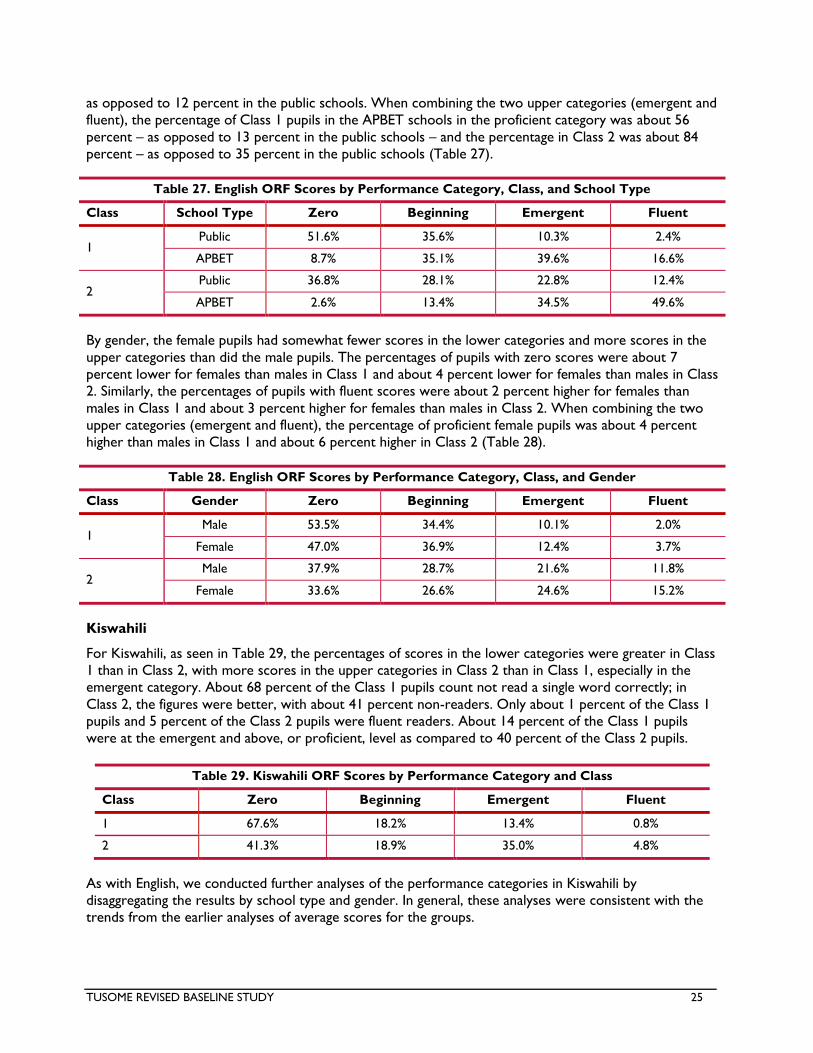
TUSOME REVISED BASELINE STUDY 25
as opposed to 12 percent in the public schools. When combining the two upper categories (emergent and
fluent), the percentage of Class 1 pupils in the APBET schools in the proficient category was about 56
percent – as opposed to 13 percent in the public schools – and the percentage in Class 2 was about 84
percent – as opposed to 35 percent in the public schools (Table 27).
Table 27. English ORF Scores by Performance Category, Class, and School Type
Class School Type Zero Beginning Emergent Fluent
1 Public 51.6% 35.6% 10.3% 2.4%
APBET 8.7% 35.1% 39.6% 16.6%
2 Public 36.8% 28.1% 22.8% 12.4%
APBET 2.6% 13.4% 34.5% 49.6%
By gender, the female pupils had somewhat fewer scores in the lower categories and more scores in the
upper categories than did the male pupils. The percentages of pupils with zero scores were about 7
percent lower for females than males in Class 1 and about 4 percent lower for females than males in Class
2. Similarly, the percentages of pupils with fluent scores were about 2 percent higher for females than
males in Class 1 and about 3 percent higher for females than males in Class 2. When combining the two
upper categories (emergent and fluent), the percentage of proficient female pupils was about 4 percent
higher than males in Class 1 and about 6 percent higher in Class 2 (Table 28).
Table 28. English ORF Scores by Performance Category, Class, and Gender
Class Gender Zero Beginning Emergent Fluent
1 Male 53.5% 34.4% 10.1% 2.0%
Female 47.0% 36.9% 12.4% 3.7%
2 Male 37.9% 28.7% 21.6% 11.8%
Female 33.6% 26.6% 24.6% 15.2%
Kiswahili
For Kiswahili, as seen in Table 29, the percentages of scores in the lower categories were greater in Class
1 than in Class 2, with more scores in the upper categories in Class 2 than in Class 1, especially in the
emergent category. About 68 percent of the Class 1 pupils count not read a single word correctly; in
Class 2, the figures were better, with about 41 percent non-readers. Only about 1 percent of the Class 1
pupils and 5 percent of the Class 2 pupils were fluent readers. About 14 percent of the Class 1 pupils
were at the emergent and above, or proficient, level as compared to 40 percent of the Class 2 pupils.
Table 29. Kiswahili ORF Scores by Performance Category and Class
Class Zero Beginning Emergent Fluent
1 67.6% 18.2% 13.4% 0.8%
2 41.3% 18.9% 35.0% 4.8%
As with English, we conducted further analyses of the performance categories in Kiswahili by
disaggregating the results by school type and gender. In general, these analyses were consistent with the
trends from the earlier analyses of average scores for the groups.

TUSOME REVISED BASELINE STUDY 26
By school type, the female pupils in the APBET schools had substantially fewer scores in the lower
categories and more scores in the upper categories than did the public schools. The percentages of pupils
with zero scores in the APBET schools were about 28 percent in Class 1 – as opposed to 69 percent in
the public schools – and about 7 percent in Class 2 – as opposed to 42 percent in the public schools.
Similarly, about 4 percent of the Class 1 scores in the APBET schools were in the fluent category – as
opposed to 1 percent in the public schools – and 17 percent of the Class 2 scores were in the fluent
category – as opposed to 5 percent in the public schools. The percentage of Class 1 pupils in the APBET
schools in the proficient (emergent and fluent) category was about 56 percent – as opposed to 13 percent
in the public schools – and the percentage in Class 2 was about 84 percent – as opposed to 35 percent in
the public schools (Table 30).
Table 30. Kiswahili ORF Scores by Performance Category, Class, and School Type
Class School Type Zero Beginning Emergent Fluent
1 Public 68.9% 17.9% 12.5% 0.7%
APBET 28.0% 26.7% 41.5% 3.8%
2 Public 42.3% 19.0% 34.2% 4.5%
APBET 6.8% 16.9% 59.8% 16.5%
By gender, the female pupils had slightly fewer scores in the lower categories and more scores in the
upper categories than did the male pupils. The percentages of pupils with zero scores were about 2
percent lower for females than males in Class 1 and about 5 percent lower for females than males in Class
2. Similarly, the percentages of pupils with fluent scores were about 1 percent higher for females than
males in Class 1 and about 3 percent higher for females than males in Class 2. When combining the two
upper categories (emergent and fluent), the percentage of proficient female pupils was about 5 percent
higher than males in Class 1 and also about 5 percent higher in Class 2 (Table 31).
Table 31. Kiswahili ORF Scores by Performance Category, Class, and Gender
Class Gender Zero Beginning Emergent Fluent
1 Male 68.6% 19.6% 11.5% 0.4%
Female 66.6% 16.8% 15.4% 1.2%
2 Male 43.6% 19.3% 33.6% 3.6%
Female 39.0% 18.5% 36.5% 6.1%
Question 3: What factors are associated with reading outcomes?
The following tables provide information on pupil, teacher, head teacher, and school variables and their
associations with reading outcomes (or ORF). The data presented are not comprehensive, but rather
selected for the purposes of this report. At the same time, there are some overlaps in the pupil, teacher,
and head teacher indicators. There are also some caveats in interpreting the survey data:
Some of the student groups and most of the teacher and head teacher groups had small sample
sizes, so any conclusions for those groups should be made with a high degree of caution.
Confounding may lead to inaccurate interpretations, e.g., a group of teachers with higher pupil
scores may teach pupils in urban areas who generally have higher scores.
Some of the group percentages do not sum to 100 percent, e.g., home language percentages were
based on responses to questions about individual languages (“Do you speak Kiswahili at home?).

TUSOME REVISED BASELINE STUDY 27
“Don’t know” or “Other” response categories often included invalid responses, so scores were not
reported for them, e.g., “Q: Do you practice silent reading at school?” A: I read at home.”
There are inconsistencies in similar questions asked of different kinds of respondents, e.g., teacher
and head teacher responses of whether schools had libraries had different percentages.
Pupils
These data are grouped into three tables: pupil characteristics, pupil reading and materials, and pupil-
school characteristics. Table 32 provides information on pupil characteristics. Note that the pupils’ socio-
economic status (SES) was based on responses to a series of 11 SES-related questions on the pupil survey.
Table 32. Pupil Characteristics
Characteristic Group
Class 1 Class 2
Percent English
ORF
Kiswahili
ORF Percent
English
ORF
Kiswahili
ORF
Age (in years)
Below 5 3.7% 2.6 1.0 0.8% 13.8 6.4
5-9 83.3% 14.4 6.6 77.8% 30.1 16.5
Above 9 13.1% 10.6 4.8 21.3% 20.1 11.2
Socio-economic
status (based on an
index with a scale
of 0 to 11)
Below 4 13.3% 7.5 3.7 9.9% 20.4 12.3
4-6 47.1% 11.9 5.5 52.4% 23.4 13.5
7-9 31.4% 13.7 6.1 32.6% 30.9 16.5
Above 9 8.2% 12.8 5.0 5.1% 28.8 13.7
Home language
Kiswahili 23.4% 17.4 8.1 22.8% 33.2 17.7
English 4.0% 25.5 10.9 3.6% 40.6 21.3
Other 64.4% 12.4 5.6 73.1% 25.4 14.4
School language
Kiswahili 61.1% 13.6 6.3 71.3% 27.0 15.1
English 23.7% 21.3 10.3 31.6% 37.2 19.7
Other 15.5% 6.3 2.5 12.4% 12.7 7.4
Pre-school
attendance
No 27.2% 13.7 6.5 -- -- --
Yes 72.8% 12.7 5.7 -- -- --
Pupils within the appropriate age range (ages 5-9) for both grade levels had higher ORF scores than either
the underage or overage pupils. The pupils in the upper part of the SES scale tended to have higher ORF
scores, though the differences were often small. The pupils with English as their main home and/or school
language had higher ORF scores. Pupils who attended pre-school did not have higher ORF scores (and the
question was only asked of the Class 1 pupils).
Table 33 has the results on pupil reading and materials. The “Yes” responses were generally associated
with higher passage reading scores. Having English and/or Kiswahili books at home were associated with
higher ORF scores. Having someone read aloud at home did not make a difference at for the Class 1
pupils but did for Class 2 pupils. Silent story reading at home, practice reading aloud to the teacher or
another pupil, and practice reading silently at school were all associated with higher ORF scores.

TUSOME REVISED BASELINE STUDY 28
Table 33. Pupil Reading and Materials
Question Response
Class 1 Class 2
Percent English
ORF
Kiswahili
ORF Percent
English
ORF
Kiswahili
ORF
Have English books
or other materials
at home?
No 43.5% 10.8 4.9 47.4% 23.5 13.4
Yes 48.8% 14.4 6.6 49.1% 29.3 15.7
Don’t know 7.6% -- -- 3.5% -- --
Have Kiswahili
books or other
materials at home?
No 42.6% 10.9 4.9 46.7% 22.4 12.6
Yes 50.3% 14.2 6.5 50.4% 30.2 16.5
Don’t know 7.1% -- -- 2.9% -- --
Someone reads
aloud to you at
home?
No 34.8% 12.6 5.9 38.9% 24.8 13.8
Yes 55.6% 12.9 5.8 55.6% 28.2 15.5
Don’t know 9.6% -- -- 5.5% -- --
Read stories at
home?
No 27.1% 7.9 3.4 27.7% 18.4 10.1
Yes 63.0% 15.1 7.0 66.6% 30.5 16.8
Don’t know 9.9% -- -- 5.7% -- --
Practice reading
aloud to teacher
or other pupil?
No 17.6% 7.0 2.9 13.6% 15.9 8.9
Yes 71.0% 14.5 6.6 79.3% 29.2 16.1
Don’t know 11.4% -- -- 7.0% -- --
Practice silent
reading at school?
No 22.5% 9.3 4.1 19.0% 22.9 12.5
Yes 64.4% 14.1 6.5 71.6% 28.4 15.7
Don’t know 13.1% -- -- 9.5% -- --
Teacher assigns
reading for you to
do at home?
No 29.3% 12.8 6.0 31.1% 24.3 13.4
Yes 60.8% 12.9 5.8 62.7% 28.2 15.6
Don’t know 9.9% -- -- 6.2% -- --
Table 34 has pupil-school characteristics. The pupils in the smaller-sized classes tended to have higher
ORF scores, with an anomaly for classes with 31 to 35 pupils. The lower scores of the pupils in the
smallest-sized classes may have been misleading due to the sample size. The pupils in the full-day shifts
tended to have higher scores than those in half-day shifts. The results from comparisons involving single-
grade vs. multi-grade classrooms were unstable due to small sample sizes for the multi-grade group.
Table 34. Pupil-School Characteristics
Characteristic Group
Class 1 Class 2
Percent English
ORF
Kiswahili
ORF Percent
English
ORF
Kiswahili
ORF
Class size
Below 21 3.3% 13.4 6.6 3.2% 28.0 16.5
21-25 4.2% 13.5 6.7 2.1% 25.1 14.6
26-30 5.8% 14.0 6.0 8.5% 30.2 18.0
31-35 9.7% 9.3 4.4 7.4% 19.5 12.0

TUSOME REVISED BASELINE STUDY 29
Table 34. Pupil-School Characteristics
Characteristic Group
Class 1 Class 2
Percent English
ORF
Kiswahili
ORF Percent
English
ORF
Kiswahili
ORF
36-40 5.7% 14.6 6.7 5.0% 38.2 20.9
Above 40 71.2% 11.8 5.3 73.9% 25.0 13.6
School shift Full day 83.0% 12.3 5.4 83.7% 26.5 14.7
Half day 16.9% 10.0 5.4 16.3% 20.1 11.2
Multi-grade
classrooms
No 99.4% 11.9 5.4 98.6% 26.0 14.5
Yes 0.6% 14.2 8.1 1.4% 12.5 4.0
Teachers
The data from the teacher questionnaires were organized into three tables: teacher characteristics,
teacher reading materials and instruction, and teacher-school characteristics. The teacher tables show the
percentages of teachers and/or responses in each category and the pupils’ ORF scores that relate to those
categories. Note that the number of teachers surveyed was relatively small, i.e., only about 200 per grade
level, so the findings in categories with low percentages of responses are less than reliable.
Table 35 has information on the teacher characteristics. The teachers’ gender appears to have an
influence on the ORF scores; the scores by the pupils who were taught by female teachers were much
higher than those taught by male teachers; some of the reason for this was likely that many of the female
teachers taught in urban areas where the pupil scores were generally higher (e.g., Central, Coast, and
Nairobi provinces had over 90 percent females).
The teachers’ highest qualification was related to the pupil scores in Class 1 and in Class 2. The pupils
taught by the teachers with the Certificate in Primary Teacher Education (P1) had lower scores in Class 1
and in Class 2. Again, perhaps the results are confounded by the urban-rural factor with more of the
teachers with higher qualifications are teaching in urban areas.
The teachers’ years of experience was somewhat related to their pupils’ ORF scores, though the trends
were not consistent. The pupils taught by the teachers with six to nine years of experience had the
lowest scores. There was less of a trend in teachers’ experience in the other categories.
Table 35. Teacher Characteristics
Characteristic Group
Class 1 Class 2
Percent English
ORF
Kiswahili
ORF Percent
English
ORF
Kiswahili
ORF
Gender Male 24.1% 4.9 2.4 20.5% 13.8 8.7
Female 75.9% 14.2 6.4 79.5% 29.3 15.9
Age
Below 30 10.5% 12.5 6.2 12.9% 27.8 15.8
30-39 29.7% 10.7 4.5 40.6% 21.1 12.0
40-49 37.2% 13.1 6.2 19.7% 35.5 18.5
Above 49 22.4% 11.5 4.9 24.9% 27.2 14.9
Missing 0.1% -- -- 1.9% -- --

TUSOME REVISED BASELINE STUDY 30
Table 35. Teacher Characteristics
Characteristic Group
Class 1 Class 2
Percent English
ORF
Kiswahili
ORF Percent
English
ORF
Kiswahili
ORF
Highest
qualification
Untrained 4.5% 16.1 6.1 5.1% 27.5 15.0
P1 (Cert.) 40.3% 9.0 3.9 39.9% 24.7 13.7
Diploma/S1 37.3% 13.9 6.5 34.8% 25.2 14.7
Bachelor’s 7.3% 13.0 6.9 6.5% 31.8 15.3
Other 10.5% 13.9 6.2 13.7% 29.2 15.3
Years of
experience
Below 6 12.6% 11.0 5.0 24.8% 23.7 13.6
6-9 18.6% 6.6 3.0 19.2% 19.4 10.5
10-19 22.7% 15.9 7.3 20.0% 28.4 15.5
20-29 33.8% 12.7 5.6 21.4% 32.2 17.8
Above 29 12.3% 11.9 5.6 14.5% 26.7 14.8
Table 36 shows the results from an analysis of teacher reading materials and instruction. The ORF scores
by pupils in schools that had classroom libraries were much higher than schools that had school libraries
or no libraries (which was the majority of schools). Of the schools that had libraries, the scores by pupils
who visited those libraries were higher. If a pupil could borrow books, the scores were lower.
For the teachers who used books other than textbooks (i.e., additional or supplemental books) for
instruction, the ORF scores of their pupils were higher, particularly in Class 1. The scores of pupils whose
teachers who gave them extra time for remediation tended to have higher scores than those whose
teachers did not remediate. The scores in classrooms where the teachers did not have teachers’ guides
for reading were slightly higher, though this was a small percentage of the total number of teachers.
For teacher observation visits, there was no clear pattern of whether more visits were associated with
higher pupil ORF scores. For Class 1 teachers, it appears that more frequent visits are associated with
better pupil ORF scores but not for Class 2 teachers. For in-service teacher training, the frequency of the
trainings did not show a trend with pupils’ ORF scores, though perhaps more training of teachers in
English may have helped with pupils’ English ORF scores. For those teachers who said that they learned
how to teacher reading during the in-service workshops, the scores of their pupils were higher. Teachers
who used workbooks (or exercise books) to assess pupils tended to show higher pupil scores, particularly
in Class 2. Only a small percentage of teachers said that they used homework to assess their pupils. The
majority of teachers said that they used oral assessments to measure pupils’ progress.
Table 36. Teacher Reading Materials and Instruction
Question Response
Class 1 Class 2
Percent English
ORF
Kiswahili
ORF Percent
English
ORF
Kiswahili
ORF
Have a functioning
library?
No 60.1% 12.2 5.4 64.5% 26.1 14.7
In school 35.8% 10.7 5.0 31.8% 22.2 12.3
In classroom 1.4% 21.8 11.1 2.7% 62.4 30.5
In both 2.6% 19.0 7.4 1.0% 49.4 23.9

TUSOME REVISED BASELINE STUDY 31
Table 36. Teacher Reading Materials and Instruction
Question Response
Class 1 Class 2
Percent English
ORF
Kiswahili
ORF Percent
English
ORF
Kiswahili
ORF
Pupils visit the
library?
No 20.5% 10.0 4.3 17.7% 20.9 11.8
Yes 19.4% 13.4 6.5 17.8% 31.2 16.2
Skipped 60.1% -- -- 64.5% -- --
Pupils borrow
books from the
library?
No 18.2% 16.1 7.3 13.0% 33.1 17.3
Yes 21.7% 8.0 3.8 22.5% 21.9 12.1
Skipped 60.1% -- -- 64.5% -- --
Use books other
than textbooks?
No 31.4% 9.5 4.0 18.7% 24.6 13.2
Yes 68.6% 13.1 6.0 81.3% 26.5 14.7
Give extra time for
remediation?
No 7.4% 8.2 4.2 11.3% 12.1 7.9
Yes 92.6% 12.3 5.5 88.7% 27.9 15.3
Teacher guides for
teaching reading?
No 4.0% 15.5 7.2 10.7% 27.3 16.3
Yes 96.0% 11.8 5.3 89.3% 26.0 14.2
Frequency of
observations from
head teacher, TAC
tutor, or district
official?
Never 3.8% 16.4 7.0 10.0% 24.3 13.9
1 / week 32.8% 14.1 6.4 30.8% 23.8 13.3
1 / month 30.6% 12.9 5.8 28.8% 25.6 15.0
1 / term 26.8% 8.3 4.2 24.0% 32.4 16.7
Other 6.0% -- -- 6.4% -- --
Frequency of in-
service training in
past two years?
None 17.3% 14.8 6.3 41.0% 23.6 13.8
One 34.0% 10.4 5.0 26.8% 24.5 13.3
Two 29.5% 10.7 5.0 19.4% 26.7 14.9
Three 14.6% 12.6 5.6 10.8% 36.9 18.2
Other 4.5% -- -- 1.9% -- --
Learn to teach
reading during the
training?
No 2.0% 3.9 1.1 13.4% 18.1 11.2
Yes 80.7% 11.6 5.3 45.5% 30.7 16
Skipped 17.3% -- -- 41.0% -- --
Method used most
often to measure
pupils’ progress?
Written 31.5% 10.6 4.7 33.8% 25.1 13.7
Oral 59.1% 12.4 5.7 53.2% 24.5 13.7
Workbook 7.3% 13.5 5.9 11.2% 34.3 19.7
Homework 2.0% 13.3 4.4 1.4% 29.1 13.4
Table 37 has information on school shift and multi-grade classes. The pupils in the full-day and half-day
shifts had about the same scores in Class 1 but those in full-day shifts did better in Class 2. Note that the
results on school shift were somewhat different when pupils were asked the same question about their
shifts (see Table 34: Pupil-School Characteristics). Teachers in multi-grade classrooms had generally
higher pupil scores than teachers in single-grade classrooms (except for Class 1 English). These results
were somewhat different when the pupils were asked the same question, both in terms of percentages of
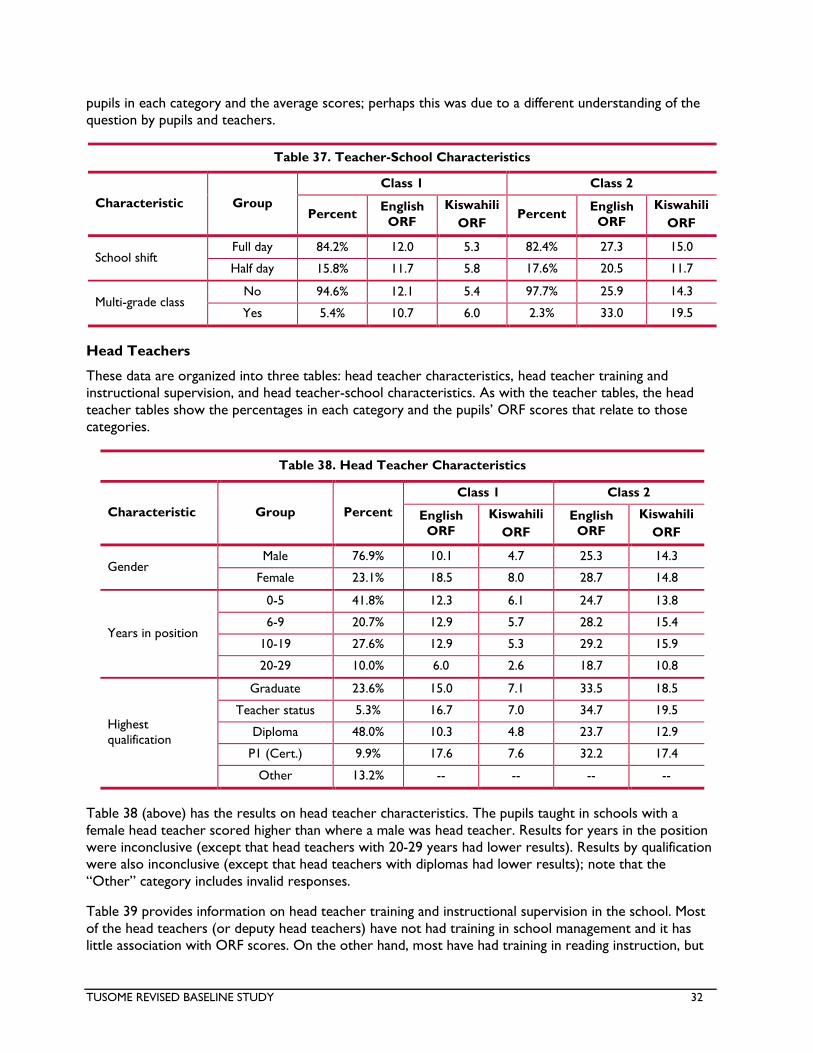
TUSOME REVISED BASELINE STUDY 32
pupils in each category and the average scores; perhaps this was due to a different understanding of the
question by pupils and teachers.
Table 37. Teacher-School Characteristics
Characteristic Group
Class 1 Class 2
Percent English
ORF
Kiswahili
ORF Percent
English
ORF
Kiswahili
ORF
School shift Full day 84.2% 12.0 5.3 82.4% 27.3 15.0
Half day 15.8% 11.7 5.8 17.6% 20.5 11.7
Multi-grade class No 94.6% 12.1 5.4 97.7% 25.9 14.3
Yes 5.4% 10.7 6.0 2.3% 33.0 19.5
Head Teachers
These data are organized into three tables: head teacher characteristics, head teacher training and
instructional supervision, and head teacher-school characteristics. As with the teacher tables, the head
teacher tables show the percentages in each category and the pupils’ ORF scores that relate to those
categories.
Table 38. Head Teacher Characteristics
Characteristic Group Percent
Class 1 Class 2
English
ORF
Kiswahili
ORF
English
ORF
Kiswahili
ORF
Gender Male 76.9% 10.1 4.7 25.3 14.3
Female 23.1% 18.5 8.0 28.7 14.8
Years in position
0-5 41.8% 12.3 6.1 24.7 13.8
6-9 20.7% 12.9 5.7 28.2 15.4
10-19 27.6% 12.9 5.3 29.2 15.9
20-29 10.0% 6.0 2.6 18.7 10.8
Highest
qualification
Graduate 23.6% 15.0 7.1 33.5 18.5
Teacher status 5.3% 16.7 7.0 34.7 19.5
Diploma 48.0% 10.3 4.8 23.7 12.9
P1 (Cert.) 9.9% 17.6 7.6 32.2 17.4
Other 13.2% -- -- -- --
Table 38 (above) has the results on head teacher characteristics. The pupils taught in schools with a
female head teacher scored higher than where a male was head teacher. Results for years in the position
were inconclusive (except that head teachers with 20-29 years had lower results). Results by qualification
were also inconclusive (except that head teachers with diplomas had lower results); note that the
“Other” category includes invalid responses.
Table 39 provides information on head teacher training and instructional supervision in the school. Most
of the head teachers (or deputy head teachers) have not had training in school management and it has
little association with ORF scores. On the other hand, most have had training in reading instruction, but

TUSOME REVISED BASELINE STUDY 33
the scores by pupils in those schools are lower. There is little relationship between the frequency of
observing teachers within the school and scores. With checking lesson plans, the highest scores appear to
be with the schools that check plans between once per week and once per month. With teachers at the
school receiving training in teaching reading skills, the trend is for higher scores if more of the teachers at
the school have received training.
Table 39. Head Teacher Training and Instructional Supervision
Question Group Percent
Class 1 Class 2
English
ORF
Kiswahili
ORF
English
ORF
Kiswahili
ORF
Training in school
management?
No 65.3% 11.3 5.3 27.6 15.2
Yes 34.6% 12.3 5.5 25.2 14.0
Training in reading
instruction?
No 72.2% 14.5 6.6 31.4 16.3
Yes 27.8% 11.0 5.0 23.9 13.7
Frequency of
observing teachers
per term?
Never 5.9% 5.8 2.8 24.3 13.7
1 x 32.4% 10.0 4.9 25.8 15.0
2 x 24.1% 13.8 6.4 29.1 15.7
3 x or more 33.8% 12.5 5.2 23.8 12.8
Other 3.7% -- -- -- --
Frequency of
checking teachers’
lesson plans?
1 x per 2 months+ 13.4% 8.4 3.3 21.3 12.2
1 x month 27.9% 12.4 5.7 28.4 15.8
1 x per 2 weeks 17.7% 14.1 6.8 27.5 15.8
1 x per week 31.6% 13.5 6.0 27.9 14.9
1 x per day 6.4% 7.0 3.3 11.5 5.8
Other 3.0% -- -- -- --
Teachers at school
who have received
training in teaching
reading skills?
Some 82.5% 10.5 4.8 24.4 13.9
Most 5.4% 16.3 6.7 32.0 16.0
All 11.5% 21.3 9.5 35.2 17.0
Other 0.6% -- -- -- --
Table 40 has head teacher-school characteristics. A school timetable that includes teaching reading is
positively associated with higher ORF scores. There is a clear trend that more periods in the week for
teaching reading are also associated with higher reading scores, particularly if there are at least 5 periods
per week in the timetable. There is no difference in scores for Class 1 pupils if the school has a
functioning school library; however, Class 2 pupils in schools with a library have lower scores. The
differences from having a parent-teacher association are small. Schools with electricity, a feeding program,
and a computer room do not have higher scores than schools without these features.

TUSOME REVISED BASELINE STUDY 34
Table 40. Head Teacher-School Characteristics
Question Group Percent
Class 1 Class 2
English
ORF
Kiswahili
ORF
English
ORF
Kiswahili
ORF
School timetable
includes teaching
reading?
No 13.3% 7.2 3.3 23.9 13.7
Yes 85.7% 12.7 5.7 31.4 16.3
No timetable 1.0% -- -- -- --
Number of periods
in timetable per
week for teaching
reading?
0 to 2 27.8% 9.3 4.5 21.2 12.4
3 to 4 17.6% 10.7 4.7 22.3 11.4
5 or more 39.6% 15.4 6.9 32.8 17.9
No response 15.1% -- -- -- --
Functioning library
in school?
No 78.1% 12.1 5.5 27.6 15.4
Yes 21.9% 11.5 5.1 20.5 11.2
Parent-Teacher
Association (PTA)?
No 11.6% 12.6 5.5 28.2 16.4
Yes 88.4% 11.9 5.4 25.8 14.2
Electricity? No 31.7% 10.4 4.7 22.2 12.8
Yes 68.3% 12.8 5.8 27.9 15.2
Feeding program? No 52.9% 12.0 5.1 26.6 14.6
Yes 47.1% 12.0 5.8 25.5 14.2
Computer room? No 60.4% 12.1 5.7 25.4 14.4
Yes 39.6% 11.7 5.0 27.1 14.5
Conclusions
Conclusions from the revised EGRA baseline for Classes 1 and 2 and the surveys for pupils, teachers, and
head teachers are presented below using the same topic order as in the report. The methodology
conclusions include sections on validity, sampling, data collection, data analysis, reliability, and subtask
quality. The findings conclusions include sections on reading levels, reading grade-level text, and factors
associated with reading.
Methodology
Validity: The tools were developed with close collaboration between the MOEST and MSI. Validity was
ensured through following the model from the PRIMR endline assessment, with modifications suggested
by the local reading specialist, the tools development team, and the MOEST. For instance, a second
passage was added to the English part of the pupil assessment to reflect a recommendation by the MOEST
to test silent reading and comprehension. A total of 14 subtasks – eight in English and six in Kiswahili –
were developed for the assessment and three questionnaires – for pupils, teachers, and head teachers –
were developed for the survey.
Sampling: School lists from RTI provided the sampling frame and power calculations by MSI
psychometricians provided a sample size that met statistical requirements. The target was 204 schools
(174 public and 30 APBET) with 12 pupils per grade level in 26 out of the 47 counties. After randomly
selecting the schools according to the criteria, the MOEST sent notifications to the counties and districts

TUSOME REVISED BASELINE STUDY 35
so the QCOs could make advance visits to make contact with the officials and verify the information on
the school lists. During data collection (13 to 29 July), the field teams reached high percentages of targets
in the sample: 100 percent of the schools, 99 percent of the pupils, 94 percent of the teachers, and 98
percent of the head teachers. Coverage of sample counties and schools was sufficient to permit
generalization of results to the national level.
Data Collection: The tools were administered in the field following a strong training, supervision, and
quality control model. The data were collected by tablets and uploaded using a specially built application
that provided for daily checks of counts from field-based QCOs and downloads from a cloud server. This
allowed for quick adjustments based on real-time data. For instance, there were some initial instances of
data gaps due to uploading issues but these were corrected through changes in SIM cards, additions of
local hot spots, and more frequent Wi-Fi connections. The assessment coordinator managed all data
collection operations, along with the RSA research coordinator.
Data Analysis: The statistician and psychometricians conducted the data analysis using the file that was
produced using the tablets and cloud server. After calculating the sampling weights, the statistician
produced Stata code to generate a series of data tables in Excel that included descriptive and inferential
statistics for all tools and surveys. The psychometricians provided quality assurance for the analysis. Key
descriptive statistics from the pupil assessments and the surveys, along with some of the inferential
statistics from the assessments, were presented in this report. Additional analyses produced by the team
are available upon request. The pupil, teacher, and head teacher tools and data sets have been submitted
to USAID/Kenya.
Reliability: The main indicator for reliability of the assessment was Cronbach’s alpha, which estimates the
internal consistency reliability of a particular test administration. Values of 0.80 and above are considered
acceptable. The statistician calculated Cronbach’s alpha separately for each language and grade level. For
English, the values were 0.92 for Class 1 and 0.92 for Class 2; for Kiswahili, the values were 0.89 for Class
1 and 0.90 for Class 2. All of the estimates indicated strong reliability. The statistician also calculated alpha
coefficients for the untimed subtasks, i.e., by treating each subtask as its own test. With subtasks, values of
0.70 and above are considered acceptable. All of the subtasks on both the English and Kiswahili parts of
the assessment exceeded this minimum level.
Subtask Quality: In order to estimate the quality of the subtasks, or the ability of the subtasks to
discriminate between high and low achievers, the statistician calculated subtask-total correlations.
Subtasks are considered as having acceptable quality if this correlation is 0.20 and above. For English and
Kiswahili, all of the subtasks had subtask-total correlations well above 0.20, indicating high quality.
In summary, the revised baseline activity was successful in collecting and analyzing the data, with a high
level of quality in the data sets and in the results. Much of this was due to strong cooperation throughout
the processes of tools development and data collection on all sides – MOEST, USAID, RTI, RSA, and
(most importantly) the head teachers, teachers, and pupils in the schools.
Findings
Reading Levels: The scores at baseline on the reading tasks were generally low in both English and
Kiswahili. Many of the phonics-related tasks and the reading comprehension tasks were difficult for pupils
in Classes 1 and 2, as well as in both languages.
In English, the Class 1 pupils were able to answer correctly about 1 out of 10 phoneme segmentation
items, 16 out of 100 letter sounds, 6 out of 50 non-words, 6 out of 20 vocabulary items, and 1/2 out of 5
reading comprehension questions. The Class 2 pupils were able to answer about 1 out of 10 phoneme
segmentation items, 11 out of 100 letter sounds, 11 out of 50 non-words, 9 out of 20 vocabulary items,

TUSOME REVISED BASELINE STUDY 36
and 2/3 out of 5 reading comprehension questions. Class 1 pupils were only able to read about 11 to 12
CWPM. Class 2 pupils read better, at about 24 to 26 CWPM.
In Kiswahili, the Class 1 pupils were able to answer correctly about 18 out of 100 letter sounds, 12 out of
100 syllables, 5 out of 50 non-words, 1/2 out of 5 comprehension questions, and 1 out of 5 listening
comprehension questions. The Class 2 pupils were only able to answer correctly about 17 out of 100
letter-sounds, 22 out of 100 syllables, 11 out of 50 non-words, 1 out of 5 reading comprehension
questions, and 2 out of 5 listening comprehension questions. Class 1 pupils were only able to read about 5
CWPM. Class 2 pupils read better, at about 14 CWPM.
In comparing Class 1 with Class2, one additional point of interest is that the Class 2 pupils did better than
the Class 1 pupils on all subtasks except for phoneme segmentation and letter sound knowledge; this
indicated that the Class1 pupils likely benefitted from project interventions at the early stages of
implementation.
For both languages, the pupils in the APBET schools had higher scores than the pupils in the public
schools. Females scored better than males on most of the subtasks, though the differences were often
small, particularly on phoneme segmentation, vocabulary, and comprehension.
Reading Grade-Level Text: Based on the performance categories (or benchmarks) set by the MOEST,
KNEC, and RTI during the PRIMR pilot, the percentages of pupils who could read grade-level text fluently
were low. Only about 3 percent of the Class 1 pupils demonstrated fluency in English and about 1 percent
in Kiswahili. This was higher at Class 2, with about 14 percent of pupils demonstrating fluency in English
and 5 percent in Kiswahili. In addition, large percentages of pupils were non-readers. About 50 percent of
the Class 1 pupils count not read a single word correctly in English and about 68 percent in Kiswahili. In
Class 2, the figures were better, with about 36 percent non-readers in English and about 41 percent in
Kiswahili. When examining the results by school type and gender, the trends were similar to those when
analyzing the average scores, with APBET schools having substantially more scores in the upper
performance categories than public schools, and female pupils having slightly more scores in the upper
categories than male pupils.
Factors Associated with Reading: With the survey data, the statistician generated tables with percentages
of pupils, teachers, and head teachers in each category along with the average ORF scores for the pupils
in those categories. These findings were presented with some degree of caution due to the small sample
sizes (especially for teachers and head teachers) and the issue of confounding, e.g., interpreting scores as
associated with a particular variable (e.g., teacher gender) while in fact it is another variable that is
overriding the variable of interest (e.g., more female teachers assigned to urban schools, which tend to
score higher).
We found higher scores for pupils who 1) were the correct age at school, and not underage or overage;
and 2) had books at home and who practiced reading at home and school. We found higher scores for
the pupils taught by teachers who 1) used a classroom and/or school library with the pupils; and 2) had
participated in more frequent in-service training. We found higher scores for the pupils in schools lead by
head teachers with 1) more periods on the timetable for teaching reading; and 2) more of the teachers
were trained in teaching reading.
Recommendations
These recommendations are limited to technical points for designing and implementing the
midline/endline evaluations. We are generally recommending that the midline/endline evaluations follow
similar procedures to those used on the baseline since these results are valid and reliable, and due to the

TUSOME REVISED BASELINE STUDY 37
need to ensure consistency in the EGRA methods between baseline and midline/endline. The
recommendations are presented in these sections: team, capacity building, timing, grade levels, sampling,
tools and questionnaires, data collection, data analysis, and reporting.
Team: Interactions between MOEST, USAID, RTI, and MSI – which were critical at baseline – should be
repeated at midline/endline. Similarly, the management and technical structures of the evaluation partner
should be replicated, including these national and international positions: assessment specialist, assessment
coordinator, reading specialist, psychometricians, statistician, master trainers, quality control officers, IT
specialists, project managers, and project associates.
Capacity Building: An adjustment to the interactions and implementation, however, should be made so
that greater capacity building takes place for the MOEST. Ideally, substantial capacity should be built at the
midline so that MOEST specialists can provide a local government management structure and increased
technical support at endline. If possible, MSI’s institutional memory should be accessed at midline/endline.
Timing: As stated in the USAID 2014 Update to Education Strategy Reporting Guidance, it is important to
maintain the same timing of the data collection from one phase to another. Since the data for this revised
baseline were collected in the second half of July 2015, any subsequent data collections should take place
at the same time point in the year, i.e., at the end of the second term. As always, the activity will require
advance planning, so approvals and validations from the MOEST will need to be obtained well in advance
of the planned dates for the data collection.
Grade Levels: Data at midline/endline should be collected in the same grade levels as before, i.e., Classes 1
and 2. This will follow the cross-sectional design of the evaluation, which will compare Class 1 in 2015
with Class 1 in subsequent years, and the same for Class 2. While the Tusome project or other research
efforts may want to follow a cohort of pupils as they progress into Classes 3 and above, these pupils are
not part of the external evaluation as designed.
Sampling: The sampling design that was developed and implemented for the revised baseline provided for
adequate national representation and statistical power so that results could be 1) generalized to the
population of schools and 2) used for comparisons between the baseline (pre-test) and midline/endline
(post-test). A recommendation is to maintain the same sample in subsequent phases. In other words, the
data collection for the midline/endline should take place in the same 204 schools, with random samples of
12 pupils per grade level, and surveys administered to pupils, teachers (1 per grade level), and head
teachers (1 per school). Note that different pupils will be sampled due to the cross-sectional design.
Tools and Questionnaires: The tools and questionnaires for the midline/endline should be essentially the
same as those used for the revised baseline. The same subtasks should be included on the midline/endline
forms. The differences in the tools should be such that the subtasks are modified but with the same kinds
of content as included on the baseline tools. The reason for making these modifications is test security,
i.e., making sure that the tests are not exactly the same as those for the baseline in case the content of
the subtasks is leaked to the schools and communities. To facilitate these modifications, the timed tasks
may be scrambled so that the same letter sounds, syllables, and invented/non-words are used. The
untimed tasks should be changed. Modification to the phoneme segmentation and vocabulary items may
be minor. We will need new reading passages, reading comprehension questions, and listening
comprehension questions (and a different accompanying passage). These new tasks should be piloted, at
which point the evaluation partner will need to conduct statistical test equating so that any differences in
difficulty of the baseline and midline/endline tasks will be taken into consideration when calculating
improvements from the baseline to the midline/endline. The survey instruments should have the same
questions so that the midline/endline results can be comparable.

TUSOME REVISED BASELINE STUDY 38
Data Collection: If possible, we recommend using a local data collection firm that has similar (or better)
capabilities to the data collection firm used in the baseline. Training programs should be the same. Prior
to data collection, a school verification process similar to the one that took place at baseline may not be
needed at midline/endline. The evaluation partner may want to institute coordination meetings with
county and district officials to reorient them on the nature and purpose of the activity. Procedures
involving contacts with head teachers in advance of the data collection should be repeated. Security
precautions taken at baseline should be repeated, and perhaps improved or modified if conditions in the
field change prior to midline/endline. The data collection application should also be the same, though
some improvements in the functioning of the application may be made, if needed. A recommendation for
the application, and for the data collection itself, would be to add a function that allows for IRR in the
field. This would provide for a check on the consistency of the responses recorded by the enumerators
during the actual data collection.
Data Analysis: The same data analysis procedures should be followed. The data will need to be uploaded
from tablets to a cloud server, which will facilitate the creation of an analysis data file. Then, it should be
possible for the evaluation partner’s statisticians and psychometricians to repeat the processes using the
same Stata code as that used for the baseline. These kinds of processes will reduce error and improve the
comparability of the baseline and midline/endline data sets.
Reporting: It would be advisable to follow the same structure when producing the midline/endline
technical reports so that experienced stakeholders can more readily follow the tables and text. The
revised baseline draft report was produced slightly more than two months after the end of data
collection, which should also be possible for the midline/endline reports, though additional analyses will
need to take place so that the baseline and midline/endline findings can be compared.
In summary, given the positive experiences with the revised baseline, the systems and structures should
be repeated as much as possible – with lesson learned and increased hands-on involvement of the MOEST
– so that the implementation of the midline/endline evaluations can be successful.

TUSOME REVISED BASELINE STUDY 39
ANNEXES
Annex 1: Activity Work Plan
Activity Objectives Expected Outcomes
Sub-Activities Due
Preliminary and Start-up Activities
Review of Previous EGRA
Review data analysis and discuss findings
Decision on implementing revised baseline
Communicate with USAID and internally at MSI On-going
Review data analysis from previous EGRA 1-Jun-15
Develop preliminary work plan and budget 1-Jun-15
Planning for Staffing and Subcontracting
Determine HO and FO staffing and local subcontracting scope
Draft plans for staffing and subcontracting
Develop draft plan for HO staffing 29-May-15
Develop draft plan for FO staffing 1-Jun-15
Develop draft plan for subcontracting for data collection 1-Jun-15
Finalize draft plans for staffing and subcontracting 2-Jun-15
Decision-making on EGRA Baseline
Determine internal recommendation and make decision with USAID
Decision with USAID on implementing revised baseline
Take internal decision on recommendation for USAID 22-May-15
Discuss with USAID (in person and via teleconference) 22-May-15
Make decision on implementing a revised baseline 22-May-15
Activity Planning
Determine activities, sequencing, and timeline
Finalize activities and timeline for revised baseline
Discuss activities and timeline with USAID 22-May-15
Discuss revised baseline with Tusome contractor 22-May-15
Discuss support plan from FO and finalize travel for PM 29-May-15
Finalize activities and timeline 1-Jun-15
Pilot Assessments - Grades 1 and 2 - English and Kiswahili - Student Test + Questionnaires
Subcontractor Selection
Determine local organization best equipped to support data collection
Field support for data collection decided
Develop TOR for subcontractor data collection 29-May-15
Issue TOR and review RFQ 5-Jun-15
Finalize contract with subcontractor 17-Jun-15
Recruit enumerators and supervisors 19-Jun-15
Tools Development Workshop + Validation Meeting with MOEST
Develop/revise grade 1 and grade 2 EGRA pilot tools
1) Grade 1 and Grade 2 English and Kiswahili EGRA pilot tools developed; 2) Student and teacher questionnaires developed
Draft SOW staff/Request recommendations from Tusome 1-Jun-15
Recruit Reading/Language expert (1) + QCO (X4) 3-Jun-15
Confirm venue for workshop (KSP offices) 5-Jun-15
Finalize contracts for Reading/Language Experts + QCOs 5-Jun-15
Confirm MOEST participation for validation meeting 5-Jun-15
Finalize all materials for workshop 9-Jun-15
Finalize travel plans for MSI HO 1-Jun-15
Hold tools development workshop (11 to 12 June) 12-Jun-15
Tools validation meeting with MOEST (15 June) 15-Jun-15
Orientation of MTs/QCOs for Tools Piloting (Field Testing)
Train EGRA Master Trainers and Quality Control Officers
MTs and QCOs trained in EGRA implementation and quality control
Finalize all EGRA pilot tools 17-Jun-15
Finalize application for EGRA data capture 17-Jun-15
Finalize all procurement of tablets and accessories 19-Jun-15
Upload forms onto tablets 17-Jun-15
Finalize the selection of pilot schools (12 schools) 18-Jun-15
Obtain approvals (letters) from MOEST 19-Jun-15
Finalize schedule of school visits for pilot 19-Jun-15
Arrange transportation and lodging for QCOs 19-Jun-15
Training of Enumerators for Piloting (Field Testing)
Train enumerators Enumerators trained in EGRA implementation
Recruit enumerators (X12) 19-Jun-15
Finalize contracts for enumerators 19-Jun-15
Arrange transportation and lodging to workshop 19-Jun-15
Identify 1 school for practice + contact head teacher 19-Jun-15
Confirm venue for training workshop (RSA offices) 17-Jun-15
Finalize all logistics and materials 19-Jun-15
Finalize training schedule 13-Jun-15
Conducting training of enumerators (22 and 23 June) 23-Jun-15
Pilot Data Collection (Field Testing)
1) Field test EGRA pilot tools; 2) Test training models
1) EGRA tools field tested; 2) Data collection training reviewed
Finalize all travel and lodging logistics for staff 19-Jun-15
Provide list of materials required for piloting 16-Jun-15
Finalize all procurement of materials 19-Jun-15
Collect pilot data (field testing) (24 to 26 June) 26-Jun-15
Pilot Data Cleaning, Analysis, and Reporting
Analyze results of pilot tests and questionnaires
1) Pilot results analyzed; 2) Recommendations made for tools
Check data quality and uploading (ongoing) 26-Jun-15
Clean and analyze data; write pilot reports 28-Jul-15
Develop recommendations for tools based on pilot data 29-Jul-15
TUSOME REVISED BASELINE STUDY 40

TUSOME REVISED BASELINE STUDY 41
Activity Objectives Expected Outcomes
Sub-Activities Due
Revision and Finalization of EGRA Tools
Finalize EGRA tools for operation testing
1) EGRA tools reviewed and finalized; 2) Recommendations for adjustments to processes
Recruit QCOs for operational testing (X8); finalize contracts
26-Jun-15
Finalize all materials for review 26-Jun-15
Finalize tools for operational testing 2-Jul-15
Upload forms onto tablets and review/pilot 3-Jul-15
Operational Assessments - Grades 1 and 2 - English and Kiswahili - Student Test + Questionnaires
Sample School Selection
Obtain approval for operational sample schools
Operational sample schools selected and approved by MOEST
Finalize the selection of operational sample schools 19-Jun-15
Communicate school lists to MOEST for concurrence 24-Jun-15
Verify and notify sampled schools (MOEST) 3-Jul-15
Orientation of MTs/QCOs for Operational Testing
Train EGRA Master Trainers and Quality Control Officers
MTs and QCOs trained in EGRA implementation and quality control
Arrange transportation and lodging to workshop 1-Jul-15
Confirm venue for training workshop 26-Jun-15
Finalize all logistics and materials for training of MTs/QCOs
2-Jul-15
Finalize training schedule 1-Jul-15
Conducting orientation for MTs/QCOs (6 and 7 July) 7-Jul-15
Training of Enumerators for Operational Testing
Train full cadre of Enumerators
Enumerators trained in EGRA implementation
Identify 4 schools for practice and contact Head Teachers 26-Jun-15
Confirm venue for training workshop (3 rooms) 1-Jul-15
Recruit enumerators (X72) and supervisors (X8) 1-Jul-15
Finalize all logistics and materials 2-Jul-15
Finalize training schedule 2-Jul-15
Conducting training of enumerators (8 to 11 July) 11-Jul-15
Operational Data Collection
Collect baseline data in sample schools
Student, teacher and school data collected in sample schools
Obtain permission letters from MOEST 28-Jun-15
Finalize operational school visit plan (teams and schedule)
3-Jul-15
Finalize all travel and lodging logistics for QCOs 3-Jul-15
Provide list of materials required for operational testing 26-Jun-15
Finalize all procurement of materials 3-Jul-15
Conduct operational data collection (13 to 31 July) 31-Jul-15
Operational Data Cleaning and Analysis
Clean and analyze results of operational testing data
Operational testing results cleaned and analyzed
Check data quality and uploading (ongoing) 31-Jul-15
Develop data analysis plan 31-Jul-15
Conduct data analysis 11-Sep-15
Operational Data Reporting and Dissemination
Produce technical report(s) and disseminate findings
Operational testing results reported and disseminated
Produce reporting template 1-Sep-15
Write draft technical report(s) 30-Sep-15
Validate findings with MOEST and USAID Oct-15

TUSOME REVISED BASELINE STUDY 42
Annex 2: Descriptions of the English and Kiswahili Subtasks
Some of the subtasks were administered in both languages and others in either English or Kiswahili. All of
these subtasks are briefly described below, with information on the possible number correct per subtask.
The total numbers of subtasks were eight in English and six in Kiswahili.
English and Kiswahili *
The letter sound knowledge subtask measures a pupil’s ability to identify the sounds of written letters.
Pupils are given one minute to identify 100 letter sounds. It is measured as the number correct out of 100
letter sounds.
The invented/non-word decoding subtask measures a pupil’s ability to pronounce (read) unfamiliar
written words. Pupils are given 50 non-words to read within one minute. It is measured as the number
correct out of 50 words.
The passage reading subtask measures oral reading fluency (ORF), i.e., the ability to read text with
accuracy and speed. Pupils are given a short passage (60 to 70 words) to read within one minute. ORF is
calculated as the number of correct words read per minute (CWPM).
The reading comprehension subtask measures a pupil’s ability to answer comprehension questions
based on a story they have just read. Pupils are asked up to six comprehension questions. It is calculated
as the number correct out of six questions.
English Only
The phoneme segmentation subtask measures a pupil’s ability to identify individual phonemes (sounds)
in spoken words. Pupils are given ten words, one after the other, and are asked to say the sounds they
hear in the word: e.g. cat = /k//a//t/. It is measured as the number correct out of ten words.
The vocabulary subtask measures a pupil’s ability to understand the meaning of common spoken words.
It is measured as the number correct out of 20 vocabulary items.
Kiswahili Only
The syllable fluency subtask measures a pupil’s ability to identify written syllables. Pupils are given one
minute to identify 100 syllables. It is measured as the number correct out of 100 syllables.
The listening comprehension subtask measures a pupil’s ability to understand a simple story read out
loud by the enumerator. Pupils are asked five listening comprehension questions based on the story. It is
measured as the number correct out of five questions.
* Note that, for English, the pupils were administered two sets of reading passages and comprehension questions (A and B). Passage A was
traditional in that the pupils had one minute to read the passage aloud, the passage was removed from them, and then they were asked the comprehension questions. For Passage B, the pupils had one minute to read the passage aloud, another minute to read the passage silently, the
passage was left in front of them, and then they were asked the comprehension questions. The goal of the second passage was to assess the pupils using a subtask that would reflect a key type of reading instruction on the project. The second set increased the total number of English subtasks to eight.

TUSOME REVISED BASELINE STUDY 43
Annex 3: Modifications to the English and Kiswahili Subtasks
Modifications before Piloting during the First MOEST Workshop (June 2015)
English Passage B
Addition was made to include a second passage in response to MOEST concerns that the method of
reading a passage three times – teacher reads, student reads, teacher and student read together (I, you,
we) – was not being tested. The MOEST wanted to keep the current passage (Passage A) but add a
second passage (Passage B) to reflect the method. Passage B has these instructions:
Pupil reads the passage aloud (with scoring by the enumerator)
Pupil reads the passage silently (without scoring by the enumerator)
Enumerator asks comprehension questions while pupil maintains access to the passage
Changes were made to the wording of a few comprehension questions, with no shifts in meaning.
Kiswahili Instructions
Modifications were made to the Kiswahili equivalents of “story, question, answers” and “correct,
incorrect, no response.”
Kiswahili Syllables
Replacements were made to consonants – while keeping the same vowel sounds – due to confusion about
the “m” sound.
Student Survey
Revisions were made from “Is there a toilet inside your home?” to "Is there a toilet at your home?”
Modifications after Piloting prior to the Second MOEST Workshop (July 2015)
English Phoneme Segmentation
Changes were made as follows: 'Ray' was changes to 'may'; then 'make' was changed to 'bake' to avoid
repetition of 'm' in initial position; 'life' was changed to 'lice' to make it more accessible.
English Passage A
Modifications were made to the text (last box): "The tin is near the cat. It has no lid and no milk. Ben is
very sad." The related question was changed to: "Where did the milk go?"
Kiswahili Passage
Modifications were made to the text (last box): "Sungura akaruka juu ya mchanga, akamrushia kobe
mchanga machoni. Kobe hakumwona Sungura akitoroka." (“The hare jumped onto the soil and splashed
soil into tortoise's eyes. Tortoise did not see hare escape.”) The related question was changed to: "Kwa
nini kobe hakumwona sungura akirotoka?" (“Why didn't tortoise see the hare escaping?”).
Modifications after Piloting during the Second MOEST Workshop (July 2015)
Consent Text
Added the question: "Do you want to play the game?"
Reading Passages
Revised the instructions to read: "Read the story pointing with your finger..."
Student Survey
Added two questions (to capture diversity in Kenya), one on “lamp” another on “domestic animals.”
Removed two questions (to reduce the length), one on “Internet” another on “refrigerator.”

TUSOME REVISED BASELINE STUDY 44
Annex 4: Psychometric Analyses
Pearson correlation coefficients were calculated among the subtasks to indicate the consistency of
performance by the subtasks on the test. Strong correlations are ideal because they indicate a high degree
of consistency. Correlations that are too strong may indicate too much repetition across subtasks.
In addition to the correlations, an item analysis was conducted to determine the psychometric properties
(e.g., item difficulty and item-total correlation) of the subtasks. Item difficulty is defined as the percentage
of pupils who answered the item correctly. Item-total correlation is defined as the correlation between
the correct/wrong scores that pupils received on a given item and the total scores that the pupils received
when summing up their item scores. These correlations were corrected so that the given item was
removed from the total score when making the calculation in order to avoid correlating an item with
itself. Item difficulties should be between 0.10 and 0.90 and show a range of values within subtasks. Item-
total correlation values of 0.20 and above are considered to be psychometrically acceptable.
The psychometric analyses of the subtask correlations and items (untimed only) for each language (English
and Kiswahili) and grade level (Classes 1 and 2) are presented in the following sections.
English Tool Analyses
Tables 41 and 42 show the Pearson correlation coefficients for the eight subtasks on the English tool for
Classes 1 and 2. All of the correlations were statistically significant and positive (p < 0.05). The
correlations are moderate to strong across all tasks. For Class 1, the highest correlation (0.88) was
between passage reading (A) and invented/non-word decoding, indicating that the pupils with higher
scores in decoding invented/non-words also obtain higher scores in passage reading.
Table 41. English Class 1 Correlation Coefficients
Subtask
1. Phonem
e
segm
enta
tion
2. Lett
er
sound
know
ledge
3. N
on-w
ord
deco
din
g
4. V
oca
bula
ry
5a.
Pas
sage
read
ing
(A)
5b. R
ead
ing
com
pre
hensi
on (
A)
6a.
Pas
sage
read
ing
(B)
6b. R
ead
ing
com
pre
hensi
on (
B)
1. Phoneme segmentation 1
2. Letter sound knowledge 0.52 1
3. Invented/non-word decoding 0.44 0.61 1
4. Vocabulary 0.48 0.47 0.57 1
5a. Passage reading (A) 0.44 0.55 0.88 0.64 1
5b. Reading comprehension (A) 0.40 0.36 0.58 0.59 0.70 1
6a. Passage reading (B) 0.38 0.44 0.74 0.53 0.81 0.59 1
6b. Reading comprehension (B) 0.39 0.33 0.63 0.60 0.75 0.81 0.64 1
For Class 2, the highest correlation was between the two reading passages. The next highest correlations
(0.88 and 0.87), as in Class 1, were between the reading passages and invented/non-word decoding.

TUSOME REVISED BASELINE STUDY 45
Table 42. English Class 2 Correlation Coefficients
Subtask
1. Phonem
e
segm
enta
tion
2. Lett
er
sound
know
ledge
3. N
on-w
ord
deco
din
g
4. V
oca
bula
ry
5a.
Pas
sage
read
ing
(A)
5b. R
ead
ing
com
pre
hensi
on (
A)
6a.
Pas
sage
read
ing
(B)
6b. R
ead
ing
com
pre
hensi
on (
B)
1. Phoneme segmentation 1
2. Letter sound knowledge 0.48 1
3. Invented/non-word decoding 0.35 0.49 1
4. Vocabulary 0.38 0.40 0.57 1
5a. Passage reading (A) 0.35 0.43 0.88 0.66 1
5b. Reading comprehension (A) 0.41 0.38 0.58 0.64 0.68 1
6a. Passage reading (B) 0.35 0.43 0.87 0.65 0.97 0.69 1
6b. Reading comprehension (B) 0.43 0.38 0.64 0.65 0.75 0.84 0.76 1
Tables 43 to 45 present the analyses of the untimed items for Classes 1 and 2 in English. Only the
untimed items – phoneme segmentation, vocabulary, and reading comprehension – were analyzed since
the similarity of the timed items within the subtasks would lead to repetition in the statistics. All of the
English items had item-total correlations above the minimum standard of 0.20, indicating acceptable
quality (or discrimination) of the items. Most of the correlations were well above the minimum. The item
difficulties of the subtasks, with the exceptions of Class 2 phoneme segmentation and Class 1 reading
comprehension, were generally between 0.10 and 0.90 and showed a range of values within subtasks.
Table 43. English Phoneme Segmentation Item Statistics
Item Class 1 Class 2
Item Difficulty Item-Total Item Difficulty Item-Total
Q.1 0.22 0.58 0.15 0.52
Q.2 0.16 0.51 0.09 0.40
Q.3 0.26 0.56 0.16 0.44
Q.4 0.15 0.52 0.08 0.39
Q.5 0.22 0.60 0.12 0.50
Q.6 0.20 0.60 0.10 0.46
Q.7 0.21 0.60 0.12 0.47
Q.8 0.13 0.45 0.07 0.38
Q.9 0.19 0.58 0.11 0.45
Q.10 0.12 0.42 0.06 0.36

TUSOME REVISED BASELINE STUDY 46
Table 44. English Vocabulary Item Statistics
Item Class 1 Class 2
Item Difficulty Item-Total Item Difficulty Item-Total
Q.1 0.22 0.40 0.28 0.41
Q.2 0.20 0.48 0.27 0.51
Q.3 0.66 0.34 0.80 0.28
Q.4 0.07 0.22 0.26 0.39
Q.5 0.84 0.35 0.92 0.28
Q.6 0.39 0.55 0.55 0.57
Q.7 0.32 0.45 0.46 0.47
Q.8 0.24 0.45 0.39 0.48
Q.9 0.65 0.34 0.74 0.36
Q.10 0.52 0.54 0.68 0.49
Q.11 0.75 0.41 0.83 0.37
Q.12 0.26 0.57 0.39 0.59
Q.13 0.53 0.57 0.69 0.53
Q.14 0.67 0.45 0.78 0.39
Q.15 0.12 0.56 0.29 0.62
Q.16 0.30 0.58 0.46 0.62
Q.17 0.15 0.52 0.30 0.57
Q.18 0.37 0.57 0.53 0.57
Q.19 0.11 0.36 0.18 0.45
Q.20 0.12 0.48 0.23 0.51
Table 45. English Reading Comprehension Item Statistics
Item Class 1 Class 2
Item Difficulty Item-Total Item Difficulty Item-Total
Q. A1 0.16 0.44 0.21 0.46
Q.A2 0.12 0.59 0.21 0.66
Q.A3 0.05 0.45 0.15 0.58
Q.A4 0.12 0.61 0.22 0.65
Q.A5 0.06 0.55 0.17 0.64
Q.A6 0.02 0.30 0.05 0.40
Q.B1 0.14 0.64 0.28 0.72
Q.B2 0.12 0.59 0.20 0.62
Q.B3 0.09 0.59 0.20 0.65
Q.B4 0.10 0.63 0.24 0.70
Q.B5 0.07 0.55 0.18 0.63
Q.B6 0.03 0.38 0.09 0.51

TUSOME REVISED BASELINE STUDY 47
Kiswahili Tool Analyses
Tables 46 and 47 show the Pearson correlation coefficients for the six subtasks on the Kiswahili tool for
Classes 1 and 2. All of the correlations were statistically significant and positive (p < 0.05). The
correlations are moderate to strong across all tasks. As in English, for Class 1, the highest correlation
(0.91) was between passage reading and invented/non-word decoding, indicating that the pupils with
higher scores in invented/non-word decoding also obtain higher scores in passage reading.
Table 46. Kiswahili Class 1 Correlation Coefficients
Subtask 1. Lett
er
sound
know
ledge
2. Sy
llable
flu
ency
3. N
on-w
ord
deco
din
g
5b. Pas
sage
read
ing
6a.
Read
ing
com
pre
hensi
on
6b. Lis
tenin
g
com
pre
hensi
on
1. Letter sound knowledge 1
2. Syllable fluency 0.73 1
3. Invented/non-word decoding 0.62 0.88 1
4a. Passage reading 0.60 0.87 0.91 1
4b. Reading comprehension 0.52 0.75 0.78 0.86 1
5. Listening comprehension 0.39 0.43 0.39 0.42 0.47 1
For Class 2, the highest correlation (0.90) was also between passage reading and invented/non-word
decoding, indicating again that pupils with high scores in invented/non-word decoding also obtain high
scores in passage reading.
Table 47. Kiswahili Class 2 Correlation Coefficients
Subtask
1. Lett
er
sound
know
ledge
2. Sy
llable
flu
ency
3. N
on-w
ord
deco
din
g
5b. Pas
sage
read
ing
6a.
Read
ing
com
pre
hensi
on
6b. Lis
tenin
g
com
pre
hensi
on
1. Letter sound knowledge 1
2. Syllable fluency 0.67 1
3. Non-word decoding 0.59 0.87 1
4a. Passage reading 0.58 0.85 0.90 1
4b. Reading comprehension 0.54 0.75 0.78 0.87 1
5. Listening comprehension 0.37 0.43 0.40 0.45 0.54 1
Tables 48 to 49 present the analyses of the untimed items for Classes 1 and 2 in Kiswahili. As with
English, only the untimed items – reading comprehension and listening comprehension – were analyzed

TUSOME REVISED BASELINE STUDY 48
since the similarity of the timed items within the subtasks would lead to repetition in the statistics. All of
the Kiswahili items had item-total correlations above the minimum standard of 0.20, indicating acceptable
quality (or discrimination) of the items. Most of the correlations were well above the minimum. The item
difficulties of the subtasks, with the exceptions of half of the items on Class 1 reading comprehension and
one of the items on Class 2 reading comprehension, were between 0.10 and 0.90 and showed a range of
values within subtasks.
Table 48. Kiswahili Reading Comprehension Item Statistics
Item Class 1 Class 2
Item Difficulty Item-Total Item Difficulty Item-Total
Q.1 0.28 0.61 0.56 0.62
Q.2 0.17 0.54 0.36 0.56
Q.3 0.10 0.49 0.31 0.58
Q.4 0.04 0.34 0.16 0.47
Q.5 0.02 0.27 0.10 0.41
Q.6 0.00 0.08 0.01 0.21
Table 49. Kiswahili Listening Comprehension Item Statistics
Item Class 1 Class 2
Item Difficulty Item-Total Item Difficulty Item-Total
Q.1 0.30 0.37 0.39 0.36
Q.2 0.32 0.46 0.47 0.47
Q.3 0.38 0.41 0.52 0.43
Q.4 0.28 0.43 0.38 0.45
Q.5 0.26 0.39 0.43 0.39

TUSOME REVISED BASELINE STUDY 49
Annex 5: Sampled Counties
Table 50 provides pupil, teacher, and heat teacher information by county. Please note that the numbers of
pupils, teachers, and head teachers in Nairobi is large since it is also a former province.
Table 50. School, Pupil, Teacher, and Head Teacher Samples by County
County Schools Pupils Teachers Head
Teachers Class 1 Class 2 Total Class 1 Class 2 Total
Bomet 6 72 72 144 6 5 11 6
Bungoma 8 95 93 188 8 8 16 7
Garissa 8 96 96 192 5 7 12 8
Homa Bay 8 97 93 190 8 6 14 8
Kajiado 5 60 60 120 5 5 10 5
Kiambu 8 93 98 191 8 7 15 8
Kilifi 8 90 95 185 8 6 14 8
Kirinyaga 8 96 96 192 8 8 16 8
Kisii 8 96 96 192 8 8 16 8
Kisumu 5 60 60 120 5 5 10 5
Kitui 8 94 96 190 7 7 14 8
Makueni 7 86 82 168 7 6 13 7
Marsabit 6 70 72 142 6 5 11 6
Meru 6 72 72 144 6 6 12 5
Mombasa 13 156 156 312 12 10 22 12
Nairobi 27 319 330 649 26 25 51 27
Nakuru 5 61 58 119 5 5 10 5
Nandi 6 72 71 143 5 6 11 5
Narok 6 72 71 143 6 6 12 6
Nyandarua 8 96 96 192 8 8 16 7
Siaya 8 97 95 192 8 8 16 8
Taita Taveta 8 97 95 192 8 8 16 8
Trans Nzoia 5 59 61 120 5 5 10 5
Uasin Gishu 5 60 60 120 5 5 10 5
Vihiga 7 84 86 170 7 7 14 7
Wajir 7 77 79 156 6 6 12 7
Total 204 2,427 2,439 4,866 196 188 384 199

TUSOME REVISED BASELINE STUDY 50
Annex 6: Histograms of Fluency Scores
The histograms below (Figures 1 to 3) show the distributions of ORF scores for English passage reading
(A and B) and Kiswahili passage reading. In all of the histograms, there are large percentages of scores at
the lower end of the distributions and positive skews. The distributions change somewhat from Class 1 to
Class 2, with fewer scores at the lower end and slightly less skew. There are more scores at the lower
end of the distributions in Kiswahili than in English.
Note that the bars for the histograms contain multiple scores. For instance, the lowest bar for English
Class 1 ORF (passage A) contains the zero scores (about 50 percent of the scores) plus other scores
from pupils who read from 1 to 9 CWPM (another 13 or 14 percent of the scores).
Figure 1. English Passage Reading (A)

TUSOME REVISED BASELINE STUDY 51
Figure 2. English Passage Reading (B)
Figure 3. Kiswahili Passage Reading