turning innovation into patient benefit409c6700-fe35-4bc8-9af0-d98a7d4e8d… · turning innovation...
TRANSCRIPT
Turning innovation into patient benefit
Karl Mahler
Head of Investor Relations
London, December 2015
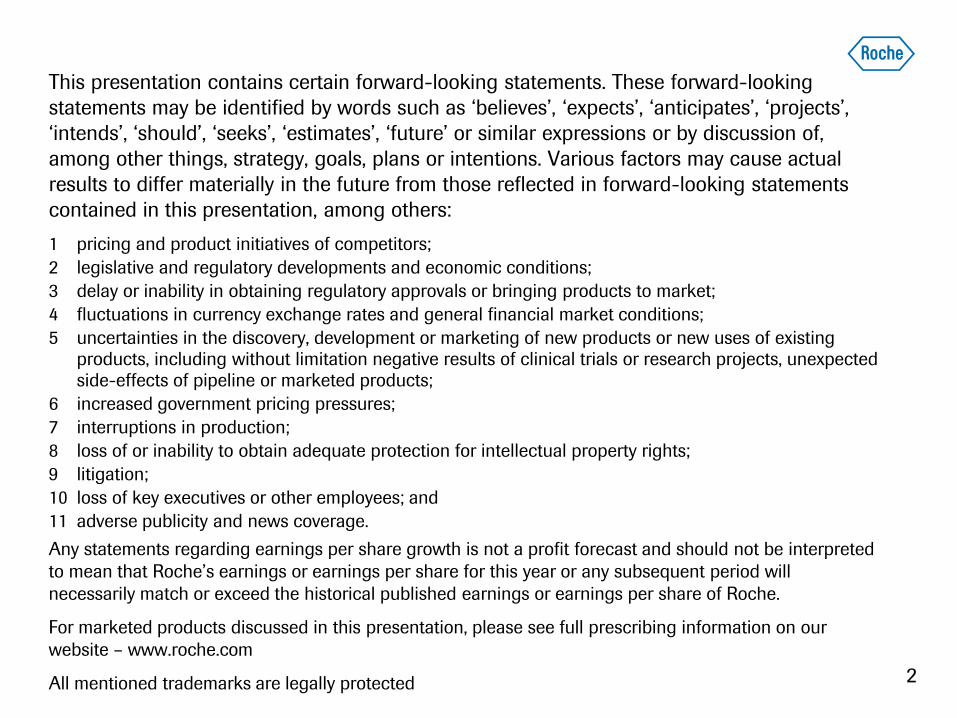
This presentation contains certain forward-looking statements. These forward-looking
statements may be identified by words such as ‘believes’, ‘expects’, ‘anticipates’, ‘projects’,
‘intends’, ‘should’, ‘seeks’, ‘estimates’, ‘future’ or similar expressions or by discussion of,
among other things, strategy, goals, plans or intentions. Various factors may cause actual
results to differ materially in the future from those reflected in forward-looking statements
contained in this presentation, among others:
1 pricing and product initiatives of competitors;
2 legislative and regulatory developments and economic conditions;
3 delay or inability in obtaining regulatory approvals or bringing products to market;
4 fluctuations in currency exchange rates and general financial market conditions;
5 uncertainties in the discovery, development or marketing of new products or new uses of existing products, including without limitation negative results of clinical trials or research projects, unexpected side-effects of pipeline or marketed products;
6 increased government pricing pressures;
7 interruptions in production;
8 loss of or inability to obtain adequate protection for intellectual property rights;
9 litigation;
10 loss of key executives or other employees; and
11 adverse publicity and news coverage.
Any statements regarding earnings per share growth is not a profit forecast and should not be interpreted
to mean that Roche’s earnings or earnings per share for this year or any subsequent period will
necessarily match or exceed the historical published earnings or earnings per share of Roche.
For marketed products discussed in this presentation, please see full prescribing information on our
website – www.roche.com
All mentioned trademarks are legally protected 2
Performance update
Innovation and efficiency
Improving the standard of care
Outlook
3

Q3 2015: Sales growth for fifth consecutive year
4 All growth rates at constant exchange rates (CER)
0% 0% 1%
4%
2%
6%
4%
6% 6%
4%
8%
7%
5%
4%
5%
6%
5%
7%
6%
0%
2%
4%
6%
8%
10%
Q1
11
Q2
11
Q3
11
Q4
11
Q1
12
Q2
12
Q3
12
Q4
12
Q1
13
Q2
13
Q3
13
Q4
13
Q1
14
Q2
14
Q3
14
Q4
14
Q1
15
Q2
15
Q3
15
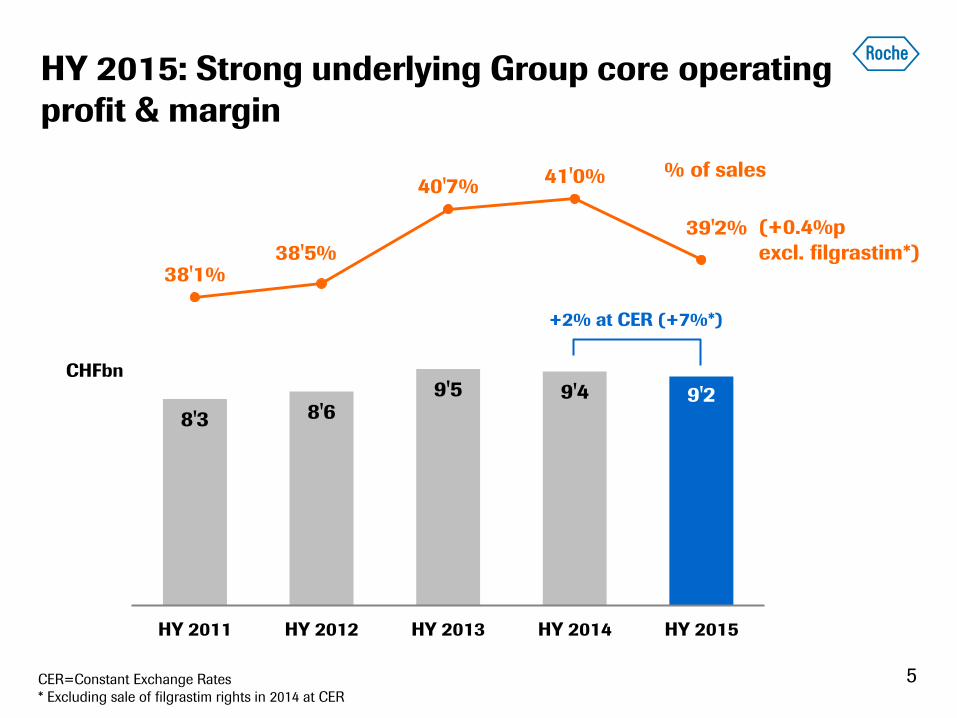
HY 2015: Strong underlying Group core operating
profit & margin
5
% of sales
CHFbn
CER=Constant Exchange Rates
* Excluding sale of filgrastim rights in 2014 at CER
8'3 8'6 9'5 9'4 9'2
38'1% 38'5%
40'7% 41'0%
39'2%
HY 2011 HY 2012 HY 2013 HY 2014 HY 2015
+2% at CER (+7%*)
(+0.4%p
excl. filgrastim*)
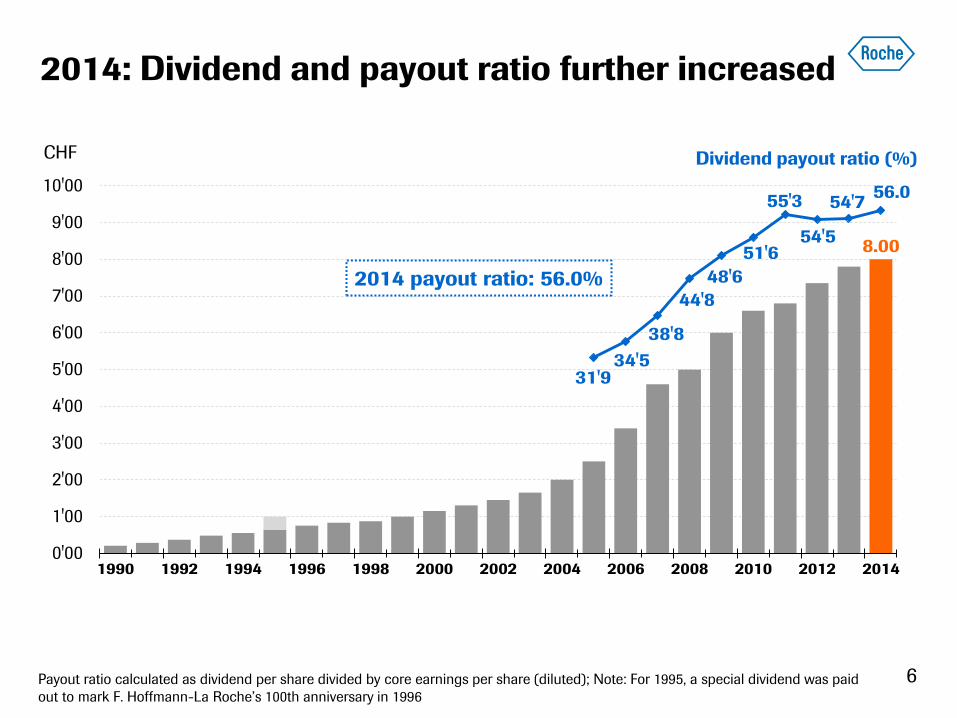
2014: Dividend and payout ratio further increased
6 1 compound annual growth rate
8.00
31'9 34'5
38'8
44'8
48'6
51'6
55'3
54'5
54'7 56.0
0'00
1'00
2'00
3'00
4'00
5'00
6'00
7'00
8'00
9'00
10'00
1990 1992 1994 1996 1998 2000 2002 2004 2006 2008 2010 2012 2014
Dividend payout ratio (%) CHF
2014 payout ratio: 56.0%
Payout ratio calculated as dividend per share divided by core earnings per share (diluted); Note: For 1995, a special dividend was paid
out to mark F. Hoffmann-La Roche’s 100th anniversary in 1996
Performance update
Innovation and efficiency
Improving the standard of care
Outlook
7
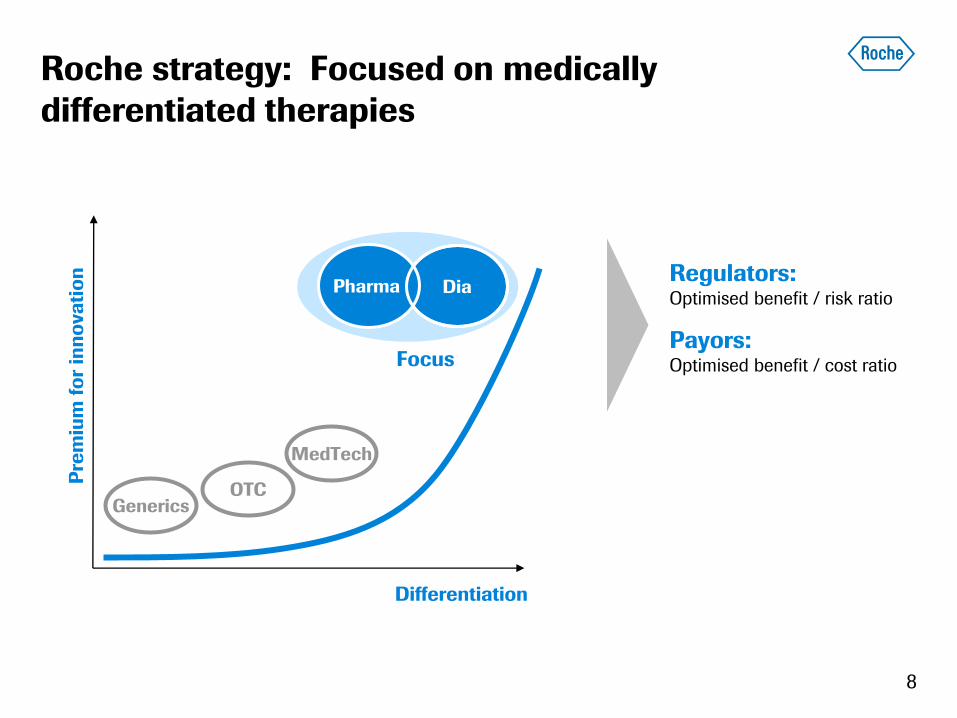
Roche strategy: Focused on medically
differentiated therapies
8
Generics
Differentiation
MedTech
OTC
Pre
miu
m f
or
inn
ova
tio
n
Dia Pharma
Focus
Regulators: Optimised benefit / risk ratio
Payors: Optimised benefit / cost ratio
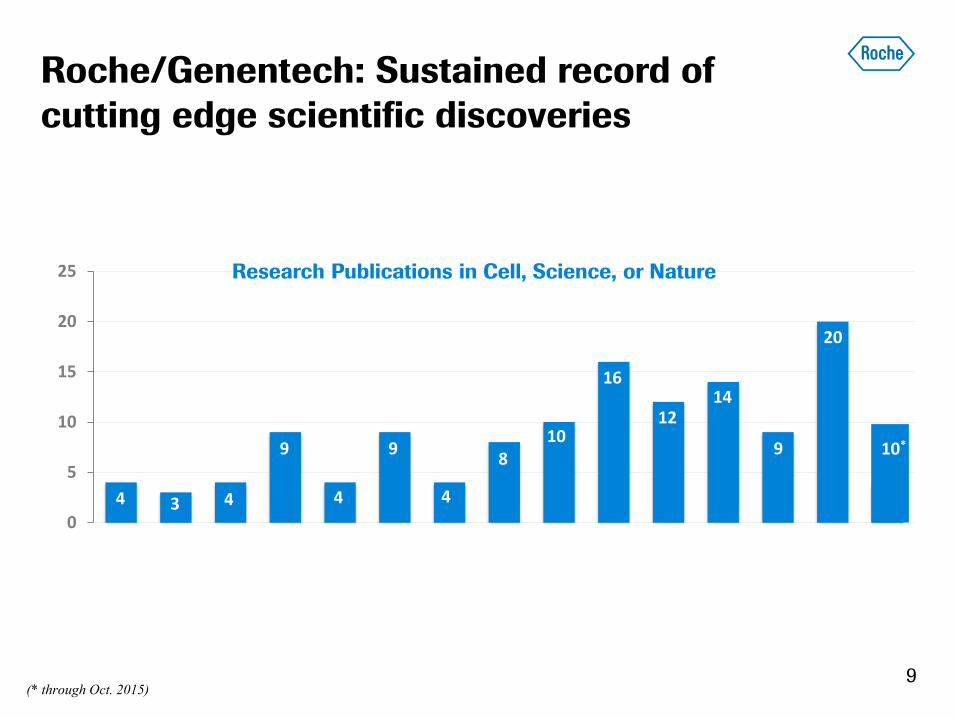
Roche/Genentech: Sustained record of
cutting edge scientific discoveries
0
5
10
15
20
25
(* through Oct. 2015)
4 3 4
9
4
9
4
8 10
16
12 14
9
20
Research Publications in Cell, Science, or Nature
10*
9
Roche’s strategy remains unchanged
Success hinges on excellence in innovation & execution
• Focus investment on differentiated molecules
• Continuously improve processes
10
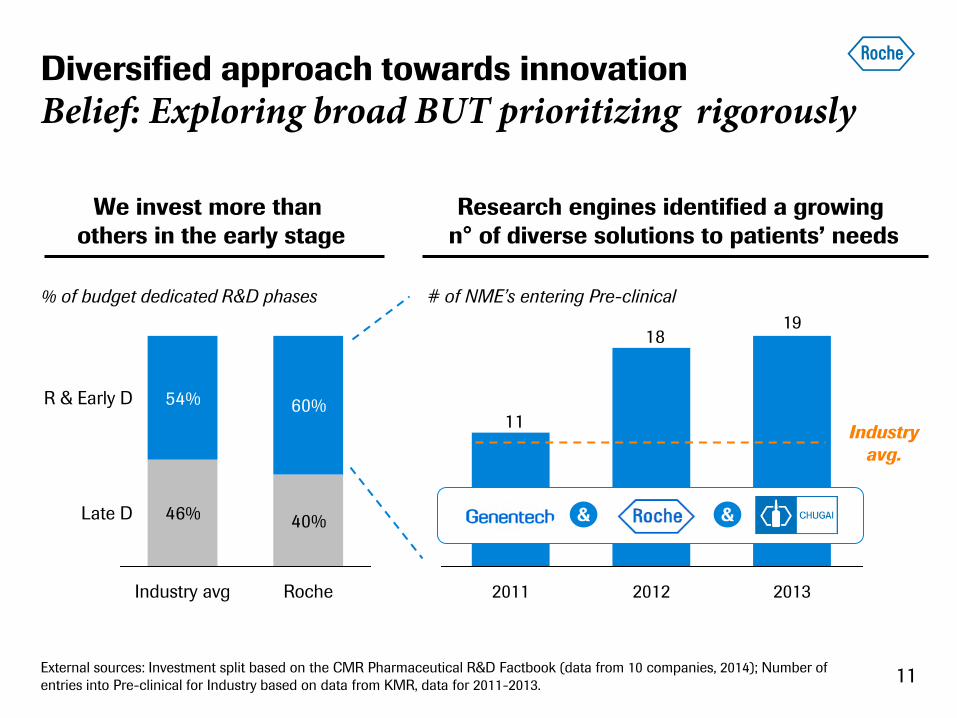
Diversified approach towards innovation
Belief: Exploring broad BUT prioritizing rigorously
We invest more than
others in the early stage
Research engines identified a growing
n° of diverse solutions to patients’ needs
46% 40%
54% 60%R & Early D
Roche
Late D
Industry avg
18
11
19
2013 2011 2012
# of NME’s entering Pre-clinical
Industry
avg.
% of budget dedicated R&D phases
<<< & &
External sources: Investment split based on the CMR Pharmaceutical R&D Factbook (data from 10 companies, 2014); Number of
entries into Pre-clinical for Industry based on data from KMR, data for 2011-2013. 11

However, we set a high bar for our R&D pipeline …
Targeting clear differentiation in areas of unmet need
Assessment for late stage entry
candidates & line extensions
Clinical differentiation
Threshold
high low
low
high
Greater
differentiation
Sa
les
Time
Un
me
t m
ed
ica
l n
ee
d
Continued
Disqualified
Illustrative
Total sales potential
12
Roche’s strategy remains unchanged
Success hinges on excellence in innovation & execution
• Focus investment on differentiated molecules
• Continuously improve processes
13
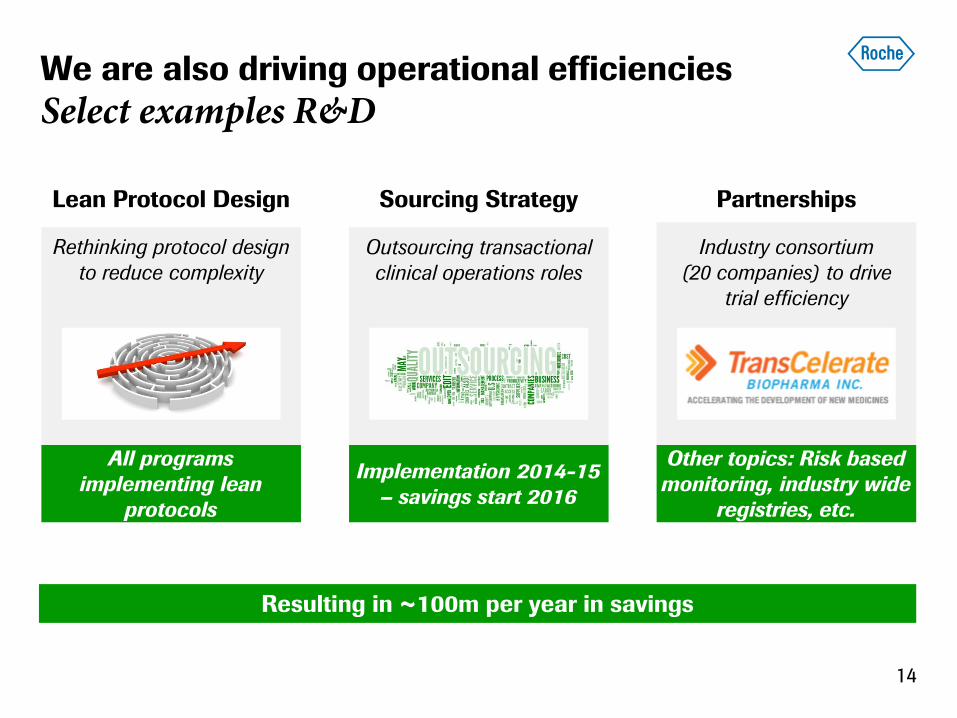
We are also driving operational efficiencies
Select examples R&D
Lean Protocol Design Sourcing Strategy Partnerships
Rethinking protocol design
to reduce complexity
All programs
implementing lean
protocols
Outsourcing transactional
clinical operations roles
Implementation 2014-15
– savings start 2016
Other topics: Risk based
monitoring, industry wide
registries, etc.
Industry consortium
(20 companies) to drive
trial efficiency
Resulting in ~100m per year in savings
14
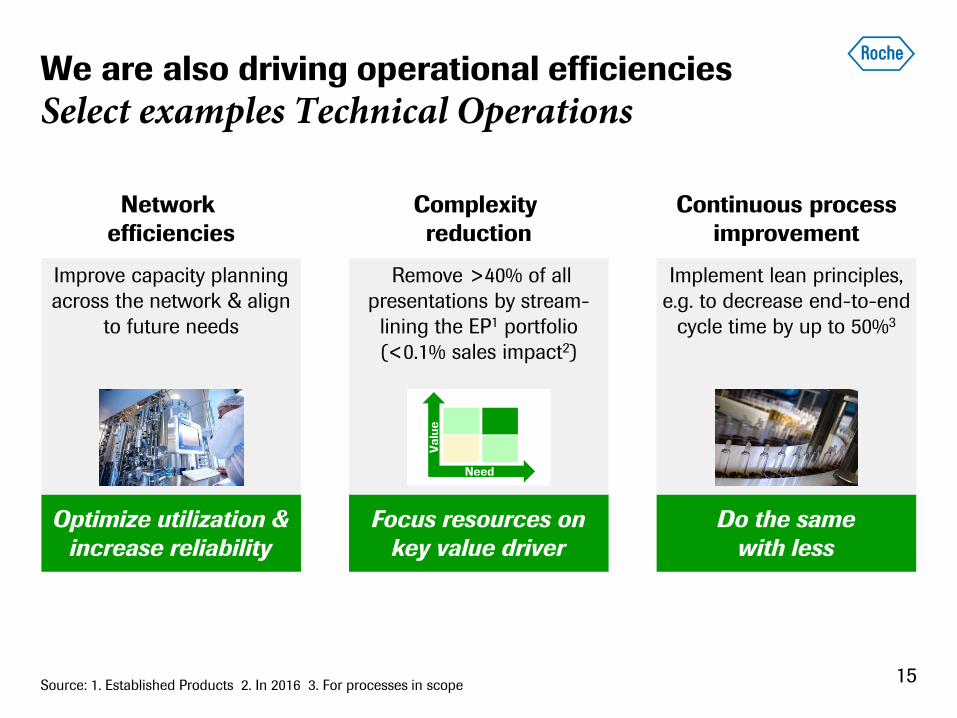
Network
efficiencies
Complexity
reduction
Continuous process
improvement
Optimize utilization &
increase reliability
Do the same
with less
Focus resources on
key value driver
Remove >40% of all
presentations by stream-
lining the EP1 portfolio
(<0.1% sales impact2)
Improve capacity planning
across the network & align
to future needs
Implement lean principles,
e.g. to decrease end-to-end
cycle time by up to 50%3
Source: 1. Established Products 2. In 2016 3. For processes in scope
Need
Va
lue
We are also driving operational efficiencies
Select examples Technical Operations
15
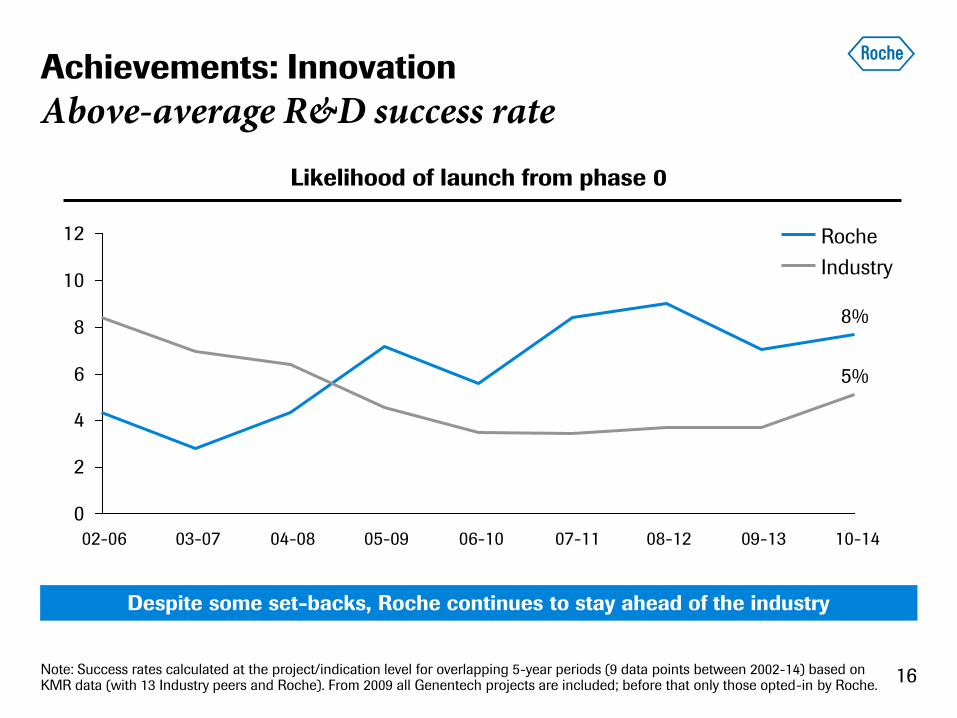
8%
5%
0
2
4
6
8
10
12
10-14 09-13 08-12 07-11 06-10 05-09 04-08 03-07 02-06
Roche
Industry
Despite some set-backs, Roche continues to stay ahead of the industry
Likelihood of launch from phase 0
Achievements: Innovation
Above-average R&D success rate
Note: Success rates calculated at the project/indication level for overlapping 5-year periods (9 data points between 2002-14) based on KMR data (with 13 Industry peers and Roche). From 2009 all Genentech projects are included; before that only those opted-in by Roche.
16
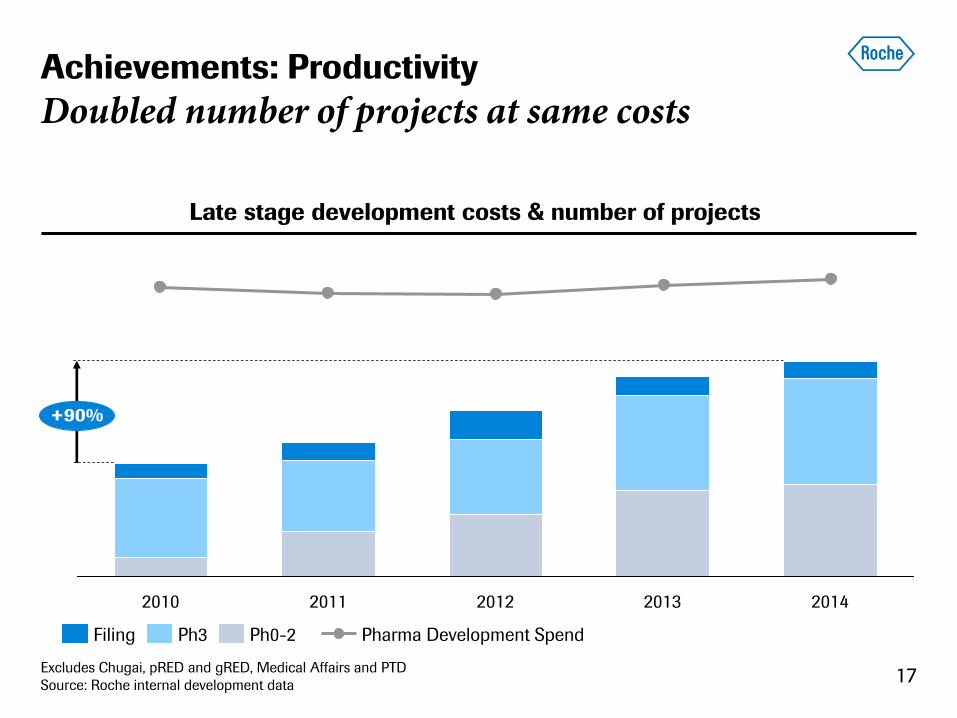
Achievements: Productivity
Doubled number of projects at same costs
2012 2013 2014 2010 2011
+90%
Filing Ph0-2 Ph3 Pharma Development Spend
Late stage development costs & number of projects
Excludes Chugai, pRED and gRED, Medical Affairs and PTD
Source: Roche internal development data 17
Performance update
Innovation and efficiency
Improving the standard of care
Outlook
18
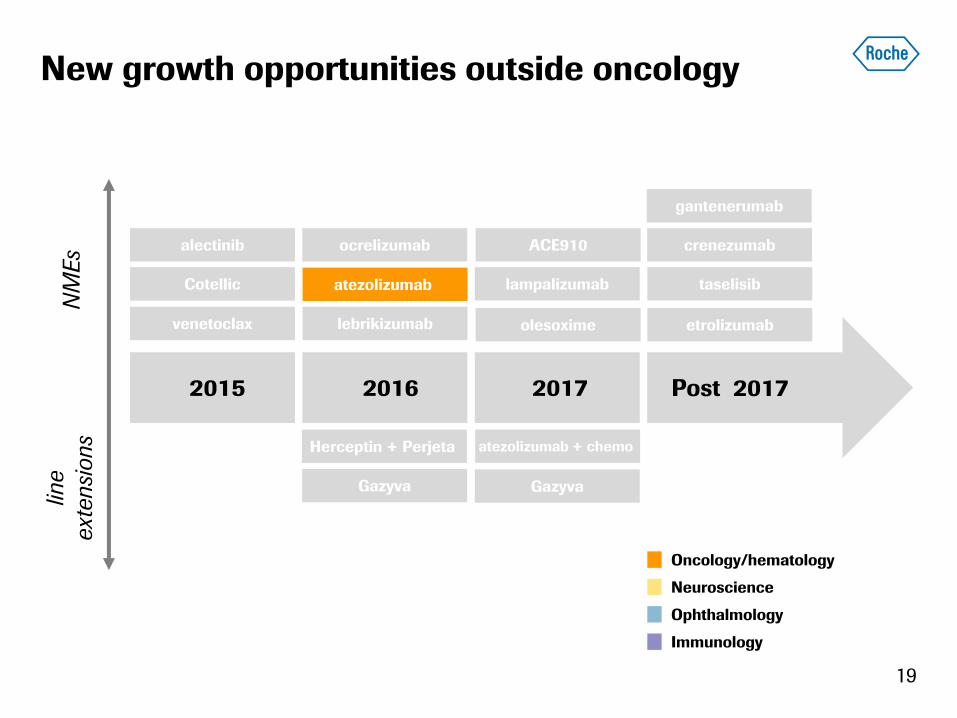
taselisib
19
NM
Es
line
ext
ensi
ons
2015 2016 2017
venetoclax
alectinib
Cotellic
lebrikizumab
atezolizumab
ocrelizumab
lampalizumab
ACE910
Post 2017
etrolizumab
crenezumab
gantenerumab
olesoxime
Herceptin + Perjeta
Gazyva
atezolizumab + chemo
Gazyva
New growth opportunities outside oncology
Oncology/hematology
Neuroscience
Ophthalmology
Immunology
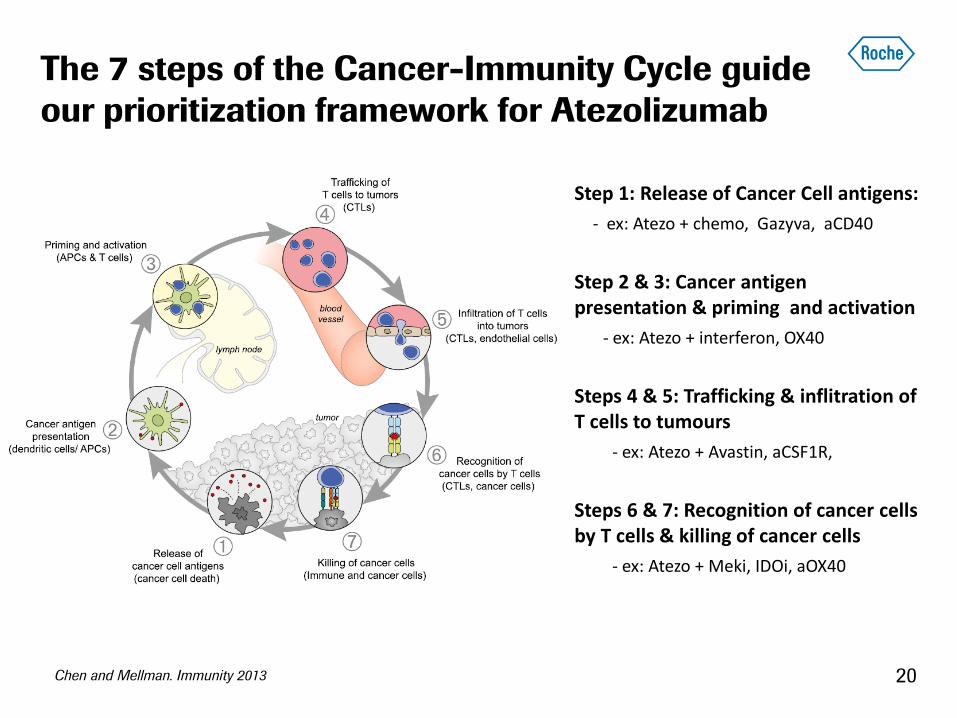
The 7 steps of the Cancer-Immunity Cycle guide
our prioritization framework for Atezolizumab
Step 1: Release of Cancer Cell antigens:
- ex: Atezo + chemo, Gazyva, aCD40
Step 2 & 3: Cancer antigen presentation & priming and activation
- ex: Atezo + interferon, OX40
Steps 4 & 5: Trafficking & inflitration of T cells to tumours
- ex: Atezo + Avastin, aCSF1R,
Steps 6 & 7: Recognition of cancer cells by T cells & killing of cancer cells
- ex: Atezo + Meki, IDOi, aOX40
Chen and Mellman. Immunity 2013 20
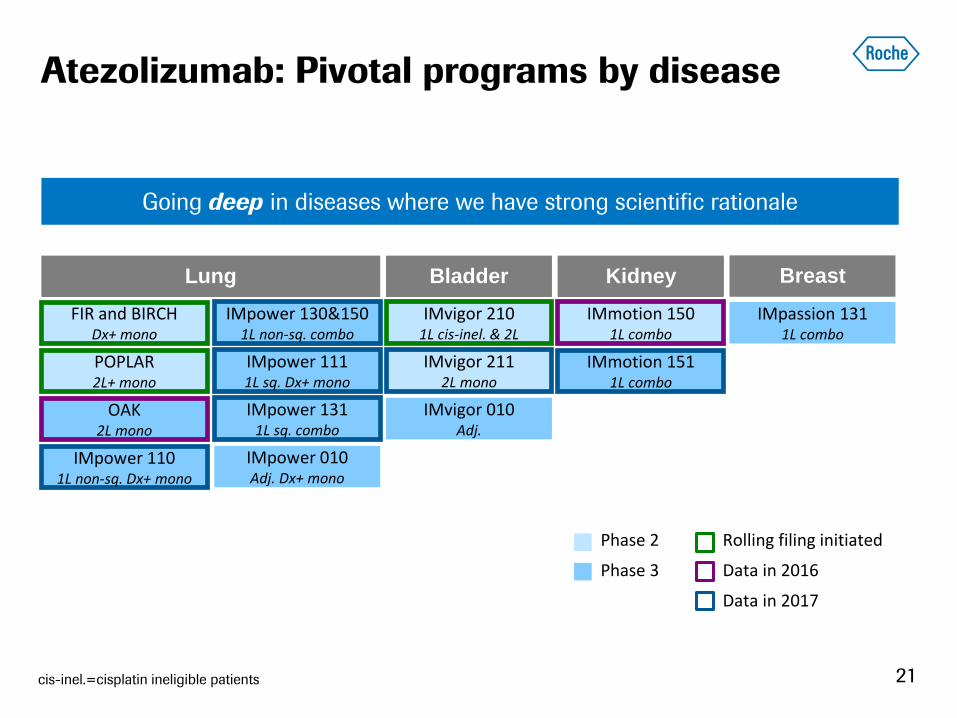
Atezolizumab: Pivotal programs by disease
21
KIDNEY
Going deep in diseases where we have strong scientific rationale
cis-inel.=cisplatin ineligible patients
Lung
FIR and BIRCH Dx+ mono
Bladder
IMvigor 210 1L cis-inel. & 2L
Breast Kidney
POPLAR 2L+ mono
IMpower 110 1L non-sq. Dx+ mono
IMpower 130&150 1L non-sq. combo
IMpower 111 1L sq. Dx+ mono
IMpower 131 1L sq. combo
OAK 2L mono
IMpower 010 Adj. Dx+ mono
IMvigor 211 2L mono
IMvigor 010 Adj.
IMmotion 150 1L combo
IMmotion 151 1L combo
IMpassion 131 1L combo
Rolling filing initiated
Data in 2016
Data in 2017
Phase 2
Phase 3
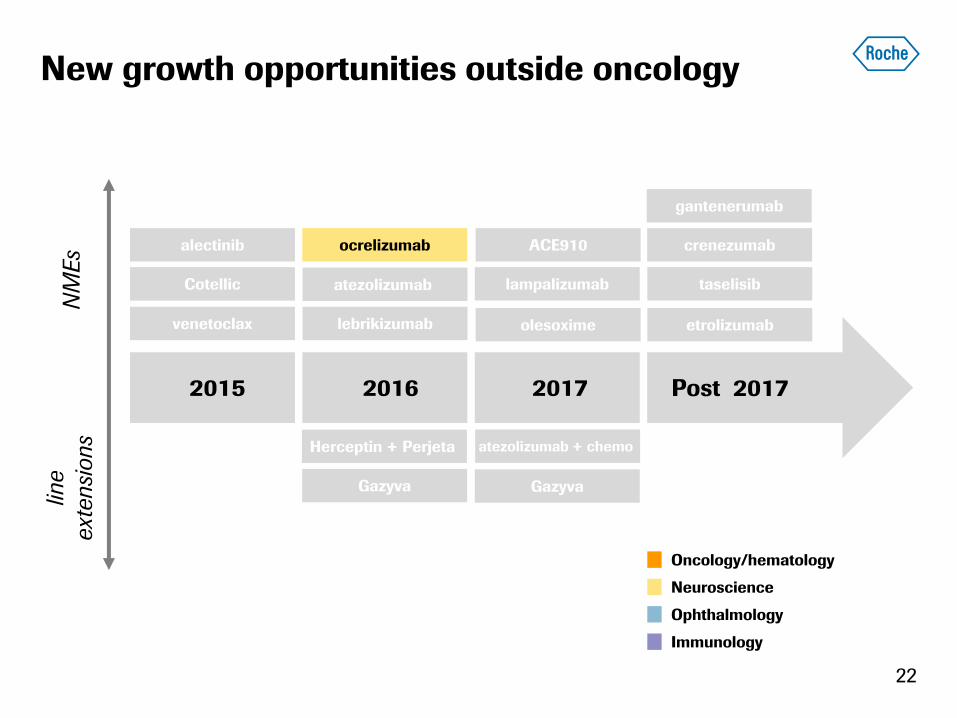
taselisib
22
NM
Es
line
ext
ensi
ons
2015 2016 2017
venetoclax
alectinib
Cotellic
lebrikizumab
atezolizumab
ocrelizumab
lampalizumab
ACE910
Post 2017
etrolizumab
crenezumab
gantenerumab
olesoxime
Herceptin + Perjeta
Gazyva
atezolizumab + chemo
Gazyva
New growth opportunities outside oncology
Oncology/hematology
Neuroscience
Ophthalmology
Immunology
23
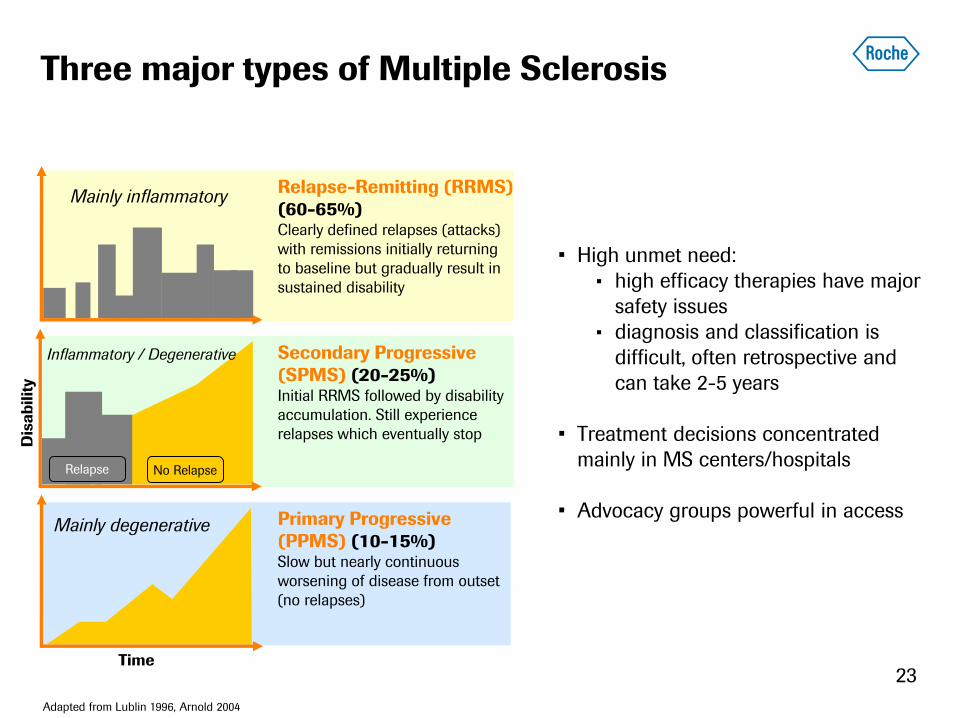
Secondary Progressive
(SPMS) (20-25%) Initial RRMS followed by disability
accumulation. Still experience
relapses which eventually stop
Primary Progressive
(PPMS) (10-15%) Slow but nearly continuous
worsening of disease from outset
(no relapses)
Relapse-Remitting (RRMS)
(60-65%) Clearly defined relapses (attacks)
with remissions initially returning
to baseline but gradually result in
sustained disability
Three major types of Multiple Sclerosis
Dis
ab
ilit
y
Time
Relapse No Relapse
Mainly degenerative
Mainly inflammatory
Adapted from Lublin 1996, Arnold 2004
Inflammatory / Degenerative
• High unmet need:
• high efficacy therapies have major
safety issues
• diagnosis and classification is
difficult, often retrospective and
can take 2-5 years
• Treatment decisions concentrated
mainly in MS centers/hospitals
• Advocacy groups powerful in access
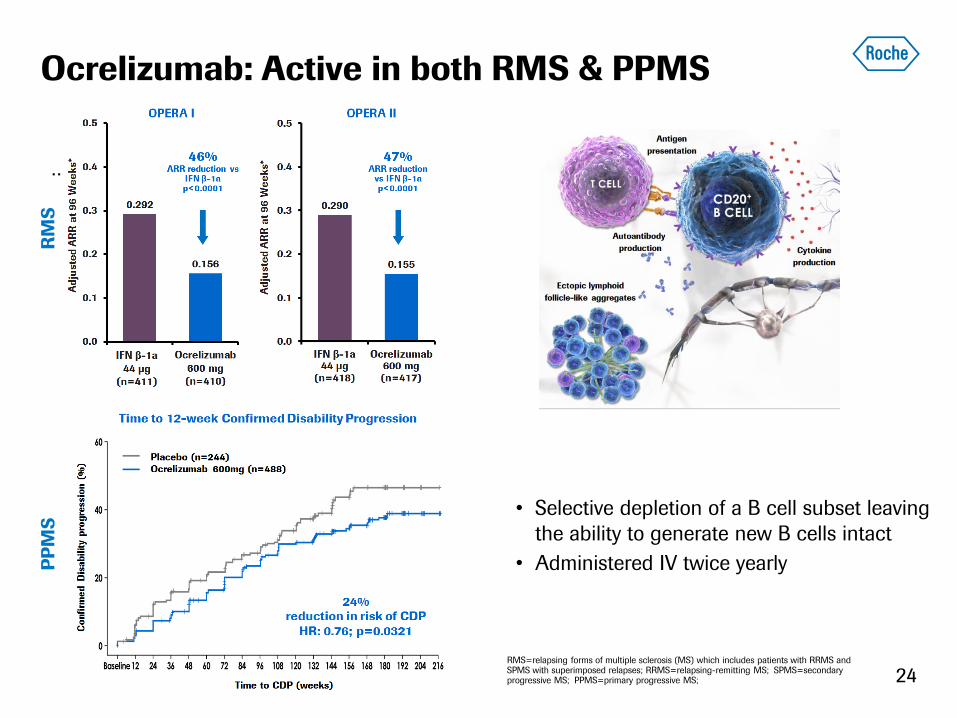
Ocrelizumab: Active in both RMS & PPMS
24
• Selective depletion of a B cell subset leaving
the ability to generate new B cells intact
• Administered IV twice yearly
RMS=relapsing forms of multiple sclerosis (MS) which includes patients with RRMS and SPMS with superimposed relapses; RRMS=relapsing-remitting MS; SPMS=secondary progressive MS; PPMS=primary progressive MS;
PPMS:
: R
MS
P
PM
S
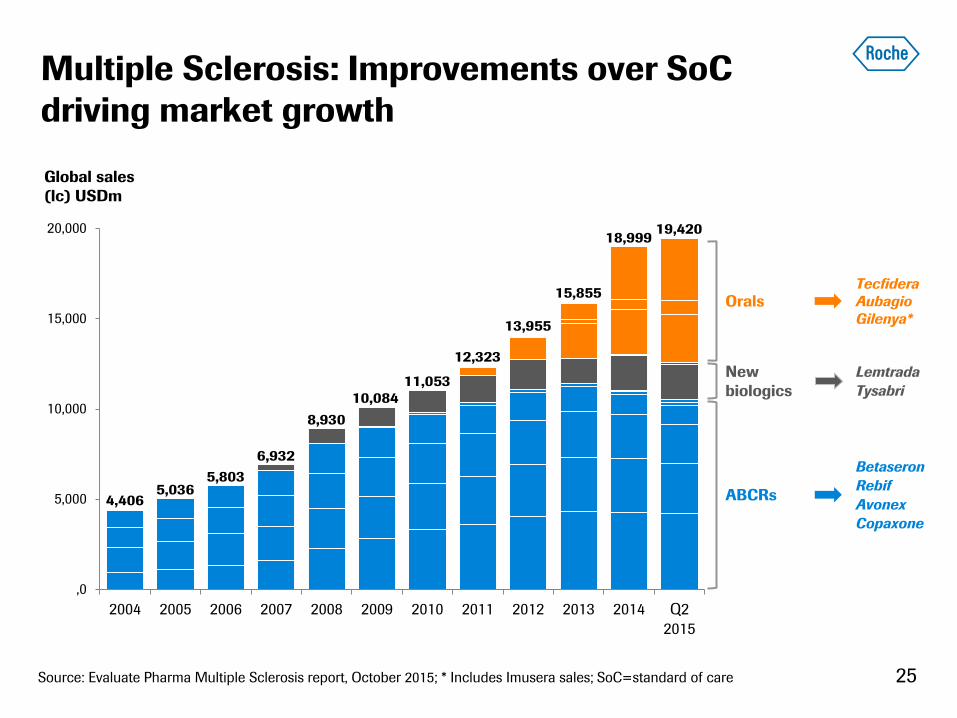
Multiple Sclerosis: Improvements over SoC
driving market growth
25
,0
5,000
10,000
15,000
20,000
2004 2005 2006 2007 2008 2009 2010 2011 2012 2013 2014 Q2
2015
19,420 18,999
15,855
13,955
12,323
11,053
10,084
8,930
6,932
5,803 5,036
4,406
Global sales
(lc) USDm
Source: Evaluate Pharma Multiple Sclerosis report, October 2015; * Includes Imusera sales; SoC=standard of care
Betaseron
Rebif
Avonex
Copaxone
Lemtrada
Tysabri
Tecfidera
Aubagio
Gilenya*
ABCRs
Orals
New
biologics
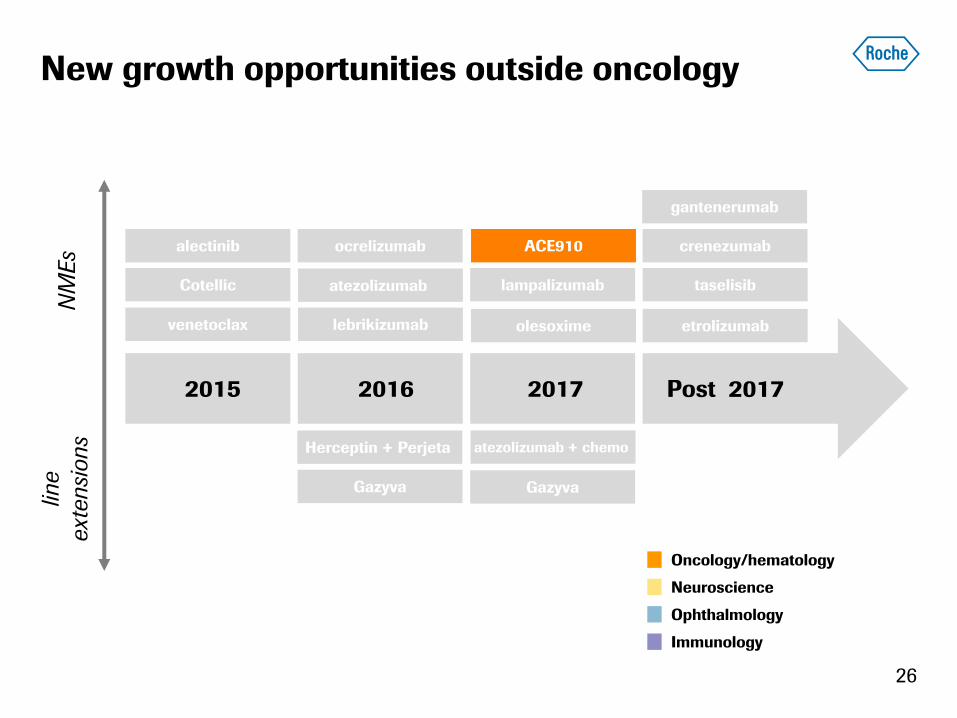
taselisib
26
NM
Es
line
ext
ensi
ons
2015 2016 2017
venetoclax
alectinib
Cotellic
lebrikizumab
atezolizumab
ocrelizumab
lampalizumab
ACE910
Post 2017
etrolizumab
crenezumab
gantenerumab
olesoxime
Herceptin + Perjeta
Gazyva
atezolizumab + chemo
Gazyva
New growth opportunities outside oncology
Oncology/hematology
Neuroscience
Ophthalmology
Immunology
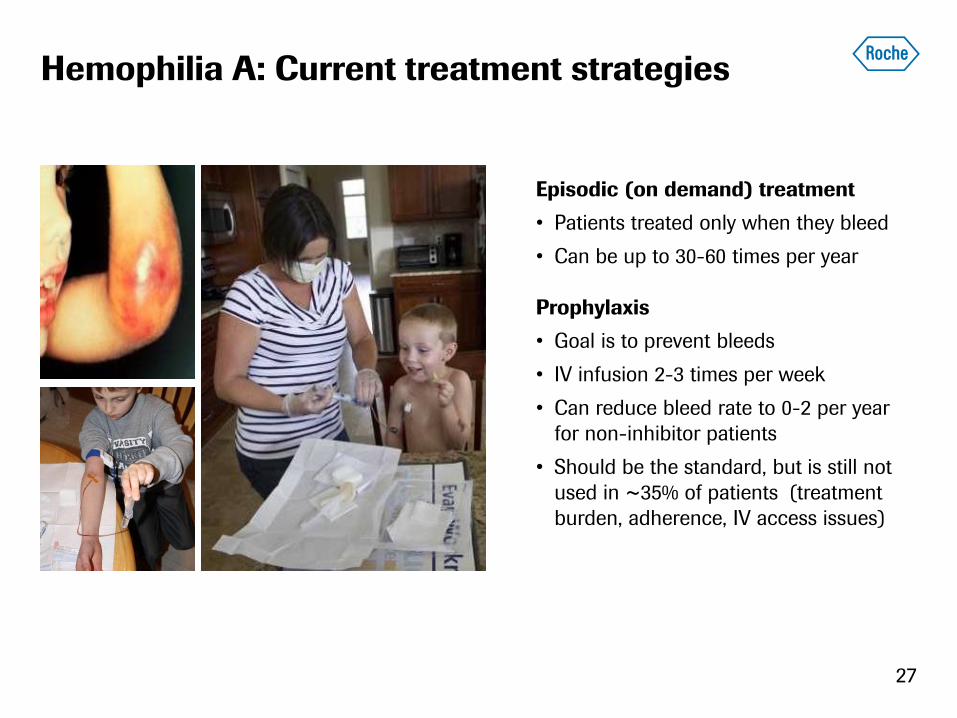
Hemophilia A: Current treatment strategies
27
Episodic (on demand) treatment
• Patients treated only when they bleed
• Can be up to 30-60 times per year
Prophylaxis
• Goal is to prevent bleeds
• IV infusion 2-3 times per week
• Can reduce bleed rate to 0-2 per year
for non-inhibitor patients
• Should be the standard, but is still not
used in ~35% of patients (treatment
burden, adherence, IV access issues)
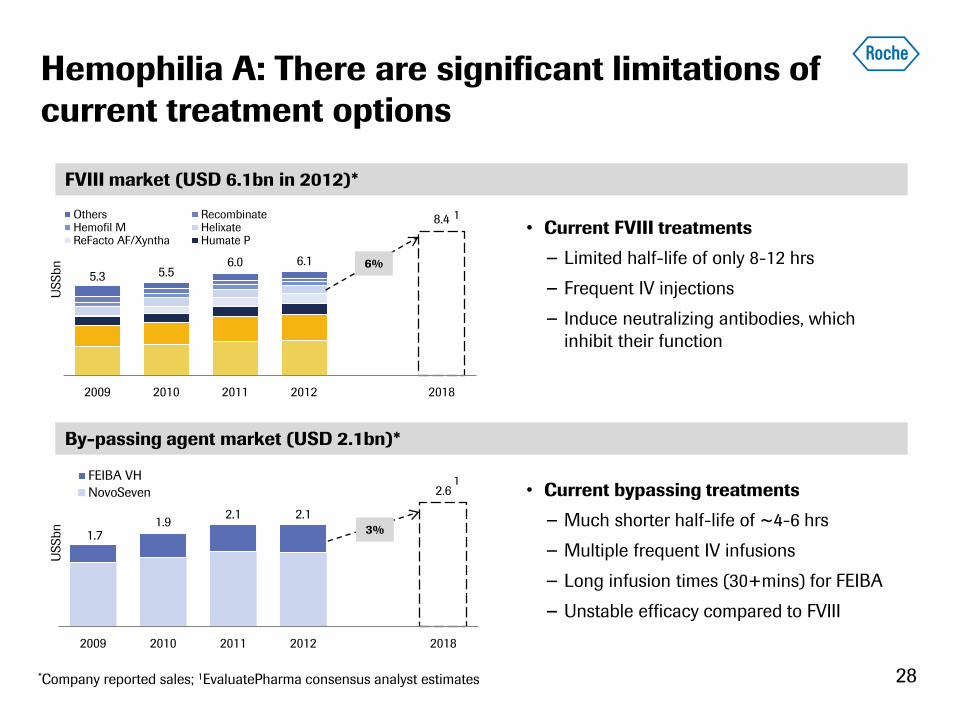
Hemophilia A: There are significant limitations of
current treatment options
1.7 1.9
2.1 2.1
2.6
2009 2010 2011 2012 2018
FEIBA VH
NovoSeven
3%
5.3 5.5 6.0 6.1
8.4
2009 2010 2011 2012 2018
Others RecombinateHemofil M HelixateReFacto AF/Xyntha Humate P
6%
*Company reported sales; 1EvaluatePharma consensus analyst estimates
1
FVIII market (USD 6.1bn in 2012)*
By-passing agent market (USD 2.1bn)*
• Current FVIII treatments
− Limited half-life of only 8-12 hrs
− Frequent IV injections
− Induce neutralizing antibodies, which
inhibit their function
• Current bypassing treatments
− Much shorter half-life of ~4-6 hrs
− Multiple frequent IV infusions
− Long infusion times (30+mins) for FEIBA
− Unstable efficacy compared to FVIII
28
1
US
Sb
n
US
Sb
n
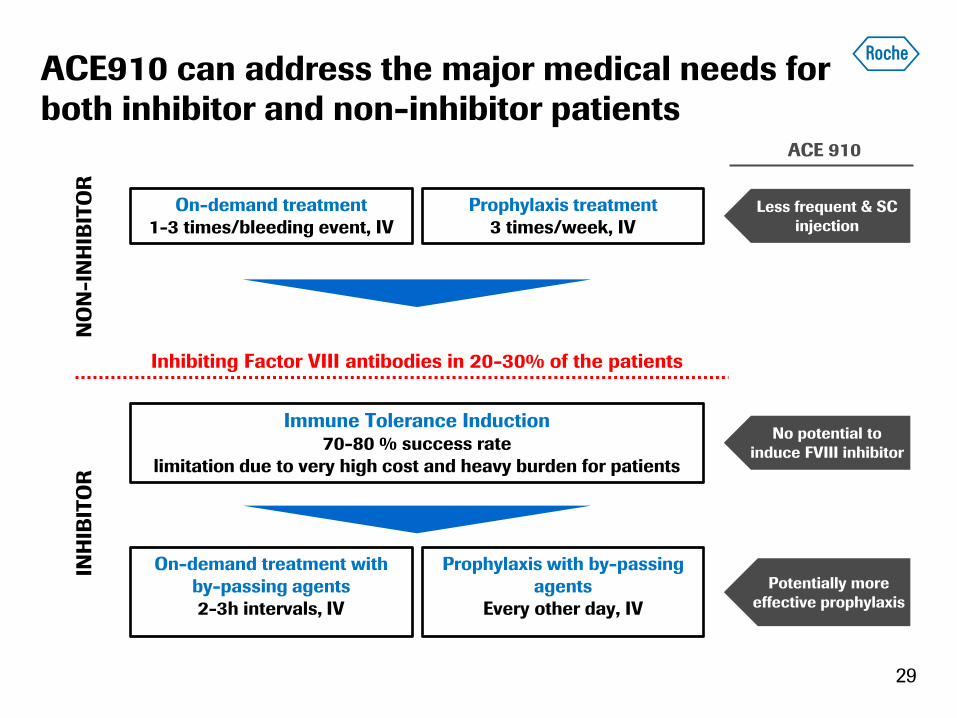
ACE910 can address the major medical needs for
both inhibitor and non-inhibitor patients
29
Potentially more
effective prophylaxis
No potential to
induce FVIII inhibitor
ACE 910
Prophylaxis treatment
3 times/week, IV
On-demand treatment
1-3 times/bleeding event, IV
Inhibiting Factor VIII antibodies in 20-30% of the patients
NO
N-I
NH
IBIT
OR
Prophylaxis with by-passing
agents
Every other day, IV
On-demand treatment with
by-passing agents
2-3h intervals, IV
INH
IBIT
OR
Immune Tolerance Induction 70-80 % success rate
limitation due to very high cost and heavy burden for patients
Less frequent & SC
injection
30
Performance up-date
Maximising existing franchises
New growth opportunities
Biosimilars
Outlook
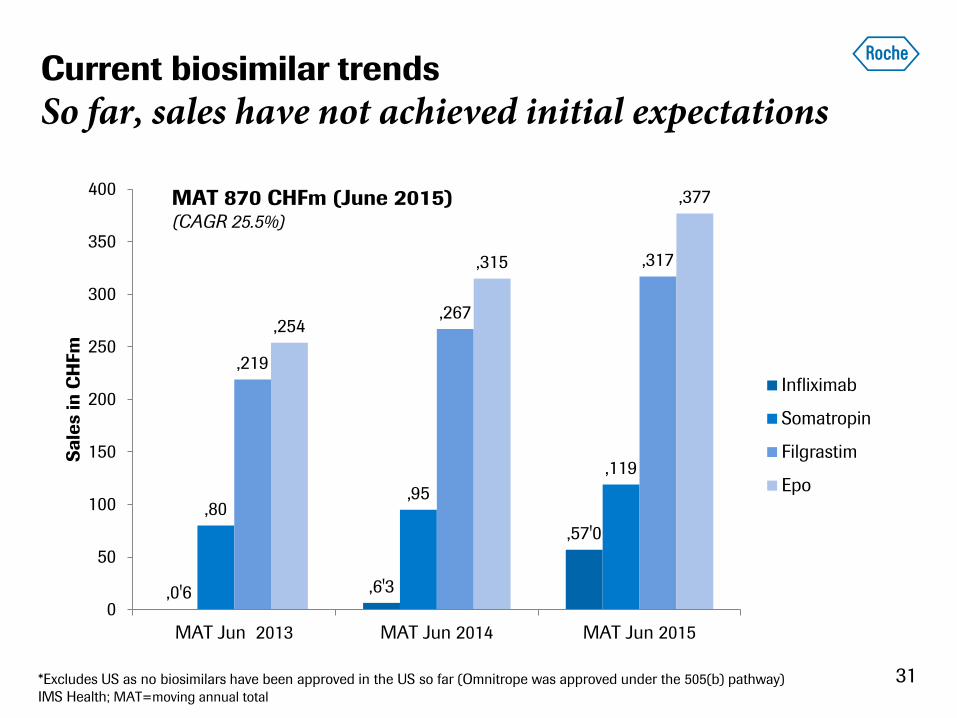
,0'6 ,6'3
,57'0
,80 ,95
,119
,219
,267
,317
,254
,315
,377
0
50
100
150
200
250
300
350
400
MAT Jun 2013 MAT Jun 2014 MAT Jun 2015
Sa
les in
CH
Fm
Infliximab
Somatropin
Filgrastim
Epo
Current biosimilar trends
So far, sales have not achieved initial expectations
31
MAT 870 CHFm (June 2015) (CAGR 25.5%)
*Excludes US as no biosimilars have been approved in the US so far (Omnitrope was approved under the 505(b) pathway)
IMS Health; MAT=moving annual total

Generics vs biosimilars
Clear divide in uptake; complex market drivers
0%
20%
40%
60%
80%
100%
Year 0 Year 1 Year 2 Year 3 Year 4 Year 5 Year 6
32
Market share
Zyprexa (Eli Lilly)
Diovan (Novartis)
Filgrastim
EPO
Somatropin
Small molecule
Virtually disappear
Payer driven: 7 biosimilars
Efficacy visible immediately
High turnover of patients
Driven by price and patient offering
9 innovators, one biosimilar
Efficacy visible only longer term
No switching
Sources: IMS Biosimilar Dashboard, IMS & Roche analysis 1 Volume market share based on EU5 average; 2 Volume market share based on average of France & Germany EPO; 3 Data based on % remaining sales in EU
1
1
2
3
3
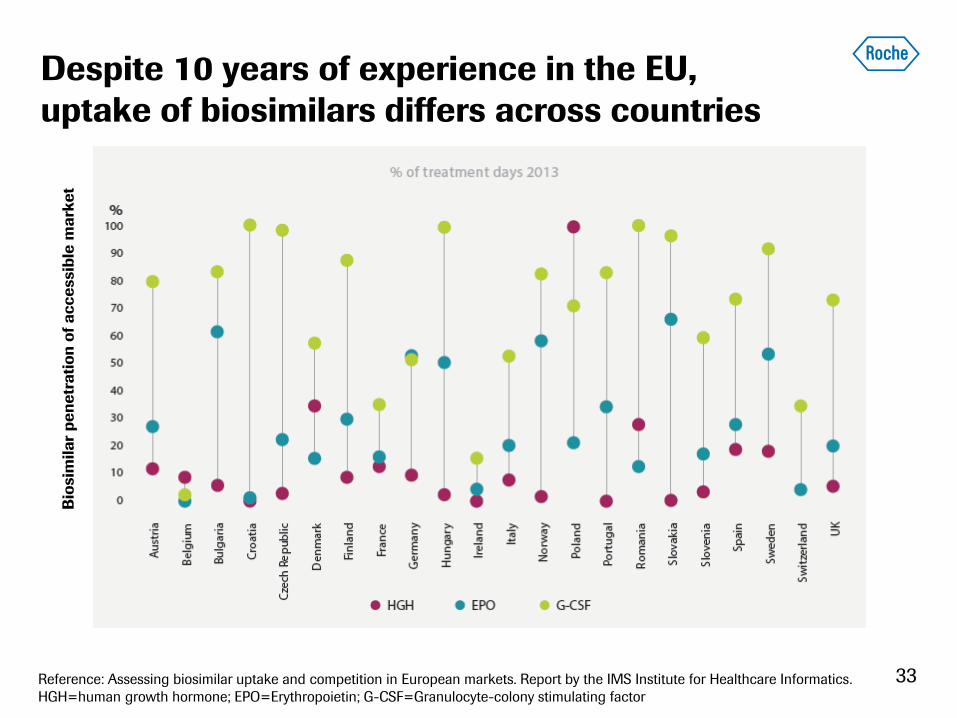
Despite 10 years of experience in the EU,
uptake of biosimilars differs across countries
33
Bio
sim
ila
r p
en
etr
ati
on
of
ac
ce
ssib
le m
ark
et
Reference: Assessing biosimilar uptake and competition in European markets. Report by the IMS Institute for Healthcare Informatics.
HGH=human growth hormone; EPO=Erythropoietin; G-CSF=Granulocyte-colony stimulating factor
34
Performance up-date
Maximising existing franchises
New growth opportunities
Biosimilars
Outlook
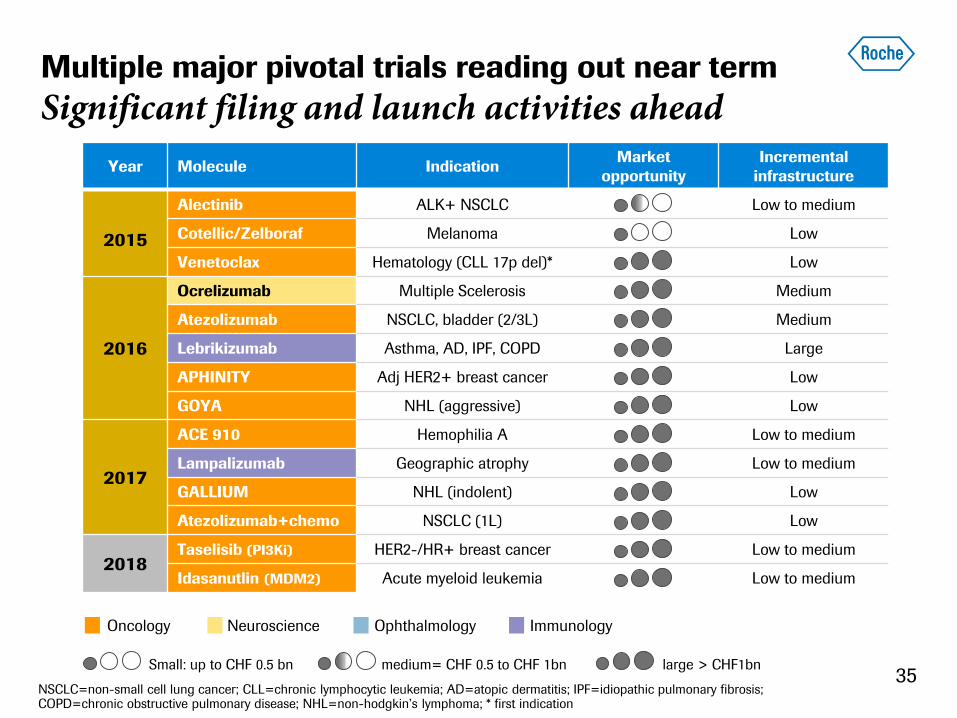
Multiple major pivotal trials reading out near term
Significant filing and launch activities ahead
35
Year Molecule Indication Market
opportunity
Incremental
infrastructure
2015
Alectinib ALK+ NSCLC Low to medium
Cotellic/Zelboraf Melanoma Low
Venetoclax Hematology (CLL 17p del)* Low
2016
Ocrelizumab Multiple Scelerosis Medium
Atezolizumab NSCLC, bladder (2/3L) Medium
Lebrikizumab Asthma, AD, IPF, COPD Large
APHINITY Adj HER2+ breast cancer Low
GOYA NHL (aggressive) Low
2017
ACE 910 Hemophilia A Low to medium
Lampalizumab Geographic atrophy Low to medium
GALLIUM NHL (indolent) Low
Atezolizumab+chemo NSCLC (1L) Low
2018 Taselisib (PI3Ki) HER2-/HR+ breast cancer Low to medium
Idasanutlin (MDM2) Acute myeloid leukemia Low to medium
Oncology Neuroscience Ophthalmology Immunology
Small: up to CHF 0.5 bn medium= CHF 0.5 to CHF 1bn large > CHF1bn
NSCLC=non-small cell lung cancer; CLL=chronic lymphocytic leukemia; AD=atopic dermatitis; IPF=idiopathic pulmonary fibrosis; COPD=chronic obstructive pulmonary disease; NHL=non-hodgkin’s lymphoma; * first indication

Positive outlook
Strong pipeline mitigates biosimilar impact
2014 2015E 2016E 2017E 2018E 2019E 2020E 2021E 2022E 2023E
Marketed
products
Sales
Pipeline
Biosimilars
MabThera, Herceptin, Avastin
NME launches
Venetoclax, Alectinib, Cotellic, Ocrelizumab, Atezolizumab,
Lebrikizumab, ACE910, Lampalizumab
36
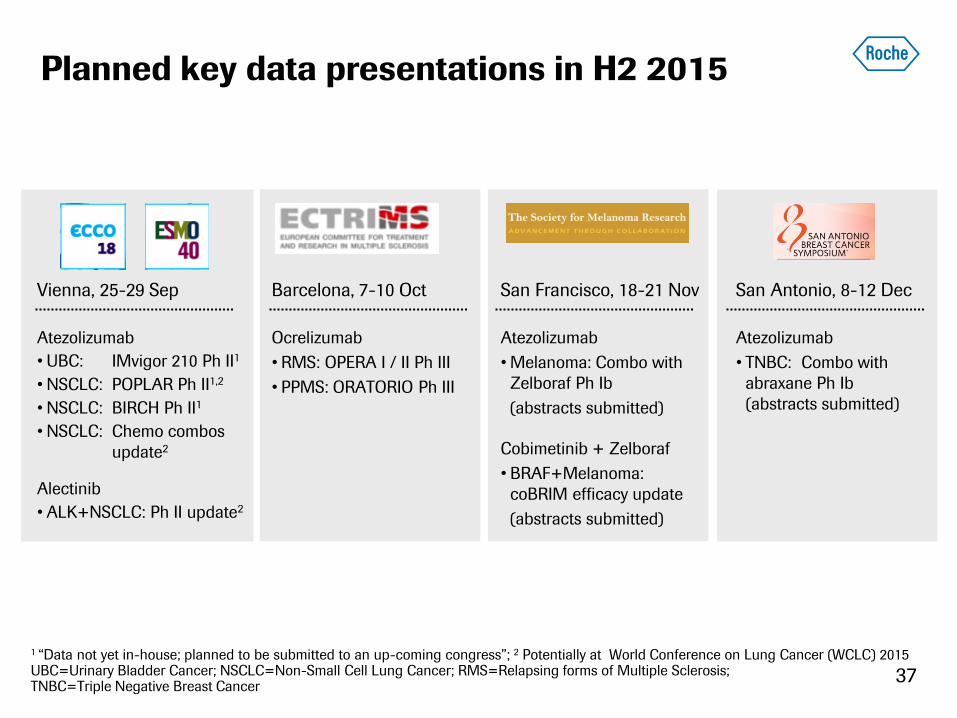
Planned key data presentations in H2 2015
37
Vienna, 25-29 Sep
Atezolizumab
• UBC: IMvigor 210 Ph II1
• NSCLC: POPLAR Ph II1,2
• NSCLC: BIRCH Ph II1
• NSCLC: Chemo combos
update2
Alectinib
• ALK+NSCLC: Ph II update2
San Antonio, 8-12 Dec
Atezolizumab
• TNBC: Combo with
abraxane Ph Ib
(abstracts submitted)
San Francisco, 18-21 Nov
Atezolizumab
• Melanoma: Combo with
Zelboraf Ph Ib
(abstracts submitted)
Cobimetinib + Zelboraf
• BRAF+Melanoma:
coBRIM efficacy update
(abstracts submitted)
Barcelona, 7-10 Oct
Ocrelizumab
• RMS: OPERA I / II Ph III
• PPMS: ORATORIO Ph III
1 “Data not yet in-house; planned to be submitted to an up-coming congress”; 2 Potentially at World Conference on Lung Cancer (WCLC) 2015 UBC=Urinary Bladder Cancer; NSCLC=Non-Small Cell Lung Cancer; RMS=Relapsing forms of Multiple Sclerosis; TNBC=Triple Negative Breast Cancer
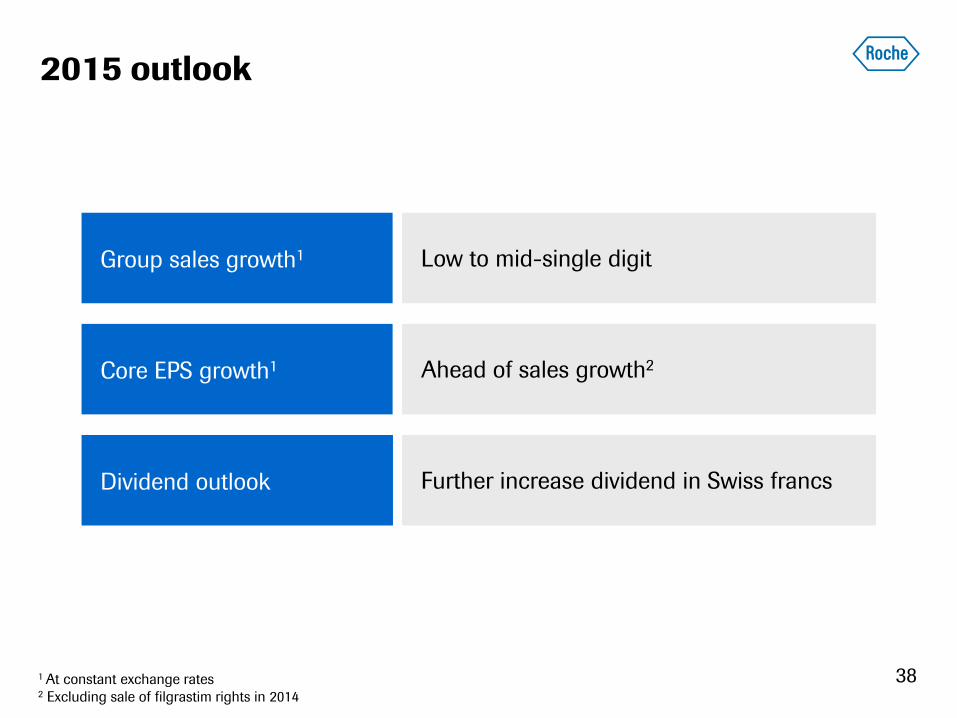
2015 outlook
Group sales growth1 Low to mid-single digit
Core EPS growth1 Ahead of sales growth2
Dividend outlook Further increase dividend in Swiss francs
1 At constant exchange rates 2 Excluding sale of filgrastim rights in 2014
38

Appendix
39
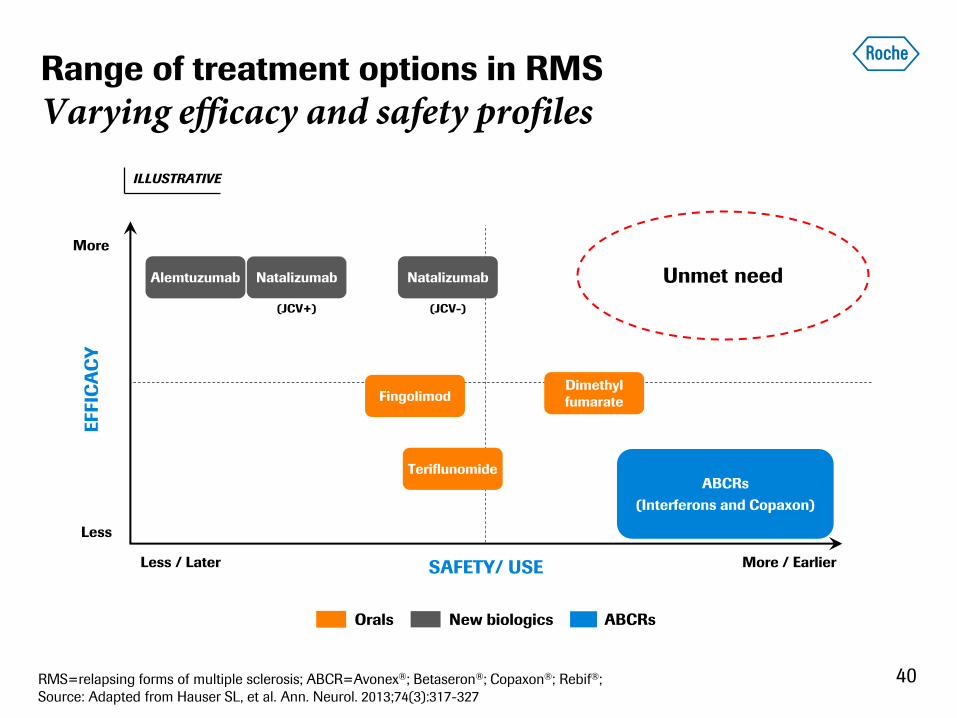
Fingolimod
Teriflunomide ABCRs
(Interferons and Copaxon)
More
Less
More / Earlier Less / Later SAFETY/ USE
EFFIC
AC
Y
Alemtuzumab Natalizumab
Dimethyl
fumarate
Range of treatment options in RMS
Varying efficacy and safety profiles
40
ILLUSTRATIVE
Natalizumab
(JCV+) (JCV-)
Unmet need
New biologics Orals ABCRs
RMS=relapsing forms of multiple sclerosis; ABCR=Avonex®; Betaseron®; Copaxon®; Rebif®;
Source: Adapted from Hauser SL, et al. Ann. Neurol. 2013;74(3):317-327
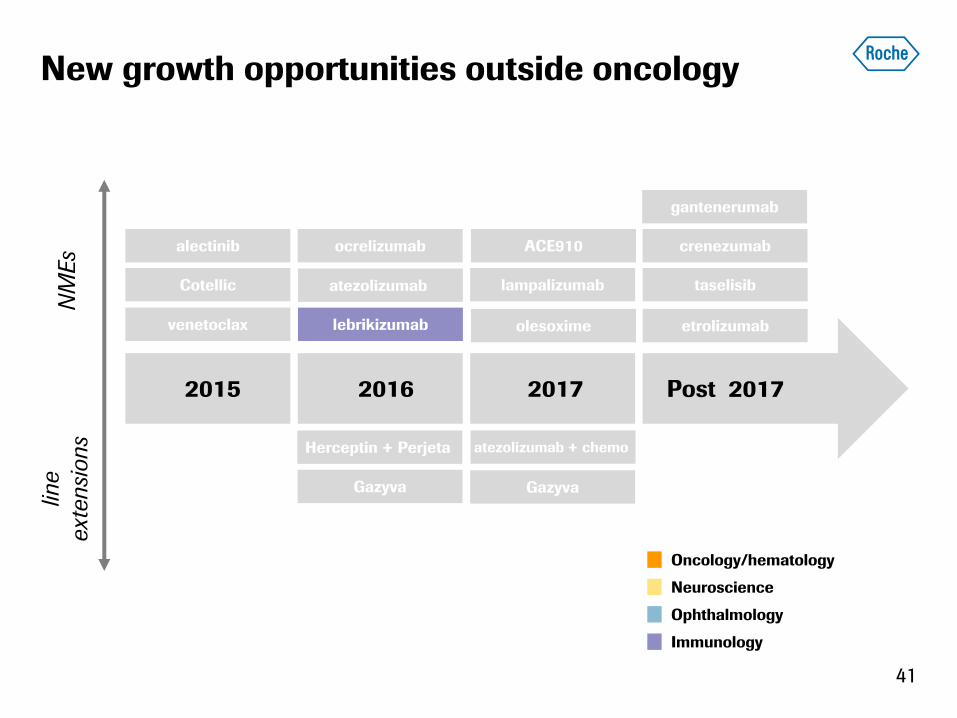
taselisib
41
NM
Es
line
ext
ensi
ons
2015 2016 2017
venetoclax
alectinib
Cotellic
lebrikizumab
atezolizumab
ocrelizumab
lampalizumab
ACE910
Post 2017
etrolizumab
crenezumab
gantenerumab
olesoxime
Herceptin + Perjeta
Gazyva
atezolizumab + chemo
Gazyva
New growth opportunities outside oncology
Oncology/hematology
Neuroscience
Ophthalmology
Immunology

Severe asthma: High unmet need in growing
market
42
Global asthma market 2014 vs 2020
11%
29%
Small Molecules Biologics
2014 1 biologic
Shifting clinical practice
2020 6 biologics
Note: Market shares based on value (sales); Source: Evaluate; defined by daily use of ≥500ug ICS + LABA
• Approx. 300m patients worldwide and
growing strongly
• 5-10% asthma patients have severe
disease, and ~30% of severe disease
is uncontrolled despite maximal
therapy
• Over 4.5m severe asthmatics with
uncontrolled disease
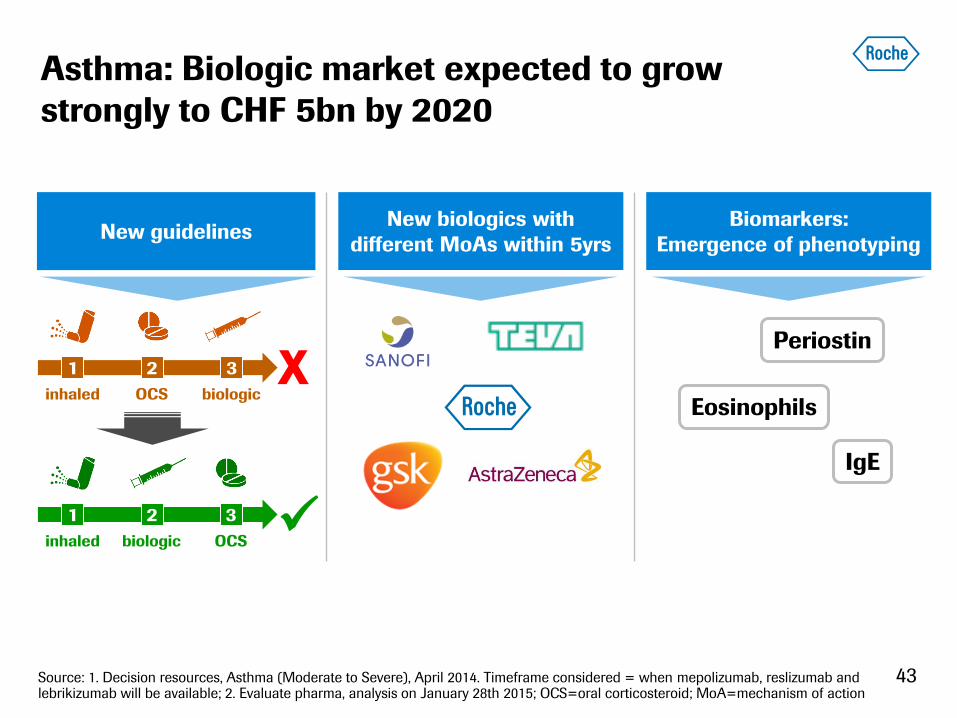
Asthma: Biologic market expected to grow
strongly to CHF 5bn by 2020
Biomarkers:
Emergence of phenotyping New guidelines
New biologics with
different MoAs within 5yrs
Periostin
Eosinophils
IgE
1 2 3
inhaled OCS biologic
1 2 3
inhaled OCS biologic
X
43 Source: 1. Decision resources, Asthma (Moderate to Severe), April 2014. Timeframe considered = when mepolizumab, reslizumab and lebrikizumab will be available; 2. Evaluate pharma, analysis on January 28th 2015; OCS=oral corticosteroid; MoA=mechanism of action

Doing now what patients need next