turkish economic association - core.ac.uk · summary.....22 v. principal characteristics of the...
TRANSCRIPT

TURKISH ECONOMIC ASSOCIATION
DISCUSSION PAPER 2004/22 http://www.tek.org.tr
INFORMAL SECTOR IN THE TURKISH LABOUR MARKET
Tuncer Bulutay and Enver Taştı
November, 2004

INFORMAL SECTOR IN THE TURKISH LABOUR MARKET
Prof.Dr. Tuncer BULUTAY
Enver TAŞTI
January 2002 Ankara - Turkey
2
CONTENTS I. Introduction .................................................................................................................. 3 II. The Definitions and Estimates of the Informal Sector in Turkey ............................... 6
A. Definitions of the Informal Sector ....................................................................... 6 Data Set I ............................................................................................................. 7 Data Set II ............................................................................................................ 8
B. Estimated Values ................................................................................................. 8 III. Main Determining Factors of the Informal Sector .................................................. 13
A. Essentials of Our Method of Analysis ................................................................13 B. Findings and Comments .....................................................................................14
IV. Composition of the Informal Sector .........................................................................17 Status in Employment and Age Distribution ............................................................17 Women’s Share in the Informal Sector ....................................................................18 The Education Level in the Informal Sector ............................................................20 Sectoral Distribution ...............................................................................................21 Summary ..................................................................................................................22 V. Principal Characteristics of the Informal Sector.........................................................22
The Nature and Conditions of Work .........................................................................22 Capital, Technology and Credit Uses .......................................................................23 Income and Wages in the Informal Sector ................................................................24 Birth Places, the Reasons of Holding Job and Mobility ...........................................28
VI. Concluding Remarks ................................................................................................29 NOTES ...........................................................................................................................31 REFERENCES ...............................................................................................................33
3
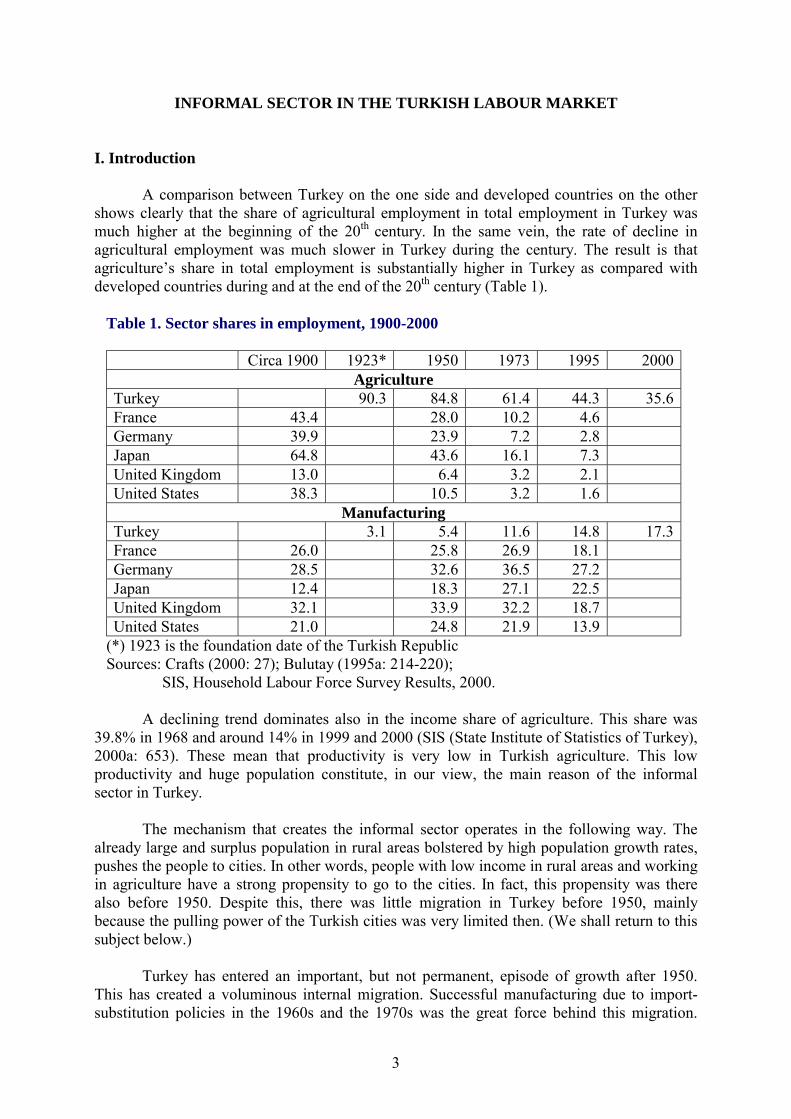
INFORMAL SECTOR IN THE TURKISH LABOUR MARKET I. Introduction A comparison between Turkey on the one side and developed countries on the other shows clearly that the share of agricultural employment in total employment in Turkey was much higher at the beginning of the 20th century. In the same vein, the rate of decline in agricultural employment was much slower in Turkey during the century. The result is that agriculture’s share in total employment is substantially higher in Turkey as compared with developed countries during and at the end of the 20th century (Table 1). Table 1. Sector shares in employment, 1900-2000
Circa 1900 1923* 1950 1973 1995 2000 Agriculture
Turkey 90.3 84.8 61.4 44.3 35.6 France 43.4 28.0 10.2 4.6 Germany 39.9 23.9 7.2 2.8 Japan 64.8 43.6 16.1 7.3 United Kingdom 13.0 6.4 3.2 2.1 United States 38.3 10.5 3.2 1.6
Manufacturing Turkey 3.1 5.4 11.6 14.8 17.3 France 26.0 25.8 26.9 18.1 Germany 28.5 32.6 36.5 27.2 Japan 12.4 18.3 27.1 22.5 United Kingdom 32.1 33.9 32.2 18.7 United States 21.0 24.8 21.9 13.9
(*) 1923 is the foundation date of the Turkish Republic Sources: Crafts (2000: 27); Bulutay (1995a: 214-220); SIS, Household Labour Force Survey Results, 2000. A declining trend dominates also in the income share of agriculture. This share was 39.8% in 1968 and around 14% in 1999 and 2000 (SIS (State Institute of Statistics of Turkey), 2000a: 653). These mean that productivity is very low in Turkish agriculture. This low productivity and huge population constitute, in our view, the main reason of the informal sector in Turkey. The mechanism that creates the informal sector operates in the following way. The already large and surplus population in rural areas bolstered by high population growth rates, pushes the people to cities. In other words, people with low income in rural areas and working in agriculture have a strong propensity to go to the cities. In fact, this propensity was there also before 1950. Despite this, there was little migration in Turkey before 1950, mainly because the pulling power of the Turkish cities was very limited then. (We shall return to this subject below.) Turkey has entered an important, but not permanent, episode of growth after 1950. This has created a voluminous internal migration. Successful manufacturing due to import-substitution policies in the 1960s and the 1970s was the great force behind this migration.

4
Uneducated people from rural areas have been capable to find satisfactory jobs in manufacturing factories in the cities. But manufacturing has not been so successful after the 1980s. Export-promotion policies have replaced the import-substitution policies. New technology and employment trends in the world and Turkey have not been so friendly towards the uneducated masses in rural areas. Consequently, the pull of the cities has not been as powerful after 1980 as it was in the 1960s and the 1970s. (1) The general trend has always been a great surplus labour in rural areas, ready and wishful to move to cities, mainly because of low productivity and standard of living. The pull of the cities has been generally inadequate to absorb and employ these large volumes of people in satisfactory jobs. These have ushered in the informal sector into the cities, especially into the mega city of Istanbul. These have led to the need of a new classification that includes the informal sector. We think that the informal sector should be put into a new classification, which is composed of agricultural, informal-sector, formal-sector and public-sector employment. The last component covers the employment in government and public enterprises. This classification can serve an important function alongside with the traditional classification of agriculture, industry and services. (See, Tables 6, 7.) The importance of this new classification or the inclusion of the informal sector in the new classification arises from the low productivity of the informal sector. It is not higher than agricultural productivity in general, but larger than that of backward regions. It is, on the other hand, considerably lower than formal-sector productivity (Table 13). The low productivity in these two sectors (agriculture and informal sectors) is a fundamental characteristic of the Turkish labour market. In fact, this low productivity is a better measure of the weakness of the labour market in Turkey than the standard unemployment rate, like in other similar countries, for the following reasons: i) The standard unemployment rate is not highly relevant in a labour market where agriculture dominates. ii) An unemployment insurance system did not exist in Turkey until very recently. In fact, this very new insurance is still not in operation at present. Moreover, it will offer very little compensation when applied. These force people to work even for very little in return. iii) As a result, the unemployment rate in Turkey, at a rate of about 6-8 % until very recently, is not higher than those of developed countries. But the Turkish labour market is not as healthy as those of the developed economies. iv) Another concept, the employment rate, measures better the Turkish labour market than the standard unemployment rate. In other words, the low employment and participation rates of Turkey characterize much better the weakness of the Turkish labour market than the unemployment rate. (2) There is a strong tendency in the Turkish population since 1950 to be out of the labour market. These mean that underutilization, underemployment and low productivity dominate in the Turkish labour market. The standard unemployment rate falls considerably short of explaining these phenomena. But these do not entail dispensing with the unemployment rate, but having recourse to other concepts in order to complement the unemployment rate.
5
The informal sector we investigate here constitutes such a concept. There are, of course, other similar concepts such as added and discouraged workers and underemployment. Child labour, unrecorded employment can be cited as other examples of such concepts. (3) Negative shocks, crises could induce people, for example the wives of the families, to seek jobs in the labour markets. Added workers are the results of these kinds of phenomena. Discouraged workers constitute a permanent feature of the labour markets and the labour force surveys. It is difficult to detect and follow the existence and volume of the added workers on the basis of the Turkish data set. By contrast, discouraged workers have been estimated regularly in the Turkish Household Labour Force Surveys (HLFSs). They display a fluctuating trend with a total value of 139,000 in 2000 (SIS, 2000b: 9). Underemployment has also been estimated and published in the SIS’s HLFSs. It is noted in (Horton, Kanbur, Mazumdar, 1994:15) that “… underemployment has generally moved with the unemployment rate” in the developing countries. In order to see the case in this regard for Turkey, we have obtained correlation coefficients between the unemployment rate and underemployment ratio in Turkey. These coefficients show a rather weak relation with a value of 0.38 for the whole of Turkey and 0.19 for urban places. But this could be due to the different and more comprehensive meaning of the underemployment concept used in Turkey. This Turkish concept has two major components: “Seeking a job because of insufficient income” and “working less than 40 hours because of economic reasons”. The primary component is the first one with a share of 78% in 2000 (SIS, 2000b: 337). When we depend on the concept of “working less than 36 hours in a week”, which suits better the practices of some developing countries (see, for example, (Betcherman, Islam, 2001: 12, 13) for the some East Asian countries), the mentioned correlation coefficients become 0.16 for whole Turkey and 0.07 for urban places. It can, thus, be said that the relationship between unemployment and underemployment is very weak in Turkey. The explanations given above show that the informal sector is a fundamental structural fact and problem with a rather long history in Turkey. The informal sector with this characteristic should be distinguished from the recent increasing trend in the informalization of employment under the impact of the globalization of economies and the intensification of international competition. This does not mean, however, that the recent globalization trends did not and cannot affect the trends and developments in the Turkish informal sector. Work or job sharing plays an important part in the Turkish informal sector, as we shall express below. But it has a different character from that of some job and work sharing practices in the developed countries. For example, in the United States, “… Job sharing is a form of regular part-time work in which two people voluntarily share the responsibilities of one full-time position …”. Similarly, “work sharing is an alternative to layoffs in which all or part of an organization’s workforce temporarily reduces hours and salary in order to cut operating costs.” (Olmsted, Smith, 1994: 145, 315). The remainder of the article is organized in five sections. We shall present definitions and estimates of the informal sector in Turkey in the following section. The third section will take up the subject of “the factors that determine the informal sector”. “The composition of the informal sector” will constitute the subject matter of the fourth section. The fifth section

6
will be devoted to the treatment of “the characteristics of the informal activities”. The article will end with “concluding remarks”. II. The Definitions and Estimates of the Informal Sector in Turkey The informal sector is used with different and overlapping meanings. There are also various related concepts. (4) The informal sector concept we use in this article relates to the labour market and is defined in what follows. We should stress at the outset that it is different from unrecorded employment. (5) The history of the studies on the informal sector in Turkey goes far back, to 1950 and even before. These useful studies have been done primarily by social scientists rather than economists. They have investigated mainly squatter settlements (Gecekondu) and have reached important findings. One paramount finding among them shows that the Turkish squatter settlements are quite different from those, for example, in Latin America in their relatively sound house structures, rich household facilities and appliances and particular cultures. As far as we know, the measurement attempts on a macro scale have a recent past. These attempts have been possible after the introduction of HLFS in 1988 by SIS. One of us has estimated the shares of the informal sector in his researches by depending on these HLFS results (Bulutay, 1995a; Bulutay, 1998; Bulutay, 2000). SIS conducted an independent and comprehensive survey on the informal sector in 2000 (Urban Areas Small and Unincorporated Enterprise (Informal Sector) Survey, (SIS, 2001b)). We depend here, in this article, on two data sets. i) Data Set I. The time series estimates of the informal sector for 1990-1999 (Bulutay, 2000) or the numbers reached with the concepts defined in it. ii) Data Set II. The figures of the Survey of SIS mentioned just above (SIS, 2001b). All the numbers in these two data sets pertain to non-agricultural employment. Data Set II belong only to urban places. For Data Set I, we use figures both for whole Turkey and urban places.
A. Definitions of the Informal Sector The basic nature of the informal sector units can be summarized in the following way with the words of ILO (1993: 7, 8, 39): Informal sector units “... generally work at a low level of organisation, have little or no division between labour and capital, and carry on their activities on a small scale. They are run by self-employed persons working alone, with the help of unpaid family members or, in some cases, a few hired workers or apprentices ... Informal sector units can adapt quickly to changing economic conditions because they can lay off workers easily or hire additional workers; labour relations are based on personal and social relations rather than formal guarantees.” We think that the salient features of the informal sector concept of (ILO, 1993) can be presented in the following points: i) The informal sector units can be defined as “... unincorporated enterprises owned and operated by households or household members, either individually or in partnership with others.” ii) “... Own account enterprises ... should form the core part of an international definition of the informal sector...” Own account enterprises are those “units owned and

7
operated by own-account workers, either alone or in partnership with members of the same or other households, who do not employ any employees on a continuous basis but who may employ unpaid family workers and/or employ occasional hired workers to meet temporary work needs (casual employees)...” iii) But the informal sector needs not to be restricted to own-account enterprises only. Other units can be included by countries. “The group of units that may be included by countries on an optional basis is called ‘enterprises of informal employers’ in this report”. iv) Two criteria are proposed in order to identify enterprises of informal employers: “The size of the units in terms of employment, and the conditions of employment in terms of the social and legal protection of workers.” v) There are considerable variations between countries as to what number should be used as upper cut-off point for employees. “It therefore seems neither useful nor possible to recommend any specific cut-off point to be applied universally...” vi) It is probable “... that for many countries a definition of the informal sector which includes all small enterprises of employers would be too broad.”. It is therefore useful to propose a further limiting criterion: “The criterion can be operationally defined in terms of the existence or non-existence of employment contracts which commit the employer to pay the respective taxes and social security contributions on behalf of his or her employees and/or which make the employment relationship subject to standard labour legislation. Workers who are employed on the basis of such employment contracts may be called ‘regular employees’ ... It is suggested that small enterprises of employers, which do not employ any regular employees, may be considered part of the informal sector as ‘enterprises of informal employers’.” The definitions of the informal sector we are going to use in what follows are in accord with the above proposals on the whole. The unincorporated and tax related characters of the informal sector are not taken into account in our Data Set I below. This is due to the resources used (Turkish Household Labour Force Surveys), which do not include that type of data for the years before 2000. The Data Set II fit better to the informal sector concept of ILO. Date Set I (For 12 years old and over unless stated otherwise). T. Bulutay has found it proper to use five different concepts in order to take the multi-dimensional nature of the informal sector adequately into account (Bulutay, 2000, 59, 60). Definition 1. Employment in Non-Fixed Workplaces. Definition 2. Extension of Definition 1. The addition of the employment in fixed private workplaces with 1, 2 and 3 employed persons to the employment in Definition 1. Definition 3. The Definition that Depends on the Status in Employment. It covers the self-employed and unpaid family workers. Definition 4. Extension of Definition 3. The addition of the regular and casual employees who work in private workplaces with 1, 2 and 3 employed persons to the employment in Definition 3.
8
Definition 5. The Definition that Depends on Persons Employed in Small Workplaces. It expresses the share of the employment of the employed persons working in workplaces with 1, 2 and 3 employed persons in total (all workplaces) employment. Data Set II (For 12 years old and over unless stated otherwise). The informal sector covers the following economic units: i) They are unincorporated (they are units of individual property or simple partnership). ii) They pay constant taxes or none at all. iii) They have 1-9 employed persons. All these three conditions should be fulfilled at the same time. The numbers pertain to non-agricultural employment in urban areas, as pointed out above. The first condition dominates in this definition and restricts the volume of the informal sector greatly. As a result, it produces a small share for the informal sector in Turkey. The informal sector’s share according to this definition is, in fact, lower than that of the first definition in Data Set I, which shows the employment in non-fixed workplaces. In this article, we intend to take, with these ideas in mind, the informal sector share attained through the Data Set II as the minimum value of the Turkish informal sector. B. Estimated Values We present the informal sector shares in Table 2 (for whole Turkey) and Table 3 (for urban places) for Data Set I. We have only eight (three in (Bulutay, 2000)) three numbers for Definitions 2 and 4, because of the data limitation. The figures for the first definition are lower before October 1993 than after that date in both tables. This might, however, be due to the specialties of the data rather than the change of trend in economic activities. The figures are presented as shares of employment in Table 2 and Table 3. We use absolute numbers which correspond to these shares in our estimation exploration in Section III. These absolute numbers are given in Table 4 and Table 5. We compose Table 6 and Table 7 of new classification referred to above by using these estimations in Table 4 for the informal sector. The figures for total, agricultural and public employment in Table 6 are taken from SIS sources. The formal sector employment is calculated as residual. (The percentages in Table 7 pertain to total employment, not only to non-agricultural employment.)

9
Table 2. Share of the informal sector employment in non-agricultural employment (%), Turkey
Years Period Definition 1
Definition 2
Definition 3
Definition 4
Definition 5
April 5.8 22.7 37.4 1990 October 9.5 23.3 36.4 April 11.3 22.5 36.8 1991 October 11.3 23.2 36.2 April 11.9 23.0 36.8 1992 October 14.0 23.6 36.4 April 12.2 20.2 35.0 1993 October 18.2 20.9 36.2 April 17.2 20.3 36.3 1994 October 18.5 21.8 38.1 April 17.7 20.8 36.9 1995 October 17.6 39.9 20.7 27.8 35.6 April 16.9 39.6 20.3 27.5 35.6 1996 October 17.2 39.5 20.0 26.7 34.8 April 16.8 39.7 20.3 27.0 35.6 1997 October 16.9 37.4 19.4 25.7 32.4 April 16.2 37.1 18.9 25.4 33.2 1998 October 17.0 37.9 18.4 24.6 33.3
1999 April 17.0 38.5 20.8 27.5 34.5 Source: SIS, Household Labour Force Survey Results Table 3. Share of the informal sector employment in non-agricultural employment (%), Urban
Years Period Definition 1
Definition 2
Definition 3
Definition 4
Definition 5
April 5.7 20.8 34.3 1990 October 9.1 22.0 34.5 April 10.2 21.0 34.1 1991 October 10.9 20.8 34.1 April 10.8 20.7 34.4 1992 October 11.5 19.7 33.6 April 12.0 18.8 33.3 1993 October 16.1 19.2 34.3 April 15.2 18.9 34.7 1994 October 16.3 20.1 35.7 April 16.4 19.1 34.8 1995 October 15.2 36.8 19.2 26.4 32.9 April 14.6 36.7 17.9 25.3 33.1 1996 October 15.4 37.5 17.4 24.5 33.2 April 15.1 36.5 18.1 24.7 32.5 1997 October 15.3 34.6 17.9 24.3 30.3 April 15.4 35.0 17.1 23.6 30.7 1998 October 15.2 34.8 16.5 22.8 30.1
1999 April 15.8 36.4 18.8 25.6 32.5 Source: SIS, Household Labour Force Survey Results

10
Table 4. Informal sector employment in non-agricultural employment, Turkey (‘000)
Years Period Definition 1
Definition 2
Definition 3
Definition 4
Definition 5
April 553 2 177 3 589 1990 October 1 009 2 469 3 857 April 1 147 2 281 3 734 1991 October 1 155 2 369 3 690 April 1 303 2 513 4 033 1992 October 1 547 2 607 4 020 April 1 260 2 086 3 617 1993 October 2 053 2 355 4 073 April 1 849 2 182 3 895 1994 October 2 104 2 485 4 332 April 1 937 2 277 4 047 1995 October 1 961 4 444 2 307 3 097 3 971 April 1 969 4 608 2 357 3 198 4 136 1996 October 2 016 4 641 2 347 3 132 4 087 April 1 951 4 600 2 354 3 130 4 123 1997 October 2 127 4 709 2 440 3 239 4 082 April 1 971 4 527 2 310 3 097 4 045 1998 October 2 114 4 713 2 288 3 057 4 133
1999 April 2 033 4 598 2 485 3 282 4 128 Source: SIS, Household Labour Force Survey Results Table 5. Informal sector employment in non-agricultural employment, Urban (‘000)
Years Period Definition 1
Definition 2
Definition 3
Definition 4
Definition 5
April 407 1 487 2 457 1990 October 719 1 732 2 716 April 769 1 586 2 571 1991 October 832 1 580 2 593 April 851 1 628 2 712 1992 October 926 1 582 2 696 April 963 1 505 2 673 1993 October 1 344 1 606 2 860 April 1 244 1 542 2 832 1994 October 1 404 1 728 3 069 April 1 397 1 628 2 962 1995 October 1 335 3 234 1 686 2 316 2 894 April 1 286 3 240 1 582 2 238 2 927 1996 October 1 355 3 303 1 536 2 156 2 921 April 1 330 3 212 1 594 2 178 2 860 1997 October 1 458 3 300 1 708 2 313 2 887 April 1 431 3 248 1 589 2 190 2 854 1998 October 1 439 3 297 1 559 2 162 2 850
1999 April 1 446 3 324 1 720 2 335 2 971 Source: SIS, Household Labour Force Survey Results

11
Table 6. Employed persons by informal, formal and public sector in Turkey (‘000)
Informal sector Formal sector Public sector
Year Total
employment Agricultural employment
Definition 1
Definition 3
Definition 5(5)
Definition 1
Definition 3
Definition 5 Total
Enterprises Other
1995(1) 21 377 10 226 1 961 2 307 3 880 6 541 6 195 4 622 2 649 601 2 048 1996(2) 21 538 9 857 1 993 2 352 3 998 6 811 6 451 4 806 2 878 558 2 320 1997(2) 21 008 8 913 2 039 2 397 3 991 7 261 6 903 5 309 2 795 530 2 265 1998(2) 21 595 9 282 2 043 2 299 3 990 7 388 7 131 5 440 2 883 529 2 354 1999(3) 22 049 10 096 2 033 2 485 4 046 7 064 6 612 5 051 2 856 523 2 333 2000(4) 20 934 7 449 2 381 2 658 4 609 8 197 7 920 5 969 2 907 2 907
Note: (1) October 1995. (2) Figures pertain to whole years as averages of two six months values. (3) April 1999. (4) According to HLFS in 2000 with new weights. (5) Informal sector in Definition 5 includes also those in the public sector. These should be subtracted from the informal sector in this table in order to remove double counting. This subtraction causes the figures in this column to diverge somewhat from those in Table 4. Sources: Table 4 above, SIS HLFSs and other SIS sources.
Table 7. Distribution of employed persons by informal, formal and public sector in Turkey (%)
Informal sector Formal sector Public sector
Year Total
employment Agricultural employment
Definition 1
Definition 3
Definition 5
Definition 1
Definition 3
Definition 5 Total
Enterprises Other
1995 100.0 47.8 9.2 10.8 18.2 30.6 29.0 21.6 12.4 2.8 9.6 1996 100.0 45.8 9.3 10.9 18.6 31.6 30.0 22.3 13.4 2.6 10.8 1997 100.0 42.4 9.7 11.4 19.0 34.6 32.9 25.3 13.3 2.5 10.8 1998 100.0 43.0 9.5 10.6 18.5 34.2 33.0 25.2 13.4 2.4 10.9 1999 100.0 45.8 9.2 11.3 18.4 32.0 30.0 22.9 13.0 2.4 10.6 2000 100.0 35.6 11.4 12.7 22.0 39.2 37.8 28.5 13.9 13.9
Source: Table 6.
12
The volume of the informal sector in Data Set II is 1,340 thousand persons (SIS, 2001b: 2). This corresponds to a 12.5% share in urban non-agricultural employment. If we calculate the informal sector according to Definition 1 in Data Set I for the same places we reach 1,607 thousand persons as magnitude and 14.3% as share for 2000 (SIS, 2000b). These point to the fact that estimate of Data Set II constitutes a minimum value as said above. We could say, by depending upon the estimates of Data Set I (for 1, 3 and 5 Definitions) and Data Set II together, that the share of the informal sector employment is in the range of 12.5-32.5% around the year 2000 in Turkish urban places. The same share falls to the range of 17.0-34.5% in 1999 for whole Turkey (This is only for Data Set I, since there is no such figure in Data Set II). The share of the informal sector in non-agricultural labour force in Latin America has a minimum value of 37.1% (for Uruguay (Moutevideo only)) in Latin America for 1997. It can reach 59.6% in the same year for Brazil, Mexico and Paraguay. The share for Latin America as a whole in 1997 was 57.7%. (6) These show that the informal sector has more weight in Latin America than in Turkey. But the comparatively higher shares of Latin America could be due to the lower share of agricultural employment there. We do not have comparable figures for East Asia. But it is proclaimed in a recent study (Betcherman, Islam, 2001: 15, 16) that “self-employed and unpaid family workers are often (though not always) in the informal sector… ”. Therefore, the increase in the relative share of this category suggests a shift from the formal to the informal sector. The experiences of various countries of East Asia in the recent crisis exhibit different trends, as explained in the same paper. There was, for example, a slight increase in the share of the self-employed and unpaid family workers in South Korea from 1997 to 1998. The share of self-employment rose from 28.1% in 1997 to 29.2% in 1998. The same rise was from 8.8% to 9.5% for unpaid family workers. The share of the employees declined slightly from 63.1% to 61.35% (p.16). We do not agree with this understanding of informal sector. (7) Nevertheless, we present the relevant figures for Turkey for 1993-2001, including the crisis years (1994, 1999, 2001) in Table 8. The comparison shows two things: i) It is difficult to observe a clear shift to self-employment and unpaid family work in crisis years. ii) The share of employees is higher in South Korea than in Turkey.

13
Table 8. Employment shares by year and status in employment, Turkey (15 years old and over) (%)
Years
Period
Total employment
(‘000)
Regular and causal
employee
Self-employment
and employer
Unpaid family worker
April 17 901 41.2 31.6 27.2 1993 October 18 194 43.4 30.8 25.8 April 19 397 39.4 30.7 29.9 1994 October 19 404 42.9 31.1 26.0 April 19 606 41.9 29.8 28.3 1995 October 20 180 42.0 31.0 27.0 April 20 066 43.4 28.9 27.7 1996 October 20 708 43.3 29.5 27.2 April 20 477 42.7 30.0 27.3 1997 October 20 247 47.7 30.4 21.9 April 20 351 45.0 30.2 24.8 1998 October 21 394 45.3 29.5 25.2 April 21 590 43.7 28.0 28.3 1999 October 21 237 45.0 30.3 24.7 (I) 19 006 49.5 30.9 19.6 (II) 21 312 48.7 30.1 21.2 (III) 21 727 47.6 29.9 22.5 2000
(IV) 20 182 51.3 29.7 19.0 (I) 19 222 50.4 30.6 19.0 (II) 21 127 46.4 30.0 23.6 2001 (III) 21 875 46.0 29.1 24.9
Source: SIS, Household Labour Force Survey Results Note: The figures, for the years before 2000, were revised according to the projection method implemented in 2000. We depend mainly on Data Set I in the following section. We use the same data set partly also in section four. The main source of data of the fourth and fifth sections is Data Set II. III. Main Determining Factors of the Informal Sector A. Essentials of Our Method of Analysis In our efforts to determine the contributions of primary factors we have recourse to regression analysis. We have chosen the main relevant variables with likely important impacts on the development in the informal sector. We have used simple ordinary least squares as technique of analysis. Our first choice was to use logarithmic scale for variables. But the fit reached by using this scale was less satisfactory as compared to that of the arithmetic scale. As a result, we have decided to depend on arithmetic scale. We have five informal sector concepts to use in a time series regression analysis. Two of them, those in Definition 2 and 4, are the ones that extend the previous definitions. Further,

14
the extension factors are included in the concept of Definition 5. We have found it appropriate, with these ideas in mind, to exclude the concepts in second and fourth definitions from our data set. This helps relieve our calculations and presentations from being cumbersome. Consequently, we have used the data in Table 4 as dependent variables in our estimations. We have, next, tested the potential usefulness of the remaining three concepts, by using graphs of them. The graphs of both global and percentage changes, in total and urban Turkey, that show the time trend of the first concept displays more erratic movements in time. This largely stems from a drastic change in October 1993 in the HLFS’s basic data set of this concept as noted above. We have also reached graphic representations of the fit of the mentioned three concepts by using the equations with best estimates. The graph shows that the fit of the first concept has a less satisfactory feature than that of the concepts three and five. Consequently, we have found it appropriate to concentrate on concepts three and five. Yet, we have presented an estimation equation for concept 1 in Table 9 (Model 1). We think that the primary variables that determine the size and share of the Turkish informal sector can be put in three main groups: i) Income variables: The performance of the national income through time. The relative values or productivities of the urban and rural productions which function as a determining force for the volume and direction of migration. ii) Population variables: Higher natural population growth rate in rural areas. The even higher population growth in urban places arising mainly from migration. iii) Employment variables: The capacity of the economy to create productive and large volume of employment in the whole economy, in the non-agricultural sectors, in manufacturing, in agriculture and in public sector. In addition, we have used the export and import variables in order to test the validity of a current view which advises to make a distinction between exports and imports in their different impacts on the informal sector. Consequently, our data set of variables is composed of the following ones: Gross Domestic Product (GDP), manufacturing income (MI), agricultural productivity (AP), the difference between non-agricultural and agricultural productivity (DP), the ratio of non-agricultural productivity to agricultural productivity (RP), population of rural areas (VPR), population of urban areas (VPU), total employment (TE), non-agricultural employment (NE), agricultural employment (AE), manufacturing employment (ME), government employment (GE), imports (I), exports (E), exports of textiles (ET) and exports of wearing apparel (EW). B. Findings and Comments We have used various combinations of the above variables in our testing efforts. We present the equations we have found statistically more significant in Table 9. (The equation in Model 7 has a different character we shall explain below.) We have depended upon the following main reasons in our following interpretations:
i) Our general theoretical expectations. ii) Statistical significance test measures.

15
}
iii) The relative reliability of the statistical data sources used. We offer our explanations as suggestions. They constitute only suggestions, because regression analyses with different assumptions, specifications, time spans, variable combinations and data sets could paint quite a different picture, as the contradictory findings of various studies of economic literature amply attest. Table 9. Regression models
y1=-4516.402-0.00005776*x1+0.256*x2+1.019*x3 Model 1 R square = 82.6
Adj. R square =79.2
F=23.8 tx1=-1.917 tx2=4.299 tx3=2.387
y2=1401.073-0.0000361* x1+0.0692* x2+0.632* x3 Model 2 R square = 42.6
Adj. R square =31.3 F=3.7 tx1=-2.406
tx2=2.337 tx3=2.978
y2=859.447-0.00003569* x1+0.492* x3+0.256* x4 Model 3 R square = 69.3
Adj. R square =63.1 F=11.273 tx1=-4.668
tx3=5.292 tx4=4.820
y3=1343.875-0.00004365* x1+0.131* x2+0.711* x3 Model 4 R square = 66.6
Adj. R square =59.9 F=9.975 tx1=-2.472
tx2=3.757 tx3=2.843
y3=-140.340-0.0000414* x1+0.509* x3-0.389* x5+0.548* x6-0.462* x7 Model 5 R square = 84.8
Adj. R square =78.9 F=14.472 tx1=-4.023
tx3=3.822 tx5=-2.086 tx6=5.878 tx7=-4.875
y2=847.379-0.03204* x2+0.318* x4-0.0000905* x8 Model 6 R square = 70.4
Adj. R square = 64.5 F=11.9 tx2=-1.640
tx4=5.645 tx8=-3.411
y2=925.047-0.02652* x2+0.296* x4-0.00008997* x8-3.54* x9 Model 7 R square = 70.9
Adj. R square = 62.5 F=8.5 tx2=-1.132
tx4=3.984 tx8=-3.296 tx9=-0.457
y1: Definition 1 y2: Definition 3 Data Set I y3: Definition 5 X1: Gross Domestic Product (GDP) X2: Population of urban area (VPU) X3: Agricultural productivity (AP) X4: Non-agricultural employment (NE) X5: Manufacturing employment (ME) X6: Total employment (TE) X7: Agricultural employment (AE) X8: Manufacturing income (MI) X9: The ratio of non-agricultural productivity to agricultural productivity (RP)

16
In our view, a distinction should be made between two types of internal migration in Turkey. The people with human capital and the capacity to earn higher income in cities (especially in great cities), for example, those originating in urban places, constitute first type. The migration of these people has usually been activated by income variables. This migration is linked more with the formal sector. For instance, the growth of national income and manufacturing incomes affect mainly formal and government employment. In the second type of migration, poor people’s migration, originating mainly from rural areas, is involved. The impact of the income variables in this case is not as important as in the first type of migration. The main determining forces in this second type of migration are those of population and employment. What is involved in the informal sector is this second type of migration. The push of the rural areas and agriculture, as a result of both growth in rural population and improvement in agricultural productivity, plays a decisive role in this migration. The expansion of the employment opportunities in urban places constitutes the other principal force. There are two sources of this expansion which is reflected on urban population and employment: i) The expansion resulting from the development of the urban economies. ii) The work sharing of the new migrants that constitutes an apparent rather than a real employment expansion. This last kind of expansion constitutes the weakest side of the informal sector employment. This view on the second type of migration and the informal sector is generally confirmed by the econometric tests we applied: GDP (x1) has always a negative coefficient in all the equations tested. This is observed in Table 9. This could be attributed mainly to the fact that the main impact of the national income growth is channeled to the increases in public and formal employment. Similarly, agricultural productivity (x3) has always a positive impact on the informal sector in the equations of Table 9. This could be attributed to the surplus labour in agriculture resulting from, for example, mechanization of agriculture. This effect has been accentuated in combination with higher population growth in rural areas. A likely important factor of influence is the comparative productivity in non-agricultural sectors and agriculture. This constitutes probably the main variable in the first type of migration. But its impact on the second type of migration, and consequently on the informal sector seems to be negative. We tested two different concepts, the difference between the mentioned productivities and their ratios, for this purpose. The coefficients always had negative values. This shows, in our view, once again the insensitivity of the informal sector to income and productivity variables (as measure of wages). The last income factor tested is manufacturing income (x8). It is related more to the first type of migration and the formal sector. Its impact on the informal sector could, therefore, be expected to be negative rather than positive. The estimated coefficients reached in equations (Models 6 and 7) confirm this expectation. All these show that income variables have hardly a positive impact on the expansion of the informal sector in Turkey. By contrast, the coefficients of population and employment
17
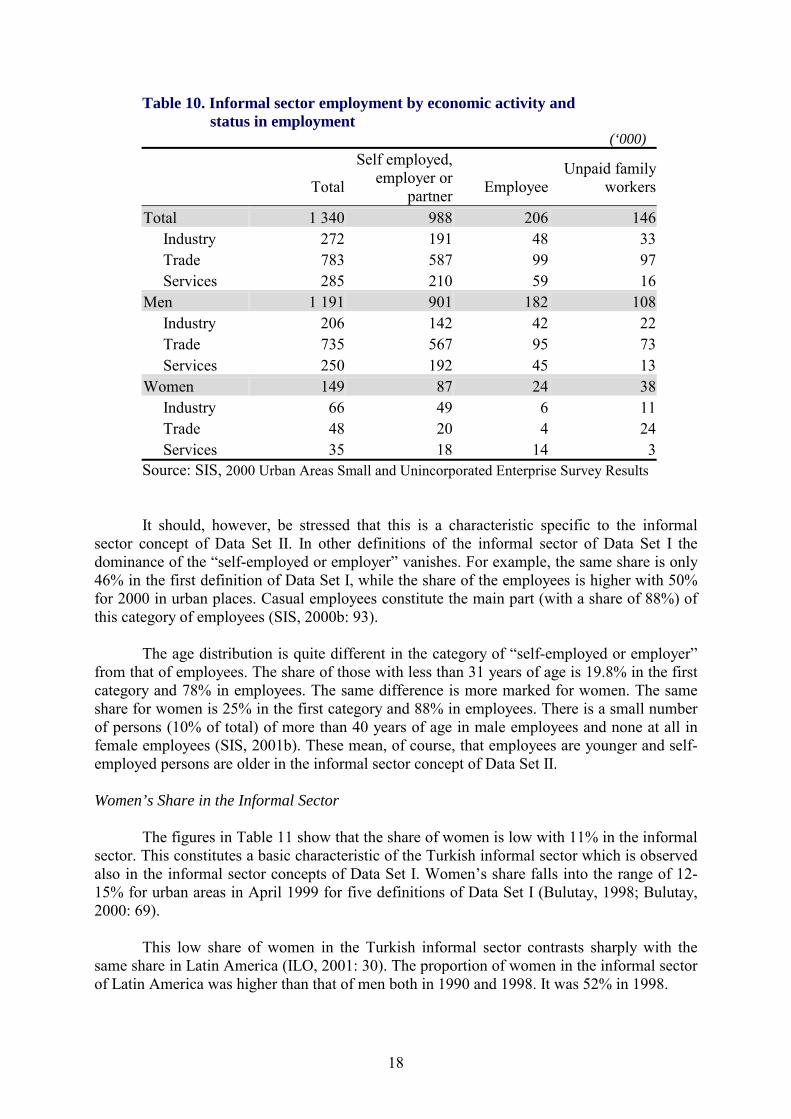
variables are generally positive: Coefficients for non-agricultural employment (x4) and total employment (x6) are always positive. Coefficients for urban population (x2) are generally (in 3 cases out of 5) positive. On the other hand, manufacturing employment (x5) has a negative impact as it is seen in Table 9. These estimated values and negative coefficient of agricultural employment (x7) are generally in accordance with the theoretical expectations expressed above. We applied another method by composing four groups of variables: i) population, ii) employment, iii) income, and iv) comparative productivity groups. We chose next the variable with best fit and explanation power from each group and used the variables in a single equation. This is the equation in Model 7 shown in Table 9. Our main intention to form this equation in Model 7 was to see the impact of the variable that shows the comparative productivity of non-agricultural and agricultural activities. The negative sign of the coefficient of x9 in Table 9 fits our explanations above that point to the insensitivity of the informal sector to growth, income and relative productivities. But the coefficient is statistically insignificant. There is a powerful current of thought which claims that export creates abundant job opportunities in the informal sector, whereas import is linked more with the formal sector. We formed and tested various equations with several variables (total imports, total exports, textile exports, wearing apparel exports) for all our definitions of the informal sector in order to test the validity of this claim for the Turkish case. We have not been able to reach statistically significant equations and coefficients. The only finding, though not clear-cut, from these tests is the likely positive impact of the textile exports on the informal sector (for Definition 5). The main conclusion we reach in this section is the insensitivity of the informal sector employment to the growths of GDP and productivity in urban places. In other words, the informal sector in Turkey is a powerful movement related rather to population and employment expansion, not to the income growth. Work sharing dominates in it. The wage or income level in the informal sector is, as a result, low in Turkey as we shall also observe in Table 13 below. (8) Moreover, the informal sector has a negative impact on the old inhabitants of urban places, who lose, at least partly, their jobs or income capacities as a result of poor people’s migration. A parallel development is observed in retirement pensions. The great increases in the number of retired persons, because of the exceptional ease of retirement (this has changed recently), have helped make the all pensions dramatically inadequate. IV. Composition of the Informal Sector Status in Employment and Age Distribution The share of “self-employed or employer” plus “business partner” plus “unpaid family workers” amounts to 85%, according to the informal sector concept of Data Set II (Table 10). The same share in urban areas of whole Turkey is only 28% (SIS, 2000b: 60). The same figures show the dominance of “self-employed or employer” (with a share of 71%) in the informal sector concept of Data Set II.
18
Table 10. Informal sector employment by economic activity and status in employment
(‘000)
Total
Self employed, employer or
partner
Employee
Unpaid family workers
Total 1 340 988 206 146 Industry 272 191 48 33 Trade 783 587 99 97 Services 285 210 59 16 Men 1 191 901 182 108 Industry 206 142 42 22 Trade 735 567 95 73 Services 250 192 45 13 Women 149 87 24 38 Industry 66 49 6 11 Trade 48 20 4 24 Services 35 18 14 3
Source: SIS, 2000 Urban Areas Small and Unincorporated Enterprise Survey Results It should, however, be stressed that this is a characteristic specific to the informal sector concept of Data Set II. In other definitions of the informal sector of Data Set I the dominance of the “self-employed or employer” vanishes. For example, the same share is only 46% in the first definition of Data Set I, while the share of the employees is higher with 50% for 2000 in urban places. Casual employees constitute the main part (with a share of 88%) of this category of employees (SIS, 2000b: 93). The age distribution is quite different in the category of “self-employed or employer” from that of employees. The share of those with less than 31 years of age is 19.8% in the first category and 78% in employees. The same difference is more marked for women. The same share for women is 25% in the first category and 88% in employees. There is a small number of persons (10% of total) of more than 40 years of age in male employees and none at all in female employees (SIS, 2001b). These mean, of course, that employees are younger and self-employed persons are older in the informal sector concept of Data Set II. Women’s Share in the Informal Sector The figures in Table 11 show that the share of women is low with 11% in the informal sector. This constitutes a basic characteristic of the Turkish informal sector which is observed also in the informal sector concepts of Data Set I. Women’s share falls into the range of 12-15% for urban areas in April 1999 for five definitions of Data Set I (Bulutay, 1998; Bulutay, 2000: 69). This low share of women in the Turkish informal sector contrasts sharply with the same share in Latin America (ILO, 2001: 30). The proportion of women in the informal sector of Latin America was higher than that of men both in 1990 and 1998. It was 52% in 1998.

19
Table 11. Informal sector employment by age group, sex and status in employment, 2000 (‘000) Age group and sex Total
Self-employed, employer or
partner Employee Unpaid family
worker Total 1 340 988 206 146 12-30 466 189 160 107 31 + 874 799 46 39 Men 1 191 901 182 108 12-30 407 167 139 91 31 + 784 734 43 17 Women 149 87 24 38 12-30 59 22 21 16 31 + 90 65 3 22 Source: SIS, 2000 Urban Areas Small and Unincorporated Enterprise Survey Results
The primary reason behind this low level of women’s involvement in the Turkish informal sector is the general low participation rate of women with low education in urban places. The labour force participation rate of women with less than high school education in Turkish urban places was only 9.9% in 2000 (SIS, 2000b: 45). It is normal that this characteristic is also reflected in the informal sector. The underlying reason of this phenomenon, which prevails also in Middle Eastern countries, is open to discussion. We do not intend to enter here such a comprehensive discussion and wish to confine our explanations to drawing attention to two important facts. This low labour participation rate of women could be attributed to the religion of Islam. But we think that it would not be reasonable to attach such a fundamental phenomenon to a one-dimensional explanation. For one thing, women’s hard household work within the family contributes immensely to the family welfare in low-income and low-education households. (For the higher capacity in bargaining, lesser tendency to engage in violence of women in poor families and the view of the great impact of Islamic culture on women’s roles, see (Granovetter, 2000: 273, 274).) The low women’s share in the labour market and the informal sector in Turkish urban places has a companion in the fact that young boys are the second breadwinners, after the fathers, of the poor families. These boys, instead of mothers, work in the labour market. (See, (Bulutay, 2001).) A supplementary reason is the less appeal of the work outside fixed workplaces for women. In urban places, the share of women who work in those kinds of places (in market places plus mobile and irregular places) was only 2.6%, whereas the same share was 15.2% for men in 2000 (SIS, 2000b: 90).

20
The Education Level in the Informal Sector The education level of the people in the informal sector is very low as expected (Table 12). The share of those with high school education and more is 14.6% in this sector (SIS, 2001b). The same share in the whole of Turkish urban places was 38% in the same year of 2000 (SIS, 2000b: 63). This is, of course, a considerable difference.
Table 12. Informal sector employment by educational status, sex and status in employment, 2000 (‘000)
Education level and sex Total
Self-employed, employer or
partner Employee
Unpaidfamilyworker
Total 1 340 988 206 146 Illiterate or literate without any diploma 121 99 7 15 Primary school 833 626 134 73 Junior high school or primary education 190 125 39 26 High school and more 196 138 26 32 Men 1 191 901 182 108 Illiterate or literate without any diploma 98 86 7 6 Primary school 753 578 121 54 Junior high school or primary education 175 117 35 23 High school and more 165 120 19 25 Women 149 87 24 38 Illiterate or literate without any diploma 22 13 - 9 Primary school 80 48 13 19 Junior high school or primary education 15 8 4 3 High school and more 32 18 7 7 Source: SIS, 2000 Urban Areas Small and Unincorporated Enterprise Survey Results
An important difference between men and women is observed in this respect: Women employed in the informal sector have more education than men. This characteristic is also valid for the employment in the whole of Turkish urban places as the following figures attest. The proportion of those with high school education and more in the informal sector is 21% for women and 14% for men (Table 12). The same proportion in Turkish urban places’ employment is 56% for women and 34% for men (SIS, 2000b: 63). These results are in conformity with the increasing trend of women’s employment in parallel with the rising education level. However, this trend should be considered against the

21
fact that women have less education than men even in the Turkish urban places. The share of those with high school or more education in urban population (non-institutional civilian population 15 years old and over) is 33% for men and 23% for women (SIS, 2000b: 45). All these mean that women with low-level education remain largely outside the labour market. There are differences between the levels of education of “self-employed or employer” and employees in the informal sector. The difference exists also in men, but it is more marked in women. In women, the share of those with junior high school education or more is 46% in employees and 30% in “self-employed, employer or partner” (Table 12). Sectoral Distribution
In 2000 Urban Areas Small and Unincorporated Enterprise Survey (Informal Sector Survey), all economic activities were coded at the four-digit level according to the International Standard Industrial Classification (ISIC-1990, Revision 3). Because of the characteristics of the informal sector and sample size of the survey, the results of the survey were given by three main sectors namely industry, trade and services.
Industry sector covers mining and quarrying, manufacturing, electricity, gas and water and construction sectors. Trade (commerce) sector covers wholesale and retail trade, repair of motor vehicles, personal and household goods, hotels and restaurants. Services sector covers transportation, communication and storage, finance, insurance, real estate and business services, public administration and national defense services, educational and health services, community, social and personal services. The dominance of sectors in the informal sector changes according to both status in employment and gender. In the category of “self-employed or employer” commerce (in the classification of industry, commerce and services) dominates in total (with a 60% share). But this is only valid for men (with a 63% share). In women, industry constitutes the dominant sector (with a 56% share). The situation presents a different picture in employees. Commerce dominates still in total (with a 48.5% share) and in men (with a 52.2% share). But in women the dominant sector (with a 54.2% share) is services (SIS, 2001b: Table 1). According to the more detailed classification (SIS, 2001b: Table 5), for men, the shares of different activities are relatively more concentrated in employees than in “self-employed or employer”. In male employees, the largest two activities are in “hotels and restaurants” and “barbers, hair-dressers and beauty shops”. Their shares are 23.6% and 19.2% respectively. The situation in women is different. The concentration is more marked in women, though it varies according to the status in employment. In the category of “self-employed or employer”, 53.4% of the employed women are in the sector of “textile and clothing manufacturing”. In employees, the share of those in “barbers, hair-dressers and beauty shops” is 37.5% and in “textile and clothing manufacturing” 16.7%. Thus women’s employment is concentrated in a few sectors also in the informal sector as it is the case generally (SIS, 2001b).

22
Summary We can summarize this section in the following points. i) Self-employment dominates in the informal sector concept of the Data Set II. But this is not the case in the Data Set I. ii) Expectedly, young people dominate in the informal sector employees. The age distribution is more even in the self-employed. iii) As a basic characteristic, women’s share is quite low in the Turkish informal sector. As a related important fact, in urban areas the second breadwinners of the families are boys among less educated people. iv) Expectedly, the education level in the informal sector is lower than that of the Turkish urban places. v) The education level of women in the informal sector is higher than that of men. vi) Concentration of work in certain sectors is also higher in women’s employment in the informal sector. V. Principal Characteristics of the Informal Sector We use the word “owner” frequently in this section. It covers, “self-employed or employer” and “partner”. But partner’s contribution to the total (32/1340=0.02) is slight. The Nature and Conditions of Work The nature of work in the informal sector does not require an important level of education. Only 7 percent of the owners had professional training or education such as accountancy or followed courses of expertise. The shares of other relevant factors for owners are as follows: Job does not require a particular skill, 26%; training is acquired by way of own, family’s or relatives’ efforts, 28%; by way of traditional apprenticeship, 13% and through work experience in the business, 25%. The education and training position of the employees presents a similar picture. The majority of these people (58%) have acquired the necessary skill by actually working on the job. The percentage of those who had no previous relevant training or education is also high with 18 percent. The other important factor is the training acquired through apprenticeship courses with a share of 20%. Professional training school and higher school education plays a minor role with a total of 3 percent contribution. These percentages on education and training of owners and employees show clearly that work in the informal sector requires little skill other than that acquired through the normal process of life. The place of work displays the following general picture: i) Fixed workplaces dominate both for men (with a 64 percent share in total) and women (with a 53 percent share). ii) In men, dominance of fixed workplaces is higher in industry and commerce (with 66 and 67 percents) than in services (with 55 percent). iii) In women, the same dominance also prevails with even higher percentages, in commerce and services (75% in commerce, 80% in services). But there is a difference in industry. The percentage of those who work in her or partner’s home is higher (with 74 percent) than that of fixed workplaces (with 23 percent) in industry. iv) Again in women, the share of non-fixed workplaces (market place, mobile, irregular place, other) is low with 11 percent, while the same share is 34 percent in men. The great majority (95%) of the workplace owners hold only one job. The percentage of those with only one job is lower in men (95%) than in women (97%), though with very little difference. The share of those who holds extra jobs reaches its higher percentage in 40-44 age group (8%) for men plus women.

23
The duration of work is long in the informal sector as expected. An important majority (71%) of the owners of the workplaces (men plus women) work more than 8 hours in a day. This percentage rises to 78% in commerce and 69% in services, while it falls to 50% in industry. The situation is more favorable for women in this respect. Those women who work more than 8 hours in a day constitute 34 percent in total, while the same percentage is 74 for men. The situation is similar for the employees. The percentage of those (men plus women) who work more than 8 hours in a day is 73% in this category. A parallel hard-working habit is observed in the number of days of work in a month. The percentage of those (men plus women, owners) who work 26 days and over in a month is 60%. This not very high value should be considered alongside with the considerable interruptions in the activities of the workplaces. Only 75 percent of the workplaces possess the capability of having permanent activities. The seasonal and irregular activities dominate especially in construction and retail trade outside the shops. The number of the persons unrecorded in a social security institution reaches considerable volumes and shares. For the owners of the workplaces, the share was 30% for men and 56% for women. The same share, but covering also employees, was somewhat higher in Data Set I. For example, it was, in the last data set for 1999, 36.44% for men, 65.83% for women for Definition 3 in urban areas (Bulutay, 2000: pp.74, 75). The owners of workplaces naturally complain about many things such as the lack of initial capital, working capital, financial services, building, equipments and infrastructure. But the main point of complaint is the lack of buyers. This constitutes a constant problem for the 68 percent and an occasional problem for the 23 percent. Only 9 percent have no complaint in this respect. The second largest worry for the owners of workplaces is the payment difficulties of the buyers. The percentage of those who have no complaint in this regard is only 18%. The difficulties in meeting the income demands of the family members constitute the third largest complaint. By contrast, the percentage of those who declare that they have no complaint about the taxes is 38%. Capital, Technology and Credit Uses The owners of workplaces (self-employed and employers), with a percentage of 76% as average figure through time, use initial capital when starting to work, though the amount of the capital is naturally modest. The source of this capital is their own or relatives’ savings with a total share of 90%. The share of the persons who use initial capital generally increases through time. The same share was 69% before 1993 and 88% in 2000. But there is no perceptible increase in the use of bank credits in time. A remarkable fact about the utilization of capital is the absence of need for capital. The owners replied, with a share of 73%, by saying that “I had no need for capital”, when asked about the reasons of not using capital. Further, there is no declining trend in this figure, though the percentages fluctuate through time. The same share is, expectedly, higher in women (with a value of 89%) than in men (with a value of 69%).

24
It should, however, be noted that the same owners complain about the lack of investment and working capital and machine and equipments. For example, 43% of the owners say that the lack of investment capital has negative impacts on their business activities. Similarly, 26% of them declare that they feel the same difficulties sometimes. One other basic characteristic of the informal sector in Turkey is the low level of technology utilization. More than half of them (55%) do not use modern devices (computer, fax, telex, telephone, photocopy machine). The share of those who use a computer is only 1.5%. The same share reaches only 16% in those with higher education. A striking fact is the very low use of credit. Among all owners of workplaces, 84 percent have not used any kind of credit. Further, the main sources of credit for the small minority who use credit are relatives’ or friends’ funds. (9) The people who use this kind of credit constitute 59 percent of total credit users. Only 25 percent of those who incurred debts got credit through the banking channel. Credit users also use the sources of cooperatives with a share of 11 percent. Less than half of the owners (35%) use the debts incurred to finance fixtures and raw materials. The main area of use of credits is to repay debt. The percentage of borrowers who use their credits for repayment of previous debts is 46%. Borrowers use also credits they receive, with an 18% share, in financing personal needs. All these show the weak and precarious economic positions of the people in the informal sector. Expectedly, the share of those who do not use credits is higher in women than in men. The same share is 90% in women and 84% in men. The figures of Data Set II show that the proportion of those who use credits does not increase significantly in parallel with the rising of education level of the persons. Income and Wages in the Informal Sector It would be appropriate to treat this subject by making a distinction between “self-employed or employer” (SE) and “employees” (E). Self-employed or employer (SE) It is seen in Table 13, Panel B that the income level of SEs of the informal sector in 2000 is lower than the estimated value of the income level of the self-employed persons for 2000 derived from the “Household Income Distribution Survey 1994 of SIS”. This means that self-employment persons in general earn more than the SEs in the informal sector. It could be considered as a normal fact emanating from the definition of the informal sector. The average income level of the SEs is also lower than the agricultural productivity, as is observed in Table 13, Panel B. This constitutes an important point in showing the validity of our conclusion reached in Section III above: The Turkish informal sector is largely insensitive to income growth and relative incomes. But there are also the following factors to be taken into account here.

25
Table 13. Average monthly income and earnings (TL)
PANEL A Average monthly earning per employee
Manufacturing with 10 and more engaged persons
Year Total Public Private
Manufacturing with less than 10 engaged persons
1994 13 262 291 22 623 565 10 762 824 3 081 958 1995 23 046 160 34 942 564 20 521 141 5 940 351 1996 40 198 767 57 479 481 37 127 505 12 152 456 1997 77 316 548 123 402 839 70 484 067 24 589 836 1998 141 015 705 222 603 267 129 996 639 44 325 818 1999 266 498 636* 457 288 288* 238 370 639* 86 724 427+ 2000 405 511 964* 797 664 438* 353 882 727* 110 073 311+
Employment and Earning Survey Results
(manufacturing with 10 and more employees) Year Total Public Private
Minimum wage
Informal Sector
1994 4 174 000 1995 8 460 000 1996 47 060 000 59 057 000 44 688 000 17 010 000 1997 92 859 500 134 693 500 86 071 000 35 438 000 1998 158 489 500 227 453 500 147 542 000 47 840 000 1999 299 521 500 467 252 000 270 543 000 93 600 000 2000 455 760 500 815 044 500 401 645 500 118 800 000 84 737 000
(*) Estimated value for 1999 and 2000 by depending on the trends in "Employment and Earning Survey Results (manufacturing) in the Table. (+) Minimum wages are used in these.
PANEL B Average monthly income per self-employed or employer
Year Agricultural productivity
1994 Household Income Distribution Survey (self-employed) (non-agriculture sector)
Informal Sector Survey (non-agriculture sector)
1994 5 337 498 9 084 900 1995 10 653 229 18 021 533 1996 21 284 998 29 946 522 1997 42 317 214 64 956 343 1998 86 066 920 115 820 635 1999 107 521 818 169 113 696 2000 196 230 269 268 405 412 184 974 380
Sources: 1) SIS, Annual Manufacturing Industry Statistics 2) SIS, Small Size Manufacturing Industry Yearbook
3) SIS, Employment and Earning Survey Results 4) Ministry of Labour and Social Security, Labour Statistics 5) SIS, 2000 Urban Areas Small and Unincorporated Enterprise Survey Results
6) SIS, 1994 Household Income Distribution Survey Results

26
Firstly, there are wide differences between the regions of Turkey in per capita agricultural income. For example, in 1998, the ratio of per capita agricultural income in some regions of Turkey to general per capita agricultural income was 0.76 in Black Sea region, 0.46 in East Anatolia and 0.88 in Southeastern Anatolia. When we multiply these ratios with agricultural productivity in 2000 we reach 149,135,004 for Black Sea, 90,265,924 for East Anatolia, 172,682,637 for Southeastern Anatolia. These are lower than the average income of SEs in the informal sector. Secondly, income distribution is more skewed in agriculture than in the informal sector. The Gini coefficient for the self-employed in agriculture in the 1994 income distribution study of SIS has been found to be 50.10. The Gini coefficient we have reached on the basis of the raw data set of the informal sector for SEs has a lower value with 37.83. This difference normally makes the income levels in the low end of the agricultural income scale lower than that of the SEs in the informal sector. Income distribution, calculated on the basis of the same data set, in employees of the informal sector is, with a Gini coefficient 33.09, even more equal. This difference between SEs and employees in income distribution can also be observed in Table 14. Table 14. The Distribution of the Employment of the Informal Sector in Income Groups (TL)
Total
0-50
million
51-100 million
101-200 million
201-500 million
501 million –1 billion
More than 1 billion
Self-Employed and Employer Number of persons (‘000)
956
122
241
342
230
17
4
Relative weight of each group
100.0
12.8
25.2
35.8
24.1
1.7
0.4
Employee Number of persons (‘000)
206
66
89
48
3
-
-
Relative weight of each group
100.0
32.0
43.2
23.3
1.5
-
-
Source: SIS, 2000 Urban Areas Small and Unincorporated Enterprise Survey Results It is seen in Table 14 that income or wages in the informal sector is concentrated in low income groups in the case of employees, whereas it is more dispersed in SEs. Further, the upper two income groups contain no persons in employees, but there are people with monthly income over 1 billion TL among SEs. The last point to be noted about SEs is the great differences between incomes of men and women (Table 15). This difference attains its highest value in “manufacture of textiles and wearing apparel”, where the ratio of women’s income to men’s income is only 0.37. By contrast, the same incomes are near to each other in the sector of “hotels and restaurants” and “hairdressing and other beauty treatment”. The situation is rather different in employees as we are going to see.

27
Employees (Es) The comparative wage figures in Table 13, Panel A display the following main characteristics: i) Expectedly, in Turkey wages are higher in larger firms with more than 10 persons engaged. ii) The highest wages are observed in the public sector (10), though some of the differences observed in Table 13 could be attributed to the tendency to underreport the wages in the private sector. iii) More important from our perspective in this study, the wages in the informal sector constitute the lowest value among all wages shown in the table. It is even below the minimum wage. The figures in Table 15 exhibit the breakdown of the informal wages according to sexes and sectors. (11) The differences between men’s and women’s wages are not as large as in SEs. Further, the dispersion of women’s wages between sectors is less than that of men’s wages, as coefficients of variation attest. The fundamental conclusion of this subsection is the outcome that the income and wage levels in the Turkish informal sector are very low. Table 15. Monthly average income per person by economic activity, sex and employment status in the informal sector, 2000
(in Thousand TL) Employee Self-employed or employer Economic activity Total Men Women Total Men Women Total 84 737 85 824 76 499 185 013 191 668 117 193 Manufacture of textiles and wearing apparel 75 151 89 568 79 522 98 730 162 409 59 439 Other manufacturing 92 519 93 118 83 825 196 853 199 653 122 647 Construction 72 373 69 498 209 317 209 087 Retail and wholesale trade in specialized stores 105 461 106 622 75 032 228 530 229 620 214 747 Retail trade in non-specialized stores 151 234 140 931 192 400 194 586 131 914 Retail trade not in stores 108 780 108 780 165 121 165 528 89 191 Repair of motor vehicles, personal and household goods 59 085 59 071 168 910 168 603 Hotels and restaurants 99 960 99 270 179 842 181 903 170 097 Transportation, communication and storage 131 157 131 157 219 383 219 383 Hairdressing and other beauty treatment 66 864 65 786 71 055 176 452 172 763 168 355 Other services 105 393 104 317 80 927 189 869 186 764
Coefficient of variation 0.28052 0.25747 0.05858 0.17987 0.11329 0.53837
Source: SIS, 2000 Urban Areas Small and Unincorporated Enterprise Survey Results

28
Birth Places, the Reasons of Holding Job and Mobility We begin by looking more closely at the birthplaces of the people in the informal sector. The majority (70%) of the owners of workplaces live in the same place since their births. The percentage of those who have lived 10 years or over in the same place is 24%. These figures indicate that the overwhelming majority of the owners have lived in the same place for 10 years or more. One thing that does not fit this trend is the almost steady decline in the share of those owners who live in the same place since birth in parallel with the increase in age: The share, which is 86% in the 16-20 age group, falls to 64% in the 51-61 age group. The only exception of this trend is the rise to 71 percent in the age group 61 years old and over. Unfortunately, we do not have comparable figures for the employees in the informal sector. But some numbers in the child labour data set of SIS (1999) can be used for the same purpose: The percentage of persons who migrated to cities with the purpose to establish a business there is 19% for those of city origin and 13% for those originating from villages, for the migrant families with children under 18 years of age. The same percentage for the persons who migrated to cities with the intention to search for work is 33% for those of city origin and 67% for those originating from the villages. These differences in the percentages, particularly the last one, indicate that the persons migrating from villages are more likely to search for jobs as employees. In other words, employees are more likely to be migrants from villages than residents of the cities. In some other studies on working children in Turkey it was observed that “A considerable part of the families of working children are recent migrant families…” (See, (Bulutay, 1995b: 36) for the studies.) These findings suggest that migrants from villages have usually to pass the stage of being employees before reaching to the status of self-employed even in the informal sector. He (or quite rarely she) has to stay in the status of employee at least for a while which can easily be extended to the whole life. These, and the low wage level in the informal sector show that mobility is quite limited for Turkish people originating from the villages. The three more frequently cited reasons of holding a job at the present work for male owners in the informal sector are the following: i) Not being able to find another job (with a share of 39%). ii) Having suitable previous job experience, education and training for the same type of jobs (with a share of 15%). iii) Intention to be independent (with a share of 13%). The picture is considerably different in women owners. The three more frequently mentioned reasons are as follows: i) Her family needed an additional income (with a share of 38%). ii) She could not find another job (with a share of 20%). iii) She had a free time (with a share of 14%). These figures show clearly the secondary and dependent state and role of women also in the informal sector in Turkey. In men owners, the state before starting business life can be summarized in the following points: i) A majority of them (64%) were working in other workplaces. The great part of these people (73%) were those working as employee or apprentice in other
29
workplaces. The remaining minority (27%) were owners or partners of other workplaces. ii) The share of the persons without previous job experience is 18 percent. They are composed of students, those not working and unemployed. iii) Retired men constitute only 7 percent. iv) The share of those who were working as employee or apprentice in the same workplace is even lower with 4%. The picture for women in this respect is quite different: The majority (with 73%) shifts to those without previous job experience. The share of those working in other workplaces falls to 19%. There is almost no person (one thousand each in a total 88 thousands) in the categories of “retired” and “working as employee or apprentice in the same workplace”. These figures show that mobility in the sense of moving from the status of worker or apprentice to the status of owner is very low within the workplaces. But the same kind of mobility is important within the informal sector as a substantial part of the employees are becoming the owners of other workplaces. The last kind of mobility is not high, with a contribution of 19%, for women. One primary fact that shows the prevalence of mobility or better ease of entry is the very low weight of traditional family business. Only 32 thousand men in total 1,060 thousands population (3%) declare that they have chosen this business, because it was the traditional family business. In women it was only one thousand in 110 thousands. What does the future hold for these people (self-employed and employers) in the formal sector? The great part of the people (54%) intend to stay in the same job and workplace. The second largest category (with a share of 29%) is composed of people who have no plan for the following five years. These large percentages show that the idea for a better life elsewhere does not offer great appeal to the people of the Turkish informal sector. VI. Concluding Remarks The experiences of the people in the informal sector can be viewed from two opposite or different perspectives. The positive perspective can offer the view that the people in the informal sector serve an important function where employment opportunities are scarce and industrial employment is inadequate or even shrinking. If one can define entrepreneurship as a relentless and sometimes desperate pursuit of opportunities, regardless of resources or outcomes as is done by some authors, persons in the informal sectors are certainly entrepreneurs. They create the most-needed employment for themselves and others similarly situated. The negative perspective can draw attention to the low level of education, productivity and income of the persons in the informal sector. These people share already existing jobs rather than create new ones. It is not possible to produce the much-needed outcome of raising the quality of labour and jobs through the informal sector. High population growth in the rural areas and the productivity increases in agriculture push people out of rural areas. These could lead to an increase in welfare on condition that high-quality employment opportunities have been created for those forced out from rural areas. It seems unlikely that the employment opportunities created in the Turkish informal sector fulfil this condition.

30
It can be said that urbanization has always been the concomitant of development, but the recent trend of globalization has most likely increased the importance of urbanization. Urban places should be areas where high-quality jobs are created. An urbanization attained through the informal sector, with the characteristics exposed in this article, cannot constitute a valid response to this vital need. Developing countries have to find better ways of development.
January 2002 Ankara, Turkey

31
NOTES
(1) The share of manufacturing employment in total employment was 13.03% in 1979 and
13.01% in 1980. Thus the same share rose from 5 percent in 1950 (and 7 percent in 1960) to 13 percent in 1979, 1980, while it rose to 17 percent in 2000 from 13 percent in 1980 (Bulutay, 1995a: 217-220; SIS 2000b: 53).
(2) Among OECD countries for 1999, employment/population ratio and labour force
participation rate are lowest in Turkey, whereas there are seven countries with higher unemployment rates than Turkey (OECD, 2000: Table B, p.203) It is, of course, highly difficult to draw a definite line between unemployment and inactivity. Some people, recorded as unemployed may very well be working more strenuously than the ordinary employed persons. (For example, persons working in experimentation for innovations are among these hard-working people who are supposedly unemployed or in leisure (Jovanovic, 2001: 109, 110).) Similarly, to be out of the labour force is more easy for young persons for various reasons. (See, for example, (Ryan, 2001: 37).) In Turkey, three main sources of being “not in labour force” in 2000 are, as thousands, housewives (11971), students (2922) and retired persons (2277) (SIS, 2000b: 50).
(3) Two independent surveys on child labour in Turkey have been conducted by SIS in 1994 and 1999 and the results have been published. One of the various studies on child labour is (Bulutay, 1995b). A more recent publication on unrecorded employment in Turkey is (Bulutay, 2000).
(4) The concepts of informal sector and unrecorded economy are also widely used to
express subjects related to the evasion of taxes. There are other related concepts. (See, (Thomas, 1992: 6; Bulutay, 1998).)
(5) For the relationship between the informal sector and unrecorded employment in
Turkey, see (Bulutay, 1998). (6) See (Van der Hoeven, 2000:11). See also (ILO, 2001: 30) where the same share was
44.4% in 1990 and 47.9% in 1998 in Latin America. It is noted in (Riveros, Sanchez, 1994: 80) that the share of quasi-formal and informal workers in urban workforce in Argentina is about 30%. This share of the informal sector is, therefore, lower than that of Latin America in general which reaches 40% or more. The same share of informal sector employment (as total of non-signed contract, with a 27.9% share, and self-employed with a 22.9% share) was 50.8% in Brazil in 1986.
(7) The trends in self-employment in the OECD area was studied in OECD (2000: Chapter
5). We would like to draw attention to the following facets and findings of this study: i) A distinction is made between “own-account workers” (those without employees) and “self-employed” (those with employees). “Unpaid family workers” are also included in self-employment, but they are generally excluded in the analysis of this

32
chapter. ii) Self-employment grew in most OECD countries during the 1990s, whereas their share in total employment tended to fall in the 1970s. iii) The relationship between GDP per capita and the share of self-employment is negative. In conformity with this, the same share is much higher in Turkey, alongside with other South European countries and Mexico and Korea.
(8) See (Tunalı, 2000: 913, 914) for similar findings: “… Three-fourths of the internal
migrants in Turkey over the 1963-1973 period have realized a negative return. The bulk of the losses are in the 10 to 20 percent range and appear to be of a nontransitory nature… Migrants originating in urban areas do a lot better than migrants originating in rural areas.”
(9) It is, of course, the normal and world-wide practice to raise capital from family,
relatives and friends. But the amount of capital thus raised is usually limited. This leads people to form rotating credit associations. (For the examples of these associations, see, for example, Granovetter, 2000: 250-255.) As far as we know, the successful examples of these informal types of associations are not abundant in Turkey. This is however a subject needs to be explored further.
(10) These higher wages pertain only to public sector enterprises. Wages or salaries in
government are not as high. In fact, wages and salaries per head in government (general and annexed budgets) is almost half of those in Turkish Public Enterprises, monthly 42 million TL in government, 78 million TL for salaried employees and 76 million TL for workers in Turkish Public Enterprises in 1996 (SIS, 1998-1999: 436, 437).
(11) The economic activities were re-grouped in Table 15 because of the characteristics of
informal sector and sample size are different and activities are denser in certain groups. In order to reflect economic activity groups in which informal sector activities are mostly operated, these groups are brought together and their estimations are given by these economic activity groups. These groups are; “Manufacture of textiles and wearing apparel” that constitutes the ISIC codes between 17-18, “Other manufacturing” which constitutes the ISIC codes between 15-16 and 19-37, “Construction” that constitutes the ISIC code 45, “Retail and wholesale trade in specialized stores” which constitutes the ISIC codes 501, 503, 505, 51 and 522-524, “Retail trade in non-specialized stores” that constitutes the ISIC code 521 and “Retail trade not in stores” which constitutes the ISIC code 525. These groups are followed by “Repair of motor vehicles, personal and household goods” that constitutes the ISIC codes 502, 504 and 526, “Hotels and restaurants” which constitute the ISIC code 55, “Transportation, communication and storage” which constitutes the ISIC codes between 60-64, “Hairdressing and other beauty treatment” that constitutes the ISIC code 9302. The last group is “Other services” which constitutes the ISIC codes 65-67, 70-74, 80, 85, 90-92, 9301, 9303, 9309 and 95.
33
REFERENCES
BETCHERMAN, G., ISLAM, R. (2001): East Asian Labor Markets and the Economic Crisis: An Overview, in G. BETCHERMAN, R. ISLAM (Ed.), East Asian Labor Markets and the Economic Crisis, Impacts, Response & Lessons, The World Bank, Washington, DC., The International Labour Organization, Geneva, 2001, pp.3-37. BULUTAY, T. (1995a): Employment, Unemployment and Wage in Turkey, International Labour Organization, SIS, Ankara, 1995. BULUTAY, T. (1995b): Child Labour in Turkey, SIS, ILO, Ankara, November 1995. BULUTAY, T. (1998): The Informal Sector in Turkey, in, T. Bulutay (Ed.), Informal Sector (I), SIS, Ankara, December 2000, pp.ix-xxxviii. BULUTAY, T. (2000) Dimensions of the Unrecorded Economy in Turkey, in, T. Bulutay (Ed.), The Unrecorded Economy as Related to the Labour Market, SIS, Ankara, October 2001, pp.1-81. BULUTAY, T. (2001): Report on Child Labour in Turkey, A paper presented to ILO, in October 2001. CRAFTS, N. (2000): Globalization and Growth in the Twentieth Century, in, IMF, World Economic and Financial Surveys, 2000, pp.1-51. GRANOVETTER, M. (2000): The Economic Sociology of Firms and Entrepreneurs, in, R. SWEDBERG (Ed.), Entrepreneurship, The Social Science View, Oxford University Press, Oxford, 2000, pp.244-275. HORTON, S., KANBUR, R., MAZUMDAR, D. (1994), Labour Markets in an Era of Adjustment: An Overview, in, S. HORTON, R. KANBUR, D. MAZUMDAR (Ed.), Labour Markets in an Era of Adjustment, Volume 1, Issues Papers, The World Bank, Washington, D.C., 1994, pp. 1-59. ILO (1993): Fifteenth International Conference of Labour Statisticians, Geneva, 19-28 January 1993, Report III, Statistics of Employment in the Informal Sector, International Labour Office, Geneva. ILO (2001): World Employment Report 2001, Life at Work in the Information Economy, International Labour Organization, Geneva, 2001. JOVANOVIC, B. (2001): Fitness and Age: Review of Carroll and Hannan’s Demography of Corporations and Industries, The Journal of Economic Literature, March 2001, pp.105-119. LOUISE FOX, M., AMADEDO, E., CAMARGO, J.M. (1994): Brazil, in, S. HORTON, R. KANBUR, D. MAZUMDAR (Ed.), Labour Markets in an Era of Adjustment, Volume 2, Case Studies, The World Bank, Washington, D.C., 1994, pp. 143-168.

34
MINISTRY OF LABOUR AND SOCIAL SECURITY REPUBLIC OF TURKEY (2000): Labour Statistics, June 2001, Ankara, Turkey. OECD (2000): Employment Outlook, June 2000, OECD, Paris, 2000. OLMSTED, B., SMITH, S. (1994): Creating Flexible Workplace, How to Select & Manage Alternative Work Options, Second Edition, American Management Association, New York, 1994. RIVEROS, L.A., SANCHEZ, C.E. (1994): Argentina, in, S. HORTON, R. KANBUR, D. MAZUMDAR (Ed.), Labour Markets in an Era of Adjustment, Volume 2, Case Studies, The World Bank, Washington, D.C., 1994, pp. 61-98. RYAN, P. (2001): The School-to-Work Transition: A Cross-National Perspective, The Journal of Economic Literature, March 2001, pp.34-92. SIS (1998-1999): Labour Statistics, State Institute of Statistics, Ankara, January 2001. SIS (1999): 1999 Child Labour Force Survey Preliminary Results, State Institute of Statistics, Ankara, September 2000. SIS (2000a): 2000 Statistical Yearbook of Turkey, State Institute of Statistics, Ankara, August 2001. SIS (2000b): 2000 Household Labour Force Survey Results, State Institute of Statistics, Ankara, October 2001. SIS (2001a): Household Labour Force Survey Preliminary Results, 2001 (III), Press Release, State Institute of Statistics, Ankara, 04 December 2001. SIS (2001b): 2000 Urban Areas Small and Unincorporated Enterprise (Informal Sector) Survey Preliminary Results, Press Release, State Institute of Statistics, Ankara, 31 October 2001. THOMAS, J.J. (1992): Informal Economic Activity, The University of Michigan Press, Ann Arbor, 1992. TUNALI, I. (2000): Rationality of Migration, International Economic Review, November 2000, pp. 893-920. VAN DER HOEVEN, R. (2000): Labour Markets and Income Inequality, What are the New Insights after the Washington Consensus?, Working Papers No.209, December 2000, The United Nations University, Wider, World Institute for Development Economic Research.