turbine blade cooling passage flow bench
TRANSCRIPT

Turbine Blade Cooling Passage Flow Bench Final Project Report
8 June 2015 Solar Turbines
Gwendolyn Church Tom Hurni
Jacob Hustedt [email protected] [email protected]
1

Table of Contents
Chapter 1: Introduction ................................................................................................................................. 4 Problem Statement ................................................................................................................................ 4
Background ............................................................................................................................................... 4 Gas Turbine Engines ............................................................................................................................. 4 Flow Benches ........................................................................................................................................ 6 Measuring Flow .................................................................................................................................... 8 Mass Flow and Effective Area ............................................................................................................ 11
Chapter 2: Objectives and Specifications ................................................................................................... 12 Customer Requirements and House of Quality ....................................................................................... 12 Engineering Specifications ..................................................................................................................... 13
Chapter 3: Design Development and System Layout ................................................................................. 16 Blade Fixture and Setting ........................................................................................................................ 16
Fixture and Setting Design Development ........................................................................................... 16 Preliminary Fixture Design ................................................................................................................. 18 Final Fixture Design ........................................................................................................................... 19 Final Setting Design ............................................................................................................................ 20 Plenum Design .................................................................................................................................... 21
Workbench .............................................................................................................................................. 22 Table Top Design ................................................................................................................................ 23
Control Volume ...................................................................................................................................... 24 Exhaust System ....................................................................................................................................... 25 Air Movement ......................................................................................................................................... 26 Flow Measurement .................................................................................................................................. 26 Flow Separate Passages .......................................................................................................................... 27 Pressure Ratio Development ................................................................................................................... 28 Data Acquisition and Control System ..................................................................................................... 28 System Layout ........................................................................................................................................ 29
Chapter 4: Manufacturing and Purchasing .................................................................................................. 36 Blade Fixture Manufacturing .................................................................................................................. 36 Laminar Flow Element Purchasing ......................................................................................................... 36 Tank Purchasing...................................................................................................................................... 37 Control Volume Manufacturing and Purchasing .................................................................................... 37 Workbench Manufacturing and Purchasing ............................................................................................ 37 Plumbing Purchasing .............................................................................................................................. 37 Off the Shelf Part Purchasing ................................................................................................................. 37
Chapter 5: Assembly and Testing ............................................................................................................... 38 Delays ..................................................................................................................................................... 38 Assembly ................................................................................................................................................ 38 Testing .................................................................................................................................................... 39
Chapter 6: Budget and Management ........................................................................................................... 41 Budget ..................................................................................................................................................... 41 Management Plan .................................................................................................................................... 41
Chapter 7: Conclusion and Future Improvements ...................................................................................... 43 Works Cited ................................................................................................................................................ 44
Table of Appendices Appendix 1: House of Quality. .................................................................................................................. 1-1 Appendix 2: Decision Matrices.................................................................................................................. 2-1
2

Appendix 3: Sample Calculations .............................................................................................................. 3-1 Appendix 4: Hazard Checklist. .................................................................................................................. 4-1 Appendix 5: Gantt Chart. ........................................................................................................................... 5-1 Appendix 6: Detail Drawings .................................................................................................................... 6-1 Appendix 7: Budget ................................................................................................................................... 7-1 Appendix 8: DVPR. ................................................................................................................................... 8-1 Appendix 9: DFMEA ................................................................................................................................. 9-1
Table of Figures Figure 1. Solar Turbines gas turbine engine (Solar, 2013) ........................................................................... 5 Figure 2.An example of deposits on used turbine blades (Janikowski, 2011) .............................................. 6 Figure 3. Low flow air test stand from Flow Systems Inc. ........................................................................... 6 Figure 4. DTec DIY Flowbench Example. ................................................................................................... 7 Figure 5. Example of a basic flow bench created using a shop vac (Flow Performance, 2015). .................. 8 Figure 6. Basic representation of a Venturi meter cross section from Jacobs’ Rocketry.............................. 9 Figure 7. Sonic nozzles from Flow Systems Inc. .......................................................................................... 9 Figure 8. Orifice plate flow example (Altmann, 2014). .............................................................................. 10 Figure 9. Example section view of a Laminar Flow Element (Figliola). .................................................... 10 Figure 10. Removable blade fixture table interface. ................................................................................... 17 Figure 11. Wooden model ........................................................................................................................... 17 Figure 12. Locking mechanism concept sketches. ...................................................................................... 18 Figure 13. Blade fixture concept models. ................................................................................................... 18 Figure 14. Blade fixture concept models. ................................................................................................... 19 Figure 15. Final fixture design.. .................................................................................................................. 20 Figure 16. Blade fixture and setting. ........................................................................................................... 21 Figure 17. Isometric (left) and front (right) views of the plenum. .............................................................. 21 Figure 18. Isometric (left) and front (right) views of the plenum cross section ......................................... 22 Figure 19. Custom workbench design......................................................................................................... 22 Figure 20. Top view of table top geometry. ................................................................................................ 24 Figure 21. Final control volume design. ..................................................................................................... 25 Figure 22. Isometric view of dual system design. ....................................................................................... 29 Figure 23. Isometric view of single system design. .................................................................................... 29 Figure 24. Exploded view of single system design. .................................................................................... 30 Figure 25. Isometric view of final short bench design. ............................................................................... 31 Figure 26. Front view of final short bench design. ..................................................................................... 31 Figure 27. Exploded view of final short bench design................................................................................ 32 Figure 28. Air flow through system. ........................................................................................................... 33 Figure 29. Quick air connect and back plumbing system. .......................................................................... 34 Figure 30. Exploded view of back plumbing system with key components labeled. ................................. 34 Figure 31. Exploded view of front plumbing system with key components labeled. ................................. 35 Figure 32. Top and front view of a prototype fixture with a 3-D printed blade. ........................................ 36
Table of Tables Table 1. Engineering specifications ............................................................................................................ 13 Table 2. Air movement concept pros and cons. .......................................................................................... 26 Table 3. Timeline of part ordering process ................................................................................................. 38 Table 4. Type 1 blade test data. .................................................................................................................. 40 Table 5. Original engineering specifications and the final system results. ................................................. 40 Table 6. Key project milestones. ................................................................................................................. 41
3

Chapter 1: Introduction Solar Turbines manufactures industrial gas turbine engines for use in diverse environments which are commonly detrimental to the design and component life goals of the company. Frequently, airborne particulates, corrosive material, and water will build up in the vulnerable cooling passages within the turbine blades. This build up reduces the effective passage area which in turn lowers cooling effectiveness, raises temperatures, and increases creep rates and stresses, resulting in decreased blade life. The goal of this project is to design and build a flow bench for Solar Turbines that will be used to calculate the effective area of the used turbine blade cooling passages. This will help to determine if the blades can be reworked and used again or if they must be taken out of service.
The team responsible for this project consists of: Gwendolyn Church, Tom Hurni and Jacob Hustedt. All three are fifth year, general concentration, mechanical engineering students at California Polytechnic State University at San Luis Obispo. The main Solar Turbines contact is Kenneth Thomas in the Mechanical Design Engineering department. The senior project team will design a mobile flow bench for Solar Turbines that can be effectively used in a shop environment for the purpose of rapidly testing the condition of a variety of turbine blades. The bench must be safe to use, easily adjustable, and able to reach a level of precision acceptable for the application.
Problem Statement During the life of a gas turbine engine, fouling leads to damage of the blades and shortened life. In order to determine if a blade is still useable or worth the cost of refurbishing, Solar Turbines would like a fast, portable and easy to use a flow bench that will calculate the effective area of a blades cooling passages on the shop floor. The goal of this project is to design a rig that will quickly and reliably measure the mass flow rate through the blade cooling passages. The mass flow function provided by Solar Turbines can then be used to quantify the area reduction compared to the new blade production values. The rig will operate safely in a shop environment, accommodate various blade sizes, and measure separate blade passages with minimal transition time.
Background Gas Turbine Engines A gas turbine engine is a form of internal combustion engine. The engine is a device that converts energy stored in the fuel to useful mechanical energy in the form of rotational power. The term “gas” refers to the ambient air that is taken into the engine and mixed with fuel in the energy conversion process (Gas, 2014).
Air is first drawn into the engine where it is compressed. It is then mixed with fuel and finally ignited. The resulting hot gas expands at high velocity through a series of airfoil-shaped blades which transfer energy created from combustion to turn an output shaft. Individual turbine blades make up the turbine section of the engine (Gas, 2014). The blades’ purpose is to extract energy from the high temperature, high pressure gas produced by the ignition process (Friedlander, 2000). With temperatures in many gas turbine engines exceeding 1000 degrees Celsius, cooling of the blades is very important (Solar, 2013). A common cooling method is to include internal air channels within the blades. These internal channels act as cooling passages and work by passing relatively cool air through the interior of the blades. While this air is cool relative to the air in the rest of the turbine, it is still at a very high temperature of around 400 degrees Celsius. Heat is transferred by conduction and convection from the blade to air flowing inside the channels. A large internal surface area is desirable for this method to optimize cooling. The cooling paths tend to be serpentine and full of small fins to produce more efficient cooling passages. Optimizing the cooling passages leads to more efficient cooling and a more efficient turbine. Also, reducing the weight of the blades leads to overall weight reduction and improvements in efficiency (Friedlander, 2000).
4

Figure 1. Solar Turbines gas turbine engine (Solar, 2013)
Turbine engines operate in a variety of environments that affect their performance and life. Environments of interest are those where small particles are ingested. While large particles can cause catastrophic damage, small particles such as dust and sand in the air also affect engine performance. During operation, gas turbine engines function at elevated temperatures and flow rates. The high flow rates into the engine cause particulates and debris to enter the compressor inlet. As the particulate-air mixture enters the compressor at moderate concentrations the compressor increases the density of the air, which increases the ratio of particulates to volume of air. In various locations within the compressor, air is bled through the combustor bypass, or secondary flow system, to provide cooling for turbine parts and some particles will be diverted through the combustor bypass as well. While traveling through the compressor and combustor bypass, the particulates can affect many surfaces, and can break up into many smaller particles. The bypass air is fed to inside passages of vanes and blades for convective cooling. When internal cooling passages are blocked in turbine components, the cooling necessary to maintain component temperatures at reasonable operating temperatures cannot be sustained (Friedlander, 2000). Output losses between 2 and 20 percent have been experienced due to particulate intake (Taylor, 2006).
In some cases, extreme temperatures of the metal surfaces in a turbine blade can cause melting of the particulates which increases the probability that the particles will adhere to the coolant passages (Schneider, 2005). When particulates block a coolant passage or coolant hole, the overall supply of coolant flow is reduced, creating a localized hot region in the blade. Furthermore, as particulates adhere to the surface of a passage they act as insulating material, reducing the heat transfer from the metal surface to the coolant, thereby further increasing part temperature (Friedlander, 2000). The combination of reduced convection, increased thermal resistance, and decreased mass flow causes the blade temperature to further increase resulting in a reduction in service life (Schneider, 2005).
Fouling is a common term for the accumulation of unwanted particulates or material. It can occur almost anywhere due to various causes (Solar, 2013). Experience has proven that gas turbines will foul in most operating environments due to a wide range of pollutants and environmental conditions. Common causes of fouling are airborne salt, industrial pollution (ash, smoke, and smog), turbine fluid and exhaust, mineral deposits, or bugs and insects. Generally, particles up to 10 microns can cause fouling (Taylor, 2006).
5
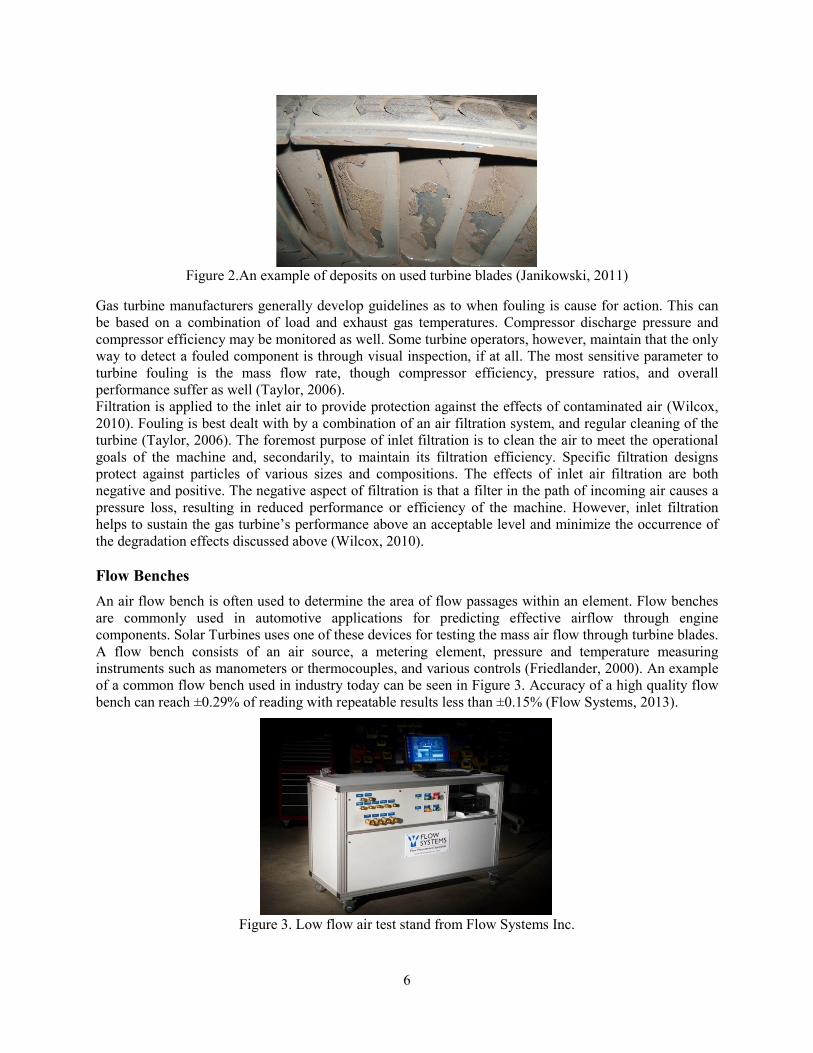
Figure 2.An example of deposits on used turbine blades (Janikowski, 2011)
Gas turbine manufacturers generally develop guidelines as to when fouling is cause for action. This can be based on a combination of load and exhaust gas temperatures. Compressor discharge pressure and compressor efficiency may be monitored as well. Some turbine operators, however, maintain that the only way to detect a fouled component is through visual inspection, if at all. The most sensitive parameter to turbine fouling is the mass flow rate, though compressor efficiency, pressure ratios, and overall performance suffer as well (Taylor, 2006). Filtration is applied to the inlet air to provide protection against the effects of contaminated air (Wilcox, 2010). Fouling is best dealt with by a combination of an air filtration system, and regular cleaning of the turbine (Taylor, 2006). The foremost purpose of inlet filtration is to clean the air to meet the operational goals of the machine and, secondarily, to maintain its filtration efficiency. Specific filtration designs protect against particles of various sizes and compositions. The effects of inlet air filtration are both negative and positive. The negative aspect of filtration is that a filter in the path of incoming air causes a pressure loss, resulting in reduced performance or efficiency of the machine. However, inlet filtration helps to sustain the gas turbine’s performance above an acceptable level and minimize the occurrence of the degradation effects discussed above (Wilcox, 2010). Flow Benches An air flow bench is often used to determine the area of flow passages within an element. Flow benches are commonly used in automotive applications for predicting effective airflow through engine components. Solar Turbines uses one of these devices for testing the mass air flow through turbine blades. A flow bench consists of an air source, a metering element, pressure and temperature measuring instruments such as manometers or thermocouples, and various controls (Friedlander, 2000). An example of a common flow bench used in industry today can be seen in Figure 3. Accuracy of a high quality flow bench can reach ±0.29% of reading with repeatable results less than ±0.15% (Flow Systems, 2013).
Figure 3. Low flow air test stand from Flow Systems Inc.
6

The turbine blade is attached in series with the air source and measuring element. Air is pumped through the whole system including the test element. Because the mass flow rate through the system is known and the mass flow through the turbine blade is the same as the system, the reduction in blade passage area can be calculated. Air flow conditions must be measured at multiple locations, across the test piece and across the metering element. The pressure across the metering element allows calculation of the actual flow through the whole system. Temperature must also be accounted for because the air pump will heat the air passing through it, making the air downstream less dense and more viscous (Friedlander, 2000). Temperature is measured at the test piece and at the metering element plenums and correction factors are applied during flow calculations. Some flow bench designs place the air pump after the metering element so that the effects of heating by the air pump are not as large of a concern.
Commercial flow benches are expensive and usually found only in the high-end, specialized workshops. On the opposite end of the spectrum, there are many do-it-yourself builds that implement a more basic approach. One flow bench design encountered consists of an external air box which contains several vacuum motors to provide airflow, an orifice plate to achieve a pressure drop, and a laminar flow grid. Several manometers are used to confirm test pressures and pressure drops across the orifice plate. An example of this build can be seen in Figure 4 below.
Figure 4. DTec DIY Flowbench Example.
There are several manufacturers that offer flow bench kits that may be purchased and constructed at home. Generally, these kits are of simple design and implement lower tech components. A common flow bench kit that can be purchased may contain a simple Shop Vac, orifice plates, manometers, and flow grids. Most of these kits are only capable of reaching relatively low precision, flow rates and test pressures. An example of a flow bench kit that can be purchased is the EZ Flow system shown below. These systems can range from $100 to several thousand dollars and are capable of producing readings to an accuracy of ±1% for a well built, well calibrated flow bench (Flow Performance).
7

Figure 5. Example of a basic flow bench created using a shop vac (Flow Performance, 2015).
Measuring Flow Mass is a measure of the amount of matter that makes up an object and the mass of an object is generally considered constant. Volume refers to the amount of space an object takes up. The volume of an object can change depending on pressure, temperature and other factors. In terms of flow, at room temperature and low pressures the volumetric and mass flow rate will be nearly identical, however, these rates can vary drastically with changes in temperature and/or pressure because the temperature and pressure of the gas directly affects the volume (“How it Works”). Mass flow can be calculated from volumetric flow if the specific gravity, or density, of the fluid is known. An example of this calculation is shown below.
Mass flow is defined as the product of density, relative velocity, and area of the path for a particular fluid. Because the area will be known, only the velocity and density must be found to calculate mass flow through the system.
A common way to measure flow through a flow bench is through the implementation of the Venturi effect. The Venturi effect is the reduction in fluid pressure that results when a fluid flows through a constricted section of pipe. By measuring the change in pressure, the flow rate can be determined. Figure 5 below illustrates this concept.
�̇�𝑚 = 𝜌𝜌𝜌𝜌𝜌𝜌 �̇�𝑚 = Mass flow 𝑄𝑄 = 𝜌𝜌𝜌𝜌 𝑄𝑄 = Volumetric Flow
𝑉𝑉 = Fluid Velocity 𝜌𝜌 = Fluid Density 𝜌𝜌 = Cross Sectional Area
8
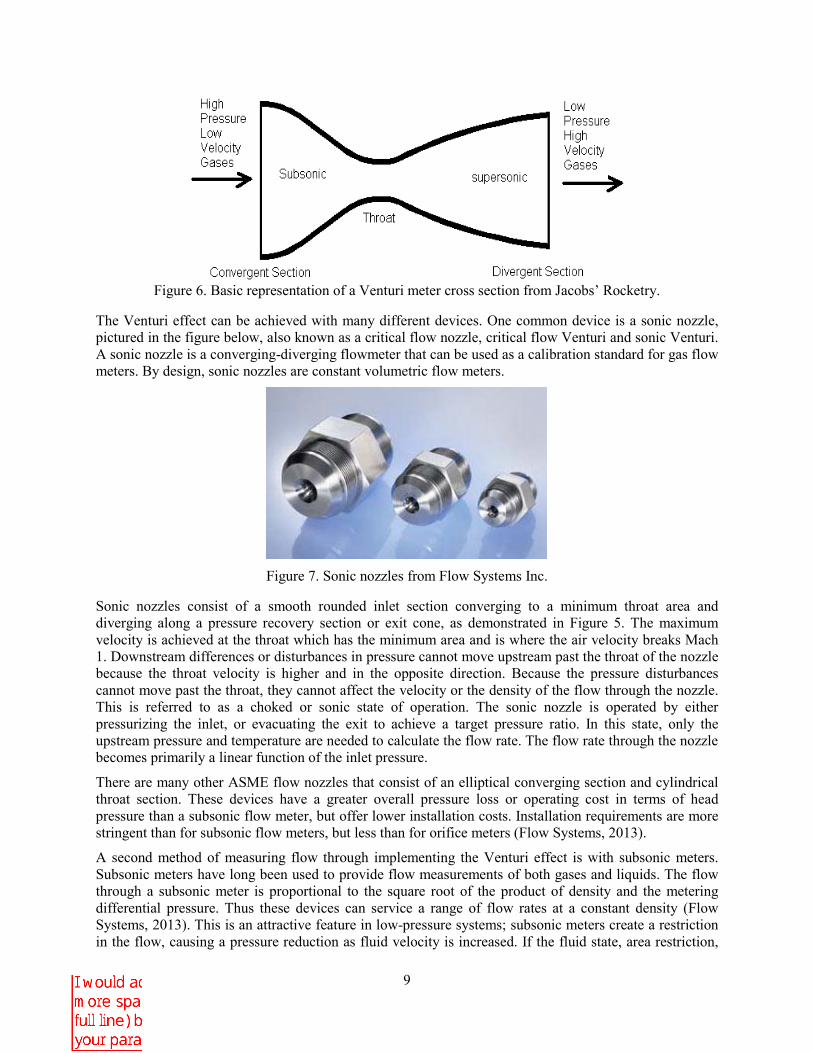
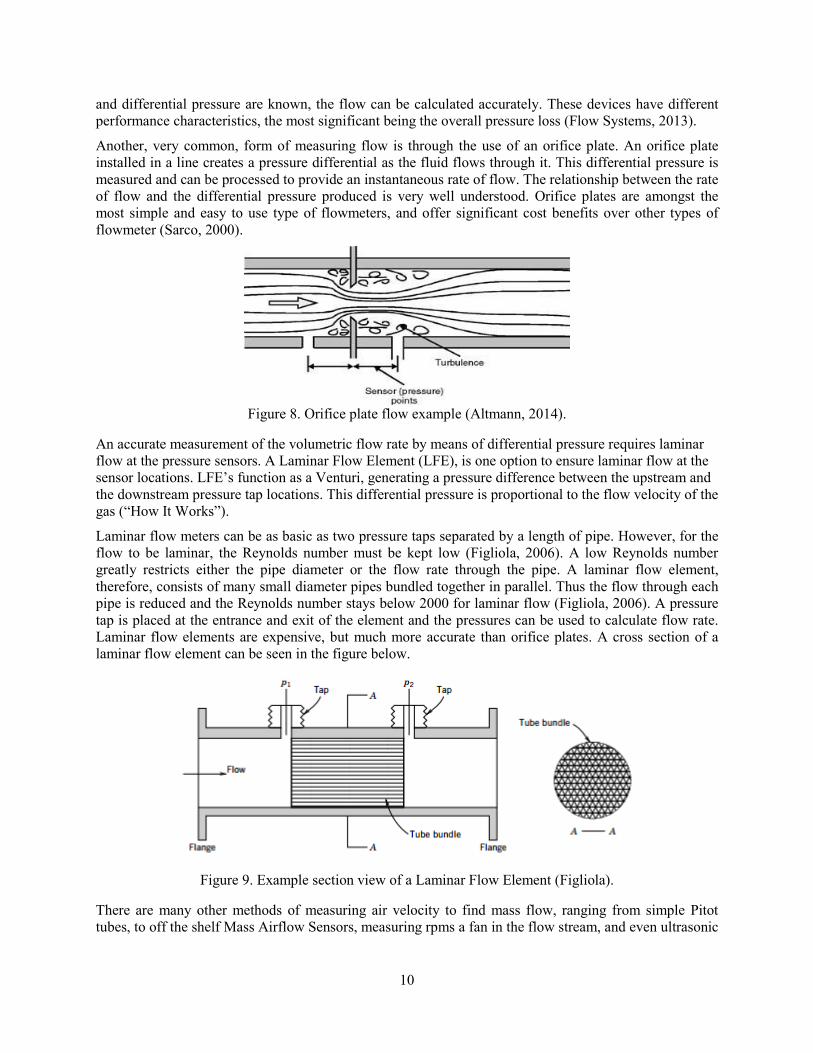
Figure 6. Basic representation of a Venturi meter cross section from Jacobs’ Rocketry.
The Venturi effect can be achieved with many different devices. One common device is a sonic nozzle, pictured in the figure below, also known as a critical flow nozzle, critical flow Venturi and sonic Venturi. A sonic nozzle is a converging-diverging flowmeter that can be used as a calibration standard for gas flow meters. By design, sonic nozzles are constant volumetric flow meters.
Figure 7. Sonic nozzles from Flow Systems Inc.
Sonic nozzles consist of a smooth rounded inlet section converging to a minimum throat area and diverging along a pressure recovery section or exit cone, as demonstrated in Figure 5. The maximum velocity is achieved at the throat which has the minimum area and is where the air velocity breaks Mach 1. Downstream differences or disturbances in pressure cannot move upstream past the throat of the nozzle because the throat velocity is higher and in the opposite direction. Because the pressure disturbances cannot move past the throat, they cannot affect the velocity or the density of the flow through the nozzle. This is referred to as a choked or sonic state of operation. The sonic nozzle is operated by either pressurizing the inlet, or evacuating the exit to achieve a target pressure ratio. In this state, only the upstream pressure and temperature are needed to calculate the flow rate. The flow rate through the nozzle becomes primarily a linear function of the inlet pressure.
There are many other ASME flow nozzles that consist of an elliptical converging section and cylindrical throat section. These devices have a greater overall pressure loss or operating cost in terms of head pressure than a subsonic flow meter, but offer lower installation costs. Installation requirements are more stringent than for subsonic flow meters, but less than for orifice meters (Flow Systems, 2013).
A second method of measuring flow through implementing the Venturi effect is with subsonic meters. Subsonic meters have long been used to provide flow measurements of both gases and liquids. The flow through a subsonic meter is proportional to the square root of the product of density and the metering differential pressure. Thus these devices can service a range of flow rates at a constant density (Flow Systems, 2013). This is an attractive feature in low-pressure systems; subsonic meters create a restriction in the flow, causing a pressure reduction as fluid velocity is increased. If the fluid state, area restriction,
9
and differential pressure are known, the flow can be calculated accurately. These devices have different performance characteristics, the most significant being the overall pressure loss (Flow Systems, 2013).
Another, very common, form of measuring flow is through the use of an orifice plate. An orifice plate installed in a line creates a pressure differential as the fluid flows through it. This differential pressure is measured and can be processed to provide an instantaneous rate of flow. The relationship between the rate of flow and the differential pressure produced is very well understood. Orifice plates are amongst the most simple and easy to use type of flowmeters, and offer significant cost benefits over other types of flowmeter (Sarco, 2000).
Figure 8. Orifice plate flow example (Altmann, 2014).
An accurate measurement of the volumetric flow rate by means of differential pressure requires laminar flow at the pressure sensors. A Laminar Flow Element (LFE), is one option to ensure laminar flow at the sensor locations. LFE’s function as a Venturi, generating a pressure difference between the upstream and the downstream pressure tap locations. This differential pressure is proportional to the flow velocity of the gas (“How It Works”).
Laminar flow meters can be as basic as two pressure taps separated by a length of pipe. However, for the flow to be laminar, the Reynolds number must be kept low (Figliola, 2006). A low Reynolds number greatly restricts either the pipe diameter or the flow rate through the pipe. A laminar flow element, therefore, consists of many small diameter pipes bundled together in parallel. Thus the flow through each pipe is reduced and the Reynolds number stays below 2000 for laminar flow (Figliola, 2006). A pressure tap is placed at the entrance and exit of the element and the pressures can be used to calculate flow rate. Laminar flow elements are expensive, but much more accurate than orifice plates. A cross section of a laminar flow element can be seen in the figure below.
Figure 9. Example section view of a Laminar Flow Element (Figliola).
There are many other methods of measuring air velocity to find mass flow, ranging from simple Pitot tubes, to off the shelf Mass Airflow Sensors, measuring rpms a fan in the flow stream, and even ultrasonic
10

flow meters. Many of these devices are simple “plug and play” type devices, and could easily be integrate into a system with minimal calibration (Gas, 2014).
Mass Flow and Effective Area The mass flow function may be calculated using the following equation, provided by Solar Turbines:
𝜑𝜑 =𝑚𝑚√𝑇𝑇𝑃𝑃
(1) Where, m = Mass Flow Rate (lbm/sec) T = Absolute Plenum Temperature (̊R) P = Absolute Plenum Pressure (psia)
To calculate the mass flow function, the mass flow rate, temperature and pressure are measured for the system and then plugged into the above equation. The mass flow function will be measured with the flow bench and controls system. It can then be used to calculate the effective area, Ae, using:
𝜌𝜌𝑒𝑒 =𝑚𝑚√𝑇𝑇𝑃𝑃
� 2𝐺𝐺𝐶𝐶𝛾𝛾𝑅𝑅(𝛾𝛾 − 1) {[𝑃𝑃2𝑃𝑃1
]2𝛾𝛾 − [𝑃𝑃2𝑃𝑃1
]𝛾𝛾+1𝛾𝛾 }
(2)
Where, P1 = Absolute Plenum Pressure (psia)
GC = Gravitational Constant (lbm-ft/lbf-sec2) 𝛾𝛾 = Ratio of Specific Heats P2 = Ambient Atmospheric Pressure (psia) R = Gas Constant (lbf-ft/lbm- ̊R) The absolute plenum pressure is measured against the ambient atmospheric pressure. This means that a specific ratio of the two will be produced when flowing each individual passage within the blade. As the geometries of the blades change the absolute plenum pressure will change but the ratio between it and the ambient atmosphere pressure will remain the same through every blade and passage. The ratio of specific heats should remain relatively constant due to the fact that the temperature within the plenum should be close to that of the ambient atmospheric temperature. If this constant specific heat ratio were to change it would be accounted for with the temperature sensors which will be placed within the plenum, manometer, and control volume of the system. Once calculated, the effective area can be compared to the nominal effective area of a new blade to determine how much area has been lost due to particulate build up. This comparison will allow Solar Turbines to determine whether or not the blade’s cooling rate is still acceptable, whether it needs to be refurbished, or if it is time to replace the blade with a new one. This will in turn save Solar time and money which would have been spent fixing the turbine once blades started to fail and cause problems within the turbine.
11

Chapter 2: Objectives and Specifications Customer Requirements and House of Quality Following discussions with the sponsor, the customer requirements are understood to be:
● Safe ● Able to be used daily ● Quick/fast; practical and easy to use ● Reliable ● Repeatable between operators ● Portable ● Able to accommodate stage one blades ● Potential to be adapted to different blades in the future ● Minimal in size ● Relatively quiet ● Exhaust at floor level ● Simple to use data acquisition system ● Plenum to atmospheric pressure ratio of 1.4 to 1.6 ● Mass flow function within 0.001-0.010 lbm-°R1/2/psia-sec
Many of these requirements were made into engineering specifications using the Quality Function Deployment (QFD) process. The QFD process is a design method used to identify all customer requirements and develop complete engineering specifications. The House of Quality in Appendix 1 was used to develop the majority of the engineering specifications listed in Table 1. The House of Quality consists of five key sections:
1. The first section is the leftmost wherein the customer requirements, called the “Whats,” are listed in no particular order. These requirements were gathered through discussions with the sponsor and background research. In this section three main customers are listed: Solar Turbines, the main sponsor; Kenneth Thomas and the mechanical design department at Solar Turbines, the point of contact and intermediate user; and the engine mechanics, the end users. Each requirement is then ranked based on its importance to these users. A 10 indicates high importance while a 1 indicates minimal importance. The importance values vary between customers based on their specific preferences and how they will interact with the final product.
2. In the middle section, the Engineering Specifications, or “Hows,” are provided. The specifications put the customer requirements into more specific technical terms and ensure that each requirement is met. The requirements are then compared to the specifications to ensure that each requirement is fulfilled by at least one specification. Once each requirement has a “Maximum Relationship” of 9, the requirements are met and no further specifications are required. If a requirement does not have at least one strong relationship with a specification then the Maximum Relationship will be lower than 9, so once this value is 9 for each requirement then the requirements are all met by at least one specification.
3. On the right is the “Now” section. This section considers how the planned design as well as competitors’ designs will fulfill the customer requirements. In this section four competitors’ products were chosen and compared to the planned design. A value of 5 indicates that the product fulfills a requirement completely while a value of 1 indicates that it does not meet the requirement at all.
4. At the bottom of the house is the “How Much” section. This section helps to quantify the specifications with numerical values and is the source of many of the target values listed in Table 1. It also once again compares the planned product to competitors’ products using the same scale as above.
12
5. Finally, at the top is the triangular section that gives the house its name. In this section the specifications are compared to see how strongly they relate to each other. This section helps the team to see which requirements will be fulfilled or partially fulfilled at the same time as another. A + sign indicates a strong correlation, a – sign indicates a weak correlation and a blank space indicates no correlation. This section is read by following the diagonal sections above each specification to see where they intersect. For example, the space four squares diagonally to the right above “completes measurements quickly” and four squares diagonally to the left above “CV to atm pressure ratio” contains a + sign, indicating a strong correlation between these two specifications.
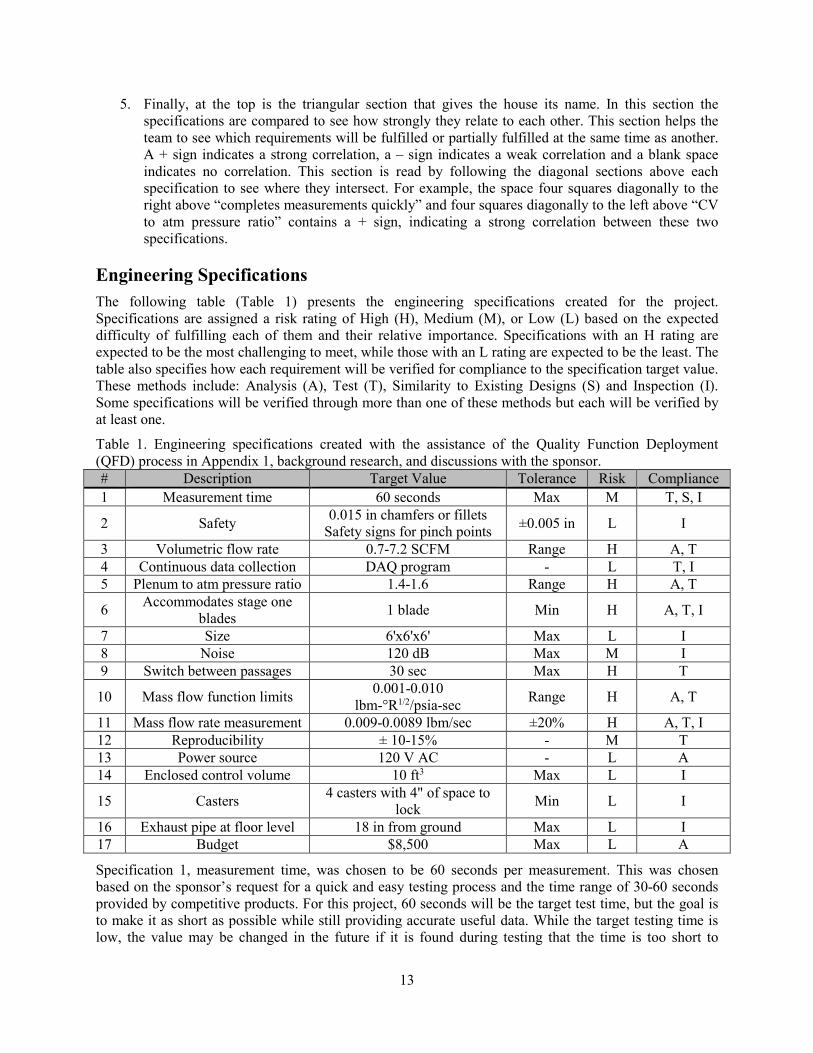
Engineering Specifications The following table (Table 1) presents the engineering specifications created for the project. Specifications are assigned a risk rating of High (H), Medium (M), or Low (L) based on the expected difficulty of fulfilling each of them and their relative importance. Specifications with an H rating are expected to be the most challenging to meet, while those with an L rating are expected to be the least. The table also specifies how each requirement will be verified for compliance to the specification target value. These methods include: Analysis (A), Test (T), Similarity to Existing Designs (S) and Inspection (I). Some specifications will be verified through more than one of these methods but each will be verified by at least one.
Table 1. Engineering specifications created with the assistance of the Quality Function Deployment (QFD) process in Appendix 1, background research, and discussions with the sponsor. # Description Target Value Tolerance Risk Compliance 1 Measurement time 60 seconds Max M T, S, I
2 Safety 0.015 in chamfers or fillets Safety signs for pinch points ±0.005 in L I
3 Volumetric flow rate 0.7-7.2 SCFM Range H A, T 4 Continuous data collection DAQ program - L T, I 5 Plenum to atm pressure ratio 1.4-1.6 Range H A, T
6 Accommodates stage one blades 1 blade Min H A, T, I
7 Size 6'x6'x6' Max L I 8 Noise 120 dB Max M I 9 Switch between passages 30 sec Max H T
10 Mass flow function limits 0.001-0.010 lbm-°R1/2/psia-sec Range H A, T
11 Mass flow rate measurement 0.009-0.0089 lbm/sec ±20% H A, T, I 12 Reproducibility ± 10-15% - M T 13 Power source 120 V AC - L A 14 Enclosed control volume 10 ft3 Max L I
15 Casters 4 casters with 4" of space to lock Min L I
16 Exhaust pipe at floor level 18 in from ground Max L I 17 Budget $8,500 Max L A
Specification 1, measurement time, was chosen to be 60 seconds per measurement. This was chosen based on the sponsor’s request for a quick and easy testing process and the time range of 30-60 seconds provided by competitive products. For this project, 60 seconds will be the target test time, but the goal is to make it as short as possible while still providing accurate useful data. While the target testing time is low, the value may be changed in the future if it is found during testing that the time is too short to
13
acquire an accurate measurement. This condition is based on the expectation that testing speed and measurement error will be directly related.
Specification 2, safety, was chosen based on Solar Turbines’ commitment to safety. To avoid sharp edges that could potentially hurt operators, an edge chamfer or fillet will be applied to all exposed edges of the product. Safety signs will also be provided to warn operators of any potential pinch points, though the product will be designed to minimize pinch points. Finally, the system will have a low center of gravity to ensure that it is stable and cannot tip over. For further safety considerations, see Appendix 4.
Specification 3, volumetric flow rate, was back calculated using the provided values for the mass flow function. See Appendix 3 for sample calculations.
The data collection system of Specification 4 was chosen based on Solar Turbines’ desire to have a flexible system that could operate either as a “go-no-go” gage or provide a more specific measurement of effective area. The DAQ system will provide detailed information about the blade by giving the user access to data taken continuously through the test and will also tell the user if the blade passes or fails based on its relation to the provided standards for the blade type.
Specification 5, plenum to atmospheric pressure, gives the maximum target plenum to atmospheric pressure ratio of 1.6 that was provided by Jeffrey Carullo. The required target ratio for the stage one blades is 1.4, but the capability to operate at a higher pressure ratio was requested to ensure that the product can be adapted to other blades in the future This will also allow the operators to study the flow through the blade more completely.
Specification 6, accommodates stage one blades, requires that the final product accommodate at least the stage one blades as specified by Solar Turbines. The blade fixture design will also be adaptable so as to accommodate other blade types. This is possible due to the ability of rapidly printing new 3-D fixtures with dimensions that match the new blade type as specified by Solar Turbines. The method of accommodation will be based on the Firtree General Dimensions provided by the sponsor.
Specification 7, size, was chosen based on rough estimates of the size of the location where the product will be used. 6’x6’x6’ is the maximum area that the product can take up, though the goal will be to make it as small as possible while still ensuring functionality and safety.
The noise requirements in specification 8 were chosen based on OSHA standards as well as Solar Turbines’ more conservative requirement that if a person needs to raise his voice to be heard by another person at arm’s length then hearing protection must be used. This is a flexible requirement; ideally, the product will produce noise no louder than 80 dB so that ear protection is not required, unless doing so negatively affects the main function.
Specification 9, the ability to switch between passages, was chosen based on Solar Turbines’ desire for a fast testing method. Because the time it takes to switch between the passages will have a large effect on the overall test time, this value will be as small as possible.
Specification 10, mass flow limits, stems from the mass flow function given in Equation 1. This equation was provided by Solar Turbines and has been used to calculate the mass flow function values which are the foundation of the design and analysis. To accommodate the stage one blades as required, as well as different blades in the future, the mass flow function range will be at 0.001-0.010 lbm-°R1/2/psia-sec.
Specification 11, mass flow rates, is based on the final purpose of the product to measure the mass flow rate. The mass flow rate range has been calculated using the mass flow function values and Equation 1. The error value may vary between blades or a numerical value may be selected for specific blades.
The reproducibility specification 12 was chosen based on Solar Turbines’ desire for an easy to use product that produces consistent measurements between operators. An allowable variability of 10-15% was chosen based on the values presented by competitors.
14

For specification 13 a 120V power source was chosen after visiting the Solar Turbines facilities. 120 V AC power sources are readily available and a backup battery power source may be provided to improve the mobility of the product.
Specification 14 requires an enclosed control volume to help prevent accidents while using the product and to regulate the pressure and temperature during operation. The control volume has been designed to fit onto the table of the flow bench so that it is easily accessible and safe to use. It will incorporate a latch so that there is no chance of air expelling.
Specification 15, casters, ensures that the final product will have at least four casters so that it is mobile. At least two of the casters will have locking mechanisms to secure the bench in place and prevent accidents or errors in the measurements that could result from the bench moving during use. There will also be at least 4” of available space to lock the casters so that workers’ steel toed boots will fit into the space to easily lock and unlock the device.
Specification 16, the exhaust pipe at floor level, is also based on Solar Turbines’ commitment to safety. It was suggested that the exhaust release at floor level to ensure the safety of the operators and to avoid accidents with the lifts and hoists frequently used in the facility. The exhaust will release low to the ground in an area beneath the bench so it will not be a tripping hazard.
Finally, the budget of $8,500 in specification 17 was provided by Solar Turbines. This is the upper limit and the goal will be to keep the cost of the project as low as possible while still providing a quality product that fulfills the above specifications.
15

Chapter 3: Design Development and System Layout During the preliminary design phase and most of the way into the detail design phase, it was planned that the flow bench would contain two separate subsystems that would allow the operator to test two blades simultaneously. However, following discussions with the sponsor concerning the scope of the project, it was decided that only one subsystem of the flow bench will be built. This decision will ensure that the project can be completed within the timeframe and budget provided.
Blade Fixture and Setting For the purposes of this report, the word “fixture” refers to the component that interacts directly with the blade and holds it for testing; the word “setting” refers to the component that connects the fixture to the table and secures it in place.
Throughout the design process of the fixture and setting, as team members gained more knowledge and other components of the project changed, the proposed designs went through several iterations. This section outlines the development of the design process of the fixture and setting, then concludes with the final design of each.
Fixture and Setting Design Development Many different ideas were considered for the fixture to secure the turbine blade to the system. The purpose of the fixture is to easily mount the blade to the system, while allowing for versatility and adjustability. The fixture must provide an air tight seal between itself and the firtree of the turbine blade to ensure that no air can leak from the system and disrupt the measurements. It needs to either satisfy multiple types of blades, or be easily modifiable to accommodate other blade types. It is also important that the fixture not scratch, scuff, or damage the turbine blade in any way. The user should be able to mount blades into the fixture quickly and easily in order to speed up the process as much as possible.
The first major decision regarding the fixture was whether it should be permanently attached to the table or removable. A removable fixture would help to speed up the process, but could introduce inaccuracies by increasing the number of components in the system. Furthermore, a removable fixture would allow for easier modification to the fixture to satisfy other blades. Conversely, a permanent fixture would offer the highest opportunity for consistent mounting conditions, but could be a nuisance to work with.
Ultimately, a removable fixture was chosen to increase the potential for the system to be adapted to other blade sizes and to decrease the overall time to set up the device for testing. With multiple removable fixtures, the operator will be able to load a blade into an available fixture while simultaneously testing another blade.
Next, a setting had to be designed to hold the fixture onto the bench. The setting must be able to receive the fixture while ensuring proper alignment and orientation. The setting needs to be able to establish an air tight seal between the fixture and the bench, as well as direct the flow of air into the cooling passages of the blade.
The setting will be permanently attached to the top work surface of the flow bench, and the fixture will fit into the setting and be secured tightly, ensuring a complete seal. To ensure proper orientation, the fixture was originally going to have a notch on one corner that would match a similar notch on the setting. The fixture was intended to extend below the setting and contact the table as well, allowing the bottom of the fixture to come as close as possible to the air exiting the flow bench. The contact surface between the fixture and the table would include a rubber gasket to make the connection airtight. Originally, the fixture would be aligned with extrusions on the setting that would fit into corresponding counter bores on the bottom of the fixture. The removable fixture concept as well as the counter bore concept are illustrated in the sketch below.
16

Figure 10. Removable blade fixture table interface.
After considering this idea, the following wooden concept model was created to determine if it is an effective solution to connect the fixture to the system.
Figure 11. Wooden model demonstrating the removable fixture concept. The top board represents the blade fixture with counter bored bottom connections. The bottom board represents the table interface with extruded connections to fit into the bores on the fixture.
The next design decision was to choose a locking mechanism to secure the fixture to the setting. The locking mechanism must to be able to safely secure the fixture into the setting, as well as provide a correct amount of force onto the fixture to ensure a complete seal. The locking mechanism should be quick and easy to operate, as well as adjustable for future possible fixture dimensions. Sketches of the ideas considered are pictured below.
17

Figure 12. Locking mechanism concept sketches.
The final design was selected using the “Fixture Attachment” Pugh Matrix in Appendix 2. The rotating lock mechanism in the upper left corner was originally selected because it is a small and simple design. However, the “machining,” or toggle, clamp design was ultimately chosen to decrease the number of custom parts required. With the machining clamp option, stock clamps can be selected and easily replaced if necessary.
Preliminary Fixture Design Finally, the general concept of the fixture itself was considered in the “Blade Fixture” weighted decision matrix in Appendix 2. In this matrix, four main concepts were considered: pull over, firtree slider, sliding poles, and set screws. The concept models for each of these are pictured below in Figure 13. The set screw design was chosen as the final fixture concept.
Pull Over Firtree Slider Sliding Poles Set Screws
Figure 13. Blade fixture concept models.
A solid model of the original blade fixture concept is pictured in Figure 14. The selected set screw concept consists of a trenched design with two walls that run parallel to each other. The blade sits between the walls and set screws through angled holes secure the blade in place. The set screws can be adjusted with wing nuts or a similar mechanism so that they can be easily tightened by hand.
18

Figure 14. Blade fixture concept models.
To ensure that the blade is aligned properly, there will be two rubber extended rings installed into the air holes in the base of the fixture. These rings will fit into the holes of the turbine blade, ensuring that it is aligned and that the air will fully flow into the blade passages. Furthermore, the holes in the fixture will be color coded or labeled to indicate to the operator the correct orientation of the blade.
To make this design airtight, there will be a rubber gasket that sits between the blade and the fixture. The gasket will prevent air from escaping between the blade and the fixture. This will also ensure that the metal of the blade does not rub on the metal of the fixture and cause damage to either part.
To prevent scratches or damage to the firtree structure of the blade as requested by the sponsor, the set screws will include rubber ends that can be safely pressed against the blade. This will ensure a secure grip on the blade as well as prevent damage by distributing the force from the screw end to a larger area.
Ultimately, this design was reconsidered after discussion with the sponsors. It was agreed that the set screw concept would be too inconsistent and time consuming in application. The final blade fixture design is discussed below.
Final Fixture Design The final fixture features a trenched design similar to that of the preliminary design. However, the blade will not be held in place with set screws but with toggle clamps. Toggle clamps were selected to increase the simplicity of the design and to ensure repeatability between operations. In addition, stock clamps will be used that can be easily replaced or exchanged if necessary.
Because of the change from set screws to toggle clamps, the surface of the blade needs to be flush with the surface of the fixture to ensure that the clamps come into contact with the blade correctly. Therefore, the blade will sit in a channel with specific geometry to ensure correct orientation. The bottom of the channel will have two holes that line up with the flow holes of the blade. The holes in the base of the fixture will line up with those of the blade because the bottom of the trench is angled to match the end angles of the firtree structure.
An image of the solid model for the fixture may be seen in the figure below.
19

Figure 15. Final fixture design. The design structure is based off the preliminary concept. Unlike the original concept, the blade surface is flush with the top of the fixture and secured with toggle clamps. The shelf at the back of the trench prevents the blade from being inserted incorrectly.
The final fixture will be made of ABS plastic and 3-D printed at the Solar Turbines’ facility. As in the original design, there will be a rubber gasket between the bottom of the firtree and the fixture. This will help to keep the design airtight and prevent wear on the fixture. The dual system would require two identical fixtures so that the leading passage of one blade and the trailing passage of a second can be tested at the same time. The final detail drawing of the fixture may be seen in Appendix 6.
For the original two system design, the fixture was going to have a notched corner to prevent it from being placed into the setting incorrectly. Then one subsystem would test the leading flow passage and the second would test the trailing passage. However, because only one subsystem will be built, the fixture will instead have labels showing the operator which passage is being tested. This will allow the system to fully test each blade without a second subsystem.
Final Setting Design The setting will protrude off of the work surface to provide additional depth for the fixture to fit into. A setting was chosen instead of a thicker table top to decrease cost and weight of the final workbench. As discussed above, the fixture will be held into the setting with toggle clamps. The clamps will allow for the fixture to be removed from the table quickly and easily. Images of the fixture and setting with toggle clamps can be seen below.
20

Figure 16. Blade fixture and setting shown together with toggle clamps (left), and on work surface (right). This figure presents the setting design for the dual system; for the single system, the notch in the left corner of the setting will not exist so the fixture can be removed and rotated to flow both blade passages.
The setting will be made of hardwood and screwed onto the work surface with 8 stainless steel 6-32 socket head cap screws.
Plenum Design The required pressure ratio of 1.4 will be established between the plenum at 1.4 atmospheres and the control volume at one atmosphere. The plenum design is pictured below.
Figure 17. Isometric (left) and front (right) views of the plenum.
The laminar flow element will be connected to the pipe at the base of the plenum using a length of rubber hosing and circle clamps. To prevent air from flowing directly from the laminar flow element into the base of the blade, the plenum includes baffling to redirect the flow and help to stagnate the air. Although an infinite plenum would be required to completely stagnate the air, the plenum will slow the flow sufficiently to decrease the impact of dynamic pressure and allow for the measurement of stagnation pressure.
21

Figure 18. Isometric (left) and front (right) views of the plenum cross section, showing the internal baffling.
Workbench After extensive research into pre-manufactured workbenches, it was determined that a custom bench is the best option. This is because a custom bench will be sure to completely satisfy the size, space and strength requirements for the system. In addition, none of the researched pre-manufactured workbenches had internal dimensions large enough to contain the entire system inside the bench. The design of the custom bench is pictured below.
Figure 19. Custom workbench design.
22

The dual system bench will be six feet wide, two and a half feet deep and four feet tall. It will also include two 18 inch extensions on the sides that can be folded up to increase the work surface size, and folded back down to improve the maneuverability of the bench. It will have two cabinet doors on the front with a locking latch to open and close them. The doors will provide access to the inside of the bench for repairs and changes to the system. All of the system components, except the fixtures and control volumes, will be stored in the cabinets under the work surface.
After further discussion with the sponsors and with the decision to build a single system, the team decided to shorten the workbench from 60 inches wide to 48 inches, the other dimensions will not change. This decision was made for several reasons. The first of these is to reduce the weight of the final system. With a six foot long bench, the steel frame alone would weigh around 110 pounds, according to the mass properties function in SolidWorks. However, with a shorter design, this weight is reduced to 97 pounds. Similarly, the final bench, not including any system components or the work surface, would weigh over 700 pounds, but once the bench is shortened, it weighs 645 pounds. This decrease in weight, while not huge, will still help to increase the mobility of the final system. In addition, the side extensions that were originally included to increase the available workspace will no longer be added to the bench. This is because, with a single system, there will be sufficient workspace on the top of the bench so the extensions will not be necessary. The bench was also shortened to reduce the risk of tipping. With a single system in a longer workbench, the risk of tipping is much higher because the weight would be focused on one side of the bench. If, for example, an operator were to place a heavy box of blades for testing onto the side extension, this could create a large moment and make it easy for the bench to tip. Because the bench is so heavy, tipping creates a serious safety hazard. As such, the shortened bench will be more stable and tip resistant than a longer bench. Calculations supporting this may be found in Appendix 3. Table Top Design The workbench will include a custom wooden work surface. The work surface will be one inch thick and cover the entire top of the workbench. Cherry hardwood was selected for the table top material because it aesthetically pleasing and durable. The setting for the fixture and the control volume will both be permanently attached to the table top. The table top will have specific geometry to allow the operator to flow each blade passage individually. The fixture will be attached to the table with the setting, and will extend a half inch into the table top. To flow each passage, the hole on the table top that the fixture extends into will have a small shelf to cover one blade passage. This cover will be sealed with a gasket to prevent air from flowing through the wrong passage. When the operator wants to switch flow passages, he or she need only remove the fixture, rotate it 180 degrees and replace it into the setting. The shelf will then cover the first passage so the second one can be tested.
23
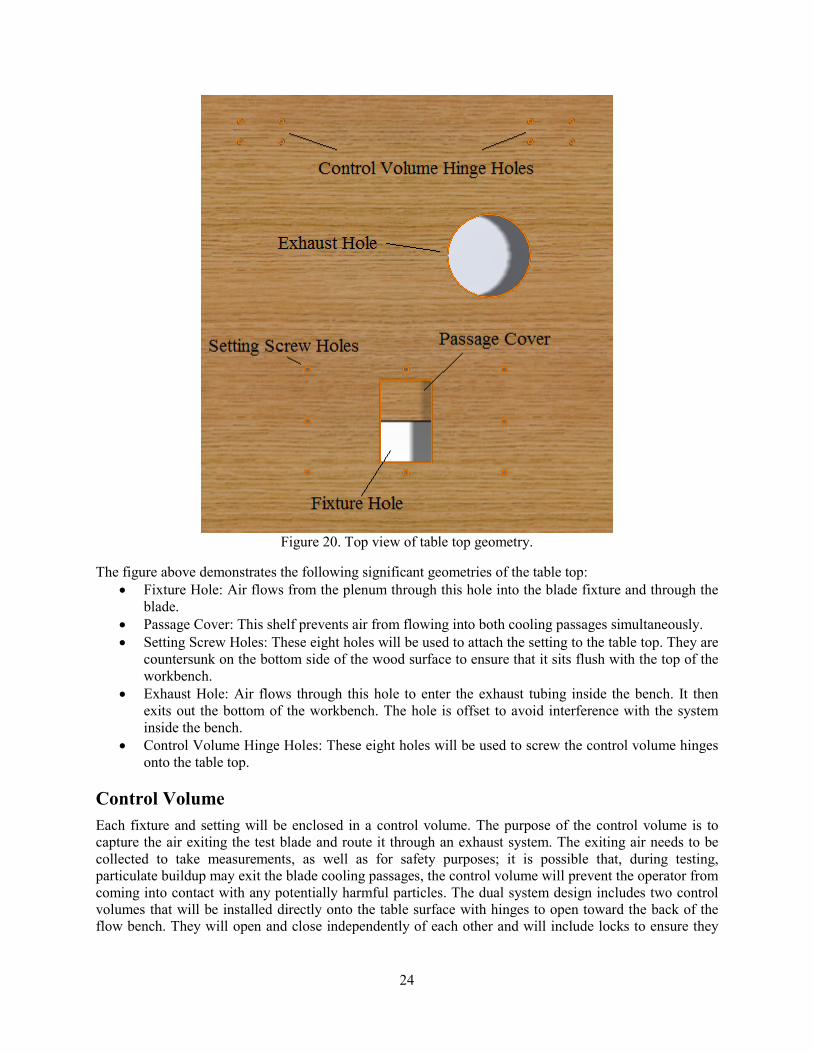
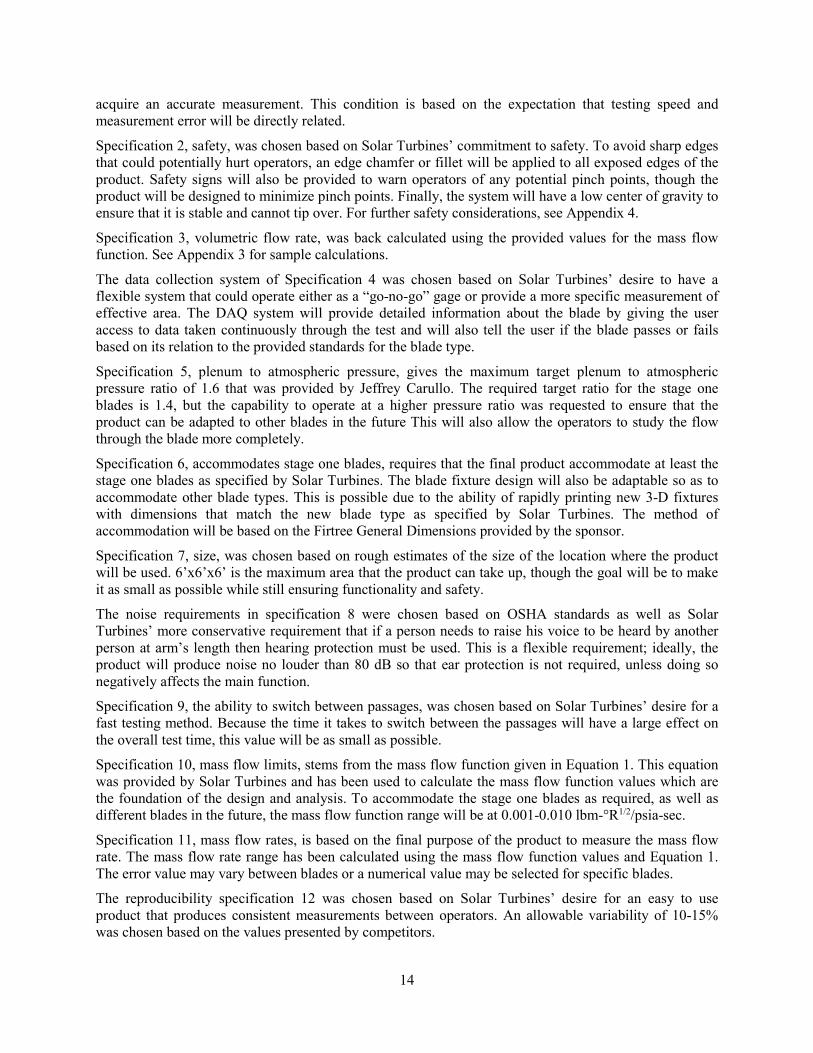
Figure 20. Top view of table top geometry.
The figure above demonstrates the following significant geometries of the table top: • Fixture Hole: Air flows from the plenum through this hole into the blade fixture and through the
blade. • Passage Cover: This shelf prevents air from flowing into both cooling passages simultaneously. • Setting Screw Holes: These eight holes will be used to attach the setting to the table top. They are
countersunk on the bottom side of the wood surface to ensure that it sits flush with the top of the workbench.
• Exhaust Hole: Air flows through this hole to enter the exhaust tubing inside the bench. It then exits out the bottom of the workbench. The hole is offset to avoid interference with the system inside the bench.
• Control Volume Hinge Holes: These eight holes will be used to screw the control volume hinges onto the table top.
Control Volume Each fixture and setting will be enclosed in a control volume. The purpose of the control volume is to capture the air exiting the test blade and route it through an exhaust system. The exiting air needs to be collected to take measurements, as well as for safety purposes; it is possible that, during testing, particulate buildup may exit the blade cooling passages, the control volume will prevent the operator from coming into contact with any potentially harmful particles. The dual system design includes two control volumes that will be installed directly onto the table surface with hinges to open toward the back of the flow bench. They will open and close independently of each other and will include locks to ensure they
24
cannot open accidentally during the tests. The single system design includes one control volume that will operate in the same way.
The control volume will serve to capture all of the air exiting the blade being tested and route it through an exhaust line to be expelled in a safe manner consistent with Solar Turbines’ regulations; the details of this system are discussed below in the “Exhaust System” section. Within the control volume, a pressure and temperature sensor will be mounted to measure air properties. By having these sensors feeding into the control volume, in combination with other sensors throughout the system, the correct pressure ratio across the test piece can easily be acquired. For the design, the control volume will be at atmospheric pressure, or very close to it, so it will not need to act as a pressure vessel. The final detail drawing of the control volume may be seen in Appendix 6.
The geometry of the control volume was chosen to maximize the internal dimensions, yet still ensure that when the control volume is lifted it will sit flush against the top of the work bench, and be parallel with the back of the work bench without extending past the back plane of the bench. This will allow for the workbench to be positioned against a wall and still maintain full motion of the control volume. The final geometry of the control volume is pictured in the figure below.
Figure 21. Final control volume design.
Exhaust System Once the fluid flows through the blade and enters the control volume, it must be expelled from the system in a safe manner. The exhaust system will route the air out of the control volume and release it to the environment in a safe place. The final design has the air routed downward, through the top of the bench through a four inch exhaust tube. The exhaust tube will release the air downward, underneath the bench. This location is in compliance with the requirement of having the exhaust air release fewer than 18 inches from the ground.
On the top surface of the workbench there will be a grate covering the entrance of the exhaust piping to prevent any objects from falling through the exhaust system. The grate will be coarse enough to prevent any pressure build up in the control volume. In addition, at the request of Solar Turbines, a basic cheese cloth filter will be installed over the grate to collect any particulates that exit the blade.
25
There will be a second grate at the bottom of the bench so that objects cannot enter the exhaust during operation or movement of the flow bench.
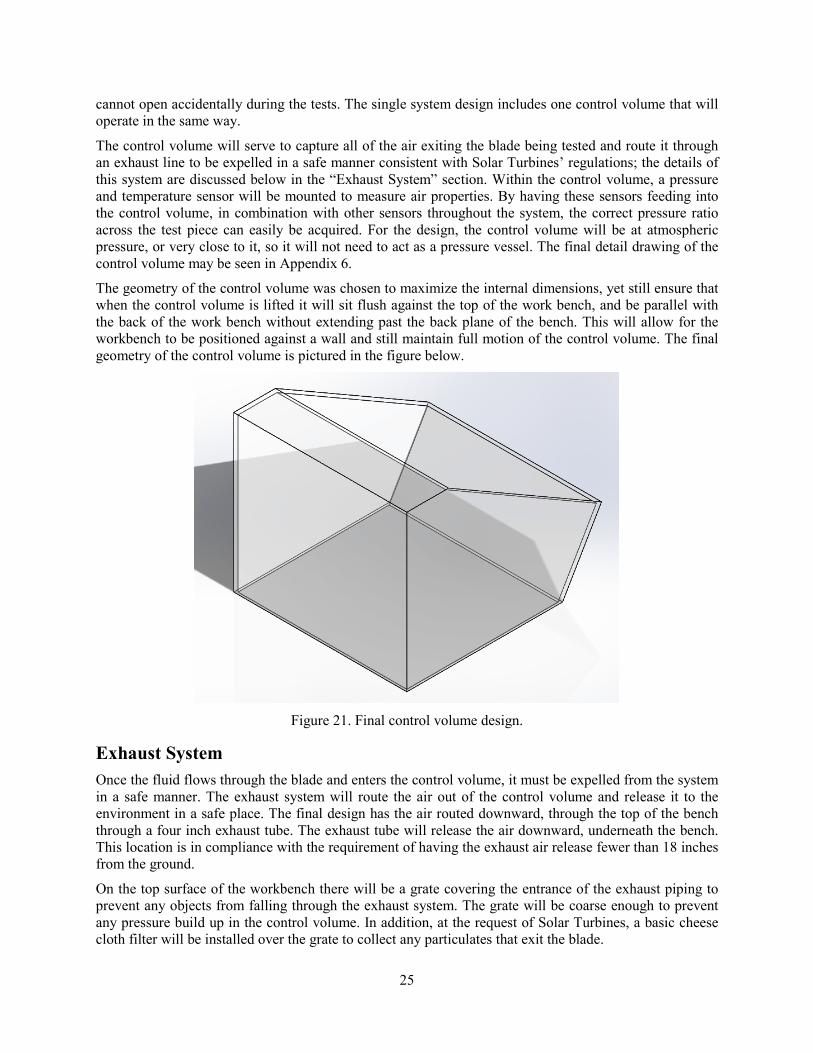
Air Movement Four major concepts were considered to move air through the system: a pump, a compressor, a blower, and Solar Turbines’ shop air. A pump was immediately ruled out as an option because pumps are most frequently used for liquids. To aide in the decision, the following table of pros and cons was created. A blower was initially selected as the final concept using this table and the “Air Movement” Pugh Matrix in Appendix 2-2.
Table 2. Air movement concept pros and cons. Compressor Blower Shop Air Pros: ● Free standing system
● Constant flow ● Mobile
● Free standing system ● No tank ● Cheap ● Constant flow
● Cleaner ● Free ● No loud motor
Cons: ● Maintenance ● Weight ● Need a tank ● Dirty air ● Cost ● Loud Noise
● Maintenance ● May be loud ● Outside air used
● Need a tank ● Pressure can vary ● Must run air line ● Limited to shop
Ultimately, it was found that a blower that could produce the relatively high pressure requirements, and low volumetric flow rates required for this system would cost at least $5,000 (Stanson). To avoid this, two 30 gallon tanks will be stored on the system. As shown in sample calculations in Appendix 3-2, each tank will be pressurized to 100 psi and will be able to supply enough air for a 3 minute test. The tanks will be continuously refilled using a connection to the shop air available at the facility.
A computer controlled module control valve will be installed along the plumbing exiting each tank to ensure that the air is released at the proper pressure. The valve will regulate the flow of air out of the tank and make adjustments based on the needs of the system. The valves will be connected to the data acquisition and control system that is discussed below.
Flow Measurement After completing the background research concerning methods of measuring flow, the options were narrowed down to a supersonic flow nozzle and an orifice plate. Both of these flow meters find volumetric flow by measuring the change in pressure across the component, then relating it to fluid velocity. An orifice plate was originally selected using the “Flow Measurement” Pugh matrix in Appendix 2-5. The orifice plate was determined to be the best option largely because it does not require supersonic flow through the system, allowing lower air pressures and velocities. In addition, supersonic flow nozzles are expensive and challenging to manufacture, while an orifice plate is fairly simple and easy to manufacture. The orifice plate will be designed to measure a specified flow rate, but it will be possible to measure other flow rates by changing the size of the orifice hole.
After further research, it was found that an orifice plate is not accurate enough for this application. In addition, to measure different flow rates, the change the pressure across the orifice plate would be different for each flow rate, resulting in the wrong pressure ratio at the test element. To mediate this the orifice plate would have to be removed completely and replaced. Therefore, a laminar flow element was considered instead of an orifice plate because it can achieve the accuracy required and is able to operate
26

over a larger range of flow rates, with a minimal change in pressure drop, than any of the other flow meter options considered.
A laminar flow element, or laminar flow meter, was not originally selected for this application for several reasons. Orifice plates are used for flow measurement much more frequently than laminar flow elements, so during the initial research phase the team did not find much research supporting the use of such an element. A laminar flow element was first considered following discussions with Dr. Shollenberger at Cal Poly. She recommended that the team consider laminar flow elements for their increased accuracy and ability to measure a range of flow rates. In addition, a laminar flow element was not initially considered because of cost. Because they are much more accurate than orifice plates, laminar flow elements are also significantly more expensive. However, a laminar flow element is now a good choice for the system because it fulfills the necessary accuracy requirements and does not need to be changed for each new pressure ratio and flow rate. Although it is more expensive, it is also the best option to fit the specifications for the system.
To measure the flow through the laminar flow element the pressure drop across the element must be measured. The change in pressure across the element is directly related to the velocity and flow rate of the fluid moving through the element. Each laminar flow meter has a range of volumetric flow rates that it can measure, which are correlated to a change in differential pressure across the element. The higher the pressure differential, the higher the flow rate. The most common method of measuring this change in pressure is through the use of a manometer.
In combination with the laminar flow element pressure reading, the pressure of the system will need to be taken just before and just after the test piece to account for any losses through the system, as well as to ensure the correct pressure ratio across the test piece. To accurately measure the pressure entering the test piece, a plenum will be implemented just before the test piece to stagnate the air as much as possible. Stagnating the flow will allow for a more accurate pressure reading by minimizing the effects of dynamic pressure. Fluid in a flow applies additional pressure on fluid surfaces perpendicular to the flow direction. By stagnating the flow, the effects of these forces are minimized, and the true, total pressure can be more easily, and accurately measured.
In order to effectively and accurately measure the flow through the system, other fluid properties need to be taken into account besides pressure. The density and viscosity of air are dependent on the temperature of the air. For this reason, the temperature of the fluid will need to be monitored from start to finish to account for any changes in fluid properties. Temperature sensors will need to be incorporated into the system and used in tandem with the pressure data to accurately measure the flow rate through the system.
Since the system will contain pressure measurement devices in both the plenum and the control volume, head loss through the system does not need to be considered due to Bernoulli's principle. This principle shows that, because the working fluid is a gas and there is no change in velocity and or height, the change in pressure is equal to the head loss. Because the system will be setting the pressure difference to 1.4 for every blade, the head loss will in turn be zero. This ability to set the pressure difference for every blade allows for the head loss through the system to be eliminated.
Flow Separate Passages Two options were considered to flow the separate passages of the blade. The first was to have two separate air lines connected to two air sources, with one line running to each passage. The second was to have a single line with a forked end and to use either a manual or automatic switch to change between passages. The final concept was selected using the “Switch Passages” Pugh Matrix in Appendix 2-6. The automatic switch option was selected because it eliminates the need for two separate systems to move the air. This decreases the cost and increases the manufacturability of the product. It also decreases the number of components that will be included in the system, thus lowering the potential for error.
27
A Solenoid valve or similar device will be used to switch between flow passages. Solenoid valves are hands free, computer driven switches. The valve will allow the system to operate off of a single airline rather than two separate lines. Originally, the line was to be forked at the end to flow the two passages, but they would be flowed individually using the valve. Because the valve is computer driven, the operator would be able to quickly and safely switch between the passages without having to open the machine.
After further research and discussions with the sponsors, it was determined that a single system would be incapable of flowing both passages. This is because of the different geometry of the passages; each passage has different mass flow requirements to achieve an accurate reading. As a result, the orifice plate would have to be changed between passages to achieve the necessary flow rate and pressure ratio, as discussed previously in the “Flow Measurement” section. This would drastically increase the amount of time required to test each blade.
Because of this, the original flow bench design contained two separate flow subsystems. One to flow the leading passage of the blade and one to flow the trailing passage. The fixture would remain the same for each subsystem, so the operator would simply test the first passage then move the blade and fixture to the second subsystem to test the second passage. The table geometry will be such that the passage not being tested will be covered to ensure that no air enters it and affects the readings.
Ultimately, with the addition of a control system to the flow bench, a single system design is once again a viable option. As such, the bench will be built with a single air system. This system will be able to flow both passages individually because of the geometry of the table top and fixture. As discussed previously, the fixture can be removed, rotated 180 degrees and replaced into the setting to switch the passage that is being tested.
Pressure Ratio Development As specified in the requirements, the necessary pressure ratio is 1.4 across the test piece. In order to achieve this specification the correct pressure needs to be supplied to the input of the system. Throughout the system there are several pressure drops, which would need to be accounted for in order to manually set the correct input pressure. The main pressure drop stems from the flow meter, but there will be other losses through the system due to mechanisms such as friction, and unavoidable leakage.
The design requires a method of controlling the pressure input to the system in a quick, easy, accurate, and reliable method. The initial design specified a manual needle valve that would be adjusted by the technician to establish the correct pressure ratio at the test section. A needle valve was chosen due to its accuracy and reliability in controlling pressure and flow. As the team acquired more knowledge of fluid systems it became apparent that this method was not ideal. Because each blade will have a different volumetric flow rate due to specific particulate build up, the change in pressure across the laminar flow element will be different for each blade. To run each test at the correct pressure ratio, the needle valve would have to be manually adjusted for each individual test that is run. This manual input would waste time and efficiency.
Due to the unknown pressure drop across the laminar flow element for each blade, the team decided to change the design to a module control valve. The control valve will be modulated through the control system. The control system will take data from each of the sensors throughout the system and run an iterative loop to appropriately control the pressure entering the system for each test. By implementing an automated control valve, the system will be more accurate, adjustable, and user friendly. Also, the testing time for each blade will be decreased due to the automatic response of the control valve. The control system that will perform these operations is discussed below.
Data Acquisition and Control System Because of time constraints, a data acquisition and control system will not be implemented on the flow bench. Instead, the team will focus on producing a functional mechanical system that can be adapted in the future to include a DAQ system.
28
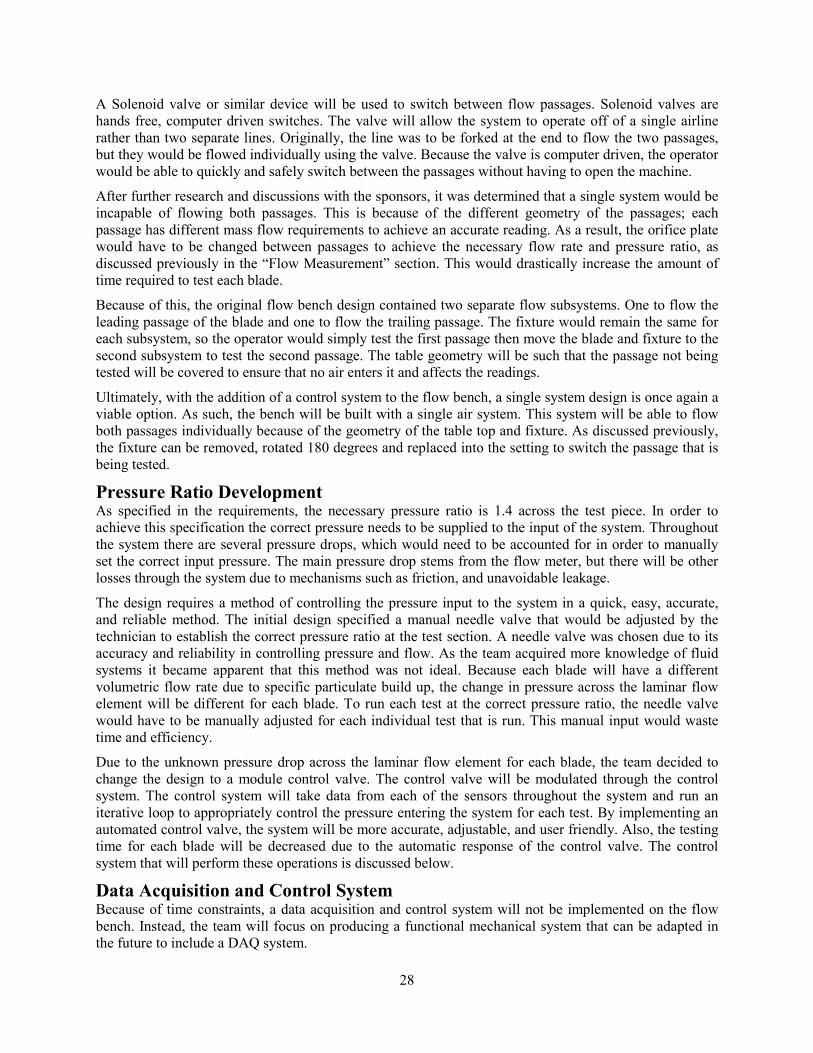
System Layout The following figure shows the final design layout for the dual system workbench with the original bench length.
Figure 22. Isometric view of dual system design.
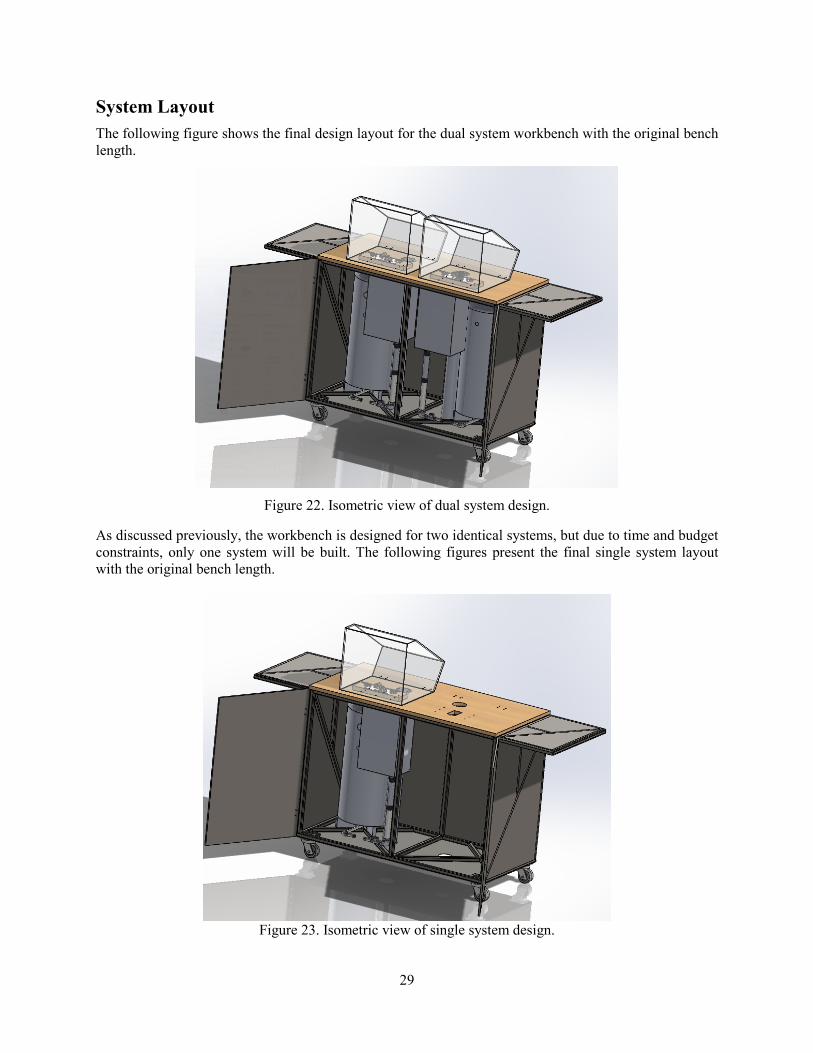
As discussed previously, the workbench is designed for two identical systems, but due to time and budget constraints, only one system will be built. The following figures present the final single system layout with the original bench length.
Figure 23. Isometric view of single system design.
29

Figure 24. Exploded view of single system design.
As discussed previously, the team decided to shorten the workbench to decrease the risk of the single system design tipping and causing damage to the system or injury to operators. Images of the single system layout with the shortened bench design may be seen below.
30

Figure 25. Isometric view of final short bench design.
Figure 26. Front view of final short bench design.
31

Figure 27. Exploded view of final short bench design.
Air Flow Through the System Pressurized shop air will enter the system through a ½” quick connect on the left side of the work bench that will feed into the tank through a plumbing system. The plumbing system will end in a ¾” tee that connects to the tank and is closed with a plug. A tee was selected so that a second system can be connected and filled via the same quick connect valve.
32
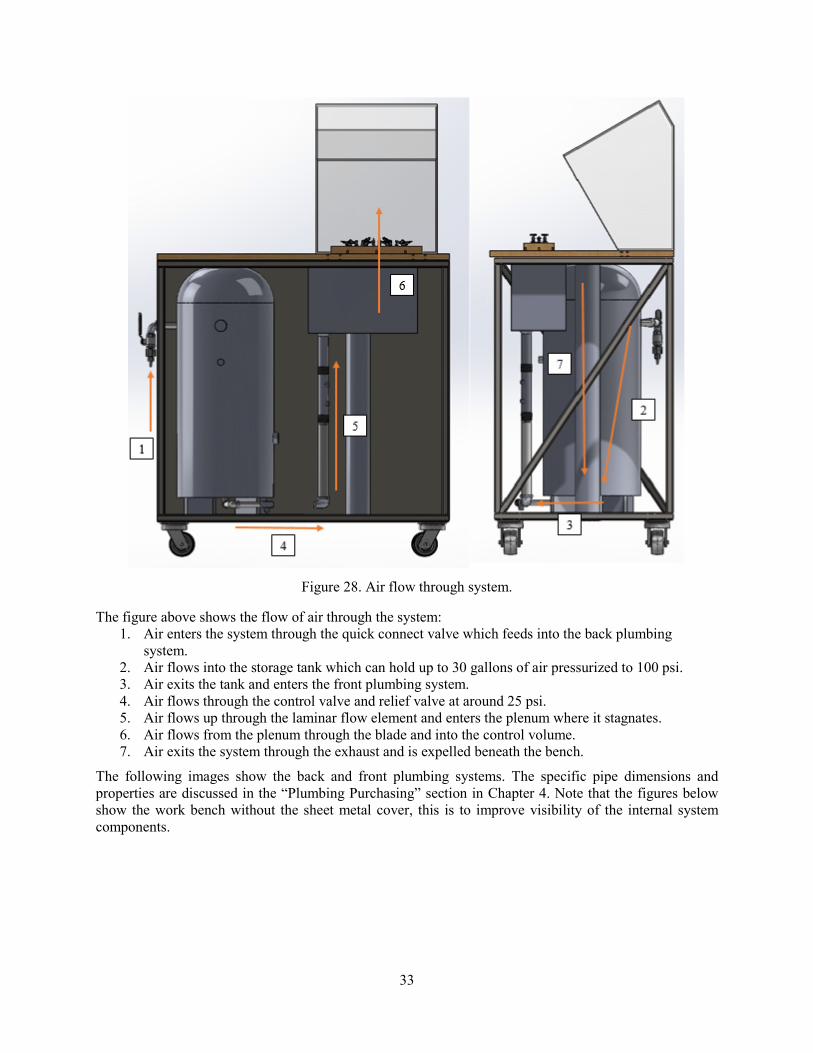
Figure 28. Air flow through system.
The figure above shows the flow of air through the system: 1. Air enters the system through the quick connect valve which feeds into the back plumbing
system. 2. Air flows into the storage tank which can hold up to 30 gallons of air pressurized to 100 psi. 3. Air exits the tank and enters the front plumbing system. 4. Air flows through the control valve and relief valve at around 25 psi. 5. Air flows up through the laminar flow element and enters the plenum where it stagnates. 6. Air flows from the plenum through the blade and into the control volume. 7. Air exits the system through the exhaust and is expelled beneath the bench.
The following images show the back and front plumbing systems. The specific pipe dimensions and properties are discussed in the “Plumbing Purchasing” section in Chapter 4. Note that the figures below show the work bench without the sheet metal cover, this is to improve visibility of the internal system components.
33

Figure 29. Quick air connect and back plumbing system.
Figure 30. Exploded view of back plumbing system with key components labeled.
34

To run a test, the control valve will open and air will exit the tank then enter the front plumbing system pictured below. Because the data acquisition and control system is not yet designed, the front plumbing system leaves space for a control valve that will be connected to the control system, this is labeled “Location of Control Valve” in the figure.
Figure 31. Exploded view of front plumbing system with key components labeled.
35

Chapter 4: Manufacturing and Purchasing Following the presentation to the sponsors and approval of the final design, the team will work with the sponsors to order all the parts and materials for the flow bench. Blade Fixture Manufacturing The fixture will be manufactured from ABS plastic with a 3-D printing process. Several prototypes have been created using this method already. For the prototypes, the MakerBot in the “Innovation Sandbox” at Cal Poly was used. To decrease the printing time, the prototypes were made as shell pieces. A prototype fixture holding the printed blade provided by Solar Turbines may be seen in the figure below.
Figure 32. Top and front view of a prototype fixture with a 3-D printed blade. Internal fixture geometry ensures correct orientation of the blade.
For the final fixture production, the SolidWorks part file will be sent to Solar Turbines and the fixture will be printed at the facility in San Diego. The 3-D printer at the Solar Turbines’ facility is of higher quality than the one at Cal Poly, so the fixture will better fit the specified dimensions. Also, printing the fixture through Solar Turbines will cost less than printing at Cal Poly or another facility and will not require the use of an outside manufacturer.
The method of 3-D printing was chosen for its low cost and ease of iteration. In addition, 3-D printing the fixture allows for complex geometries specific to the blade. As such, the fixture can be redesigned, or a new fixture designed, to accommodate different blade types. So long as the general outside dimensions remain constant, new fixtures can be easily designed and printed for blades other than the Type 1 blade. This will allow Solar Turbines to increase the functionality of the bench while avoiding expensive machining costs.
Laminar Flow Element Purchasing A laminar flow element will be purchased from Meriam Instruments and will cost $1455. The element has a standard accuracy of ±0.72% to ±0.82% of the reading, a repeatability of 0.1 and a response time of 16 milliseconds. The pipe diameter of the selected unit is 1 ¼ in, with tapered ends for pipe connections. The element is specified to operate within 0-16 standard cubic feet per minute, which, as shown in the calculations in Appendix 3, fully encloses the necessary flow rate range of 0.7-7.2 standard cubic feet per minute. The maximum pressure drop across the element at 16 SCFM is 8 inches of water, or .29 psia, and the relationship is supplied by the manufacturer in the form of a reproducible flow curve in terms of SCFM versus inches of water differential pressure. Correction factors are also included. Meriam
36

Instruments also provides instruments specifically for measuring the pressure drop across their laminar flow elements in both analogue and digital manometers.
Tank Purchasing A thirty gallon tank will be purchased from Manchester Tank for $395, including tax and shipping. The tank is a vertical pressure vessel rated to hold 30 gallons of air at 100 psi. It is roughly 40 inches tall and 16 inches in diameter. It will be stored in the cabinet under the workbench and will be refilled with the shop air at the Solar Turbines facility.
Control Volume Manufacturing and Purchasing The control volume will be manufactured by the team using the machine shops at Cal Poly. Acrylic sheets will be cut to size and glued together. Metal brackets will be added where necessary to ensure that the control volume is stable. Additional sealant will be added where necessary to ensure that the control volume is air tight.
Workbench Manufacturing and Purchasing The base bench will be manufactured at Coastal Ironworks in Morro Bay, California and has been quoted at a cost of $1,500. The estimated delivery date is two weeks. This does not include the wood work surface.
The work surface of the flow bench will be made of cherry hardwood and will include a custom setting that for the fixture to fit into. The wood will be cut to size and purchased, then customized by the project team. The base wood will cost $280 from Home Depot.
The table top will have four counter sunk holes, one in each corner, to attach the wood top to the top of the bench. There will then be a set of sixteen holes drilled into the bottom of the surface to attach the plenum. The table top will also have eight countersunk thru holes drilled into the bottom which will be used to attach the setting. There will also be a 4” hole cut into the wood for the exhaust system. A small trench hole will be cut to allow the control volume to latch to the bench. Finally it will include a square hole for the fixture with a shelf to block the secondary blade passage during testing.
Plumbing Purchasing The flow bench will connect to the Solar Turbines shop air with a standard ½” quick connect. This will be connected to ½” plumbing that will be converted to ¾” to enter the tank. The entrance to the tank will be through a ¾” NPT elbow.
Air will exit the tank through the bottom, ½” NPT tap. It will travel through a ½” line that connects the control valve to the system. Then the plumbing will expand from ½” to 1¼” with an elbow to enter the laminar flow element. All of the plumbing in the system will be purchased from McMaster Carr, has NPT standard tapered threads, and is rated at least 150 psi. The plumbing is made of black iron, steel and brass. The different materials will not be an issue for this system because the working fluid is air, so corrosion is not a concern.
Off the Shelf Part Purchasing Due to the extensive number of off the shelf parts required for this project, they are not all listed in this document. A complete list of all parts can be found in the budget in Appendix 7.
37
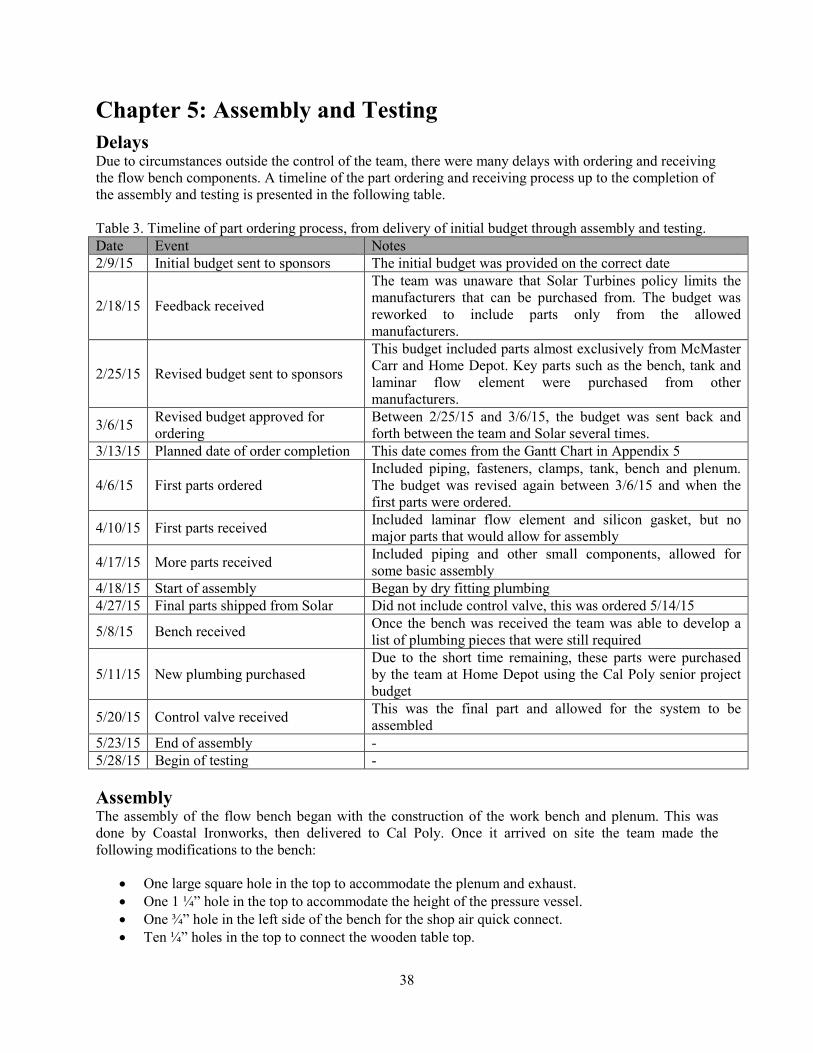
Chapter 5: Assembly and Testing Delays Due to circumstances outside the control of the team, there were many delays with ordering and receiving the flow bench components. A timeline of the part ordering and receiving process up to the completion of the assembly and testing is presented in the following table. Table 3. Timeline of part ordering process, from delivery of initial budget through assembly and testing. Date Event Notes 2/9/15 Initial budget sent to sponsors The initial budget was provided on the correct date
2/18/15 Feedback received
The team was unaware that Solar Turbines policy limits the manufacturers that can be purchased from. The budget was reworked to include parts only from the allowed manufacturers.
2/25/15 Revised budget sent to sponsors
This budget included parts almost exclusively from McMaster Carr and Home Depot. Key parts such as the bench, tank and laminar flow element were purchased from other manufacturers.
3/6/15 Revised budget approved for ordering
Between 2/25/15 and 3/6/15, the budget was sent back and forth between the team and Solar several times.
3/13/15 Planned date of order completion This date comes from the Gantt Chart in Appendix 5
4/6/15 First parts ordered Included piping, fasteners, clamps, tank, bench and plenum. The budget was revised again between 3/6/15 and when the first parts were ordered.
4/10/15 First parts received Included laminar flow element and silicon gasket, but no major parts that would allow for assembly
4/17/15 More parts received Included piping and other small components, allowed for some basic assembly
4/18/15 Start of assembly Began by dry fitting plumbing 4/27/15 Final parts shipped from Solar Did not include control valve, this was ordered 5/14/15
5/8/15 Bench received Once the bench was received the team was able to develop a list of plumbing pieces that were still required
5/11/15 New plumbing purchased Due to the short time remaining, these parts were purchased by the team at Home Depot using the Cal Poly senior project budget
5/20/15 Control valve received This was the final part and allowed for the system to be assembled
5/23/15 End of assembly - 5/28/15 Begin of testing - Assembly The assembly of the flow bench began with the construction of the work bench and plenum. This was done by Coastal Ironworks, then delivered to Cal Poly. Once it arrived on site the team made the following modifications to the bench:
• One large square hole in the top to accommodate the plenum and exhaust. • One 1 ¼” hole in the top to accommodate the height of the pressure vessel. • One ¾” hole in the left side of the bench for the shop air quick connect. • Ten ¼” holes in the top to connect the wooden table top.
38

• Four ½” holes in the bottom of the bench to attach the pressure vessel. • One 1” hole in the top of the bench for the manometer tubing.
In addition, the following modifications were made to the plenum:
• A small hole was drilled for the monometer tube attachment. The attachment was put through the hole and glued in place with silicon sealant. The attachment is placed such that the face of the attachment is in contact with the inside wall of the plenum so it cannot fall out should the sealant fail.
• A second hole was drilled and the connector for the pressure relief valve was welded in place. This connection was sealed with silicon sealant as well.
• The pressure relief valve was added to the connector and sealed with PTFE tape.
The assembly process for the system inside the bench was as follows. Note that all plumbing was sealed with PTFE tape, tightened to at least 1.5 turns past hand tight and further sealed with liquid gasket or silicon sealant.
1. The pressure vessel was fitted with all the plugs and converters then placed into the workbench and attached to the bottom by four ½” hex head bolts.
2. The side plumbing from the pressure line quick connect into the pressure vessel was assembled and attached to the pressure vessel through the hole in the side of the bench.
3. The pressure relief valve and pressure gauge were added to the pressure vessel. 4. The plenum was attached to the bench by lowering it through the square hole on top. 5. The front plumbing system, including the flow valve and laminar flow element, was assembled
and attached to the tank and plenum. 6. The manometer tubing was attached to the laminar flow element and control volume.
The control volume was manufactured by the team. The acrylic was cut to size and assembled with metal brackets. Holes were drilled in the right, back and front sections for the latch, handle and hinges, respectively. The latch, handle and hinges were attached to the control volume with bolts. Silicon sealant was then added to the edges of the acrylic and around the holes for the bolts.
The blade fixture was 3D printed in ABS plastic by Solar and shipped to Cal Poly. Once the team was provided with a stage one turbine blade, the bolt holes in the fixture were redrilled. The toggle clamps were then attached to the fixture. A gasket was cut to size for the firtree hole in the fixture and two holes were cut into it to allow air flow.
Holes were cut into the wooden table top to accommodate the fixture and exhaust. It was then attached to the top of the bench with 10 wood screws. The two wooden supports with toggle clamps were cut to size and attached to the top of the bench to secure the fixture in place. The control volume was then screwed onto the table top to enclose the fixture and exhaust.
Testing Because of the extensive delays in the start of testing, several planned tests were excluded and others were shortened. The planned list of tests, their descriptions and results may be seen in the DVPR in Appendix 9; excluded tests are crossed out. Further testing information may be found in the Design Failure Mode and Effect Analysis (DFMEA) in Appendix 10. The system was tested by filling the tank with air from the Cal Poly machine shop pressure line. Once the tank was full, the valve was opened to allow the air to enter the system to flow through the blade. Temperature was measured and pressure measurements were taken across the LFE and the blade. The
39
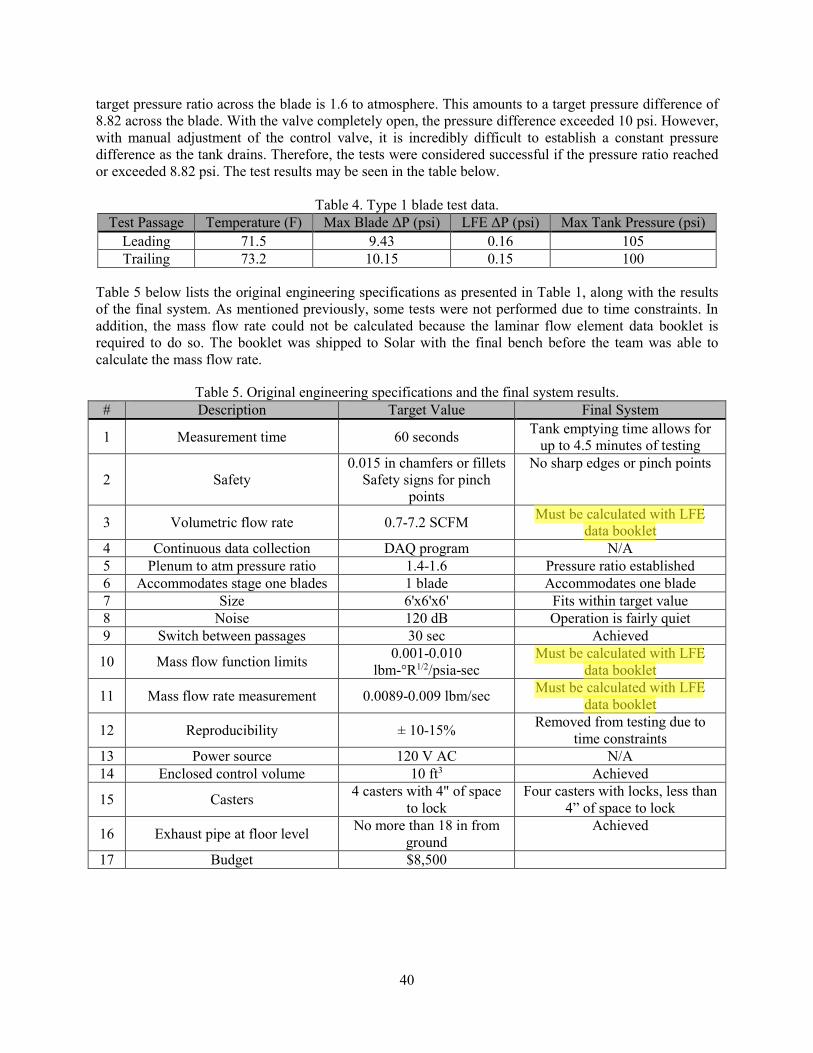
target pressure ratio across the blade is 1.6 to atmosphere. This amounts to a target pressure difference of 8.82 across the blade. With the valve completely open, the pressure difference exceeded 10 psi. However, with manual adjustment of the control valve, it is incredibly difficult to establish a constant pressure difference as the tank drains. Therefore, the tests were considered successful if the pressure ratio reached or exceeded 8.82 psi. The test results may be seen in the table below.
Table 4. Type 1 blade test data. Test Passage Temperature (F) Max Blade ΔP (psi) LFE ΔP (psi) Max Tank Pressure (psi)
Leading 71.5 9.43 0.16 105 Trailing 73.2 10.15 0.15 100
Table 5 below lists the original engineering specifications as presented in Table 1, along with the results of the final system. As mentioned previously, some tests were not performed due to time constraints. In addition, the mass flow rate could not be calculated because the laminar flow element data booklet is required to do so. The booklet was shipped to Solar with the final bench before the team was able to calculate the mass flow rate.
Table 5. Original engineering specifications and the final system results. # Description Target Value Final System
1 Measurement time 60 seconds Tank emptying time allows for up to 4.5 minutes of testing
2 Safety 0.015 in chamfers or fillets
Safety signs for pinch points
No sharp edges or pinch points
3 Volumetric flow rate 0.7-7.2 SCFM Must be calculated with LFE data booklet
4 Continuous data collection DAQ program N/A 5 Plenum to atm pressure ratio 1.4-1.6 Pressure ratio established 6 Accommodates stage one blades 1 blade Accommodates one blade 7 Size 6'x6'x6' Fits within target value 8 Noise 120 dB Operation is fairly quiet 9 Switch between passages 30 sec Achieved
10 Mass flow function limits 0.001-0.010 lbm-°R1/2/psia-sec
Must be calculated with LFE data booklet
11 Mass flow rate measurement 0.0089-0.009 lbm/sec Must be calculated with LFE data booklet
12 Reproducibility ± 10-15% Removed from testing due to time constraints
13 Power source 120 V AC N/A 14 Enclosed control volume 10 ft3 Achieved
15 Casters 4 casters with 4" of space to lock
Four casters with locks, less than 4” of space to lock
16 Exhaust pipe at floor level No more than 18 in from ground
Achieved
17 Budget $8,500
40

Chapter 6: Budget and Management Budget There is an $8,500 budget designated for this project by Solar Turbines. The cost to build a single system is $8,134.51, and the cost to build a dual system is $13,440.30. The largest portion of this budget will go toward measuring instruments and the fabrication of the table itself. Because only a single system will be made, the mechanical component of the project will be completed under budget. However, the budget does not currently include the cost of the control and data acquisition system, including the controller and several measurement devices.
A complete spreadsheet of the project budget may be found in Appendix 8.
Management Plan The team members and their responsibilities are as follows:
● Gwendolyn Church is the secretary for the team. Her responsibilities include: − Solid Modeling and design − Part selection and ordering − Project progress documentation
● Tom Hurni is the team treasurer. His responsibilities include: − Analysis and calculations − Budget maintenance − Part selection and ordering
● Jacob Hustedt is the communications officer. His responsibilities include: − Analysis and calculations − Budget maintenance − Sponsor interactions and scheduling − Part selection and ordering
While each team member has a specific job and title, the project work will be divided as evenly as possible between all three members, depending on each member’s areas of expertise and schedule outside of the project. However, each team member is responsible for the completion of each of the tasks associated with his or her name listed above.
The following table outlines project milestones relevant to Solar Turbines:
Table 6. Key project milestones. Note that this table does not include all internal deadlines for the senior project class. Due Date Deliverables 23 October 2014 Project Proposal Report 20 November 2014 Preliminary Design Report 12 December 2014 End of Fall Quarter 3 February 2015 Final Design Report 3 March 2015 All parts and materials ordered for design 3-20 March 2015 Prototype construction begins as parts arrive 20 March 2015 End of Winter Quarter 27 April 2015 Testing begins 29 May 2015 Senior Design Expo 5 June 2015 Final Project Report
41

In addition, a Gantt Chart was developed to outline the project timeline. The chart is organized by date and includes a timeline of project milestones and dates. It can be found in Appendix 5.
The amount of time designated for the project outside of scheduled labs will vary with each quarter of the project. During fall quarter and the first third of the project there will be a minimum of ten hours each week outside of lab hours to complete the project proposal and preliminary design report. This time will be spent mostly doing research and brainstorming ideas to solve the problem as set forth in the project statements. The second quarter of the project will have a minimum of eight hours each week. This time will be spent finalizing the design concept and ordering the necessary parts. It will also be spent researching and building other important components necessary for the success of the project. The final third of the project will be the most time consuming with a minimum of 12 hours outside of class each week. The bulk of the time will be spent testing the rig, while the remaining time will be spent putting the test rig together and making any final adjustments. Allowing plenty of time for extensive testing will ensure the highest quality of the final product. Note that these time figures are estimates, not hard limits. The group will work more or fewer hours where necessary to ensure that a high quality product is delivered on time.
42
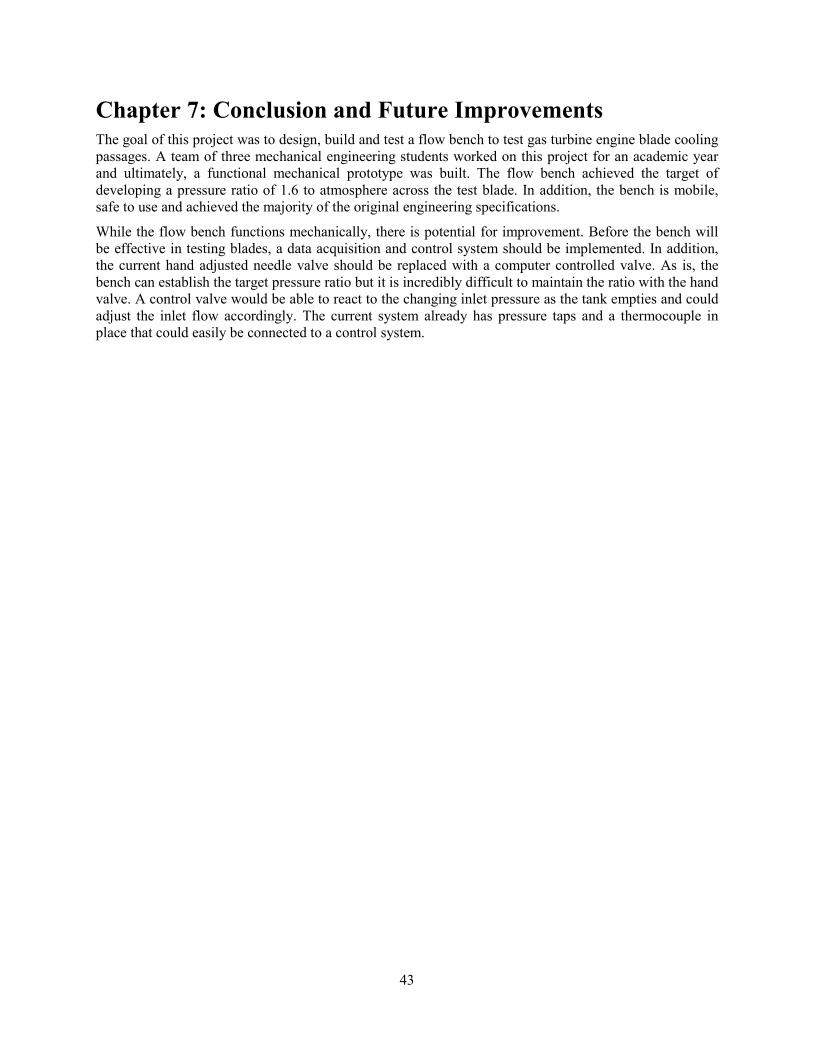
Chapter 7: Conclusion and Future Improvements The goal of this project was to design, build and test a flow bench to test gas turbine engine blade cooling passages. A team of three mechanical engineering students worked on this project for an academic year and ultimately, a functional mechanical prototype was built. The flow bench achieved the target of developing a pressure ratio of 1.6 to atmosphere across the test blade. In addition, the bench is mobile, safe to use and achieved the majority of the original engineering specifications.
While the flow bench functions mechanically, there is potential for improvement. Before the bench will be effective in testing blades, a data acquisition and control system should be implemented. In addition, the current hand adjusted needle valve should be replaced with a computer controlled valve. As is, the bench can establish the target pressure ratio but it is incredibly difficult to maintain the ratio with the hand valve. A control valve would be able to react to the changing inlet pressure as the tank empties and could adjust the inlet flow accordingly. The current system already has pressure taps and a thermocouple in place that could easily be connected to a control system.
43

Works Cited Altman, Wolfgang. "2.9: Flow Meters." On GlobalSpec. 2014. Web. 17 Nov. 2014. Darren, Todd. "DIY Flowbench Design." DIY flowbench design and construction. DTec, n.d. Web. 19
Nov. 2014. <www.dtec.net.au >. ECHO PB-500T Emission-Compliant Tube-Mounted Throttle Backpack Leaf Blower-ECHO USA |
ECHO USA. Web. 16 Nov. 2014. "EZ Flow System (affordable Cylinder Head Flow Bench Kit, Electronics, and Software Program)." EZ
Flow System (affordable Cylinder Head Flow Bench Kit, Electronics, and Software Program). N.p., n.d. Web. 26 Jan. 2015.
Figliola, R. S., and Donald E. Beasley. Theory and Design for Mechanical Measurements. 4th ed. New
York: Wiley, 2006. Print. Flack, Ronald D. (2005). “Chapter 8: Axial Flow Turbines”. Fundamentals of Jet Propulsion with
Applications. Cambridge Aerospace Series. New York, NY: Cambridge University Press. ISBN 9780521819831, p. 428.
"Flow Bench | Air Flow Measurement | Air Flow Analysis." Flow Bench | Air Flow Measurement Air
Flow Analysis. Web. 20 Oct. 2014. "Flow Performance | Flow Performance Flow Bench | Flow Bench FAQ." Flow Performance | Flow
Performance Flow Bench | Flow Bench FAQ. N.p., n.d. Web. 26 Jan. 2015. Flow Systems. Flow Systems Inc., 2013. Web. 20 Oct. 2014. <http://www.flowsystemsinc.com/>. Friedlander, S.K., 2000, Smoke, Dust, and Haze Fundamentals of Aerosol Dynamics, (Oxford University
Press: NY) "Gas Turbine." Wikipedia. Wikimedia Foundation, 19 Oct. 2014. Web. 19 Oct. 2014. "How It Works." – Alicat Scientific. Web. 26 Jan. 2015. Janikowski, Daniel. "Optimizing Condenser Tube Selection - POWER Magazine." POWER Magazine.
Plymouth Tube Co., 1 Nov. 2011. Web. 23 Oct. 2014. Moroianu, D., Karlsson, A., 2004, “LES of the Flow and Particle Ingestion into an Air Intake of a Jet
Engine Running on the Ground,” GT2004-53762 "NSE Differential Pressure Flowmeter / Whole Orifice." NSE Differential Pressure Flowmeter / Whole
Orifice. Web. 17 Nov. 2014. "Orifice Plate Flowmeters." First for Steam Solutions. Spirax Sarco, n.d. Web. 12 Nov. 2014.
<http://www2.spiraxsarco.com/pdfs/SB/s66_11.pdf>. "Rocketry Basics." Rocketry Basics. Jacobs' Rocketry, n.d. Web. 30 Oct. 2014.
44

Schneider, O., H.J., Benra, F.-K., Dohmen, H. J., and Jarzombek, K., 2005, “A Contribution to the Abrasive Effect of Particles in a Gas Turbine Pre-Swirl Cooling Air System,” GT2005-68188
Schramm, U., “How Topology Optimization Changed the Design Process”. In: C.A. Mota Soares et. al.,
eds., Proceedings of the 3rd European Conference on Computational Mechanics, Lisbon, POR, 2006.
"Solar Turbines: About Solar › Gas Turbine Overview." Solar Turbines: About Solar › Gas Turbine
Overview. Web. 19 Oct. 2014. Stanson, Steve.”Multistage Centrifugal Blowers.” Multistage Centrifugal Blower -.HSI, 5 July 2014.
Web. 08 Feb. 2015. Taylor, R.M., Thomas, J.E., Mackaron, N.G., Riley, S., and Lajczok, M.R., “Detail Part Optimization on
the F-35 Joint Strike Fighter”, AIAA-2006-1886, Proceedings of the 47th AIAA Structures, Structural Dynamics, and Materials Conference, Newport, RI, 2006
Wilcox, Melissa, Richard Baldwin, Augusto Garcia-Hernandez, and Klaus Brun. "GUIDELINE FOR
GAS TURBINE INLET AIR FILTRATION SYSTEMS.". Southwest Research Institute, Apr. 2010. Web. 20 Oct. 2014.
45
Appendix 1
QFD: House of QualityProject: Turbine Blade Flow Bench
Revision: 1
Date: 20 October 2014
HO
W:
Engin
eeri
ng
Spec
ific
atio
ns
WHAT: Customer
Requirements (explicit
& implicit)
1 |||| 8% 10 10 10 9 5 4 4 4 4 1
2 |||| 8% 10 10 10 9 5 1 1 1 1 2
3 || 5% 7 7 5 9 2 1 1 1 1 3
4 |||| 8% 10 10 10 9 5 1 1 1 1 4
5 ||| 7% 7 7 10 9 5 5 5 3 3 5
6 ||| 7% 8 8 10 9 5 5 5 4 3 6
7 ||| 7% 9 9 9 9 5 5 5 5 5 7
8 || 5% 5 5 7 9 5 3 5 4 3 9
9 ||| 8% 10 10 8 9 5 2 5 1 1 11
10 | 4% 4 4 5 9 5 3 3 3 3 12
11 | 3% 2 4 5 9 5 3 3 3 3
12 |||| 8% 10 10 10 9 5 5 5 4 4 13
13 |||| 8% 10 10 10 9 5 5 5 4 4
14 ||| 7% 8 8 8 9 5 3 3 3 1 14
15 1% 1 1 1 9 5 5 5 5 2 15
16 || 6% 5 8 8 9 5 5 5 5 5
1-1
Template Revision: 0.9 Date: 4/23/2010
Christopher Battles
Curr
ent
Pro
duct
Ass
esm
ent
- E
ngin
eeri
ng S
pec
ific
atio
ns
NOW: Current Product Assesment - Customer Requirements
M
axim
um
Rel
atio
nsh
ip
32
10
Flow Systems Inc: Medium Flow test bench
Flow Systems Inc: Mini Flow Bench
Super Flow: SF-1020SB
Flow Bench Manufacturing Australia: FME600P
54
5
5
5
5
Our Product
5 1 2 1 1 3
3
3 1 1 1 1 3 1 3 1
1 5 3 5 1 1
5
5 3
3 1 4 2 1 3 5 3
3 1 5 5 5 1
5 5 5 5
3 5 1 5 1 5
5 5 5 5 5 5
1 5 35 3 1 5 5
5
R
ow
#
3
1 2 3 4
O
ur
Cu
rren
t P
roduct
Flo
w S
yst
ems
Inc:
M
ediu
m F
low
tes
t ben
ch
Flo
w S
yst
ems
Inc:
Min
i F
low
Ben
ch
Su
per
Flo
w:
SF
-10
20S
B
Flo
w B
ench
Man
ufa
cturi
ng A
ust
rali
a: F
ME
600P
0
9 99 9 9
|||||
|| |||||
|
6%
Correlations
Strong +Weak −
No Correlation
Direction of Improvement
Relationships
Strong ●Moderate ○
Weak ▽
▲
◇
▼
Maximize
Target
Minimize
9 9 99 9 9 9 9 9
4 5 6 7 8 9 10
Technical Importance Rating
HOW MUCH: Target
Max Relationship 9 9
14 15 16Column #
Weight Chart
Relative Weight
5 2 5 5
8 9 10 11 12 13
|| || |||
1 2 3 4 5 6 7
|| |
3 5 5 5 1 5 5
5
5% 7%
|| ||||
|||
|||||
| || |||
5% 2% 10% 5% 10% 4%4% 9% 7% 10% 4% 6% 7%
At
leas
t 4
wh
eels
Exit
is
no
mo
re t
han
6"
fro
m
gro
un
d
89.814 182.68 139.71 210.82 74.153 121.83 147.14
6'x
6'x
6'
No
lo
ud
er t
han
90
dB
Sw
itch
tak
es l
ess
than
30
sec
± 0
.00
5 i
n^2
± 2
.5-5
%
12
0 V
AC
115.67 97.007 151.31215.74 100.18 213.26 73.10894.12 51.816
14 15 16
▼ ◇
○
●
●
≤1
0 f
t^3
Column # W
ith
in 3
0-6
0 s
eco
ns
Edge
rou
nd
s o
f 0
.1 i
n m
inim
um
Air
pre
ssu
re u
p t
o 1
00
psi
DA
Q p
rog
ram
1.4
1-4
bla
des
Par
ticu
alte
s fr
om
5 m
icro
ns
1
▼
2 3
○ ○
○
●
Reliable
Data collection
Power source
So
lar
Tu
rbin
es (
sponso
r)
R
elat
ive
Wei
gh
t
R
ow
#
W
eig
ht
Ch
art
Direction of Improvement
Ken
net
h T
ho
mas
(m
anag
emen
t/in
term
edia
te u
sers
)
Dev
elo
pm
ent
lab
tec
hs
(use
rs)
WHO: Customers
○ ● ○ ○
●
●
●
●
●
○▽ ▽
▽ ▽
● ○○
● ▽
▽ ○ ○
○○ ○ ○ ○
○ ○○
● ▽ ○
▽ ▽ ●
○ ○●
○
●
▽ ● ○
▽ ● ○○
▽
● ○
▽
○
●
Exhaust filtered at floor level
Shop Safety
Fits Stage 1 blade
Compatible with multiple blades
Two independent flow measurements
Quick/fast-few minutes
Easy to use
Fit
s w
ithin
footp
rint
Mee
ts O
SH
A n
ois
e re
q.
stan
dar
ds
Co
mp
lete
s m
easu
rem
ent
quic
kly
No
sh
arp
edges
or
pin
ch p
oin
ts
Cap
able
of
usi
ng s
hop a
ir
Co
nti
nu
ous
dat
a co
llec
tion
CV
to
atm
pre
ssure
rat
io
Acc
om
od
ates
Sta
ge
1 b
lades
bas
ed o
n m
anufa
cturi
ng s
pec
s w
ith p
ote
nti
al t
o a
dap
t to
oth
er b
lades
Fil
ters
par
ticu
late
s fr
om
exhau
st
●
○Frequent-daily use
Minimal size
Portable, low weight
Mea
sure
s ef
fect
ive
area
bas
ed o
n f
low
rat
es a
nd p
ress
ure
s
Res
ult
s d
o n
ot
chan
ge
bet
wee
n o
per
ators
Wal
l p
ow
er a
nd b
atte
ry b
ackup
−
+ +
−
11 12
−
−
+
−
Fix
ture
all
ow
s sw
itch
ing b
etw
een l
eadin
g a
nd t
rail
ing e
dge
pas
sages
+
− − −
+
− −
+ −
−+++
−
+
+ −
−
−
+
+
+
+
+ +
+
+ − −
Wh
eels
or
roll
ers
Ex
hau
st p
ipe
open
s to
atm
at
floor
level
+
−
+
+
En
clo
sed c
ontr
ol
volu
me
13
+
+
Noise ○
Reproducable/repeatable ▽ ○ ●
○Air flow ● ● ▽
Our Product
Competitor #1
Competitor #2
Competitor #3
Competitor #4
Our Product
Competitor #1
Competitor #2
Competitor #3
Competitor #4
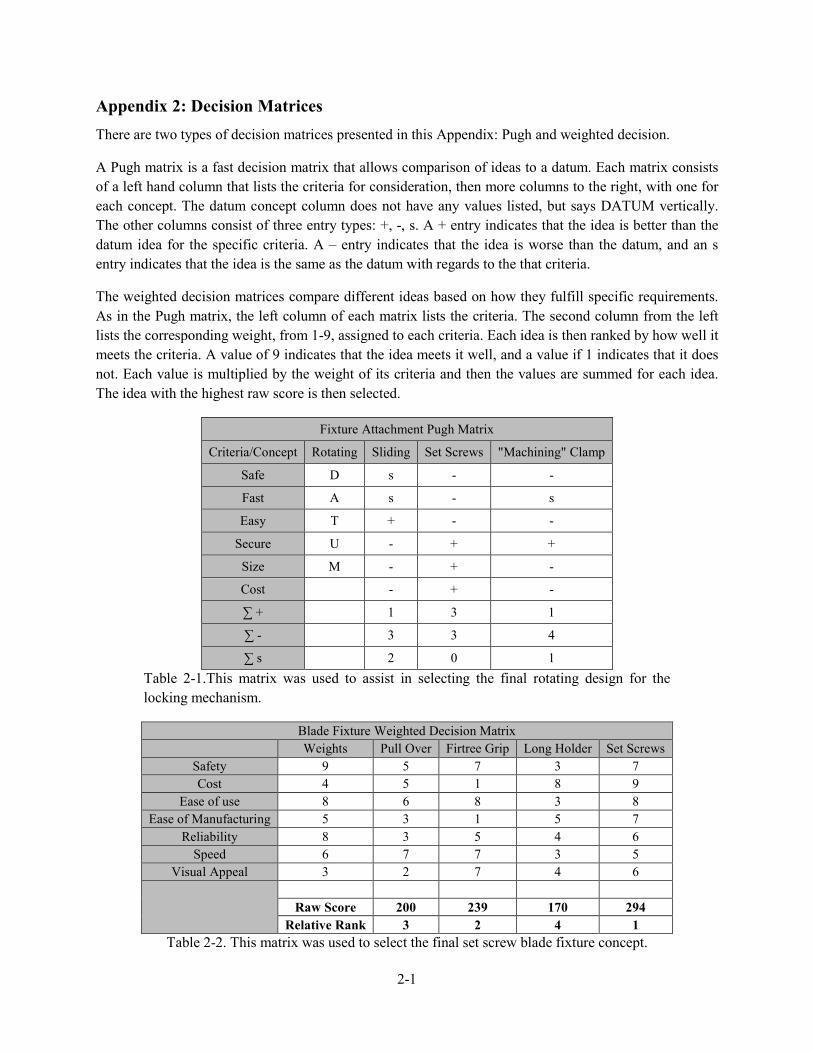
Appendix 2: Decision Matrices There are two types of decision matrices presented in this Appendix: Pugh and weighted decision.
A Pugh matrix is a fast decision matrix that allows comparison of ideas to a datum. Each matrix consists of a left hand column that lists the criteria for consideration, then more columns to the right, with one for each concept. The datum concept column does not have any values listed, but says DATUM vertically. The other columns consist of three entry types: +, -, s. A + entry indicates that the idea is better than the datum idea for the specific criteria. A – entry indicates that the idea is worse than the datum, and an s entry indicates that the idea is the same as the datum with regards to the that criteria.
The weighted decision matrices compare different ideas based on how they fulfill specific requirements. As in the Pugh matrix, the left column of each matrix lists the criteria. The second column from the left lists the corresponding weight, from 1-9, assigned to each criteria. Each idea is then ranked by how well it meets the criteria. A value of 9 indicates that the idea meets it well, and a value if 1 indicates that it does not. Each value is multiplied by the weight of its criteria and then the values are summed for each idea. The idea with the highest raw score is then selected.
Fixture Attachment Pugh Matrix
Criteria/Concept Rotating Sliding Set Screws "Machining" Clamp
Safe D s - -
Fast A s - s
Easy T + - -
Secure U - + +
Size M - + -
Cost - + -
∑ + 1 3 1
∑ - 3 3 4
∑ s 2 0 1 Table 2-1.This matrix was used to assist in selecting the final rotating design for the locking mechanism.
Blade Fixture Weighted Decision Matrix
Weights Pull Over Firtree Grip Long Holder Set Screws Safety 9 5 7 3 7 Cost 4 5 1 8 9
Ease of use 8 6 8 3 8 Ease of Manufacturing 5 3 1 5 7
Reliability 8 3 5 4 6 Speed 6 7 7 3 5
Visual Appeal 3 2 7 4 6
Raw Score 200 239 170 294 Relative Rank 3 2 4 1
Table 2-2. This matrix was used to select the final set screw blade fixture concept.
2-1

Air Movement Pugh Matrix Criteria/Concept Compressor Pump Shop Air Blower
Safety s D - s Cost s + s Operating Expense s A + s Portability s - + Ease of Use s T - s Reliability + - + Size - U + + Quick + + + Simple s M - s Repeatability + - +
∑ + 3 4 5 ∑ - 1 6 0 ∑ s 6 0 5
Table 2-3. This matrix was used to assist in selecting a blower to move air through the system.
Pressure Ratio Weighted Decision Matrix Weight Sonic Nozzle Orifice place Safety 9 3 7 Cost 4 1 8 Ease of Use 8 6 4 Ease of Manufacturing 5 2 8 Maintenance 6 6 9 Reliability 8 9 5 Time Required to achieve desired ratio 7 5 5 Required Air Flow 9 1 7
Raw Score 241 359 Relative Ranking 2 1
Table 2-4. This matrix was used to select an orifice plate to establish the pressure ratio.
Switch Passages Pugh Matrix Separate Airlines Solenoid Valve Hand Valve Blocking Safe D s s s Easy to use A s - s < 30 Seconds T s s s Airtight U s s - Convenient M + - - Cost Effective + + + # Components + + +
Ʃ + 3 2 2 Ʃ - 0 2 2 Ʃ s 4 3 3
Table 2-5. This matrix was used to select a Solenoid valve to switch between flow passages.
2-2

DAQ System Pugh Matrix Stored on Removable Drive None Built in Computer Plug in any Laptop Collect Data D - s s Easy A + s s Convenient T - + + Data Manipulation U - + + Network Sharing M - + + Mobility + s + Req. Power Source + - +
Ʃ + 3 3 5 Ʃ - 4 1 0 Ʃ s 0 3 2
Table 2-6. This matrix was used to compare options for a DAQ system.
Pressure Measurement Pugh Matrix Criteria/Concept Mass Flow Meter Anemometer Pitot Tube Fan Manometer Bourdon Gauge Accuracy D s s - s - Data Acquisition A s s s s - Reliability T + + s + + Calibration U + + - - - Size M + + - + - Cost - + + - +
∑ + 3 4 1 2 2 ∑ - 1 0 3 2 4 ∑ s 2 2 2 2 0
Table 2-7. This matrix was used to compare pressure measurement options.
Temperature Measurement Pugh Matrix Criteria/Concept Electronic
Sensors Mercury Thermometer Thermocouple Thermistor
Accuracy s D + + Data Aquisition s A + + Reliability s T - + Calibration + U s s Size + M + + Cost + - -
∑ + 3 3 4 ∑ - 0 2 1 ∑ s 3 1 1
Table 2-8. This table was used to consider different methods of measuring temperature.
2-3
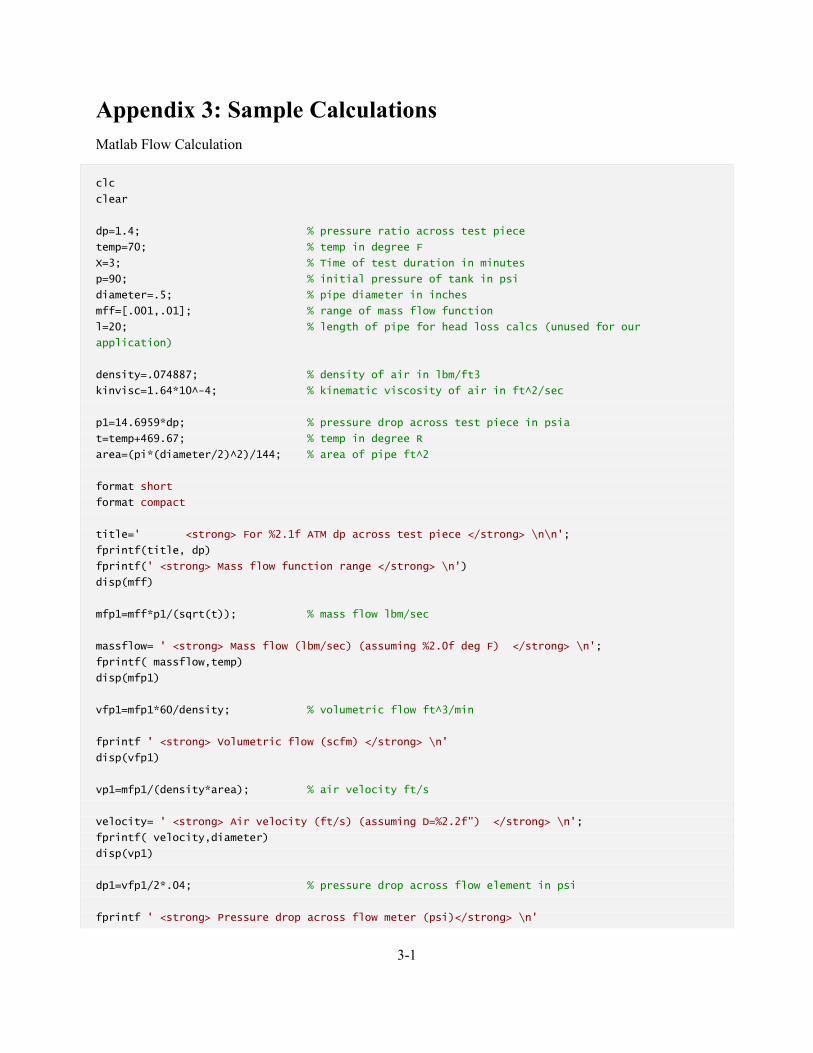
Appendix 3: Sample Calculations Matlab Flow Calculation
clc
clear
dp=1.4; % pressure ratio across test piece
temp=70; % temp in degree F
X=3; % Time of test duration in minutes
p=90; % initial pressure of tank in psi
diameter=.5; % pipe diameter in inches
mff=[.001,.01]; % range of mass flow function
l=20; % length of pipe for head loss calcs (unused for our
application)
density=.074887; % density of air in lbm/ft3
kinvisc=1.64*10^-4; % kinematic viscosity of air in ft^2/sec
p1=14.6959*dp; % pressure drop across test piece in psia
t=temp+469.67; % temp in degree R
area=(pi*(diameter/2)^2)/144; % area of pipe ft^2
format short
format compact
title=' <strong> For %2.1f ATM dp across test piece </strong> \n\n';
fprintf(title, dp)
fprintf(' <strong> Mass flow function range </strong> \n')
disp(mff)
mfp1=mff*p1/(sqrt(t)); % mass flow lbm/sec
massflow= ' <strong> Mass flow (lbm/sec) (assuming %2.0f deg F) </strong> \n';
fprintf( massflow,temp)
disp(mfp1)
vfp1=mfp1*60/density; % volumetric flow ft^3/min
fprintf ' <strong> Volumetric flow (scfm) </strong> \n'
disp(vfp1)
vp1=mfp1/(density*area); % air velocity ft/s
velocity= ' <strong> Air velocity (ft/s) (assuming D=%2.2f") </strong> \n';
fprintf( velocity,diameter)
disp(vp1)
dp1=vfp1/2*.04; % pressure drop across flow element in psi
fprintf ' <strong> Pressure drop across flow meter (psi)</strong> \n'
3-1

disp(dp1)
re=(vp1*diameter/12)/kinvisc; % reynolds # (laminar)
fd=64./re; % darcy friction factor approximation
loss=fd*((l/12)/(diameter/12))*(density*vp1(2)^2)/2; % head loss in psi
% fprintf ' <strong> Head loss through pipe (psi)</strong> \n'
% disp(loss)
pin1=p1+dp1; % required air pressure into flow element in psi
fprintf ' <strong> Input pressure required (psi)</strong> \n'
disp(pin1)
Pi=max(pin1);
Mtot=mfp1(2)*X*60; % total mass for x min test lbm
vol=Mtot*53.34*t*(1/p)*((1/12)^2); % vol for Mtot ft^3
M25=Pi*vol*12^2/(53.34*t); % unused mass at required input psi for tank of
calculated volume
volf=(Mtot+M25)*53.34*t*(1/p)*((1/12)^2); % final volume of tank required ft^3
gal=volf*7.48; % vol in gal
volume=[volf, gal];
formatSpec = ' <strong> Tank volume required for %2.1f min test with %3.0f psi in tank
(ft^3)/(gal) </strong> \n';
fprintf( formatSpec,X,p)
disp(volume)
<strong> For 1.4 ATM dp across test piece </strong>
<strong> Mass flow function range </strong>
0.0010 0.0100
<strong> Mass flow (lbm/sec) (assuming 70 deg F) </strong>
0.0009 0.0089
<strong> Volumetric flow (scfm) </strong>
0.7096 7.0959
<strong> Air velocity (ft/s) (assuming D=0.50") </strong>
8.6733 86.7334
<strong> Pressure drop across flow meter (psi)</strong>
0.0142 0.1419
<strong> Input pressure required (psi)</strong>
20.5885 20.7162
<strong> Tank volume required for 3.0 min test with 90 psi in tank (ft^3)/(gal) </strong>
4.3559 32.5821
Published with MATLAB® R2014a
3-2
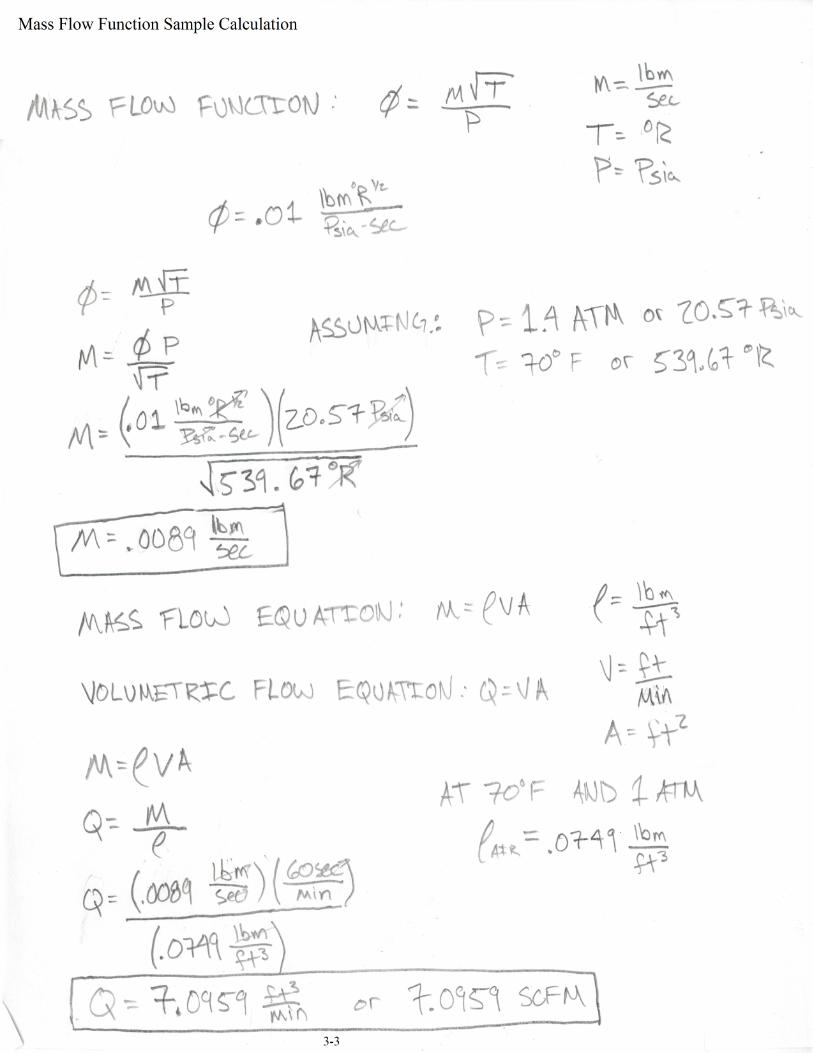

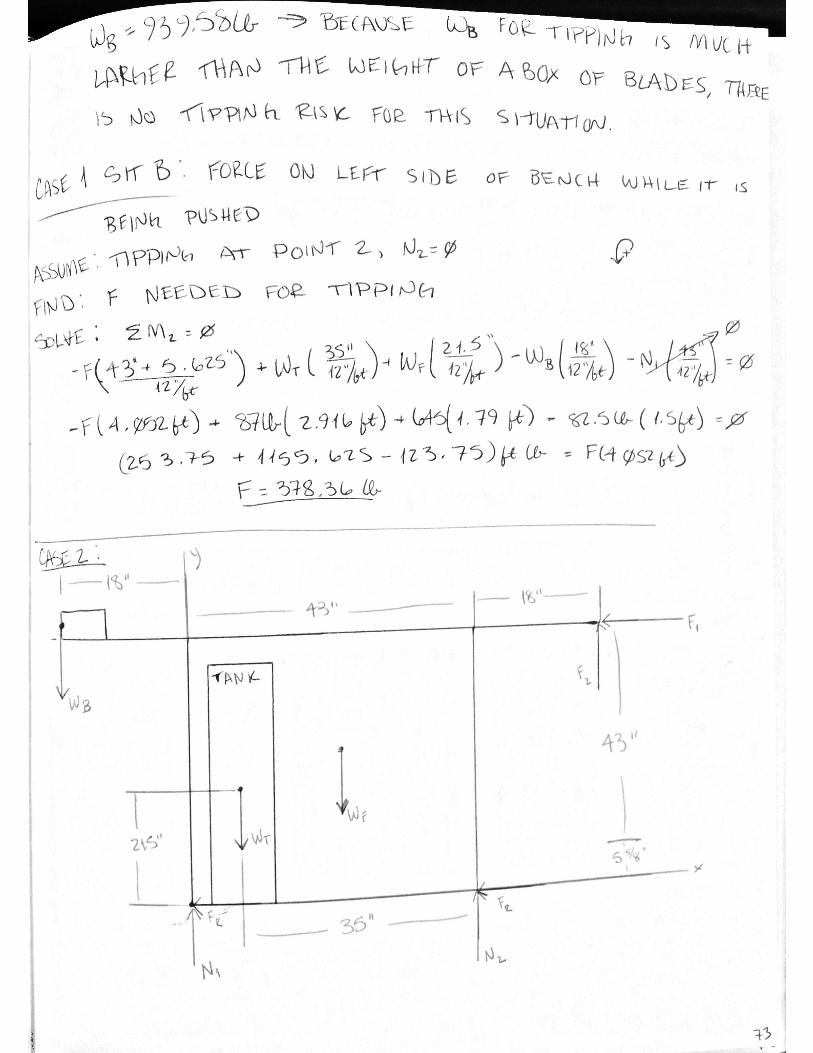
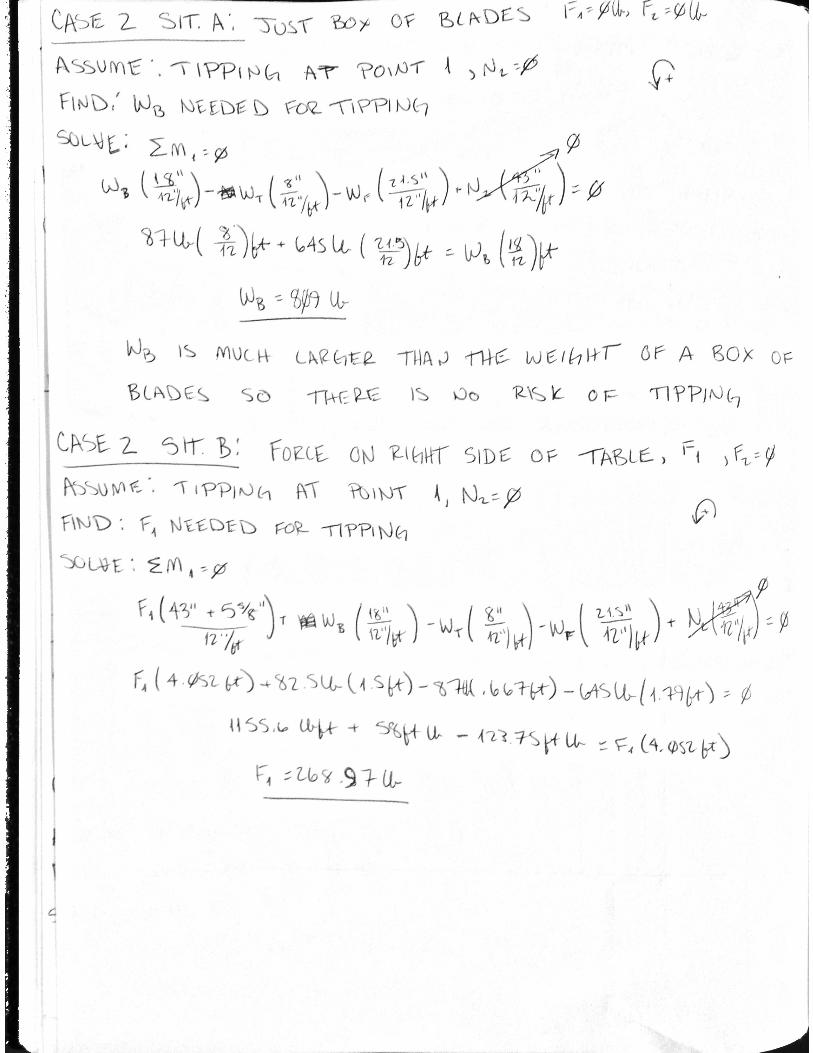


Appendix 4: Hazard Checklist Hazard Checklist
• Will any part of the design create hazardous revolving, reciprocating, running, shearing, punching, pressing, squeezing, drawing, cutting, rolling, mixing or similar action, including pinch points and shear points?
• No • Can any part of the design undergo high accelerations?
• No • Will the system have any large moving masses or large forces?
• No • Will the system produce a projectile?
• Potentially. Particles could fly out of cooling passages as air flows through. An enclosed control volume and exhaust system will prevent these from coming in contact with people.
• Could the system fall under gravity creating injury? • Yes. The system will be designed to be very stable and have a low center of gravity to
decrease the likelihood of tipping. • Will a user be exposed to overhanging weights in the design?
• No • Will the system have any sharp edges?
• No, edges will have a 0.015 in chamfer where necessary. • Will any part of the electrical systems not be grounded?
• No • Will there be any large batteries or electrical voltage in the system above 40 V either AC or DC?
• No • Will there be any stored energy in the system such as batteries, flywheels, hanging weights or
pressurized fluids? • There may be a battery.
• Will there be any explosive or flammable liquids, gases, or dust fuel as part of the system? • No
• Will the user of the design be required to exert any abnormal effort or physical posture during the use of the design?
• No • Will there be any materials known to be hazardous to humans involved in either the design or the
manufacturing of the design? • No
• Can the system generate high levels of noise? • Possibly depending on the selected blower. If it is over 90 dB there will be warning labels
and hearing protection will be required for use. • Will the device/system be exposed to extreme environmental conditions such as fog, humidity,
cold, high temperatures, etc? • No
• Is it possible for the system to be used in an unsafe manner? • It is possible if the user does not close the control volume then potentially dangerous
particles could escape from the system. • Will there be any other potential hazards not listed above?
• No
4-1

Description of Hazard Corrective Actions to Be Taken Planned Completion Date
Pinch points Warning labels 20 March 2015
Particles ejected from cooling passages Enclosed control volume and exhaust system 3 March 2015
Sharp edges 0.015 in edge chamfers 20 March 2015 Tipping of system Low center of gravity 15 March 2015 Rolling over feet Wheel covers 15 March 2015
Hair/clothing/objects sucked into blower
Filter, blower enclosed away from people 3 March 2015
Table 4-1. Concept Design Hazard Identification. This table was used to identify potential hazards and how to prevent them.
4-2
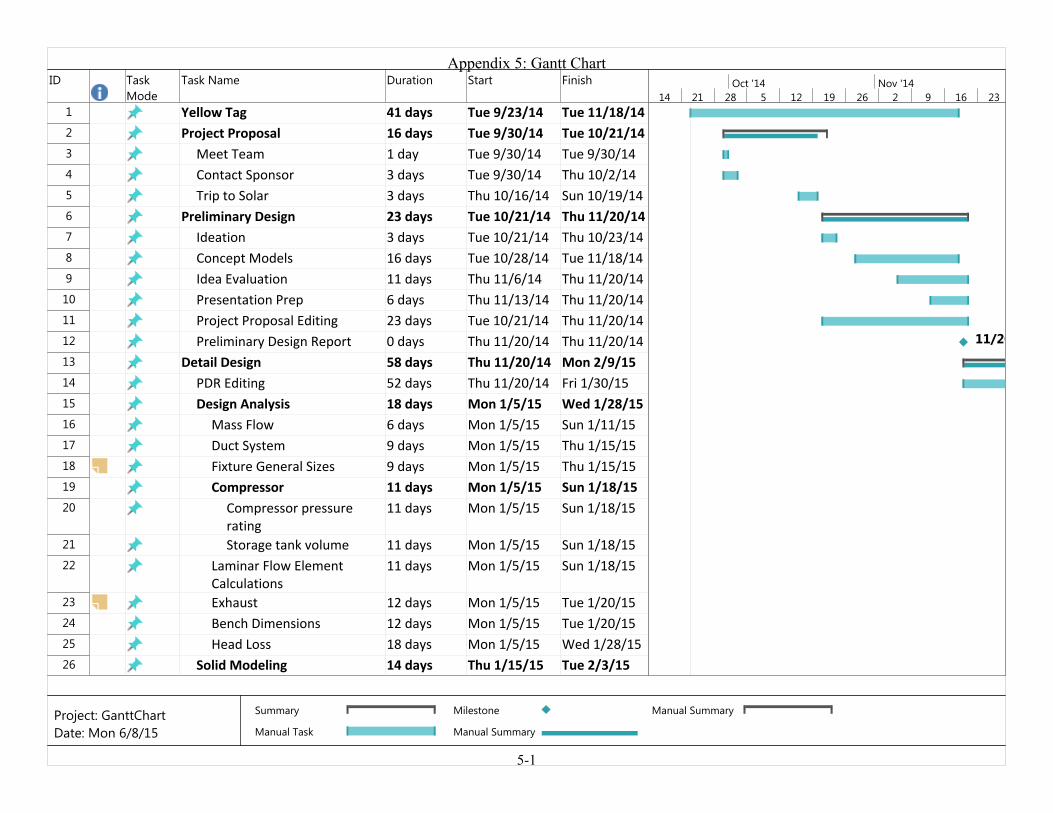
ID Task Mode
Task Name Duration Start Finish
1 Yellow Tag 41 days Tue 9/23/14 Tue 11/18/142 Project Proposal 16 days Tue 9/30/14 Tue 10/21/143 Meet Team 1 day Tue 9/30/14 Tue 9/30/144 Contact Sponsor 3 days Tue 9/30/14 Thu 10/2/145 Trip to Solar 3 days Thu 10/16/14 Sun 10/19/146 Preliminary Design 23 days Tue 10/21/14 Thu 11/20/147 Ideation 3 days Tue 10/21/14 Thu 10/23/148 Concept Models 16 days Tue 10/28/14 Tue 11/18/149 Idea Evaluation 11 days Thu 11/6/14 Thu 11/20/1410 Presentation Prep 6 days Thu 11/13/14 Thu 11/20/1411 Project Proposal Editing 23 days Tue 10/21/14 Thu 11/20/1412 Preliminary Design Report 0 days Thu 11/20/14 Thu 11/20/1413 Detail Design 58 days Thu 11/20/14 Mon 2/9/1514 PDR Editing 52 days Thu 11/20/14 Fri 1/30/1515 Design Analysis 18 days Mon 1/5/15 Wed 1/28/1516 Mass Flow 6 days Mon 1/5/15 Sun 1/11/1517 Duct System 9 days Mon 1/5/15 Thu 1/15/1518 Fixture General Sizes 9 days Mon 1/5/15 Thu 1/15/1519 Compressor 11 days Mon 1/5/15 Sun 1/18/1520 Compressor pressure
rating11 days Mon 1/5/15 Sun 1/18/15
21 Storage tank volume 11 days Mon 1/5/15 Sun 1/18/1522 Laminar Flow Element
Calculations11 days Mon 1/5/15 Sun 1/18/15
23 Exhaust 12 days Mon 1/5/15 Tue 1/20/1524 Bench Dimensions 12 days Mon 1/5/15 Tue 1/20/1525 Head Loss 18 days Mon 1/5/15 Wed 1/28/1526 Solid Modeling 14 days Thu 1/15/15 Tue 2/3/15
11/20
14 21 28 5 12 19 26 2 9 16 23Oct '14 Nov '14
Summary
Manual Task
Milestone
Manual Summary
Manual Summary
Appendix 5: Gantt Chart
5-1
Project: GanttChartDate: Mon 6/8/15

ID Task Mode
Task Name Duration Start Finish
27 Control Volume 8 days Tue 1/6/15 Thu 1/15/1528 Final Fixture Design 10 days Tue 1/6/15 Sat 1/17/1529 Laminar Flow Element Exit
Funnel2 days Thu 1/29/15 Fri 1/30/15
30 Laminar Flow Element Location
2 days Thu 1/29/15 Fri 1/30/15
31 System Assembly 19 days Tue 1/6/15 Fri 1/30/1532 Part Selection 22 days Sun 1/11/15 Mon 2/9/1533 Laminar Flow Element
Selection5 days Sun 1/11/15 Thu 1/15/15
34 Tank Selection 7 days Sun 1/11/15 Sun 1/18/1535 Bench Selection 8 days Sun 1/11/15 Tue 1/20/1536 Measurement Devices 4 days Tue 1/27/15 Fri 1/30/1537 Readout Devices 4 days Thu 1/22/15 Tue 1/27/1538 Minor Component Selection 12 days Thu 1/15/15 Fri 1/30/15
39 Presentation Prep 11 days Thu 1/22/15 Thu 2/5/1540 Class CDR Presentation 0 days Thu 2/5/15 Thu 2/5/1541 Final Design Report 0 days Mon 2/9/15 Mon 2/9/1542 Sponsor CDR Presentation 0 days Mon 2/9/15 Mon 2/9/1543 Control and Data Acquisition
System49 days Wed 2/11/15 Mon 4/20/15
44 Control Flow Design 17 days Wed 2/11/15 Thu 3/5/1545 Flow Implementation 33 days Thu 3/5/15 Mon 4/20/1546 Build 68 days Wed 2/11/15 Fri 5/15/1547 Order Parts 34 days Wed 2/11/15 Mon 3/30/1548 End Quarter Memo 30 days Wed 2/11/15 Tue 3/24/1549 Construction 35 days Mon 3/30/15 Fri 5/15/1550 Test Period 30 days Mon 4/20/15 Fri 5/29/15
14 21 28 5 12 19 26 2 9 16 23Oct '14 Nov '14
Summary
Manual Task
Milestone
Manual Summary
Manual Summary
Appendix 5: Gantt Chart
5-2
Project: GanttChartDate: Mon 6/8/15

ID Task Mode
Task Name Duration Start Finish
51 Tank 4 days Mon 4/20/15 Thu 4/23/1552 Laminar Flow Element 6 days Mon 4/20/15 Sun 4/26/1553 Measurement devices 7 days Mon 4/20/15 Tue 4/28/1554 Leakage 11 days Fri 5/15/15 Fri 5/29/1555 Varying air intake properties 12 days Mon 4/20/15 Tue 5/5/1556 Valve Size/Duct System 12 days Mon 4/20/15 Tue 5/5/1557 Blade reading comparison 16 days Mon 4/20/15 Mon 5/11/1558 Calibration 16 days Mon 4/20/15 Mon 5/11/1559 Safety 16 days Mon 4/20/15 Mon 5/11/1560 Reliability 16 days Mon 4/20/15 Mon 5/11/1561 Control and Data Acquisition
System16 days Mon 4/20/15 Mon 5/11/15
62 Final Project Completion 45 days Mon 4/6/15 Fri 6/5/1563 Expo Prep 40 days Mon 4/6/15 Fri 5/29/1564 Display Poster 40 days Mon 4/6/15 Fri 5/29/1565 Expo 0 days Fri 5/29/15 Fri 5/29/1566 Final Project Report 0 days Fri 6/5/15 Fri 6/5/15
14 21 28 5 12 19 26 2 9 16 23Oct '14 Nov '14
Summary
Manual Task
Milestone
Manual Summary
Manual Summary
Appendix 5: Gantt Chart
5-3
Project: GanttChartDate: Mon 6/8/15
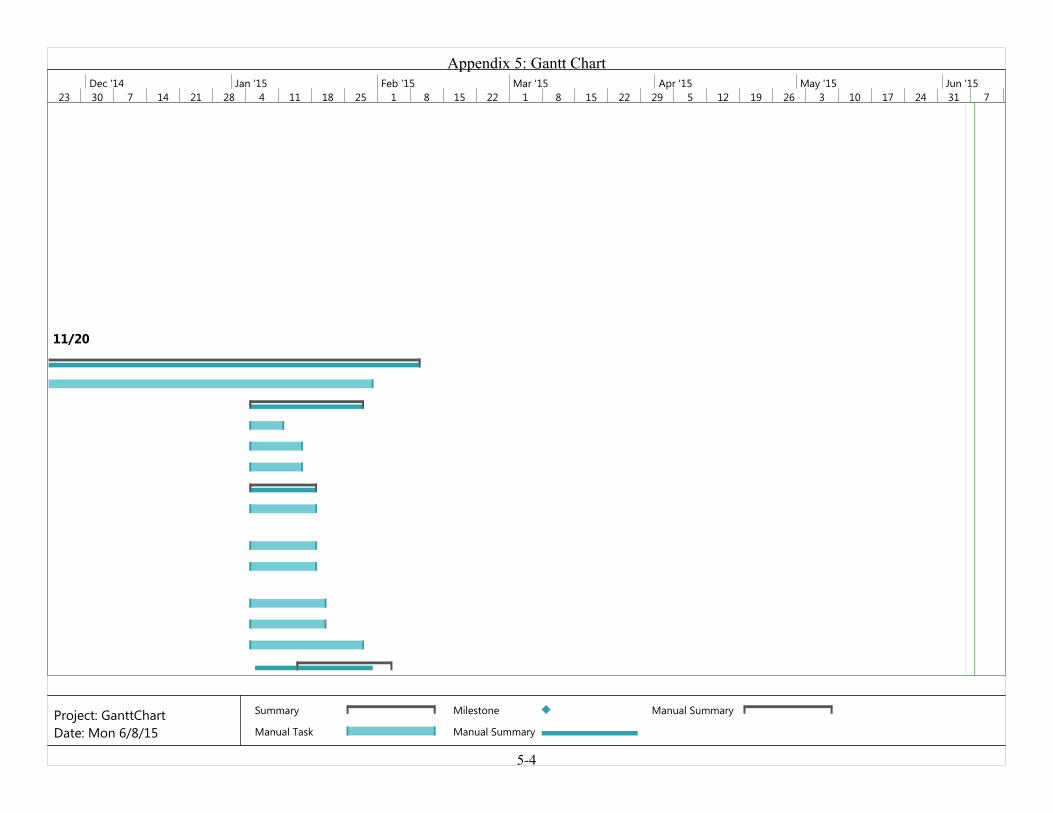
11/20
23 30 7 14 21 28 4 11 18 25 1 8 15 22 1 8 15 22 29 5 12 19 26 3 10 17 24 31 7Dec '14 Jan '15 Feb '15 Mar '15 Apr '15 May '15 Jun '15
Summary
Manual Task
Milestone
Manual Summary
Manual Summary
Appendix 5: Gantt Chart
5-4
Project: GanttChartDate: Mon 6/8/15
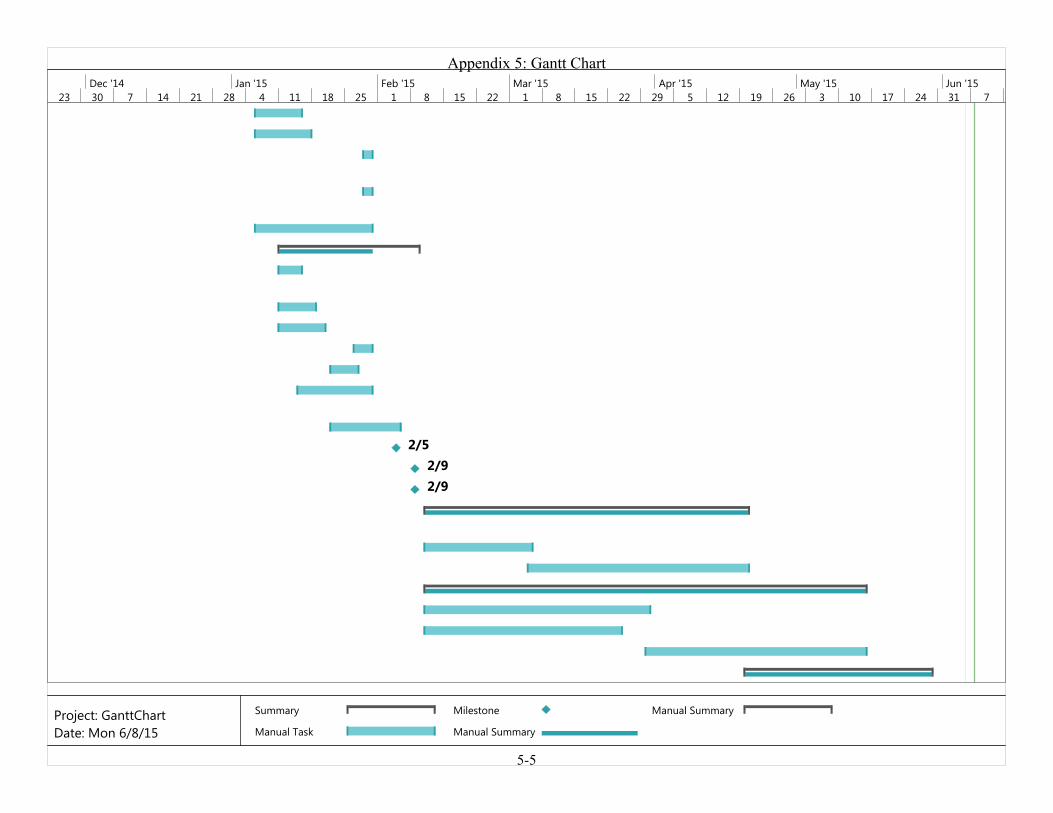
2/52/92/9
23 30 7 14 21 28 4 11 18 25 1 8 15 22 1 8 15 22 29 5 12 19 26 3 10 17 24 31 7Dec '14 Jan '15 Feb '15 Mar '15 Apr '15 May '15 Jun '15
Summary
Manual Task
Milestone
Manual Summary
Manual Summary
Appendix 5: Gantt Chart
5-5
Project: GanttChartDate: Mon 6/8/15

5/296/5
23 30 7 14 21 28 4 11 18 25 1 8 15 22 1 8 15 22 29 5 12 19 26 3 10 17 24 31 7Dec '14 Jan '15 Feb '15 Mar '15 Apr '15 May '15 Jun '15
Summary
Manual Task
Milestone
Manual Summary
Manual Summary
Appendix 5: Gantt Chart
5-6
Project: GanttChartDate: Mon 6/8/15

2.50
8.00
1.00
.75
A
A
.25
.75
.50
8 x R.07
.53
.50
.53
.23
.60
1.18
1.72
.73
.70
8 x .31 HEX .25
.90 13.00°
4.00
3.25
.38 .68
1.95
2.25
8 x .19 THRU ALL
.50
2.88
.90
.50 .60
.70 .70 .60 .15
.10
SECTION A-ASCALE 1 : 2
WEIGHT: 1.17 LB
01F - 001
ABS PLASTIC
2/4/15
2/5/15HUSTEDT
GCHURCH
TYPE 1 BLADE FIXTUREPROPRIETARY AND CONFIDENTIAL
THE INFORMATION CONTAINED IN THIS DRAWING IS THE SOLE PROPERTY OF CAL POLY SAN LUIS OBISPO. ANY REPRODUCTION IN PART OR AS A WHOLE WITHOUT THE WRITTEN PERMISSION OF CAL POLY SAN LUIS OBISPO IS PROHIBITED.
COMMENTS: TO BE 3D PRINTED
SHEET 1 OF 1
CHECKED
DATENAMEDIMENSIONS ARE IN INCHESTOLERANCES:ANGULAR: BEND 0.05TWO PLACE DECIMAL 0.05
DO NOT SCALE DRAWING
MATERIAL
REV.
ADWG. NO.SIZE
SCALE:1:2
DRAWN

1.25
15.00 A
A
5.00 4.00
8.00
3.50 6.25
8X .19 .50
.50
.30
.83
.63
2.19
2.67
2.50
7.50
.25 2.50
4.75
4.75 4.75
.50
4.00
8 x 1/4 0.5
.25
SECTION A-A
FIXTURE SETTING
01DO NOT SCALE DRAWING SHEET 1 OF 1
2/5/15
2/5/15HUSTEDT
GCHURCH
UNLESS OTHERWISE SPECIFIED:
SCALE: 1:4
REVDWG. NO.
ASIZE
TITLE:
NAME DATE
COMMENTS:
DRAWN
CHERRY HARDWOOD
MATERIAL
DIMENSIONS ARE IN INCHESTOLERANCES:ANGULAR: 0.5TWO PLACE DECIMAL 0.05
PROPRIETARY AND CONFIDENTIALTHE INFORMATION CONTAINED IN THISDRAWING IS THE SOLE PROPERTY OFCAL POLY SAN LUIS OBISPO. ANY REPRODUCTION IN PART OR AS A WHOLEWITHOUT THE WRITTEN PERMISSION OFCAL POLY SAN LUIS OBISPO IS PROHIBITED.
5 4 3 2 1
CHECKED
F-002

18.00
20.00 18.00
120.00°
9.00
90.00°
4.82
.25
CONTROL VOLUME
01DO NOT SCALE DRAWING SHEET 1 OF 1
2/5/15
2/5/15HUSTEDT
GCHURCH
UNLESS OTHERWISE SPECIFIED:
SCALE: 1:12
REVDWG. NO.
ASIZE
TITLE:
NAME DATE
COMMENTS:
DRAWN
1/4 IN ACRYLICMATERIAL
DIMENSIONS ARE IN INCHESTOLERANCES:ANGULAR: 0.05TWO PLACE DECIMAL 0.05
PROPRIETARY AND CONFIDENTIALTHE INFORMATION CONTAINED IN THISDRAWING IS THE SOLE PROPERTY OFCAL POLY SAN LUIS OBISPO. ANY REPRODUCTION IN PART OR AS A WHOLEWITHOUT THE WRITTEN PERMISSION OFCAL POLY SAN LUIS OBISPO IS PROHIBITED.
5 4 3 2 1
CHECKED
CV-001

60.00
43.00
58.82
41.82
14.00
28.00
4.00 3.00
3.00
4.00
21.50 21.50
90.00°
90.00°
43.59° 43.59°
A
B
NOTES:MAKE ALL WELDS AS PER STANDARD 1.PRACTICEADJUST CASTER SUPPORT DIMENSIONS A 2.AND B AS NECESSARY TO FIT SELECTED CASTER PLATES TABLE FRAME
01DO NOT SCALE DRAWING SHEET 1 OF 1
2/3/15
2/5/15HUSTEDT
GCHURCH
UNLESS OTHERWISE SPECIFIED:
SCALE: 1:20 WEIGHT:
REVDWG. NO.
ASIZE
TITLE:
NAME DATE
COMMENTS:
DRAWN
A513/A500 STEEL30 X 30 X 2.6 mmSQUARE BAR
MATERIAL
DIMENSIONS ARE IN INCHESTOLERANCES:ANGULAR: 0.5TWO PLACE DECIMAL 0.05
PROPRIETARY AND CONFIDENTIALTHE INFORMATION CONTAINED IN THISDRAWING IS THE SOLE PROPERTY OFCAL POLY SAN LUIS OBISPO. ANY REPRODUCTION IN PART OR AS A WHOLEWITHOUT THE WRITTEN PERMISSION OFCAL POLY SAN LUIS OBISPO IS PROHIBITED.
5 4 3 2 1
CHECKED
T-001

43.00
60.13
2x 4.00 THRU ALL 0.5 A M
2.50
2x 4.00 THRU ALL
6.00
5.20
16.75
1.75 1.75
4.00
2.50
16.75
15.20
A
19.07
1.25 2.50
NOTES:MAKE ALL WELDS AS PER STANDARD 1.PRACTICESTANDARD STEEL SHEET METAL GAUGE 15, 2.THICKNESS = 0.0673 INALL BEND RADII = 0.39 IN3.ADJUST OUTER DIMENSIONS AS NECESSARY 4.TO FIT TABLE FRAME, DRAWING T-001
WEIGHT: 162 LB
01T - 002
STANDARD SHEET STEEL, GAUGE 15
2/4/15
2/5/15HUSTEDT
GCHURCH
SHEET METAL FRAMEPROPRIETARY AND CONFIDENTIAL
THE INFORMATION CONTAINED IN THIS DRAWING IS THE SOLE PROPERTY OF CAL POLY SAN LUIS OBISPO. ANY REPRODUCTION IN PART OR AS A WHOLE WITHOUT THE WRITTEN PERMISSION OF CAL POLY SAN LUIS OBISPO IS PROHIBITED.
COMMENTS:
SHEET 1 OF 1
CHECKED
DATENAMEDIMENSIONS ARE IN INCHESTOLERANCES:ANGULAR: BEND 0.05TWO PLACE DECIMAL 0.05
DO NOT SCALE DRAWING
MATERIAL
REV.
ADWG. NO.SIZE
SCALE:1:24
DRAWN

1.18
28.00
16.82
18.00
29.18
14.00
7.82
NOTES:MAKE ALL WELDS AS PER 1.STANDARD PRACTICE
WEIGHT: 15 LB
01T - 003
GCHURCH 2/4/15
2/5/15HUSTEDT SIDE EXTENSION FRAMEPROPRIETARY AND CONFIDENTIAL
THE INFORMATION CONTAINED IN THIS DRAWING IS THE SOLE PROPERTY OF CAL POLY SAN LUIS OBISPO. ANY REPRODUCTION IN PART OR AS A WHOLE WITHOUT THE WRITTEN PERMISSION OF CAL POLY SAN LUIS OBISPO IS PROHIBITED.
COMMENTS:
SHEET 1 OF 1
CHECKED
DRAWN
DATENAMEDIMENSIONS ARE IN INCHESTOLERANCES:TWO PLACE DECIMAL 0.05
DO NOT SCALE DRAWING
MATERIAL
REV.
ADWG. NO.SIZE
SCALE:1:12
A513/A500 STEEL30 X 30 X 2.6 mm
SQUARE BAR

18.07
1.25
29.38
NOTES:MAKE ALL WELDS AS PER STANDARD 1.PRACTICESTANDARD STEEL SHEET METAL GAUGE 15, 2.THICKNESS = 0.0673 INALL BEND RADII = 0.39 IN3.ADJUST OUTER DIMENSIONS AS NECESSARY 4.TO FIT TABLE FRAME, DRAWING T-003
SIDE EXTENSION SHEET COVER
01DO NOT SCALE DRAWING SHEET 1 OF 1
2/4/15
2/5/15HUSTEDT
GCHURCH
UNLESS OTHERWISE SPECIFIED:
SCALE: 1:8 WEIGHT: 11 LB
REVDWG. NO.
ASIZE
TITLE:
NAME DATE
COMMENTS:
DRAWN
STANDARD SHEET STEEL GAUGE 15
MATERIAL
DIMENSIONS ARE IN INCHESTOLERANCES:ANGULAR: 0.5TWO PLACE DECIMAL 0.05
PROPRIETARY AND CONFIDENTIALTHE INFORMATION CONTAINED IN THISDRAWING IS THE SOLE PROPERTY OFCAL POLY SAN LUIS OBISPO. ANY REPRODUCTION IN PART OR AS A WHOLEWITHOUT THE WRITTEN PERMISSION OFCAL POLY SAN LUIS OBISPO IS PROHIBITED.
5 4 3 2 1
CHECKED
T-004

1.00
.50
2 x 4.00
60.13
30.00
8X .27 THRU ALL .51 X 82°
5.50 8.00 10.50
16.75 19.25
4.75 4.75
1.00
2.00
4.75
12.00
4.00
2.50
2.00
8.50
10.13 16 x1/4 .5
NOTES:ALL FEATURES ARE 1.MIRRORED ACROSS CENTER VERTICAL PLANE OF TOP VIEW
TABLE TOP
01DO NOT SCALE DRAWING SHEET 1 OF 1
2/3/15
2/5/15HUSTEDT
GCHURCH
UNLESS OTHERWISE SPECIFIED:
SCALE: 1:16
REVDWG. NO.
ASIZE
TITLE:
NAME DATE
COMMENTS:
DRAWN
CHERRY HARDWOOD
MATERIAL
DIMENSIONS ARE IN INCHESTOLERANCES:ANGULAR: 0.5TWO PLACE DECIMAL 0.05
PROPRIETARY AND CONFIDENTIALTHE INFORMATION CONTAINED IN THISDRAWING IS THE SOLE PROPERTY OFCAL POLY SAN LUIS OBISPO. ANY REPRODUCTION IN PART OR AS A WHOLEWITHOUT THE WRITTEN PERMISSION OFCAL POLY SAN LUIS OBISPO IS PROHIBITED.
5 4 3 2 1
CHECKED
T-005
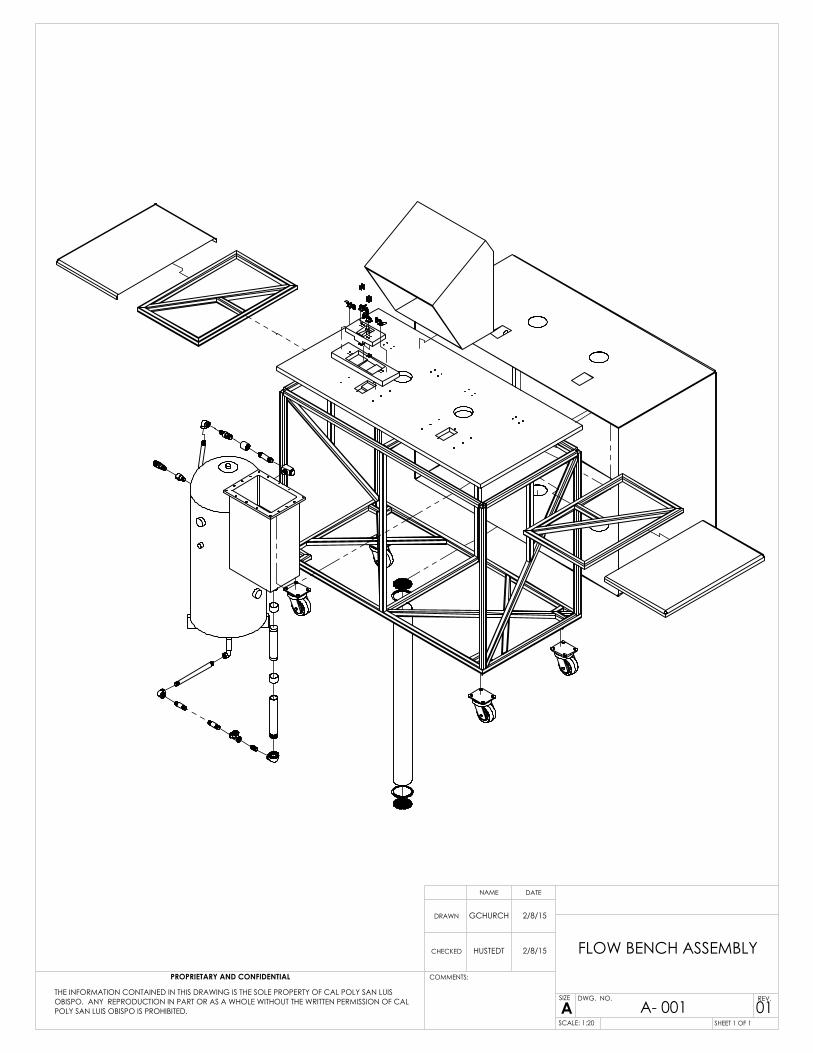
01A- 001
2/8/15
2/8/15HUSTEDT
GCHURCH
FLOW BENCH ASSEMBLYPROPRIETARY AND CONFIDENTIAL
THE INFORMATION CONTAINED IN THIS DRAWING IS THE SOLE PROPERTY OF CAL POLY SAN LUIS OBISPO. ANY REPRODUCTION IN PART OR AS A WHOLE WITHOUT THE WRITTEN PERMISSION OF CAL POLY SAN LUIS OBISPO IS PROHIBITED.
COMMENTS:
SHEET 1 OF 1
CHECKED
DATENAME
REV.
ADWG. NO.SIZE
SCALE: 1:20
DRAWN
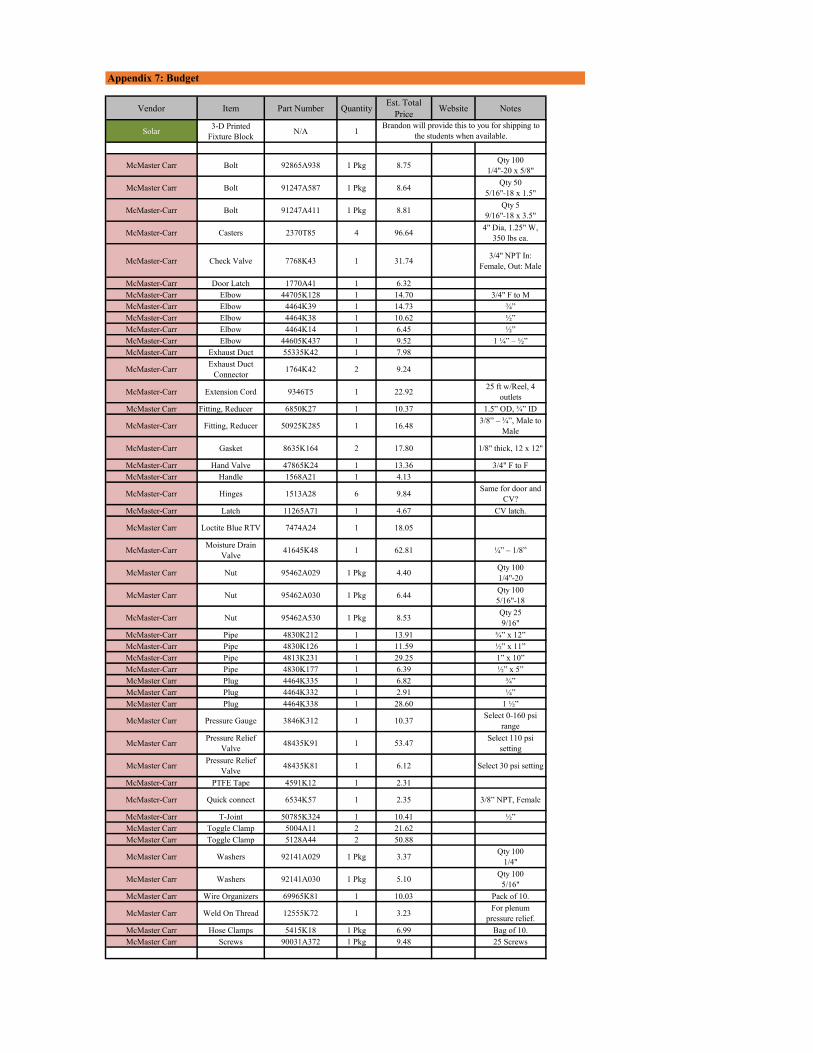
Appendix 7: Budget
Vendor Item Part Number Quantity Est. Total Price Website Notes
Solar 3-D Printed Fixture Block N/A 1
McMaster Carr Bolt 92865A938 1 Pkg 8.75 Qty 1001/4"-20 x 5/8"
McMaster Carr Bolt 91247A587 1 Pkg 8.64 Qty 505/16"-18 x 1.5"
McMaster-Carr Bolt 91247A411 1 Pkg 8.81 Qty 59/16"-18 x 3.5"
McMaster-Carr Casters 2370T85 4 96.64 4" Dia, 1.25" W, 350 lbs ea.
McMaster-Carr Check Valve 7768K43 1 31.74 3/4" NPT In: Female, Out: Male
McMaster-Carr Door Latch 1770A41 1 6.32McMaster-Carr Elbow 44705K128 1 14.70 3/4" F to MMcMaster-Carr Elbow 4464K39 1 14.73 ¾”McMaster-Carr Elbow 4464K38 1 10.62 ½”McMaster-Carr Elbow 4464K14 1 6.45 ½”McMaster-Carr Elbow 44605K437 1 9.52 1 ¼” – ½”McMaster-Carr Exhaust Duct 55335K42 1 7.98
McMaster-Carr Exhaust Duct Connector 1764K42 2 9.24
McMaster-Carr Extension Cord 9346T5 1 22.92 25 ft w/Reel, 4 outlets
McMaster Carr Fitting, Reducer 6850K27 1 10.37 1.5” OD, ¾” ID
McMaster-Carr Fitting, Reducer 50925K285 1 16.48 3/8” – ¾”, Male to Male
McMaster-Carr Gasket 8635K164 2 17.80 1/8" thick, 12 x 12"
McMaster-Carr Hand Valve 47865K24 1 13.36 3/4" F to FMcMaster-Carr Handle 1568A21 1 4.13
McMaster-Carr Hinges 1513A28 6 9.84 Same for door and CV?
McMaster-Carr Latch 11265A71 1 4.67 CV latch.
McMaster Carr Loctite Blue RTV 7474A24 1 18.05
McMaster-Carr Moisture Drain Valve 41645K48 1 62.81 ¼” – 1/8”
McMaster Carr Nut 95462A029 1 Pkg 4.40 Qty 1001/4"-20
McMaster Carr Nut 95462A030 1 Pkg 6.44 Qty 1005/16"-18
McMaster-Carr Nut 95462A530 1 Pkg 8.53 Qty 259/16"
McMaster-Carr Pipe 4830K212 1 13.91 ¾” x 12”McMaster-Carr Pipe 4830K126 1 11.59 ½” x 11” McMaster-Carr Pipe 4813K231 1 29.25 1” x 10”McMaster-Carr Pipe 4830K177 1 6.39 ½” x 5”McMaster Carr Plug 4464K335 1 6.82 ¾”McMaster Carr Plug 4464K332 1 2.91 ¼”McMaster Carr Plug 4464K338 1 28.60 1 ½”
McMaster Carr Pressure Gauge 3846K312 1 10.37 Select 0-160 psi range
McMaster Carr Pressure Relief Valve 48435K91 1 53.47 Select 110 psi
setting
McMaster Carr Pressure Relief Valve 48435K81 1 6.12 Select 30 psi setting
McMaster-Carr PTFE Tape 4591K12 1 2.31
McMaster-Carr Quick connect 6534K57 1 2.35 3/8” NPT, Female
McMaster-Carr T-Joint 50785K324 1 10.41 ½”McMaster Carr Toggle Clamp 5004A11 2 21.62McMaster Carr Toggle Clamp 5128A44 2 50.88
McMaster Carr Washers 92141A029 1 Pkg 3.37 Qty 1001/4"
McMaster Carr Washers 92141A030 1 Pkg 5.10 Qty 1005/16"
McMaster Carr Wire Organizers 69965K81 1 10.03 Pack of 10.
McMaster Carr Weld On Thread 12555K72 1 3.23 For plenum pressure relief.
McMaster Carr Hose Clamps 5415K18 1 Pkg 6.99 Bag of 10.McMaster Carr Screws 90031A372 1 Pkg 9.48 25 Screws
Brandon will provide this to you for shipping to the students when available.
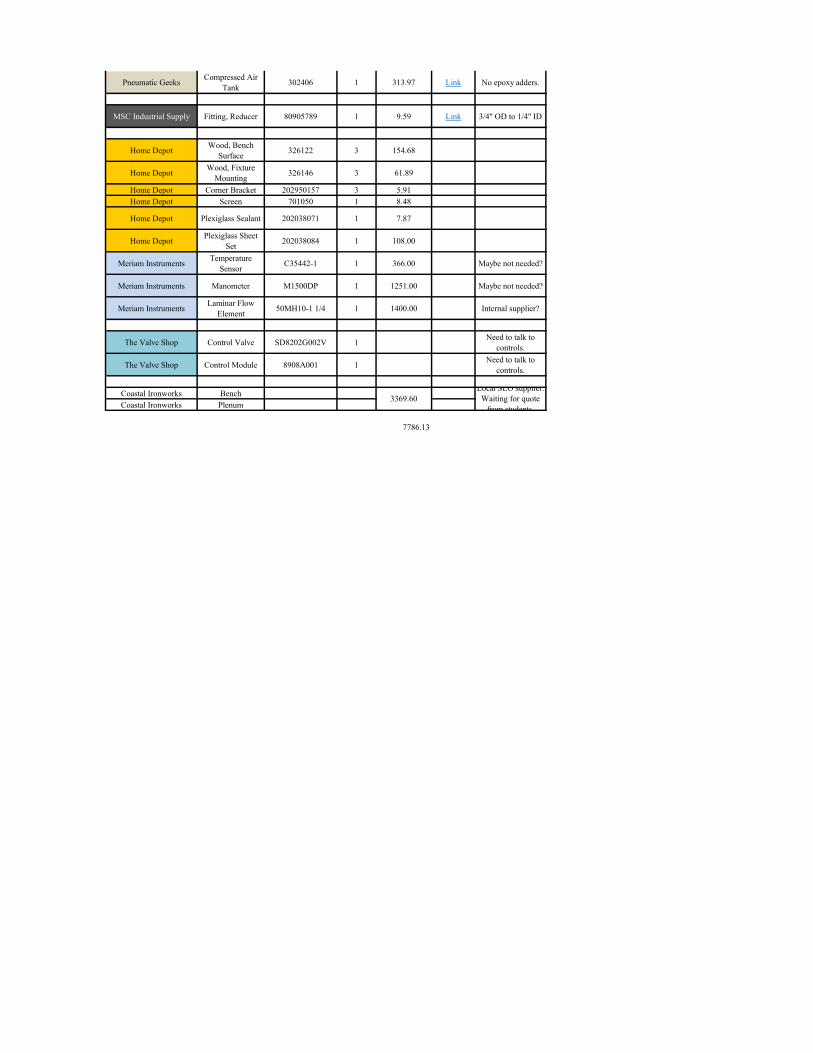
Pneumatic Geeks Compressed Air Tank 302406 1 313.97 Link No epoxy adders.
MSC Industrial Supply Fitting, Reducer 80905789 1 9.59 Link 3/4" OD to 1/4" ID
Home Depot Wood, Bench Surface 326122 3 154.68
Home Depot Wood, Fixture Mounting 326146 3 61.89
Home Depot Corner Bracket 202950157 3 5.91Home Depot Screen 701050 1 8.48
Home Depot Plexiglass Sealant 202038071 1 7.87
Home Depot Plexiglass Sheet Set 202038084 1 108.00
Meriam Instruments Temperature Sensor C35442-1 1 366.00 Maybe not needed?
Meriam Instruments Manometer M1500DP 1 1251.00 Maybe not needed?
Meriam Instruments Laminar Flow Element 50MH10-1 1/4 1 1400.00 Internal supplier?
The Valve Shop Control Valve SD8202G002V 1 Need to talk to controls.
The Valve Shop Control Module 8908A001 1 Need to talk to controls.
Coastal Ironworks BenchCoastal Ironworks Plenum
7786.13
3369.60Local SLO supplier.
Waiting for quote from students

Quantity T [6] Start date Finish dat Test Res [7] Quantity Pass Quantity Fail
1
Measuring time Tank pressure reqirements Minimum Value(Enough air to run testfor enough time togenerate accuratedata)
GwendolynChurch
DV 5 B 5/11/2015 5/28/2015 Canceled
2Minimize risk of injury Check pressure relief valves operate to
specificationpass/fail (Spec value) Tom Hurni PV 2 C 5/28/2015 5/28/2015 pass 5 0 Tank valve opens
consistenly, therewas not time to testthe plenum valve
3Minimize risk of injury All parts accessable to user must not
be sharp or have potential for seriousinjury
pass/fail Jacob Hustedt PV 5 C 5/28/2015 5/28/2015 pass - -
4
Produce requiredvolumetric flow rates
Run test on a variety of parts to ensuretarget range is aquired
pass/fail GwendolynChurch
PV 20 C 5/28/2015 5/28/2015 pass; 8.8psi
pressuredifference
established
5 0 Shortened to onlytest across providedblade
5
Continuous datacollection
Ensure measuring sample time iswithin exceptable range for accurateresults
Minimum Value(Enoughsamples/second togenerate accuratedata)
Tom Hurni DV 10 B 5/11/2015 5/28/2015 Canceled
6
Target pressure dropacross test piece
Run test on a variety of parts to ensuretarget range is aquired
pass/fail (target) GwendolynChurch
DV 10 B 5/28/2015 5/28/2015 pass; 8.8psi
pressuredifference
established
5 0 Shortened to onlytest across providedblade
7Accomodate turbineblade
Ensure proper seal of test part withoutdamage to part
Part seals with minimalleaking and withoutdamage to part
Tom Hurni PV 20 C 5/28/2015 5/28/2015 pass 20 0
8Noise requirements System does not exceed max dB limit pass/fail (target) Jacob Hustedt DV 10 B 5/11/2015 5/28/2015 Canceled
9Able to flow both bladepassages
Ensure fixture allows both bladepassages can be tested with minimaltime, difficulty, and inconsistancies
Minimum values(minimal time anddifficulty, fewinconsistancies)
GwendolynChurch
DV 5 B 5/28/2015 5/28/2015 pass 5 0
10Reliability run system continuously for extended
period of timeCycles Tom Hurni PV max C 5/11/2015 5/28/2015 Canceled
11
Reproducibility Data accurate to specified amountbetween tests and users
pass/fail (target) Jacob Hustedt PV 10 C 5/28/2015 5/28/2015 pass;consistently produces8.8 psipressuredifference
5 0 Based test onpressure differencebecause there is noDAQ system
12Contol and DataAcquisition system
Make sure data is taken and correct Cycles Tom Hurni PV 5 C 5/11/2015 5/28/2015 Canceled; DAQsystem not includeddue to timeconstraints
13
Laminar Flow Element Establishes correct pressure ratio Cycles GwendolynChurch
PV 5 C 5/28/2015 5/28/2015 pass;consistenlyproduces0.16 psipressuredrop
5 0
Flow Bench DVP&RReport Date: 6/3/15 Sponsor: Solar Turbines Advisor: Dr. Peter Schuster Flow Bench System
TEST PLAN TEST REPORTItemNo
Specification or ClauseReference [1] Test Description [2] Acceptance Criteria [3]
TestResponsibility
[4]Test Stage
[5]
SAMPLESTESTED
TIMING TEST RESULTSNOTES
1

14
Plumbing System
Ensure no leakes throughout plumbingsystem
Minimum value Tom Hurni PV 2 C 5/28/2015 5/28/2015 pass Any noticable leakswere sealed withsilicon sealant, therewas not time formore extensive leaktesting
15Fixture and setting
alignment Measure Printed fixtures to ensuretheyre within tolerance of setting
Pass/Fail Jacob Hustedt DV 5 B 5/28/2015 5/28/2015 pass 1 0
16Plenum construction Pressurize plenum to max test
pressure and check for leaksMinimum value Gwendolyn
ChurchPV 5 C 5/11/2015 5/28/2015 Canceled
17Tank Pressure Pressurize to 100 psi to ensure no
burstPass/Fail Tom Hurni PV 2 C 5/28/2015 5/28/2015 pass 5 0 Relief valve opens
at 115 psi
18 Stability Apply Force/Moment to bench untiltipping occurs
Maximum value,Pass/Fail
Jacob Hustedt DV 1 B 5/11/2015 5/28/2015 Canceled
19
20
21
22
2

[1] Internal and / or Customer Specification Reference[2] From Specification clause description of test being undertaken[3] Pass / Fail targets and Pass / Fail criteriae.g cycles, volts, minimum values, no fail etc.[4] Student who takes responsibility to make sure test is completed[5] Test Stage:CV= Concept verification (hand made)DV= Design verification (part tooled)PV= Product and Process validation
[6] Sample type:A = Concept verificationB = Design verificationC = Product validation
[7] Record actual value of result
3

Potential
___ System 1-Flow Air FMEA Number: 1X Subsystem 2-Pressure Supply___ Component Page 1 of 1
Model Year: 2015 5/29/2015 Prepared By:
Core Team: FMEA Date (Orig.) 11/23/2014
Action Results
Item / Function Potential Failure Mode Potential Effect(s) ofFailure Sev
Potential Cause(s) /Mechanism(s) of
FailureOccur Crit Recommended
Action(s)Responsibility &
TargetCompletion Date
Actions Taken Sev Occur Crit
supply pressureinto storage tank
insufficient pressuresupplied to tank
insufficient tankpressure for trial
5 clogged filter 3 15 check air intake filter isclear and replace ifnecessary, inspectsystem for debris
GwendolynChurch 5/29/15
5 Air intake hose notproperly connected
1 5 Ensure air line iscorrectly connected tosystem
Jacob Hustedt5/20/15
5 Insufficient supplypressure to storagetank
2 10 Ensure air line ispressurized andconnected to system,provide sufficient timefor tank(s) to fill
Tom Hurni 5/21/15
Failure Mode and Effect Analysis (Design FMEA)
Design Responsibility: Component Engin
Key Date: Team Turbine
Gwendolyn Church, Tom Hurni, Jacob Hustedt
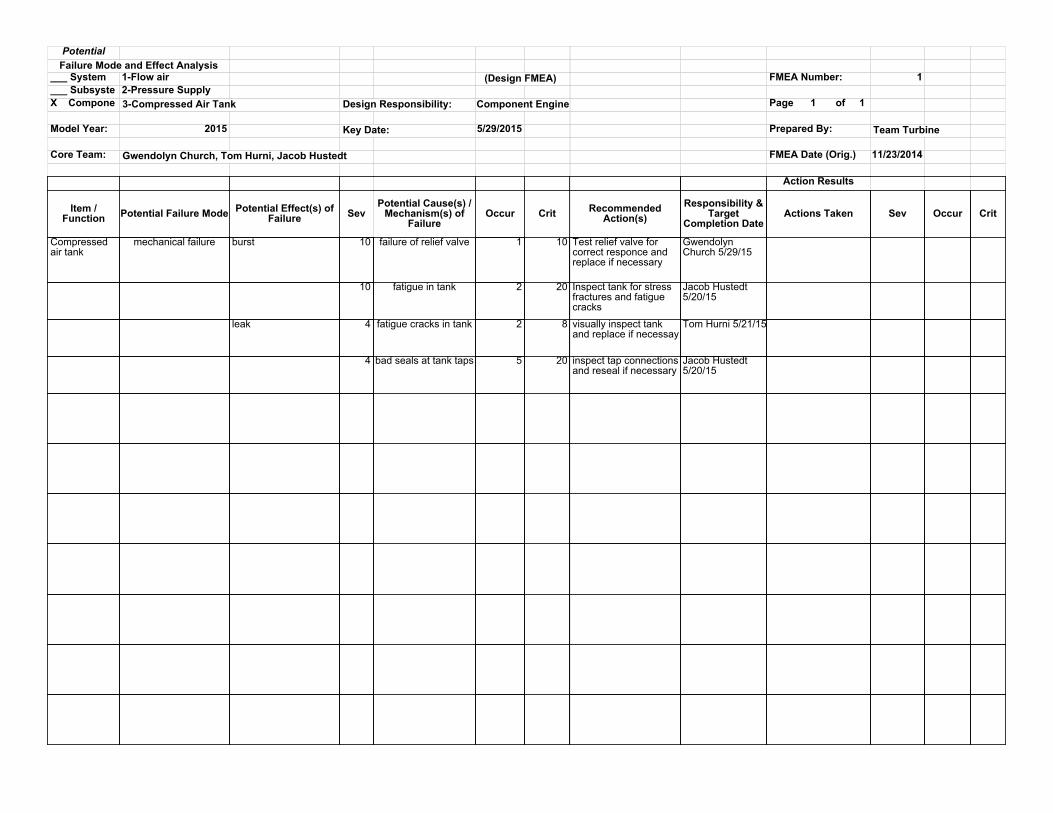
Potential
___ System 1-Flow air FMEA Number: 1___ Subsyste 2-Pressure SupplyX Compone Page 1 of 1
Model Year: 2015 5/29/2015 Prepared By:
Core Team: FMEA Date (Orig.) 11/23/2014
Action Results
Item /Function Potential Failure Mode Potential Effect(s) of
Failure SevPotential Cause(s) /
Mechanism(s) ofFailure
Occur Crit RecommendedAction(s)
Responsibility &Target
Completion DateActions Taken Sev Occur Crit
Compressedair tank
mechanical failure burst 10 failure of relief valve 1 10 Test relief valve forcorrect responce andreplace if necessary
GwendolynChurch 5/29/15
10 fatigue in tank 2 20 Inspect tank for stressfractures and fatiguecracks
Jacob Hustedt5/20/15
leak 4 fatigue cracks in tank 2 8 visually inspect tankand replace if necessay
Tom Hurni 5/21/15
4 bad seals at tank taps 5 20 inspect tap connectionsand reseal if necessary
Jacob Hustedt5/20/15
Failure Mode and Effect Analysis (Design FMEA)
3-Compressed Air Tank Design Responsibility: Component Engine
Key Date: Team Turbine
Gwendolyn Church, Tom Hurni, Jacob Hustedt

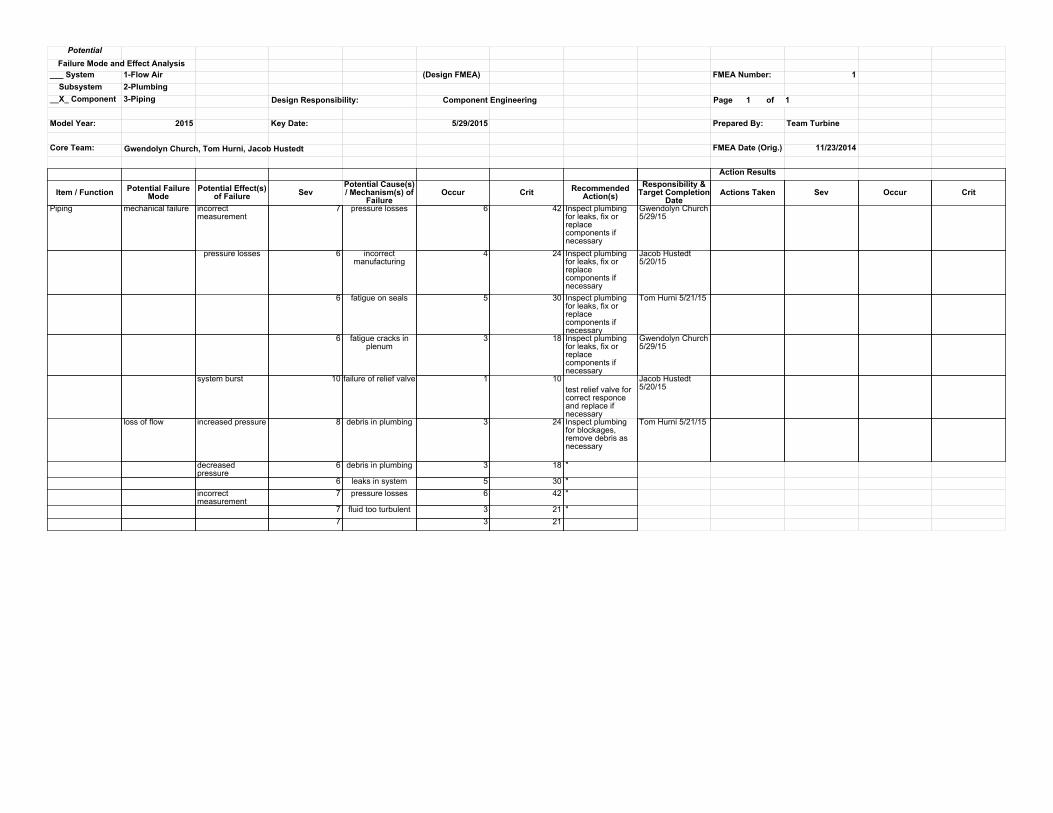
Potential
___ System 1-Flow Air (Design FMEA) FMEA Number: 1 Subsystem 2-Plumbing__X_ Component 3-Piping
Model Year: 2015 Key Date: 5/29/2015 Prepared By: Team Turbine
Core Team: FMEA Date (Orig.) 11/23/2014
Action Results
Item / Function Potential FailureMode
Potential Effect(s)of Failure Sev
Potential Cause(s)/ Mechanism(s) of
FailureOccur Crit Recommended
Action(s)Responsibility &
Target CompletionDate
Actions Taken Sev Occur Crit
Piping mechanical failure incorrectmeasurement
7 pressure losses 6 42 Inspect plumbingfor leaks, fix orreplacecomponents ifnecessary
Gwendolyn Church5/29/15
pressure losses 6 incorrectmanufacturing
4 24 Inspect plumbingfor leaks, fix orreplacecomponents ifnecessary
Jacob Hustedt5/20/15
6 fatigue on seals 5 30 Inspect plumbingfor leaks, fix orreplacecomponents ifnecessary
Tom Hurni 5/21/15
6 fatigue cracks inplenum
3 18 Inspect plumbingfor leaks, fix orreplacecomponents ifnecessary
Gwendolyn Church5/29/15
system burst 10 failure of relief valve 1 10test relief valve forcorrect responceand replace ifnecessary
Jacob Hustedt5/20/15
loss of flow increased pressure 8 debris in plumbing 3 24 Inspect plumbingfor blockages,remove debris asnecessary
Tom Hurni 5/21/15
decreasedpressure
6 debris in plumbing 3 18 "
6 leaks in system 5 30 "incorrectmeasurement
7 pressure losses 6 42 "
7 fluid too turbulent 3 21 "7 3 21
Failure Mode and Effect Analysis
Design Responsibility: Component Engineering Page 1 of 1
Gwendolyn Church, Tom Hurni, Jacob Hustedt

Potential
___ System 1-Flow Air (Design FMEA) FMEA Number: 1 Subsystem__X_ Component 3-Relief valve
Model Year: 2015 Key Date: 5/29/2015 Prepared By: Team Turbine
Core Team: FMEA Date (Orig.) 11/23/2014
Action Results
Item / Function Potential FailureMode
Potential Effect(s)of Failure Sev
Potential Cause(s)/ Mechanism(s) of
FailureOccur Crit Recommended
Action(s)Responsibility &
Target CompletionDate
Actions Taken Sev Occur Crit
relief valve doesnt open system burst 10 fatigue/wear 1 10 test plumbing reliefvalve for correctpressure relief,replace ifnecassary
Gwendolyn Church5/29/15
10 debris 1 10 Inspect for debris,replace ifnecessary
Jacob Hustedt5/20/15
10 incorrect pressuresetting
1 10 ensure correctpressure reliefvalue for reliefvalve
Tom Hurni 5/21/15
Failure Mode and Effect Analysis
2-Pressure Supply/PlumbingDesign Responsibility: Component Engineering Page 1 of 1
Gwendolyn Church, Tom Hurni, Jacob Hustedt
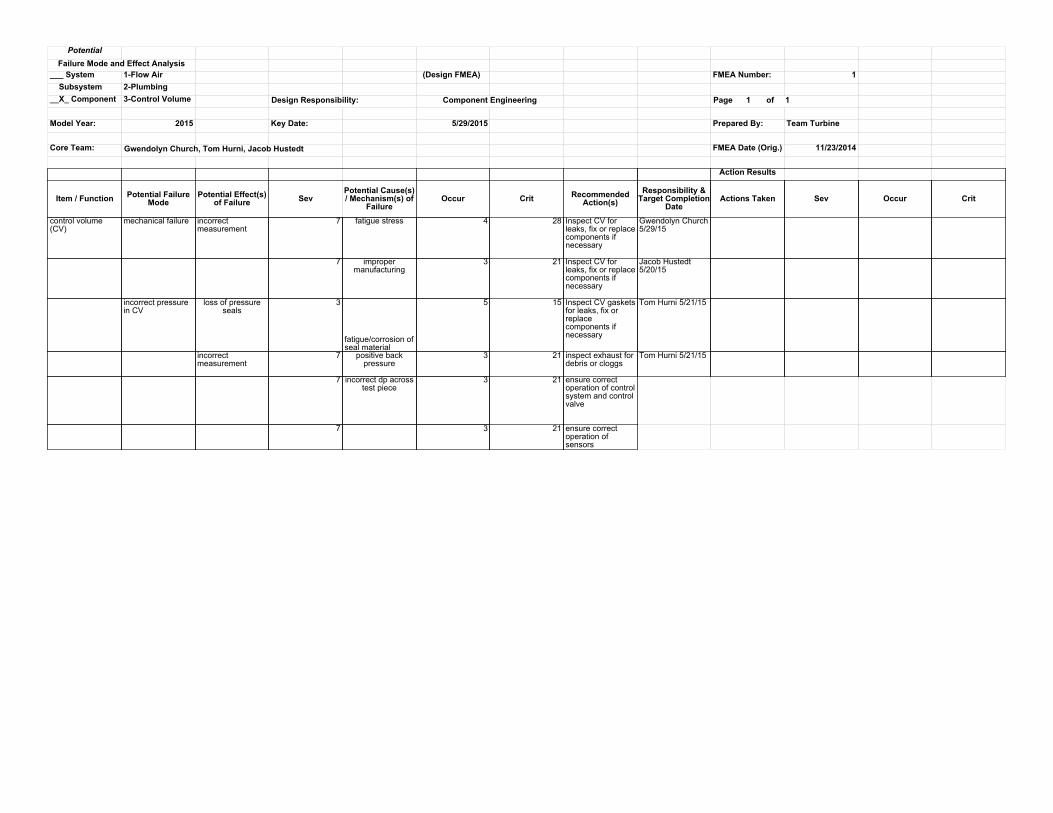
Potential
___ System 1-Flow Air (Design FMEA) FMEA Number: 1 Subsystem 2-Plumbing__X_ Component 3-Control Volume
Model Year: 2015 Key Date: 5/29/2015 Prepared By: Team Turbine
Core Team: FMEA Date (Orig.) 11/23/2014
Action Results
Item / Function Potential FailureMode
Potential Effect(s)of Failure Sev
Potential Cause(s)/ Mechanism(s) of
FailureOccur Crit Recommended
Action(s)Responsibility &
Target CompletionDate
Actions Taken Sev Occur Crit
control volume(CV)
mechanical failure incorrectmeasurement
7 fatigue stress 4 28 Inspect CV forleaks, fix or replacecomponents ifnecessary
Gwendolyn Church5/29/15
7 impropermanufacturing
3 21 Inspect CV forleaks, fix or replacecomponents ifnecessary
Jacob Hustedt5/20/15
incorrect pressurein CV
loss of pressureseals
3
fatigue/corrosion ofseal material
5 15 Inspect CV gasketsfor leaks, fix orreplacecomponents ifnecessary
Tom Hurni 5/21/15
incorrectmeasurement
7 positive backpressure
3 21 inspect exhaust fordebris or cloggs
Tom Hurni 5/21/15
7 incorrect dp acrosstest piece
3 21 ensure correctoperation of controlsystem and controlvalve
7 3 21 ensure correctoperation ofsensors
Failure Mode and Effect Analysis
Design Responsibility: Component Engineering Page 1 of 1
Gwendolyn Church, Tom Hurni, Jacob Hustedt

Potential
___ System 1-Flow Air FMEA Number: 1___ Subsystem 2-Measure FlowX Component 3-LFE Page 1 of 1
Model Year: 2015 5/29/2015 Prepared By:
Core Team: FMEA Date (Orig.) 11/23/201
Action Results
Item / Function Potential Failure Mode Potential Effect(s) ofFailure Sev
Potential Cause(s) /Mechanism(s) of
FailureOccur Crit Recommended
Action(s)Responsibility &
TargetCompletion Date
Actions Taken Sev Occur Crit
Laminar FlowElement (LFE)
restricted flow increased pressurethrough system
9
debris in element
2 18 visually inspect fordebris and remove
GwendolynChurch 5/29/15
decreased pressurethrough system
7
debris in element
2 14 visually inspect fordebris and remove
Jacob Hustedt5/20/15
incorrect measurement 7
debris in element
2 14 visually inspect fordebris and remove
Tom Hurni 5/21/15
mechanical failure increased pressurethrough system
8 fatigue/wear 3 24
test LFE for correctresponce and replace ifnecessary
GwendolynChurch 5/29/15
decreased pressurethrough system
7 fatigue/wear 3 21 visually inspect fordebris and remove
Jacob Hustedt5/20/15
incorrect measurement 7 fatigue/wear 3 21
test LFE for correctresponce and replace ifnecessary
Tom Hurni 5/21/15
Failure Mode and Effect Analysis (Design FMEA)
Design Responsibility: Component Engin
Key Date: Team Turbine
Gwendolyn Church, Tom Hurni, Jacob Hustedt


Potential
___ System 1-Flow Air FMEA Number: 1___ Subsystem 2-ControlsX Component 3-Control System Page 1 of 1
Model Year: 2015 5/29/201 Prepared By:
Core Team: FMEA Date (Orig.) 11/23/201
Action Results
Item / Function Potential Failure Mode Potential Effect(s) ofFailure Sev
Potential Cause(s) /Mechanism(s) of
FailureOccur Crit Recommended
Action(s)Responsibility &
TargetCompletion Date
Actions Taken Sev Occur Crit
control system incorrect signal outputs incorrect valveproportioning
6 bad sensors 4 24 Review microcontrollerand connections to allsensors and controlvalve
GwendolynChurch 5/29/15
6 glitch in codeing 3 18 Review microcontrollerand connections to allsensors and controlvalve
Jacob Hustedt5/20/15
6 impropper connection 3 18 Review microcontrollerand connections to allsensors and controlvalve
Tom Hurni 5/21/15
incorrect flowmeasurement
7 bad sensors 4 28 Review microcontrollerand connections to allsensors and controlvalve
GwendolynChurch 5/29/15
7 glitch in codeing 3 21 Review microcontrollerand connections to allsensors and controlvalve
Jacob Hustedt5/20/15
7 impropper connection 3 21 Review microcontrollerand connections to allsensors and controlvalve
Tom Hurni 5/21/15
Failure Mode and Effect Analysis (Design FMEA)
Design Responsibility: Component Engin
Key Date: Team Turbine
Gwendolyn Church, Tom Hurni, Jacob Hustedt


Potential
___ System 1-Flow Air (Design FMEA) FMEA Number: 1___ Subsystem 2-ControlsX Component 3-Sensors
Model Year: 2015 Key Date: 5/29/2015 Prepared By: Team Turbine
Core Team: FMEA Date (Orig.) 11/23/2014
Action Results
Item / Function Potential FailureMode
Potential Effect(s)of Failure Sev
Potential Cause(s)/ Mechanism(s) of
FailureOccur Crit Recommended
Action(s)Responsibility &
Target CompletionDate
Actions Taken Sev Occur Crit
sensors incorrect signaloutputs
incorrect valveproportioning
6 hardware failure 4 24test sensors forcorrect responceand replace ifnecessary
Gwendolyn Church5/29/15
6 impropperconnection
3 18 Check sensors andcontrol valve forproper connection
Jacob Hustedt5/20/15
6 sensor mountedimproperly
3 18ensure sensor ismounted in correctorientation andposition
Tom Hurni 5/21/15
incorrect flowmeasurement
7 hardware failure 4 28test sensors forcorrect responceand replace ifnecessary
Gwendolyn Church5/29/15
7 impropperconnection
3 21 Check sensors andcontrol valve forproper connection
Jacob Hustedt5/20/15
7 sensor mountedimproperly
3 21ensure sensor ismounted in correctorientation andposition
Tom Hurni 5/21/15
Failure Mode and Effect Analysis
Design Responsibility: Component Engineering Page 1 of 1
Gwendolyn Church, Tom Hurni, Jacob Hustedt

Potential
___ System 1-Flow Air FMEA Number: 1 Subsystem 2-Pressure Supply__X_ Compon Page 1 of 1
Model Year: 2015 5/29/2015 Prepared By:
Core Team: FMEA Date (Orig.) 11/23/201
Action Results
Item /Function Potential Failure Mode Potential Effect(s) of
Failure SevPotential Cause(s) /
Mechanism(s) ofFailure
Occur Crit RecommendedAction(s)
Responsibility &Target
Completion DateActions Taken Sev Occur Crit
Module ControlValve
mechanical seizure Decrease ofpressure/flow throughsystem
7 debris 1 7 visually inspect fordebris and remove
GwendolynChurch 5/29/15
7 wear/fatigue 3 21
test conrtrol valve forcorrect responce andreplace if necessary
Jacob Hustedt5/20/15
increased pressure/flowthrough system
9 debris 1 9 visually inspect fordebris and remove
Tom Hurni 5/21/15
9 wear/fatigue 3 27
test conrtrol valve forcorrect responce andreplace if necessary
GwendolynChurch 5/29/15
incorrect measurement 7 incorrect valveposition
5 35
test conrtrol valve forcorrect responce andreplace if necessary
Jacob Hustedt5/20/15
7 5 35
Check control systemfor correct signal output
Tom Hurni 5/21/15
incorrect signal input Decrease ofpressure/flow throughsystem
7
control system failure
3 21
Check control systemfor correct signal output
GwendolynChurch 5/29/15
7 3 21
ensure control valve iscorrectly connected tocontrol system
GwendolynChurch 5/29/15
Failure Mode and Effect Analysis (Design FMEA)
3-Module Control Valve Design Responsibility: Component Engine
Key Date: Team Turbine
Gwendolyn Church, Tom Hurni, Jacob Hustedt

increased pressure/flowthrough system
9
control system failure
3 27
Check control systemfor correct signal output
Jacob Hustedt5/20/15
9 3 27ensure control valve iscorrectly connected tocontrol system
Tom Hurni 5/21/15
incorrect measurement 7
control system failure
3 21Check control systemfor correct signal output
Jacob Hustedt5/20/15
7 3 21ensure control valve iscorrectly connected tocontrol system
Tom Hurni 5/21/15

Potential
___ System 1-Flow Air (Design FMEA) FMEA Number: 1 Subsystem__X_ Component 3-Blade Fixture
Model Year: 2015 Key Date: 5/29/2015 Prepared By: Team Turbine
Core Team: FMEA Date (Orig.) 11/23/2014
Action Results
Item / Function Potential FailureMode
Potential Effect(s)of Failure Sev
Potential Cause(s)/ Mechanism(s) of
FailureOccur Crit Recommended
Action(s)Responsibility &
Target CompletionDate
Actions Taken Sev Occur Crit
blade fixture mechanical failure incorrectmeasurement
7 failure of gasket 5 35 Inspect gaskets forleaks, fix or replacecomponents ifnecessary
Gwendolyn Church5/29/15
7 clamps nottightened correctly
4 28 Ensure clamps aretightened tospecefied pressure
Jacob Hustedt5/20/15
7 clamp failure 3 21 Test and inspectclamps, fix orreplacecomponents ifnecessary
Tom Hurni 5/21/15
7 fixture failure 3 21 Inspect fixture, fixor replacecomponent ifnecessary
damage to blade 9 failure of gasket 5 45 Inspect gaskets forleaks, fix or replacecomponents ifnecessary
9 clamps nottightened correctly
4 36 Ensure clamps aretightened tospecified pressure
9 clamp failure 3 27 Test and inspectclamps, fix orreplacecomponents ifnecessary
9 fixture failure 3 27 Inspect fixture, fixor replacecomponent ifnecessary
missalignment oftest piece
incorrectmeasurement
7 failure of gasket 5 35 Inspect gaskets forleaks, fix or replacecomponents ifnecessary
7 clamps nottightened correctly
4 28 Ensure clamps aretightened tospecefied pressure
7 clamp failure 3 21 Test and inspectclamps, fix orreplacecomponents ifnecessary
7 debris in seal 3 21 Inspect gaskets fordebris, remove iffound
7 fixture failure 3 21 Inspect fixture, fixor replacecomponent ifnecessary
Failure Mode and Effect Analysis
2-Mount Turbine BladeDesign Responsibility: Component Engineering Page 1 of 1
Gwendolyn Church, Tom Hurni, Jacob Hustedt
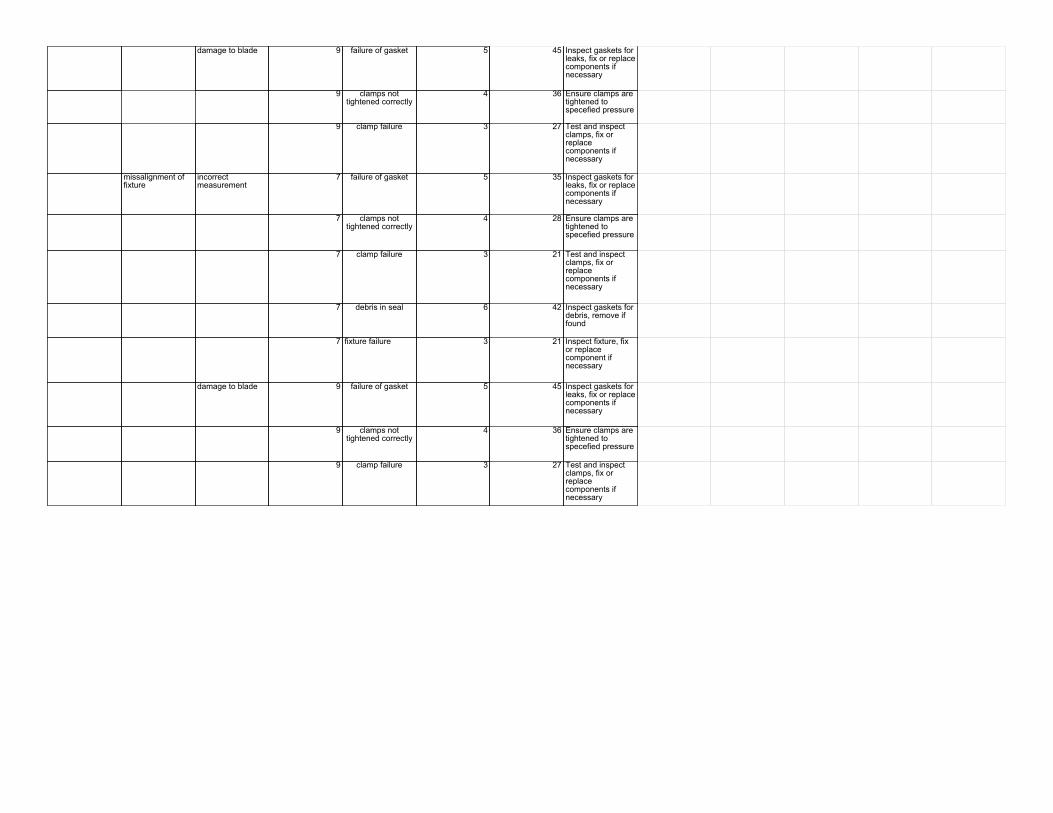
damage to blade 9 failure of gasket 5 45 Inspect gaskets forleaks, fix or replacecomponents ifnecessary
9 clamps nottightened correctly
4 36 Ensure clamps aretightened tospecefied pressure
9 clamp failure 3 27 Test and inspectclamps, fix orreplacecomponents ifnecessary
missalignment offixture
incorrectmeasurement
7 failure of gasket 5 35 Inspect gaskets forleaks, fix or replacecomponents ifnecessary
7 clamps nottightened correctly
4 28 Ensure clamps aretightened tospecefied pressure
7 clamp failure 3 21 Test and inspectclamps, fix orreplacecomponents ifnecessary
7 debris in seal 6 42 Inspect gaskets fordebris, remove iffound
7 fixture failure 3 21 Inspect fixture, fixor replacecomponent ifnecessary
damage to blade 9 failure of gasket 5 45 Inspect gaskets forleaks, fix or replacecomponents ifnecessary
9 clamps nottightened correctly
4 36 Ensure clamps aretightened tospecefied pressure
9 clamp failure 3 27 Test and inspectclamps, fix orreplacecomponents ifnecessary