tunnelling and underground space technologydownload.xuebalib.com/xuebalib.com.33973.pdf ·...
TRANSCRIPT
Tunnelling and Underground Space Technology 65 (2017) 215–224
Contents lists available at ScienceDirect
Tunnelling and Underground Space Technology
journal homepage: www.elsevier .com/ locate/ tust
Mechanical behavior of rock-shotcrete interface under static anddynamic tensile loads
http://dx.doi.org/10.1016/j.tust.2017.03.0050886-7798/� 2017 Elsevier Ltd. All rights reserved.
⇑ Corresponding author.E-mail address: [email protected] (X. Li).
Lin Luo, Xibing Li ⇑, Ming Tao, Longjun DongSchool of Resources and Safety Engineering, Central South University, Changsha 410083, China
a r t i c l e i n f o a b s t r a c t
Article history:Received 4 September 2016Received in revised form 23 February 2017Accepted 8 March 2017Available online 24 March 2017
Keywords:ShotcreteAdhesion strengthRock-shotcrete interfaceSHPB
The rock-shotcrete interface has become common in underground tunnels following the widespreadapplication of shotcrete as a support element. The static and dynamic tensile properties of the rock-shotcrete interface were measured using Instron 1342 and split Hopkinson pressure bar (SHPB) appara-tus. The effect of loading rate and interface geometry on interface tensile behavior was studied using fourlevels of loading rate and six types of interface geometries. The results demonstrate that the interface hastypical loading rate dependency, which means that bearing capacity of the interface increases with anincrease in the loading rate. The bearing capacity and failure modes of the interface are sensitive tothe interface geometry. The measured peak load exhibits an early increase and later decreasing trend;there is a critical value (1.2 mm and 1.8 mm under static and dynamic load) in geometry parameter‘‘h” as the dominant failure mode changes from adhesion to cohesion. An interface with greater ‘‘h” leadsto low bearing capacity. Therefore, the rock surface should be a reasonable roughness during rock surfacepreparation, and an appropriate depth of sawteeth is crucial to obtain reliable support strength in tunnel-ing engineering.
� 2017 Elsevier Ltd. All rights reserved.
1. Introduction
Shotcrete is sprayed onto the rock surface to prevent furtherexpansion of loose rock mass immediately after excavation. It iswidely used in underground tunneling and mining. However, sprayoperations may fail to give timely protection to surrounding rock,which may cause poor support and high cost. Therefore, manyscholars have investigated the shotcrete support system. Changand Stille (1995) indicated that the main failure of shotcrete isdue to the loss of adhesion between shotcrete and the substrate.Ansell (2004) described similar findings during his field tests inSwedish mines. Barrett and McCreath (1995) explained failuremodes for shotcrete liner and found that the behavior of shotcreteliner is highly dependent on the adhesion between shotcrete androck. Therefore, adhesion plays a vital role in shotcrete perfor-mance; and it is important to better understand adhesion.
To speed up project progress, new blasting may be carried outon the excavation surface before secondary support, which mayexpose shotcrete to vibrations due to the blasting. Scholars haveresearched shotcrete stability based on particle vibration velocity.Ansell (2004) found that there is no obvious crack at a vibration
velocity of 0.5–1.0 m/s for early plain shotcrete, but rock ejectswhen exposed to velocity exceeding 1.0 m/s. Experiments werecarried out in a tunnel in Japan by Nakano et al. (1993). Theyreported that vibration velocity of 0.7 m/s leads to the crackingof shotcrete lining. However, all of the vibration velocities obtainedfrom in situ tests cannot be used for practical guidance. Researchhas focused on how to determine safe vibration velocity. Modelshave been established to provide some detailed guidelines forhow close to shotcrete, in time and distance, blasting can beallowed to occur (Ansell and Holmgren, 1999; Ansell, 2005,2007a, 2007b; Ahmed, 2012; Ahmed and Ansell, 2012, 2014;Ahmed et al., 2012). Few studies have focused on the interactionmechanism between shotcrete and the rock interface, especiallythe influence of rock interface roughness.
Research shows that the unevenness of the rock surface influ-ences the adhesion strength of shotcrete. Chang and Stille (1995)tested two types of surfaces with laboratory model testing simplywaved and doubly waved surfaces, and found that the irregulari-ties of a tunnel surface may contribute to residual strength andreduce the risk of tunnel failure. Even and uneven surfaces (threedegrees of roughness) were considered in numerical analyses con-ducted by Malmgren and Nordlund (2008). They investigated thenumber of tensile failures in the lining and the number of shear/tensile failures at the interface that were sensitive to surface
216 L. Luo et al. / Tunnelling and Underground Space Technology 65 (2017) 215–224
unevenness. Ozturk and Tannant (2011) reported that substrateroughness does not seem to increase adhesive strength. This resultshould be verified by additional testing data.
To study tensile characteristics of rock-like materials, theBrazilian test is an indirect method that has been suggested bythe International Society for Rock Mechanics (ISRM, 1978) becauseof convenient specimen preparation and simple test implementa-tion. The Brazilian method has been extended to dynamic test(Zhao and Li, 2000; Wang et al., 2006; Zhou et al., 2007; Dai andXia, 2010) by using a split Hopkinson pressure bar (SHPB). Euro-pean specifications for sprayed concrete (1999) state that bondstrength shall be determined by a partial core test or a tensile test.According to some specifications (ACI, 2004; GB, 2001), the Brazil-ian method was developed to determine the tensile adhesionstrength at the rock-shotcrete interface. The split test has beenused to test the adhesion strength at shotcrete-rock contact bySon (2013) and Ahn et al. (2004). Yan et al. (2012) also used thismethod to measure the tensile properties of rock interfacebetween tuff and basalt.
Shotcrete behavior is affected by rock surface unevenness.However, failure types and its internal mechanism remain vague.All previous investigations provided only qualitative results, quan-titative findings have never been provided. To date, no work hasbeen done on dynamic interface geometry during support opera-tion. The rock-shotcrete interface is always exposed to vibrationsinduced by explosions. In this paper, in order to investigate thequantitative effect of interface geometry exposed to vibrations, adynamic Brazilian disc test is conducted on a rock-shotcrete inter-face. The influence of interface geometry is studied by varyinggeometry parameter ‘‘h” from 0 mm, 0.6 mm, 1.2 mm, 1.8 mm,2.4 mm to 3.0 mm. The purpose is to search for an appropriate sur-face geometry that is effective in shotcreting preparation in tunnelconstruction.
2. Experimental layouts
2.1. Specimen preparation
Rock is granite since the surrounding rock of an undergroundexcavation is generally granite. Granite’s surface is prepared bywater-jetting, which has been demonstrated by several scholarsto be the best way because it minimizes micro cracking and pro-vides a superior surface for bonding (Hindo, 1990; Talbot et al.,1995; Kuchta, 2002; Malmgren et al., 2005). Cement mortar is usedto replace shotcrete because of the small specimen size and conve-nient preparation. The material properties of the cement mortarare close to shotcrete, and they show similar adhesion to rock.
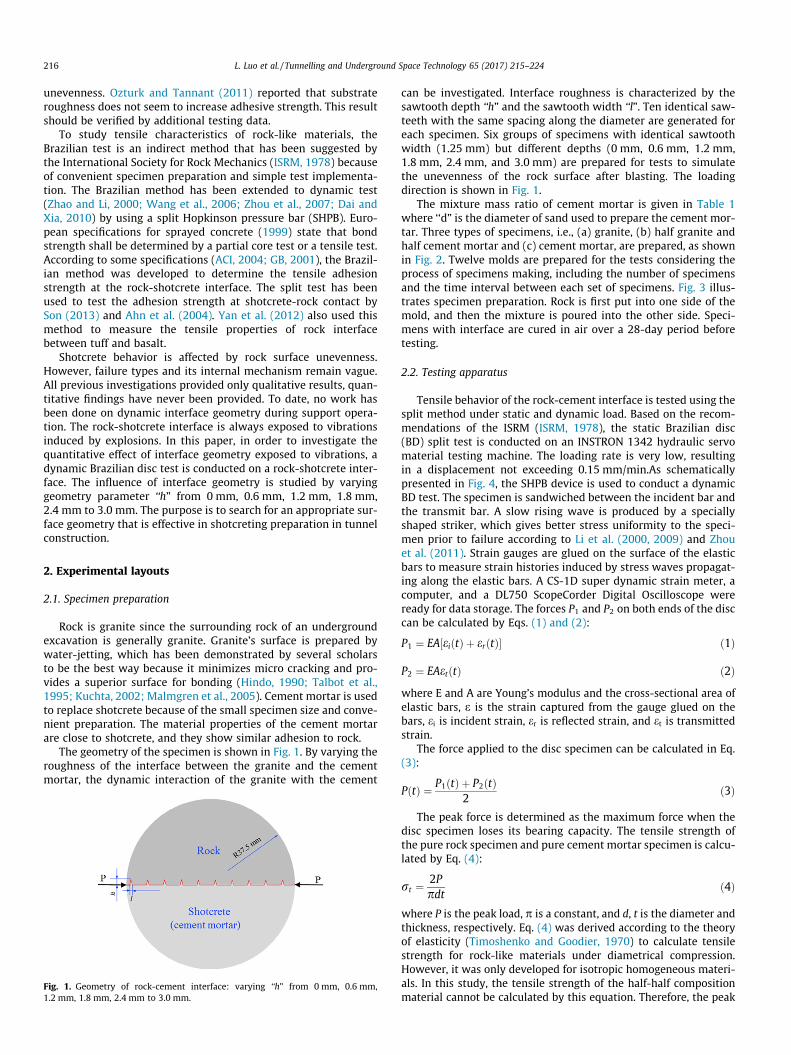
The geometry of the specimen is shown in Fig. 1. By varying theroughness of the interface between the granite and the cementmortar, the dynamic interaction of the granite with the cement
Fig. 1. Geometry of rock-cement interface: varying ‘‘h” from 0 mm, 0.6 mm,1.2 mm, 1.8 mm, 2.4 mm to 3.0 mm.
can be investigated. Interface roughness is characterized by thesawtooth depth ‘‘h” and the sawtooth width ‘‘l”. Ten identical saw-teeth with the same spacing along the diameter are generated foreach specimen. Six groups of specimens with identical sawtoothwidth (1.25 mm) but different depths (0 mm, 0.6 mm, 1.2 mm,1.8 mm, 2.4 mm, and 3.0 mm) are prepared for tests to simulatethe unevenness of the rock surface after blasting. The loadingdirection is shown in Fig. 1.
The mixture mass ratio of cement mortar is given in Table 1where ‘‘d” is the diameter of sand used to prepare the cement mor-tar. Three types of specimens, i.e., (a) granite, (b) half granite andhalf cement mortar and (c) cement mortar, are prepared, as shownin Fig. 2. Twelve molds are prepared for the tests considering theprocess of specimens making, including the number of specimensand the time interval between each set of specimens. Fig. 3 illus-trates specimen preparation. Rock is first put into one side of themold, and then the mixture is poured into the other side. Speci-mens with interface are cured in air over a 28-day period beforetesting.
2.2. Testing apparatus
Tensile behavior of the rock-cement interface is tested using thesplit method under static and dynamic load. Based on the recom-mendations of the ISRM (ISRM, 1978), the static Brazilian disc(BD) split test is conducted on an INSTRON 1342 hydraulic servomaterial testing machine. The loading rate is very low, resultingin a displacement not exceeding 0.15 mm/min.As schematicallypresented in Fig. 4, the SHPB device is used to conduct a dynamicBD test. The specimen is sandwiched between the incident bar andthe transmit bar. A slow rising wave is produced by a speciallyshaped striker, which gives better stress uniformity to the speci-men prior to failure according to Li et al. (2000, 2009) and Zhouet al. (2011). Strain gauges are glued on the surface of the elasticbars to measure strain histories induced by stress waves propagat-ing along the elastic bars. A CS-1D super dynamic strain meter, acomputer, and a DL750 ScopeCorder Digital Oscilloscope wereready for data storage. The forces P1 and P2 on both ends of the disccan be calculated by Eqs. (1) and (2):
P1 ¼ EA½eiðtÞ þ erðtÞ� ð1Þ
P2 ¼ EAetðtÞ ð2Þwhere E and A are Young’s modulus and the cross-sectional area ofelastic bars, e is the strain captured from the gauge glued on thebars, ei is incident strain, er is reflected strain, and et is transmittedstrain.
The force applied to the disc specimen can be calculated in Eq.(3):
PðtÞ ¼ P1ðtÞ þ P2ðtÞ2
ð3Þ
The peak force is determined as the maximum force when thedisc specimen loses its bearing capacity. The tensile strength ofthe pure rock specimen and pure cement mortar specimen is calcu-lated by Eq. (4):
rt ¼ 2Ppdt
ð4Þ
where P is the peak load, p is a constant, and d, t is the diameter andthickness, respectively. Eq. (4) was derived according to the theoryof elasticity (Timoshenko and Goodier, 1970) to calculate tensilestrength for rock-like materials under diametrical compression.However, it was only developed for isotropic homogeneous materi-als. In this study, the tensile strength of the half-half compositionmaterial cannot be calculated by this equation. Therefore, the peak

Table 1Mixture ratio of the cement mortar.
Cement Sand Water
d < 0.25 mm d = 0.25–0.5 mm d > 0.5 mm Total
Ratio 1 1.9 1.36 1.36 4.62 1
Fig. 2. Photographs of typical specimens: (a) granite; (b) half granite and half cement mortar; (c) cement mortar.
Fig. 3. Preparation of the specimens with interface: (a) empty mould; (b) rock put into one side; (c) cement mortar poured into the other side.
Fig. 4. Sketch of SHPB device: impact device; incident bar; transmitted bar; strain gauge; data processing system.
L. Luo et al. / Tunnelling and Underground Space Technology 65 (2017) 215–224 217
force is chosen to indicate the bearing capacity of the half rock andhalf mortar specimens. The tensile strength of the pure rock andpure cement mortar specimens is obtained by Eq. (4) since purerock and pure cement mortar is isotropic homogeneous material.
To study the effect of interface geometry, the geometry param-eter ‘‘h” varied from 0 mm, 0.6 mm, 1.2 mm, 1.8 mm, 2.4 mm to3.0 mm. Static and dynamic splitting tensile tests were conductedto indicate static and dynamic mechanical behavior of the rock-cement interface. In the dynamic BD tests, various loading ratescan be obtained by varying the gas pressure in order to examinethe sensitivity of bearing capacity to loading rate.
2.3. Dynamic stress equilibrium
A half-sine wave is produced by a special shaped striker duringdynamic tests. According to Zhou et al. (2011), a half-sine wave has
good immunity to dispersion effect and there is no signal oscilla-tion during its propagation. Fig. 5 shows typical signals recordedby the strain gauges on elastic bars. The dynamic stress equilib-rium on both ends of the disc specimen is strictly assessed inFig. 6, in which ‘‘In + Re” is the sum of incident stress and reflectedstress on the input end, and ‘‘Tr” is the transmitted stress on theoutput end. Dynamic stress on both ends of the specimen is almostequivalent during the loading period, indicating that equilibrium isachieved during the test.
3. Results and discussion
3.1. Static and dynamic results
The static and dynamic test results of rock, cement mortar andthe rock-cement interface are listed in Tables 2 and 3, respectively.

0 100 200 300 400 500 600 700 800 900 1000
-0.09
-0.06
-0.03
0.00
0.03
0.06
0.09
Vol
tage
/ V
Time/ µs
Signal on the incident barSignal on the transimit bar
Fig. 5. Typical signals recorded by the strain gauges.
0 25 50 75 100 125 150 175 200 225 250 275 300
-100
-80
-60
-40
-20
0
20
40
60
80
100
Stre
ss/ M
Pa
Time/ µs
InReIn+ReTr
Fig. 6. Examination of dynamic stress equilibrium.
218 L. Luo et al. / Tunnelling and Underground Space Technology 65 (2017) 215–224
Variations in dynamic tensile strength of rock and cement mortarwith loading rate is shown in Fig. 7(a) and (b). Rock and cementmortar show typical loading rate dependency, the tensile strengthincreases with increase in the loading rate. Fig. 7(c) illustrates theeffect of loading rate on the bearing capacity of the interface with
Table 2Results of static test.
Specimens no. Diameter (mm) Height (mm) Va
R-1 74.48 27.15 –R-2 74.67 26.53 –C-1 75.03 23.75 –C-2 74.82 22.98 –0-1 75.34 24.17 00-2 74.65 27.06 006-2 75.22 25.03 0.606-2 75.00 25.40 0.612-1 74.64 23.80 1.212-2 74.75 23.93 1.218-1 74.88 24.58 1.818-2 74.97 25.47 1.824-1 75.06 23.72 2.424-2 75.09 23.76 2.430-1 75.02 26.34 3.030-2 74.8 25.47 3.0
R: rock; C: cement mortar; 06, 12, 18, 24, 30: interface with different ‘‘h”.
different ‘‘h”. The dynamic response of the interface is much morecomplicated. There is no doubt that peak force increases as theloading rate grows. The loading rate is divided into two regionsdemarcated by 1000 GPa s�1, as marked in Fig. 7(c). For the inter-faces with parameters ‘‘h” = 1.2 mm, 1.8 mm, 2.4 mm and3.0 mm, the peak load initially grows rapidly when the loading rateis lower than 1000 GPa s�1, and then growth flattens out if theloading rate is larger than 1000 GPa s�1. The peak force of theinterface with ‘‘h” = 0.6 mm increases even faster when the loadingrate exceeds 1000 GPa s�1. The interface with shape parameter‘‘h” = 0.6 mm shows higher sensitivity if the loading rate variesfrom 1000 GPa s�1 to 1400 GPa s�1. However, the interface withother values of ‘‘h” exhibit stronger dependency if the loading rateis lower, varying from 700 GPa s�1 to 1000 GPa s�1, which meansthat the peak load increases more if there is an increment in theloading rate and the rock-cement interface gains much more favor-able stability. During the design of shotcrete support, designersshould pay special attention to the magnitude of the loading rateif vibrations are considered.
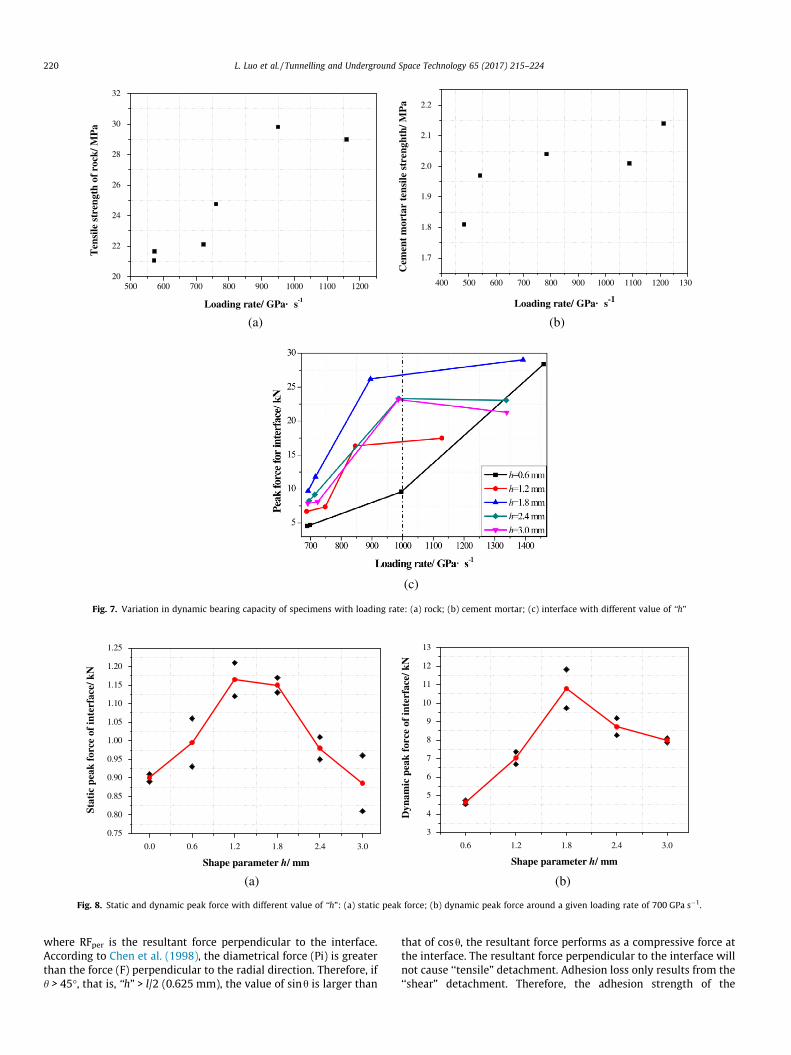
Variation in static and dynamic peak force of the rock-cementinterface with respect to the geometry parameter ‘‘h” is shown inFig. 8. The black data points are the exact result of each combinedspecimen, while the red ones reflect the average value of the peakforce on the specimens where the interface geometry parameter‘‘h” is constant. Bearing capacity under static and dynamic condi-tions are both affected by specimen geometry. Static results arepresented in Fig. 8(a). The peak load shows an early increase andlater a decreasing trend. There is a critical value (1.2 mm) in theparameter ‘‘h” above which the peak force does not increase butdecreases. Variation in dynamic peak load with different valuesof ‘‘h” around a given loading rate of 700 GPa s�1 is shown inFig. 8(b). A similar tendency is found; the only difference is thatthe critical value under dynamic conditions is 1.8 mm, a littlegreater than that under static load.
3.2. Relationship among bearing capacity of rock, cement and interface
The peak load of rock under static load is approximately24.45 kN. The load’s dynamic peak force varies from 67.30 kN to94.79 kN. Static peak load of cement mortar is approximately0.76 kN. In addition, the mortar’s dynamic peak force varies from4.82 kN to 5.79 kN. The static peak force of the rock-cement inter-face ranges from 0.67 kN to 1.21 kN with various ‘‘h”, which is sup-ported by the results of a previous study (Malmgren et al., 2005).Its dynamic peak load varies widely from 4.53 kN to 29.05 kN.The interface bearing capacity is generally between that of rock
lue of ‘‘h” (mm) Tensile strength (MPa) Peak force (kN)
7.62 24.197.94 24.700.28 0.780.27 0.73– 0.89– 0.67– 1.06– 0.93– 1.12– 1.21– 1.13– 1.17– 1.01– 0.95– 0.81– 0.96
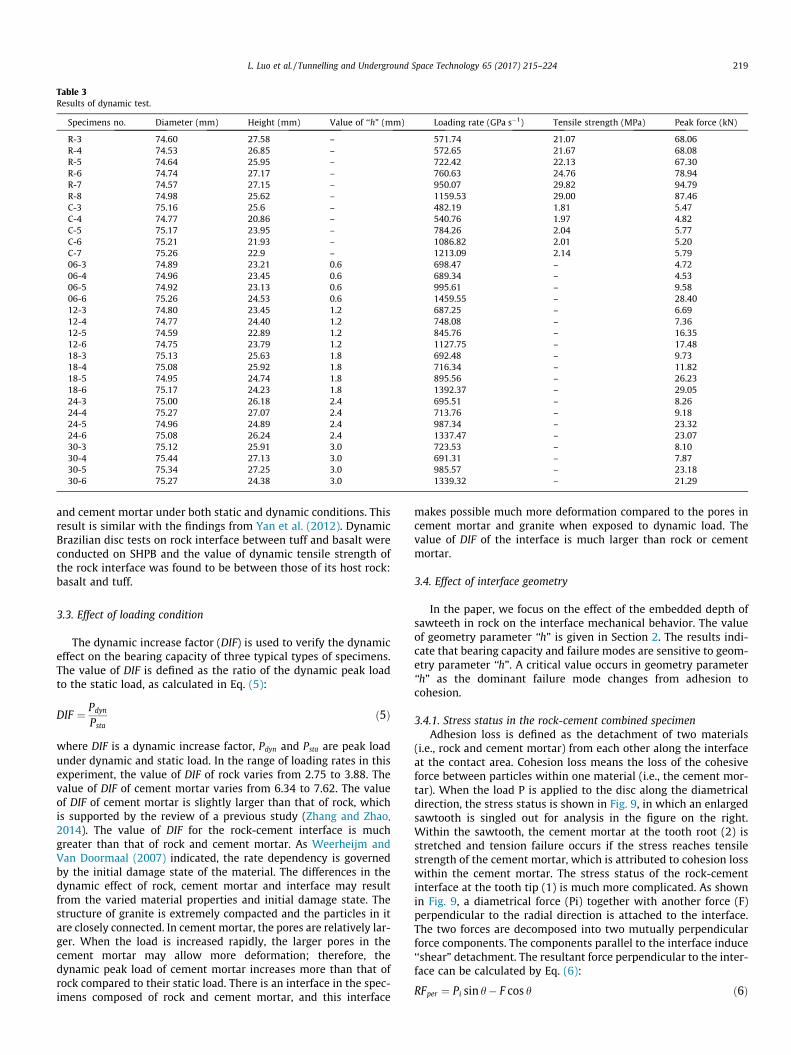
Table 3Results of dynamic test.
Specimens no. Diameter (mm) Height (mm) Value of ‘‘h” (mm) Loading rate (GPa s�1) Tensile strength (MPa) Peak force (kN)
R-3 74.60 27.58 – 571.74 21.07 68.06R-4 74.53 26.85 – 572.65 21.67 68.08R-5 74.64 25.95 – 722.42 22.13 67.30R-6 74.74 27.17 – 760.63 24.76 78.94R-7 74.57 27.15 – 950.07 29.82 94.79R-8 74.98 25.62 – 1159.53 29.00 87.46C-3 75.16 25.6 – 482.19 1.81 5.47C-4 74.77 20.86 – 540.76 1.97 4.82C-5 75.17 23.95 – 784.26 2.04 5.77C-6 75.21 21.93 – 1086.82 2.01 5.20C-7 75.26 22.9 – 1213.09 2.14 5.7906-3 74.89 23.21 0.6 698.47 – 4.7206-4 74.96 23.45 0.6 689.34 – 4.5306-5 74.92 23.13 0.6 995.61 – 9.5806-6 75.26 24.53 0.6 1459.55 – 28.4012-3 74.80 23.45 1.2 687.25 – 6.6912-4 74.77 24.40 1.2 748.08 – 7.3612-5 74.59 22.89 1.2 845.76 – 16.3512-6 74.75 23.79 1.2 1127.75 – 17.4818-3 75.13 25.63 1.8 692.48 – 9.7318-4 75.08 25.92 1.8 716.34 – 11.8218-5 74.95 24.74 1.8 895.56 – 26.2318-6 75.17 24.23 1.8 1392.37 – 29.0524-3 75.00 26.18 2.4 695.51 – 8.2624-4 75.27 27.07 2.4 713.76 – 9.1824-5 74.96 24.89 2.4 987.34 – 23.3224-6 75.08 26.24 2.4 1337.47 – 23.0730-3 75.12 25.91 3.0 723.53 – 8.1030-4 75.44 27.13 3.0 691.31 – 7.8730-5 75.34 27.25 3.0 985.57 – 23.1830-6 75.27 24.38 3.0 1339.32 – 21.29
L. Luo et al. / Tunnelling and Underground Space Technology 65 (2017) 215–224 219
and cement mortar under both static and dynamic conditions. Thisresult is similar with the findings from Yan et al. (2012). DynamicBrazilian disc tests on rock interface between tuff and basalt wereconducted on SHPB and the value of dynamic tensile strength ofthe rock interface was found to be between those of its host rock:basalt and tuff.
3.3. Effect of loading condition
The dynamic increase factor (DIF) is used to verify the dynamiceffect on the bearing capacity of three typical types of specimens.The value of DIF is defined as the ratio of the dynamic peak loadto the static load, as calculated in Eq. (5):
DIF ¼ Pdyn
Pstað5Þ
where DIF is a dynamic increase factor, Pdyn and Psta are peak loadunder dynamic and static load. In the range of loading rates in thisexperiment, the value of DIF of rock varies from 2.75 to 3.88. Thevalue of DIF of cement mortar varies from 6.34 to 7.62. The valueof DIF of cement mortar is slightly larger than that of rock, whichis supported by the review of a previous study (Zhang and Zhao,2014). The value of DIF for the rock-cement interface is muchgreater than that of rock and cement mortar. As Weerheijm andVan Doormaal (2007) indicated, the rate dependency is governedby the initial damage state of the material. The differences in thedynamic effect of rock, cement mortar and interface may resultfrom the varied material properties and initial damage state. Thestructure of granite is extremely compacted and the particles in itare closely connected. In cement mortar, the pores are relatively lar-ger. When the load is increased rapidly, the larger pores in thecement mortar may allow more deformation; therefore, thedynamic peak load of cement mortar increases more than that ofrock compared to their static load. There is an interface in the spec-imens composed of rock and cement mortar, and this interface
makes possible much more deformation compared to the pores incement mortar and granite when exposed to dynamic load. Thevalue of DIF of the interface is much larger than rock or cementmortar.
3.4. Effect of interface geometry
In the paper, we focus on the effect of the embedded depth ofsawteeth in rock on the interface mechanical behavior. The valueof geometry parameter ‘‘h” is given in Section 2. The results indi-cate that bearing capacity and failure modes are sensitive to geom-etry parameter ‘‘h”. A critical value occurs in geometry parameter‘‘h” as the dominant failure mode changes from adhesion tocohesion.
3.4.1. Stress status in the rock-cement combined specimenAdhesion loss is defined as the detachment of two materials
(i.e., rock and cement mortar) from each other along the interfaceat the contact area. Cohesion loss means the loss of the cohesiveforce between particles within one material (i.e., the cement mor-tar). When the load P is applied to the disc along the diametricaldirection, the stress status is shown in Fig. 9, in which an enlargedsawtooth is singled out for analysis in the figure on the right.Within the sawtooth, the cement mortar at the tooth root (2) isstretched and tension failure occurs if the stress reaches tensilestrength of the cement mortar, which is attributed to cohesion losswithin the cement mortar. The stress status of the rock-cementinterface at the tooth tip (1) is much more complicated. As shownin Fig. 9, a diametrical force (Pi) together with another force (F)perpendicular to the radial direction is attached to the interface.The two forces are decomposed into two mutually perpendicularforce components. The components parallel to the interface induce‘‘shear” detachment. The resultant force perpendicular to the inter-face can be calculated by Eq. (6):
RFper ¼ Pi sin h� F cos h ð6Þ
(a) (b)
(c)
500 600 700 800 900 1000 1100 120020
22
24
26
28
30
32T
ensi
le s
tren
gth
of r
ock/
MP
a
Loading rate/ GPa· s-1
400 500 600 700 800 900 1000 1100 1200 130
1.7
1.8
1.9
2.0
2.1
2.2
Cem
ent m
orta
r te
nsile
str
engh
th/ M
Pa
Loading rate/ GPa· s-1
Fig. 7. Variation in dynamic bearing capacity of specimens with loading rate: (a) rock; (b) cement mortar; (c) interface with different value of ‘‘h”
(a) (b)
0.0 0.6 1.2 1.8 2.4 3.0
0.75
0.80
0.85
0.90
0.95
1.00
1.05
1.10
1.15
1.20
1.25
Stat
ic p
eak
forc
e of
inte
rfac
e/ k
N
Shape parameter h/ mm
0.6 1.2 1.8 2.4 3.0
3
4
5
6
7
8
9
10
11
12
13
Dyn
amic
pea
k fo
rce
of in
terf
ace/
kN
Shape parameter h/ mm
Fig. 8. Static and dynamic peak force with different value of ‘‘h”: (a) static peak force; (b) dynamic peak force around a given loading rate of 700 GPa s�1.
220 L. Luo et al. / Tunnelling and Underground Space Technology 65 (2017) 215–224
where RFper is the resultant force perpendicular to the interface.According to Chen et al. (1998), the diametrical force (Pi) is greaterthan the force (F) perpendicular to the radial direction. Therefore, ifh > 45�, that is, ‘‘h” > l/2 (0.625 mm), the value of sinh is larger than
that of cosh, the resultant force performs as a compressive force atthe interface. The resultant force perpendicular to the interface willnot cause ‘‘tensile” detachment. Adhesion loss only results from the‘‘shear” detachment. Therefore, the adhesion strength of the

Fig. 9. Failure mechanism in detail.
L. Luo et al. / Tunnelling and Underground Space Technology 65 (2017) 215–224 221
interface depends on the shear strength of the interface. The shearstrength of the interface can be calculated by Eqs. (7)–(9):
s ¼ r tan hþ c ð7Þ
r ¼ Pi sin h� F cos h
tffiffiffiffiffiffiffiffiffiffiffiffiffiffiffiffiffiffiffiffiffiffiffiffiffih2 þ ð1=2Þ2
q ð8Þ
tan h ¼ hl=2
ð9Þ
where s is the shear strength, r is the normal force, t is the thick-ness of the specimen, and c is the cohesion. Based on Eqs. (7)–(9),the shear strength s can be calculated by Eq. (10):
s ¼ 8h2
ltðl2 þ 4h2ÞPi � 4h
tðl2 þ 4h2ÞF þ c ð10Þ
It can be concluded that the value of s increases as the parameter‘‘h” increases when ‘‘h” is greater than ‘‘l/2” after some mathemati-cal analysis. Therefore, if the parameter ‘‘h” is larger than 0.625 mm,adhesion strength depends on its shear strength, which increases asthe parameter ‘‘h” increases. In this case, adhesion loss only resultsfrom the ‘‘shear” detachment. If the parameter ‘‘h” is 0 mm adhesionloss is due to ‘‘tensile” detachment. If the parameter ‘‘h” is between0 mm and 0.625 mm, adhesion loss may be induced by both ‘‘shear”and ‘‘tensile” detachment.
3.4.2. Failure mode changes from adhesion to cohesionThe shape parameter ‘‘h” has been defined in Section 2.1, and
the value of the parameter ‘‘h” varies from 0 mm to 3.0 mm at aninterval of 0.6 mm per increment. As discussed in Section 3.4.1,the adhesion strength of the sawtooth interface increases as theparameter ‘‘h” increases. The tensile strength of the cement mortaris constant no matter what the value of parameter ‘‘h”. Accordingto Seymour et al. (2011), depending on where the core breaks,the tensile strength at failure can represent either the actual adhe-sion strength or an assumed lower limit of the adhesion strength.For example, if the core fails at the bond surface, then the adhesionstrength can be determined directly. However, if the core fails inthe shotcrete or substrate rather than at the bond surface (inter-face), then the adhesion strength is inferred to at least exceedthe measured tensile strength of the failed core. In this experiment,the adhesion strength of the interface with a small value of ‘‘h” islower than the tensile strength of the cement mortar; therefore,failures primarily occur at the interface, which is defined as adhe-sion loss. The adhesion strength of the sawtooth interface increaseswith the parameter ‘‘h” increasing. The increased adhesion
strength of the interface with a large value of ‘‘h” exceeds theinvariable tensile strength of the cement mortar, so failures mostlyappear in the cement mortar, which is specified as cohesion loss.
3.4.3. Percentage of failure modesTo explain the relationship between failure position and mech-
anism at the interface, failure modes under static load is discussed.As seen in Fig. 9, there are ten sawteeth along the diameter. As theapplied load gradually increased, the dish-shaped specimenbreaks. Certain of the sawteeth fail in adhesion at the tooth tip(1) along the interface while others lose cohesion at the tooth root(2) in the cement mortar, as seen in Fig. 9. The percentage of adhe-sion loss and cohesion loss is calculated by the followingequations:
Peradh ¼ NoadhNotot
� 100% ð11Þ
Percoh ¼ NocohNotot
� 100% ð12Þ
where Peradh and Percoh is the percentage of adhesion loss and cohe-sion loss, respectively. Noadh and Nocoh is the number of the sawteethwhich fail in adhesion along the interface and cohesion in thecement mortar, respectively, Notot is the total number of sawteeth,i.e., ten in this experiment.
Fig. 10 shows the static failure results where the solid line rep-resents the actual location of the failures. For the sawteeth, adhe-sion loss is marked with red solid lines and cohesion loss (i.e.,tension failure in cement mortar) with blue ones. For ‘‘h” = 0 mm,as shown in Fig. 10(a), the disc loses its adhesion exactly at theinterface and the percentage of adhesion loss is 100%. For‘‘h” = 0.6 mm in Fig. 10(b), there is only one sawtooth failing in ten-sion within the cement mortar. Adhesion loss accounts for 90%. Asthe value of ‘‘h” increases, the adhesion loss decreases, while cohe-sion loss increases. When ‘‘h” is 1.2 mm, as illustrated in Fig. 10(c),of the ten sawteeth along the interface, six of them fail in adhesionand the rest lose cohesion. The percentage of adhesion loss reducesto 60%. Fig. 10(d) shows that when ‘‘h” is 1.8 mm, the adhesion lossreduces further. The percentage decreases sharply to 30%. For‘‘h” = 2.4 mm and 3.0 mm, almost all the sawteeth split in cementmortar, as seen in Fig. 10(e) and (f). The percentage of adhesionloss is zero. Failures under dynamic load around a given loadingrate 700 GPa s�1 are similar to those under static conditions. Thepercentage of adhesion loss and cohesion loss under a givendynamic load is calculated in a similar way. The percentage ofadhesion loss and cohesion loss under static and dynamic condi-tions is summarized in Fig. 11.

Fig. 10. Different failure modes with different value of ‘‘h”: (a) ‘‘h” = 0 mm; (b) ‘‘h” = 0.6 mm; (c) ‘‘h” = 1.2 mm; (d) ‘‘h” = 1.8 mm; (e) ‘‘h” = 2.4 mm; (f) ‘‘h” = 3.0 mm.
Fig. 11. Percentage of failure modes with geometry parameter ‘‘h”.
222 L. Luo et al. / Tunnelling and Underground Space Technology 65 (2017) 215–224
3.4.4. Explanations on the tendency of bearing capacityAs seen in Fig. 11, under static condition, if the geometry
parameter ‘‘h” is small, ‘‘h” = 0 mm or 0.6 mm. For example, theadhesion strength of the sawtooth interface is less than the tensilestrength of the cement mortar; therefore, the majority is adhesionloss. When the parameter ‘‘h” varies from 0 mm to 0.6 mm, theincreasing adhesion strength contributes more to the bearingcapacity. Therefore, as shown in Fig. 8(a), the peak force increaseswith the parameter ‘‘h” increasing from 0 mm to 0.6 mm. As theparameter ‘‘h” increases to 1.2 mm, the adhesion strength of thesawtooth interface increases as discussed in Section 3.4.1. Theadhesion strength of the sawtooth interface nearly reaches the ten-sile strength of the cement mortar, and both the high adhesionstrength and tensile strength contributes to the bearing capacity;the bearing capacity reaches its maximum. There may be an ‘‘hsta”at which the percentage of adhesion loss and cohesion loss is equal,as seen in Fig. 11. However, this parameter ‘‘hsta” is not included inthis experiment. If the parameter ‘‘h” is larger, i.e., 1.8 mm, 2.4 mmor 3.0 mm, the adhesion strength of the sawtooth interfaceincreases further. It exceeds the tensile strength of the cementmortar. Tension failures occur in the cement mortar and the per-centage of cohesion loss becomes more than 50%. The tensilestrength of the cement mortar plays a more important role in con-tributing to the bearing capacity. Therefore, lower tensile strengthcauses a decrease of bearing capacity, as shown in Fig. 8(a). There isa critical value in the parameter ‘‘h” (1.2 mm) above which thebearing capacity does not increase but decrease as the dominantfailure mode changes from adhesion to cohesion.
Several slight differences were observed under dynamic loadaround a loading rate of 700 GPa s�1. Under the condition of theconstant parameter ‘‘h”, the percentage of adhesion loss under a
dynamic load is always larger than that of a static load. A largerparameter ‘‘hdyn” is observed in Fig. 11 where the percentage ofadhesion loss and cohesion loss is almost equal. This may resultfrom the dynamic effect on the adhesion strength of the interfaceand the tensile strength of the cement mortar. The increment oftensile strength induced by the increasing loading rate is morethan that of adhesion strength. Therefore, if the dynamic adhesionstrength of the interface reaches the dynamic tensile strength of

L. Luo et al. / Tunnelling and Underground Space Technology 65 (2017) 215–224 223
the cement mortar, a larger parameter ‘‘h” is required for the rock-cement combined specimen to reach the maximum bearing capac-ity, i.e., 1.8 mm in this experiment. The DIF of the interface is muchlarger than that of the cement mortar as discussed in Section 3.3;however, the DIF is a ratio of the whole bearing capacity, ratherthan the adhesion strength of the interface.
Fig. 12. Mechanical mechanism of the rock-cement interface.
3.5. Discussion
Austin et al. (1995) studied specimen geometry and demon-strated the effect of drilling depth. Chang and Stille (1995) testedtwo types of waved surfaces: simply waved surface and doublywaved surface. Malmgren and Nordlund (2008) researched theeffect of surface unevenness on the number of failures in the liningand at the interface. These investigations indicated that themechanical behavior of shotcrete is influenced by the roughnessof the substrate surface. However, these discussions on how theroughness of the substrate surface affects mechanical behaviorare not sufficient and quantitative analysis of surface roughnessand bearing capacity was not given. In this paper, six types of rocksurface were designed by varying the geometry parameter ‘‘h”from 0 mm to 3.0 mm at an interval of 0.6 mm per increment,and quantitative results including the bearing capacity-geometryparameter ‘‘h” curve and the percentage of failure modes withrespect to ‘‘h” were obtained. Bearing capacity increases initiallyand then decreases as the parameter ‘‘h” increases from 0 mm to3.0 mm. The bearing capacity reaches maximum value if the adhe-sion strength of the sawtooth interface is equal to the tensilestrength of the cement mortar. An appropriate embedded depthinto the rock is 1.2 mm under static load. The exploration wasextended to the dynamic condition. If a tunnel is excavated byexplosions, the design for shotcrete should consider the effect ofvibrations. The results of this work show its superiority and pro-vide guidelines for workers and designers in tunnel engineering.The results show that the dynamic optimal value of the embeddeddepth ‘‘hdyn” is a little greater, approximately 1.8 mm if the loadingrate is approximately 700 GPa s�1. In Section 3.1, the loading rateeffect of the interface with different ‘‘h” is discussed; the interfacewith different ‘‘h” shows higher sensitivity in different loading rateranges.
As shown in Fig. 12, the bearing capacity of the rock-cementcombined specimens reach peak value if the adhesion strengthof the sawtooth interface is essentially equal to the tensilestrength of the cement mortar. The bearing capacity will decreaseif the adhesion strength is larger or if the tensile strength ishigher. Therefore, during tunnel engineering, if the tensilestrength of shotcrete sprayed onto the rock surface is high, therock surface should be rougher to obtain higher adhesion strengthof the irregularities. An appropriate embedded depth is suggestedduring rock surface preparation. For the cement mortar in thisstudy, if the tunnel is excavated by a tunnel-boring machineand the support design does not need to consider tiny vibrations,the optimum value of the embedded depth in the rock surface is1.2 mm. However, if the blasting method is used for the excava-tion the vibrations cannot be ignored; the appropriate depthincreases to 1.8 mm if the loading rate is approximately700 GPa s�1. Special attention should be paid to the magnitudeof the loading rate if the dynamic load is considered duringdesign. Irregularities are everywhere on the rock surface afterthe excavation operation; the roughness differs depending onthe method used for excavation. Based on the findings in thisstudy, high tensile strength shotcrete is suggested for veryuneven rock surfaces. If the rock surface is slightly rough afterthe excavation, the tensile strength of the sprayed shotcrete canbe slightly lower.
4. Conclusions
This work has extended existing studies on interface roughnessunder static load to the dynamic problem, since the rock-shotcreteinterface is always exposed to dynamic load in a tunnel. To inves-tigate the mechanical properties of the interface, both static anddynamic, Brazilian disc tests were conducted. Different values ofthe geometry parameter ‘‘h” were designed to study the influenceof interface geometry. The results show that the interface bearingcapacity presents an early increase and later decreasing trend withincrease in the geometry parameter ‘‘h” under static condition andat a given loading rate 700 GPa s�1. There is a critical value ingeometry parameter ‘‘h” as the dominant failure mode changesfrom adhesion to cohesion. Interface mechanical behavior is rathersensitive to its geometry. The rock surface should be prepared to areasonable roughness. As a critical factor, an appropriate embed-ded depth of 1.2 mm or 1.8 mm in the rock surface during surfacepreparation is recommended depending on the degree of vibration.The magnitude of the loading rate should be paid special attentionif the dynamic load is considered during the design. This study pro-vides a theoretical basis and useful guidelines for support perfor-mance in tunnel engineering.
Acknowledgments
We acknowledge the financial supports of the State KeyResearch Development Program of China (2016YFC0600706). Theauthors specially thank Qiu Jiadong and Ye Hao for their help inthe experiments.
References
American Concrete Institute (ACI), 2004. ACI 506.4R-94. Guide for the Evaluation ofShotcrete. ACI Committee 506. p. 15.
Ahmed, L., 2012. Models for Analysis of Shotcrete on Rock Exposed to Blasting. KTHStructural Engineering, Stockholm.
Ahmed, L., Ansell, A., 2012. Structural dynamic and stress wave models for theanalysis of shotcrete on rock exposed to blasting. Eng. Struct. 35, 11–17.
Ahmed, L., Ansell, A., 2014. Vibration vulnerability of shotcrete on tunnel wallsduring construction blasting. Tunn. Undergr. Space Technol. 42, 105–111.
Ahmed, L., Malm, R., Ansell, A., 2012. Finite element simulation of shotcrete exposedto underground explosions. Nordic Concr. Res. 45, 59–74.
Ahn, K.C., Shin, J.K., Kim, J.D., Won, K.Y., Kim, T.G., 2004. Support design withmeasuring the adhesion strength of shotcrete. In: Conference Proceeding,Korean Society for Rock Mechanics (KSRM), pp. 31–45.
Ansell, A., 2004. In situ testing of young shotcrete subjected to vibrations fromblasting. Tunn. Undergr. Space Technol. 19 (6), 587–596.

224 L. Luo et al. / Tunnelling and Underground Space Technology 65 (2017) 215–224
Ansell, A., 2005. Recommendations for shotcrete on rock subjected to blastingvibrations, based on finite element dynamic analysis. Mag. Concr. Res. 57 (3),123–133.
Ansell, A., 2007a. Shotcrete on rock exposed to large-scale blasting. Mag. Concr. Res.59 (9), 663–671.
Ansell, A., 2007b. Dynamic finite element analysis of young shotcrete in rocktunnels. ACI Struct. J. 104 (1).
Ansell, A., Holmgren, J., 1999. Young shotcrete subjected to blast induced vibrations.In: Nordic Concrete Research, Reykjavik, Iceland, 3–6 August 1999. The NordicConcrete Federation, pp. 211–213.
Austin, S., Robins, P., Pan, Y., 1995. Tensile bond testing of concrete repairs. Mater.Struct. 28 (5), 249–259.
Barrett, S.V.L., McCreath, D.R., 1995. Shotcrete support design in blocky ground:towards a deterministic approach. Tunn. Undergr. Space Technol. 10 (1), 79–89.
Chang, Y., Stille, H., 1995. Shotcrete as a tunnel lining – a laboratory study. In: 8thISRM Congress. International Society for Rock Mechanics.
Chen, C.S., Pan, E., Amadei, B., 1998. Determination of deformability and tensilestrength of anisotropic rock using Brazilian tests. Int. J. Rock Mech. Min. Sci. 35(1), 43–61.
Dai, F., Xia, K., 2010. Loading rate dependence of tensile strength anisotropy of Barregranite. Pure Appl. Geophys. 167 (11), 1419–1432.
EFNARC Technical Committee, 1999. European Specification for Sprayed Concrete.GUIDELINES for Specifiers and Contractors.
GB, 2001. Specifications for Bolt-shotcrete Support (in Chinese).Hindo, K.R., 1990. In-place bond testing and surface preparation of concrete. Concr.
Int. 12 (4), 46–48.ISRM, 1978. Suggested methods for determining tensile strength of rock materials.
Int. J. Rock Mech. Min. Sci. 15, 99–103.Kuchta, M.E., 2002. Quantifying the increase in adhesion strength of shotcrete
applied to surfaces treated with high-pressure water. Trans.-Soc. Min. Metall.Explor. Incorp. 312, 129–132.
Li, X.B., Lok, T.S., Zhao, J., et al., 2000. Oscillation elimination in the Hopkinson barapparatus and resultant complete dynamic stress–strain curves for rocks. Int. J.Rock Mech. Min. Sci. 37 (7), 1055–1060.
Li, X.B., Zhou, Z.L., Hong, L., et al., 2009. Large diameter SHPB tests with a specialshaped striker. ISRM News J. 12, 76–79.
Malmgren, L., Nordlund, E., Rolund, S., 2005. Adhesion strength and shrinkage ofshotcrete. Tunn. Undergr. Space Technol. 20 (1), 33–48.
Malmgren, L., Nordlund, E., 2008. Interaction of shotcrete with rock and rock bolts—a numerical study. Int. J. Rock Mech. Min. Sci. 45 (4), 538–553.
Nakano, N., Okada, S., Furukawa, K., Nakagawa, K., 1993. Vibration and cracking oftunnel lining due to adjacent blasting. Proc. Jpn. Soc. Civil Eng. 3 (1), 53–62 (inJapanese, Abstract in English).
Ozturk, H., Tannant, D.D., 2011. Influence of rock properties and environmentalconditions on thin spray-on liner adhesive bond. Int. J. Rock Mech. Min. Sci. 48(7), 1196–1198.
Seymour, B., Martin, L., Clark, C., et al., 2011. A shotcrete adhesion test system formining applications. Soc. Min. Metall. Explor. 2010 Trans. 328, 533–541.
Son, M., 2013. Adhesion strength at the shotcrete-rock contact in rock tunneling.Rock Mech. Rock Eng. 46 (5), 1237–1246.
Talbot, C., Pigeon, M., Beaupré, D., et al., 1995. Influence of surface preparation onlong-term bonding of shotcrete. ACI Mater. J. 91 (6).
Timoshenko, S.P., Goodier, J.N., 1970. Theory of Elasticity. McGraw Hill, New York.Wang, Q.Z., Li, W., Song, X.L., 2006. A method for testing dynamic tensile strength
and elastic modulus of rock materials using SHPB. Pure Appl. Geophys. 163 (5–6), 1091–1100.
Weerheijm, J., Van Doormaal, J., 2007. Tensile failure of concrete at high loadingrates: new test data on strength and fracture energy from instrumented spallingtests. Int. J. Impact Eng. 34 (3), 609–626.
Yan, F., Feng, X.T., Chen, R., et al., 2012. Dynamic tensile failure of the rock interfacebetween tuff and basalt. Rock Mech. Rock Eng. 45 (3), 341–348.
Zhang, Q.B., Zhao, J., 2014. A review of dynamic experimental techniques andmechanical behaviour of rock materials. Rock Mech. Rock Eng. 47 (4), 1411–1478.
Zhao, J., Li, H.B., 2000. Experimental determination of dynamic tensile properties ofa granite. Int. J. Rock Mech. Min. Sci. 37 (5), 861–866.
Zhou, Z., Li, X., Liu, A., et al., 2011. Stress uniformity of split Hopkinson pressure barunder half-sine wave loads. Int. J. Rock Mech. Min. Sci. 48 (4), 697–701.
Zhou, Z., Ma, G., Li, X., 2007. Dynamic Brazilian splitting and spalling tests forgranite. In: 11th ISRM Congress. International Society for Rock Mechanics, 2007.

本文献由“学霸图书馆-文献云下载”收集自网络,仅供学习交流使用。
学霸图书馆(www.xuebalib.com)是一个“整合众多图书馆数据库资源,
提供一站式文献检索和下载服务”的24 小时在线不限IP
图书馆。
图书馆致力于便利、促进学习与科研,提供最强文献下载服务。
图书馆导航:
图书馆首页 文献云下载 图书馆入口 外文数据库大全 疑难文献辅助工具