tuning oem templates v3 rmoug final
TRANSCRIPT

Tuning OEM Templates

2/25/2015 2www.datavail.com
OEM Monitoring Templates
OEM is not a “turn it on and forget it” monitoring tool.
• You need to continuously tune it to keep it running efficiently.
Basic templates are not often suited for everyone’s environment with some “tweaking” but how do you know what the thresholds should be?
In working directly with our largest customers, many of whom have well over 3000 individual targets.
We have gained a large amount of experience in reacting to and remediating the root causes of many thousands of alerts per week.
Analyzing patterns within hundreds of alerts per day, and thousands of alerts per week becomes difficult, if not impossible
Using some sort of alert data grouping, filtering, and sorting is the only way.
But these features are not currently available in Oracle’s OEM Grid Control software.

2/25/2015 3www.datavail.com
Let’s get a sense of the things everybody faces
Email in-box gets slammed with an
overwhelming number of OEM alerts?

2/25/2015 4www.datavail.com
Let’s get a sense of the things everybody faces
Had to deal with a Sev. 1 issue because real issues
inside OEM are lost in the ‘noise’ of
unnecessary alerts?

2/25/2015 5www.datavail.com
Let’s get a sense of the things everybody faces
Ever tried to go into their OEM repository and count the number of
alerts for your databases?
Who has been successful?
2/25/2015 6www.datavail.com
Let’s get a sense of the things everybody faces
Ever tried showing or demonstrating the
amount of effort it takes to deal with OEM alerts?
Boss, Peer, Direct Report, Development Team, Customer

2/25/2015 7www.datavail.com
The Problem of Ignoring The Problem
75-80% of time is spent on production support
This Leaves….
20-25% of a DBA’s time is available for
Engineering, Architecture, Integration into
Apps teams
• Senior DBAs end up doing Production support work• This leads to job dissatisfaction & turnover
Today is about confronting some of the things that prevent you from being that senior DBA
2/25/2015 8www.datavail.com
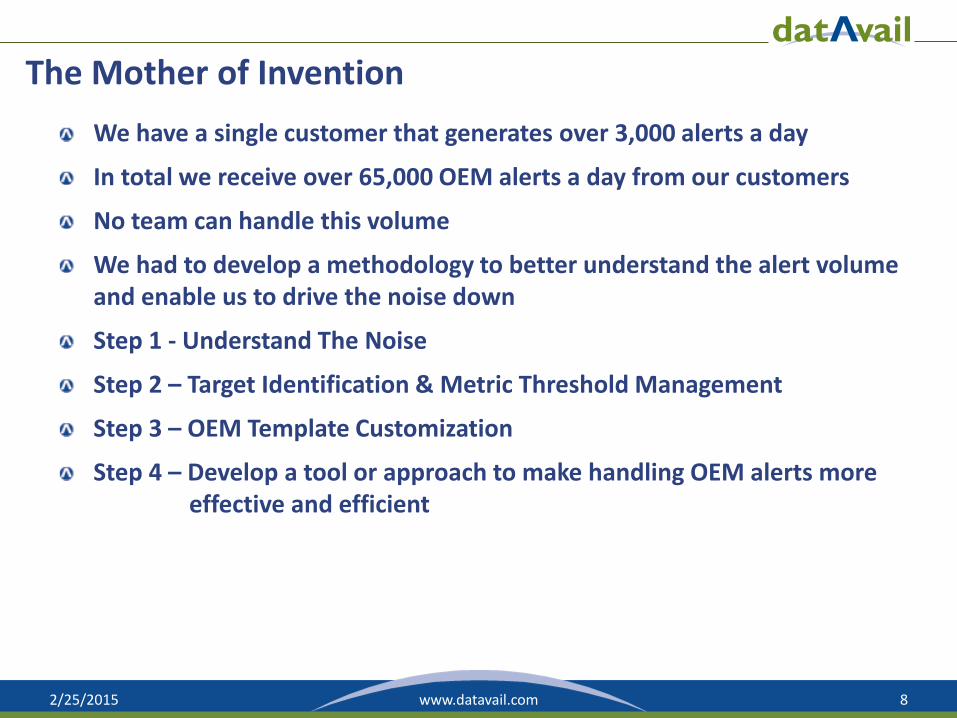
The Mother of Invention
We have a single customer that generates over 3,000 alerts a day
In total we receive over 65,000 OEM alerts a day from our customers
No team can handle this volume
We had to develop a methodology to better understand the alert volume and enable us to drive the noise down
Step 1 - Understand The Noise
Step 2 – Target Identification & Metric Threshold Management
Step 3 – OEM Template Customization
Step 4 – Develop a tool or approach to make handling OEM alerts more effective and efficient

2/25/2015 9www.datavail.com
Why Isn't OEM Enough?
Enhance Oracle’s OEM Grid Control by delivering a tool that reports on and drills into the sources of the historical alert volume data across the entire enterprise
Take advantage of Datavail’s unique OEM Grid repository queries which probe the OEM database for alert history, alert target information and alert timings.
Assemble this data into a filterable and sortable data model that visualizes the alert data. This allows for isolating the most offensive alert targets.
Ultimately, the regular and repeated analysis of this visualized data is a “feedback control mechanism” that enables revisiting the offending target’s metric thresholds.
• Allows those metric thresholds to be further tuned resulting in substantial reduction of alert volume coming from OEM Grid.

2/25/2015 10www.datavail.com
OEM Repository
Starting With the Repository
SQLScript

2/25/2015 11www.datavail.com
Improving on The Templates
By having access to this properly assembled visual repository data and by consistently using it in a “feedback mode” to tweak the target thresholds, or eliminate useless and noisy target monitoring completely, we have reduced our customers alert volume by 50% or more.
Organizing the alerts by the categories below quickly allows us to see what is happening with alert volumes.• Volume by Day
• Volume by Week
• Volume by Target Name
• Volume by Metric Name
• Hourly Alert Volume
Datavail’s Alert Optimizer allows the DBA and infrastructure support teams to further refine their OEM Grid template definitions which are pushed out to multiple targets.
Having customized OEM Grid templates is by far the most efficient method to stop the initial onslaught of questionable alerts when one or more targets are brought online for monitoring.
The OEM Alert Optimizer significantly adds to the value of OEM Grid Control (10g) Cloud Control (12c) and allows one to fully leverage the tool’s monitoring flexibility so that support staff can spend their time addressing only properly tuned alerts that fire when targets are truly “in trouble”.

2/25/2015 12www.datavail.com
Editing the Templates
Case Study

2/25/2015 14www.datavail.com
“Acme” Alert Volume By Week

2/25/2015 15www.datavail.com
Alert Volume By Week: Skyscraper View

2/25/2015 16www.datavail.com
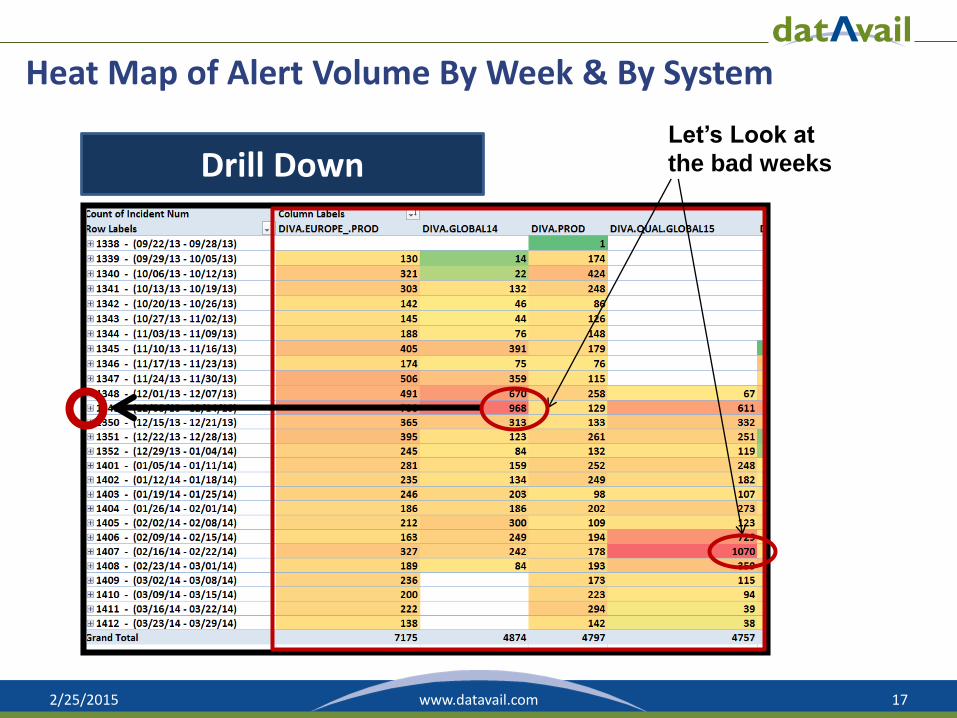
Heat Map of Alert Volume By Week & By System
By Week By System
Volume Heat MapLet’s Look at
the bad weeks
2/25/2015 17www.datavail.com
Heat Map of Alert Volume By Week & By System
Let’s Look at
the bad weeksDrill Down

2/25/2015 18www.datavail.com
Drill Down: Sources of Weekly Alerts
Metric
Name
We see that 919 alerts out of 968 are due to Blocking Session Count:
Where are they coming from?

2/25/2015 19www.datavail.com
Drill Down: Sources of Weekly Alerts
Metric
Name
We see that 919 alerts out of 968 are due to Blocking Session Count:
Where are they coming from?

2/25/2015 20www.datavail.com
Why & How Is All This Important?
1 Is there a problem in the OEM alert metric thresholds?
2 Is there a problem in the database instance?
3 Is there a problem at the application level?

2/25/2015 21www.datavail.com
What Other Kinds Of Alerts
Alerts Available To Manage
Blocking Session Count Tablespace Space Used (%) Instance Status Programs Max Process Count
status pending_normal pending_standby Voting Disk Alert Log Error
UpDown Status User-Defined String Metric Archive Area Used (%) [HTTP Transaction] Status
Generic Alert Log Error CPU Utilization (%) Programs Min Process Count undeliverable
Generic Internal Error Swap Utilization (%) readyOC4J JVM Instance - Open JDBC Connections
Programs Max CPU Utilization (%)File or Directory Attribute Not Found
Free Logical Memory (%)Global Cache Average CR Block Request Time (centi-seconds)
Filesystem Space Available (%) NumValue new_ocurrences OCR Alert Log Error
Run Queue Length (5 minute average)
totalCPU Generic Incident Session Terminated
erroredLog File Pattern Matched Line Count
Disk Group Used %Global Cache Average Current Block Request Time (centi-seconds)
Completed With Error [Test Response] Status Process Limit Usage (%) Open Instance Count
User Defined Numeric Metric User-Defined Numeric Metric Access Violation waiting
ReadyMsg Out of Memory site_level_profile_options_changed[HTTP Transaction] Perceived Time per Page (ms)
File or Directory Size (MB)OC4J JVM Instance - Heap Usage (MB)
context_file_edited Session Terminated Alert Log Error
StrValue Tablespace Free Space (MB) Unmounted Session Limit Usage (%)

Alert Optimizer Roadmap

2/25/2015 23www.datavail.com
Your 10g, 11g or 12c
OEM Repository
Proof of Concept: 3 Years + Excel
SQLScript

2/25/2015 24www.datavail.com
Proof of Concept: 3 Years + Excel
2/25/2015 25www.datavail.com
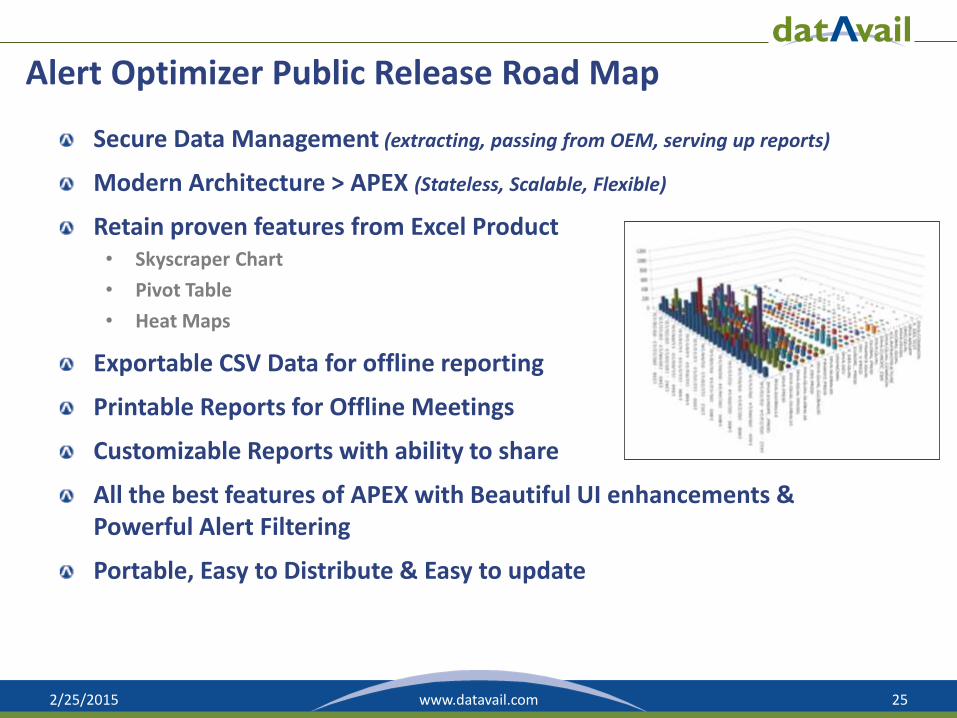
Alert Optimizer Public Release Road Map
Secure Data Management (extracting, passing from OEM, serving up reports)
Modern Architecture > APEX (Stateless, Scalable, Flexible)
Retain proven features from Excel Product• Skyscraper Chart
• Pivot Table
• Heat Maps
Exportable CSV Data for offline reporting
Printable Reports for Offline Meetings
Customizable Reports with ability to share
All the best features of APEX with Beautiful UI enhancements & Powerful Alert Filtering
Portable, Easy to Distribute & Easy to update

2/25/2015 26www.datavail.com
Complete Ready Virtual Appliance
Alert Optimizer Framework
Your 10g, 11g or 12c
OEM Repository
Alert Optimizer Early Preview

2/25/2015 28www.datavail.com
Alert Optimizer in Action
Dynamic Skyscraper Chart
Dynamic Heat Map by Week Series

2/25/2015 29www.datavail.com
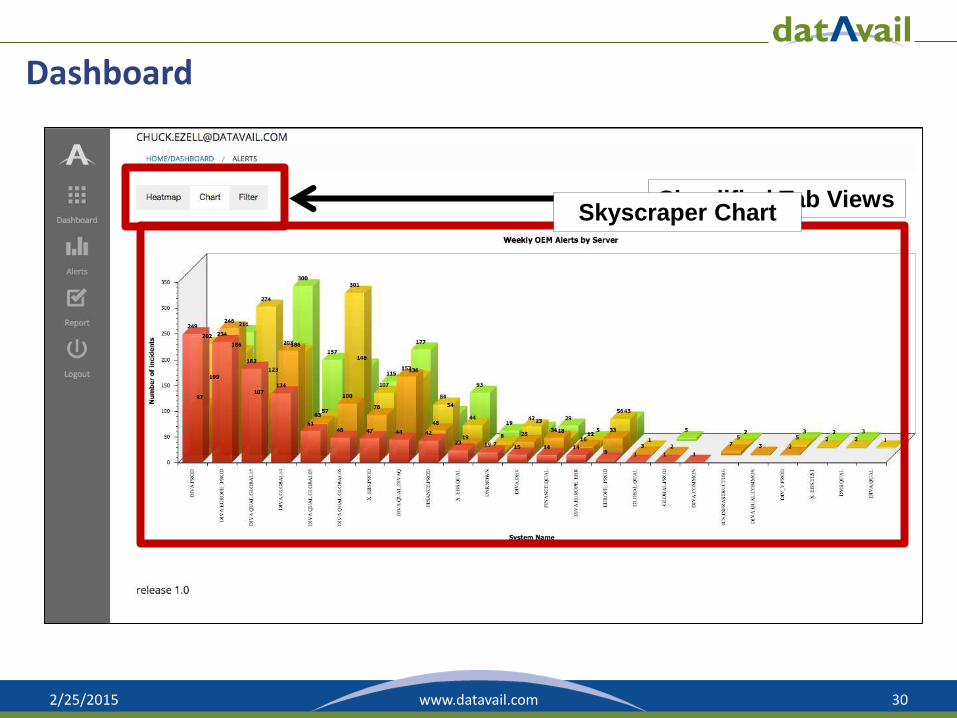
Dashboard
Default Views
Simplified Controls
2/25/2015 30www.datavail.com
Dashboard
Simplified Tab ViewsSkyscraper Chart
2/25/2015 31www.datavail.com
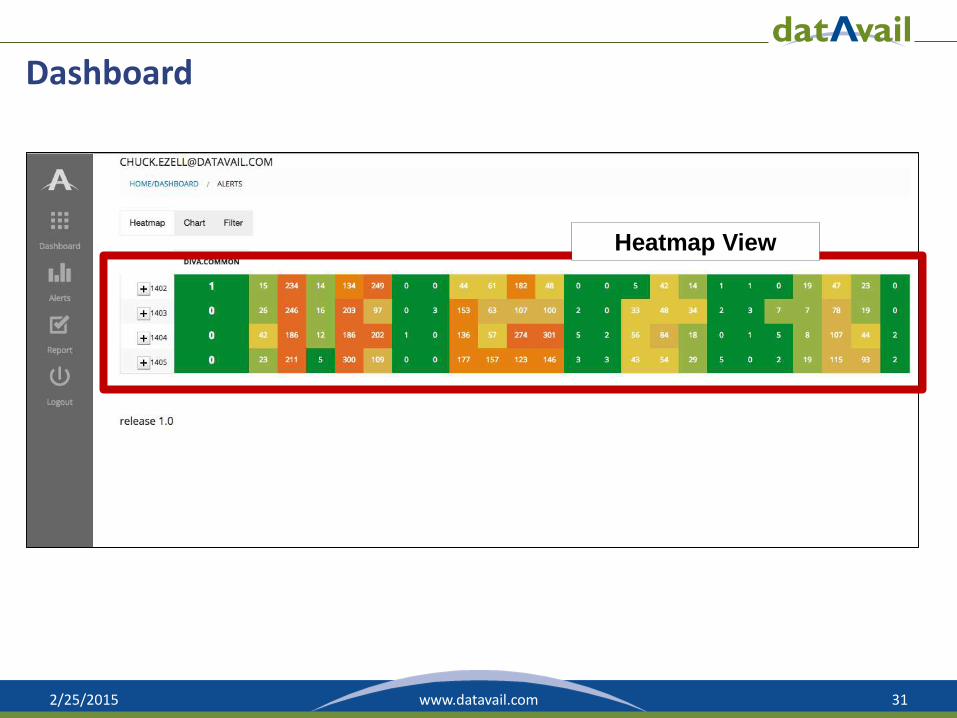
Dashboard
Heatmap View

2/25/2015 32www.datavail.com
DashboardClicking Bar in Chart
or Alert Count in Heat
Map Drills down to
Details

2/25/2015 33www.datavail.com
Dashboard
Simplified Filters
Select Date Range

2/25/2015 34www.datavail.com
Drill Down Customizable Reporting

2/25/2015 35www.datavail.com
Edit Columns in Drill Down Reports
Add or Remove
Reporting Columns

2/25/2015 36www.datavail.com
Multiple Reports Easily Available
Select Prebuilt Reports

2/25/2015 37www.datavail.com
Customize Look, Groupings, Filters and more
Search for Any Detail
Contextual Actions Per Report

2/25/2015 38www.datavail.com
Customize Look, Groupings, Filters and more
Limit data by
searching on details
Manage Heat Map
Conditions
2/25/2015 39www.datavail.com
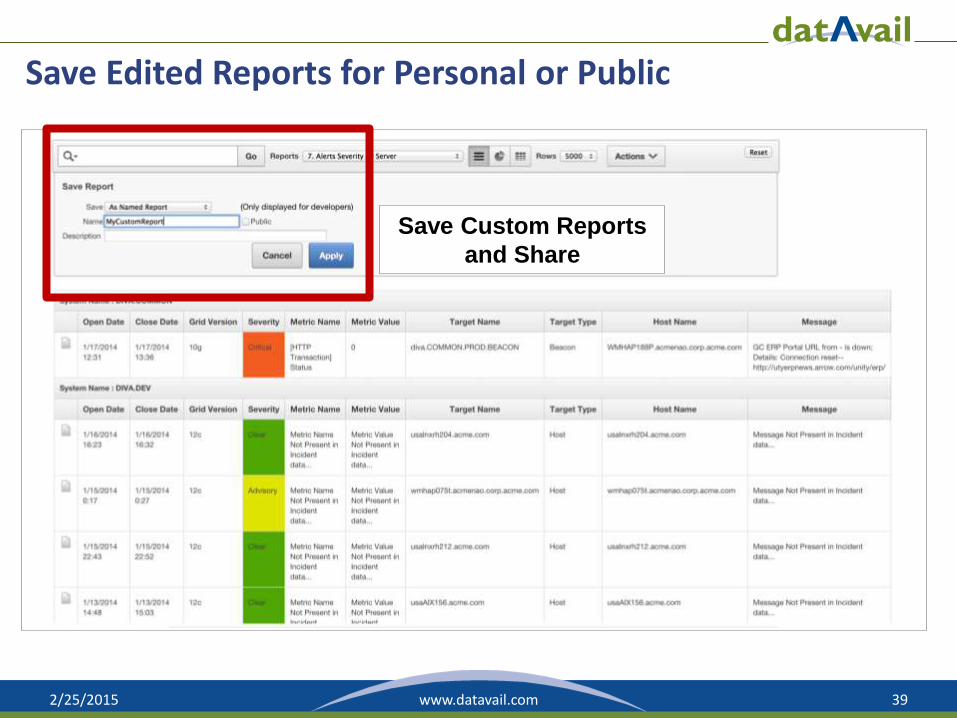
Save Edited Reports for Personal or Public
Save Custom Reports
and Share
2/25/2015 40www.datavail.com
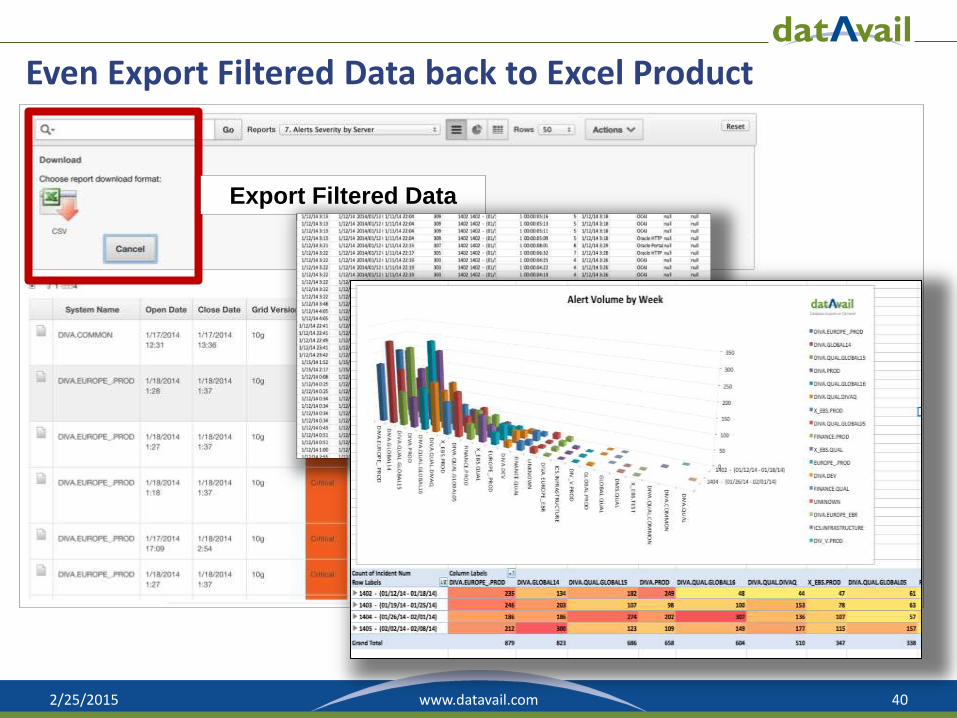
Even Export Filtered Data back to Excel Product
Export Filtered Data


Alert Optimizer Special OfferDon’t forget to visit
http://info.datavail.com/OEMOffer2For your chance to win a free analysis of
your alert history.