tumapel ball room a - repository.maranatha.edu of... · roe bjb islamic bank before and after the...
TRANSCRIPT


TUMAPEL BALL ROOM A
SESI 1
STRATEGIC - BAHASA
NO NAMA INSTITUSI JUDUL PAPER
1 John Tampil Purba
STIE Pengembangan Bisnis & Manajemen Jakarta
SERVICE MANAGEMENT STRATEGY BY IMPLEMENTING THE ACADEMIC INFORMATION SYSTEM IN INDONESIA
HIGHER EDUCATION
2 Nurul Aini; Santianingrum
Soebandhi
Universitas Narotama (Doctoral UNAIR)
CULTURAL DIMENSION AND CORPORATE SOCIAL RESPONSIBILITY
3 Florentina Andre; M. Sienly Veronica
Universitas Kristen Maranatha
ANALYSIS THE RELATIONSHIP BETWEEN CORPORATE SOCIAL RESPONSIBILITY AND THE WELFARE SOCIETY PT
X IN BANDUNG
4 Ria Satyarini; Amelia Setyawan
Unika Parahyangan
CLUSTER STRATEGY AS A SUSTAINABLE COMPETITIVE ADVANTAGE FOR SMALL AND MICRO BUSINESSES

TUMAPEL BALL ROOM A
SESI 2
OPERATION AND STRATEGIC - ENGLISH
NO NAMA INSTITUSI JUDUL PAPER
1 Rorim Panday
Universitas Pakuan Bogor
SERVICE QUALITY ANALYSIS OF ARGO PARAHYANGAN TRAIN AS A TOOL FOR IMPROVING THE SERVICE
2 Prof, Dr. Phan Thi Hong Xuan
Faculty of Anthropology HCMUSSH, VNU
VIETNAM’S URBAN ENVIROMENTAL MANAGEMENT IN GLOBALIZATION WITH SOME ASIAN COUNTRIES’S
EXPERIENCE (FROM AN ANTHROPOLOGICAL PERSPECTIVE)
3 Maria F. Lies
Ambarwati
BINUS
THE ROLE OF CSR IN BUSINESS TO ACHEVE THE COMPETITIVE ADVANTAGE POSITION
4 Erna Andajani; Rini Oktavera
UBAYA
MODEL DEVELOPMENT STRATEGY FOR THE EFFECT OF GREEN MARKETING CORPORATE IMAGE IN RETAIL
BUSINESS USING GSCA

TUMAPEL BALL ROOM A
SESI 3
STRATEGIC - BAHASA
NO NAMA INSTITUSI JUDUL PAPER 1 Bambang Suratman;
Nadia Asandimitra; Harti
Universitas Negeri Surabaya (UNESA)
MODEL DEVELOPMENT AND STRATEGY FOR SMALL AND MEDIUM INDUSTRIES IN GERBANGKERTOSUSILO
2 Heru Santosa
BINUS
INTERRELATIONSHIP AMONG BUSINESS STRATEGY, ORGANIZATION ARCHETYPES, AND COMPETITIVE
ADVANTAGE
3 Boedi Hartadi Kuslina
UK Maranatha Bandung
GREEN BUSINESS MODEL: A HOLISTIC APPROACH TO BECOME A GREEN BUSINESS
4 Nurita Andriani
Universitas Trunojoyo Madura
SOCIAL CAPITAL, HUMAN CAPITAL, AND THE MEDIATING ROLE OF STRATEGY ON FIRM
PERFORMANCE

TUMAPEL BALL ROOM A
SESI 4
FINANCE, OPERATION, STRATEGIC, MARKETING - BAHASA
NO NAMA INSTITUSI JUDUL PAPER
1 Lely Fera Triani
Universitas Terbuka, Jakarta
MACROECONOMIC FACTORS INFLUENCE OF COMPOSITE STOCK PRICE INDEX VALUE SHARES TRANSACTIONS AS AN INTERVENING VARIABLE
2 Novan Reza Pahlevi
UNDIP
BUS RAPID TRANSIT AS A SOLUTION FOR
TRANSPORTATION PROBLEM IN SEMARANG
3 Fauzan
UN Kanjuruhan Malang
FUNDAMENTAL OF VIRTUE ON CORPORATE SOCIAL RESPONSIBILITY
4 Linda Herawati,
Benny Lianto, Evita Tania
UBAYA
Green Business Plan by Reducing Packaging Waste in Food and Beverage Industry in Surabaya
5 Albert Louis Hanjaya, DudiAnandya,
Christina R. Honantha
Ubaya
THE IMPACT OF CONSUMER PERCEPTION FIT AND CORE BRAND ATTITUDE ON PURCHASE INTENTION
TOWARD MICROSOFT EXTENDED PRODUCT
TUMAPEL BALL ROOM B
SESI 1
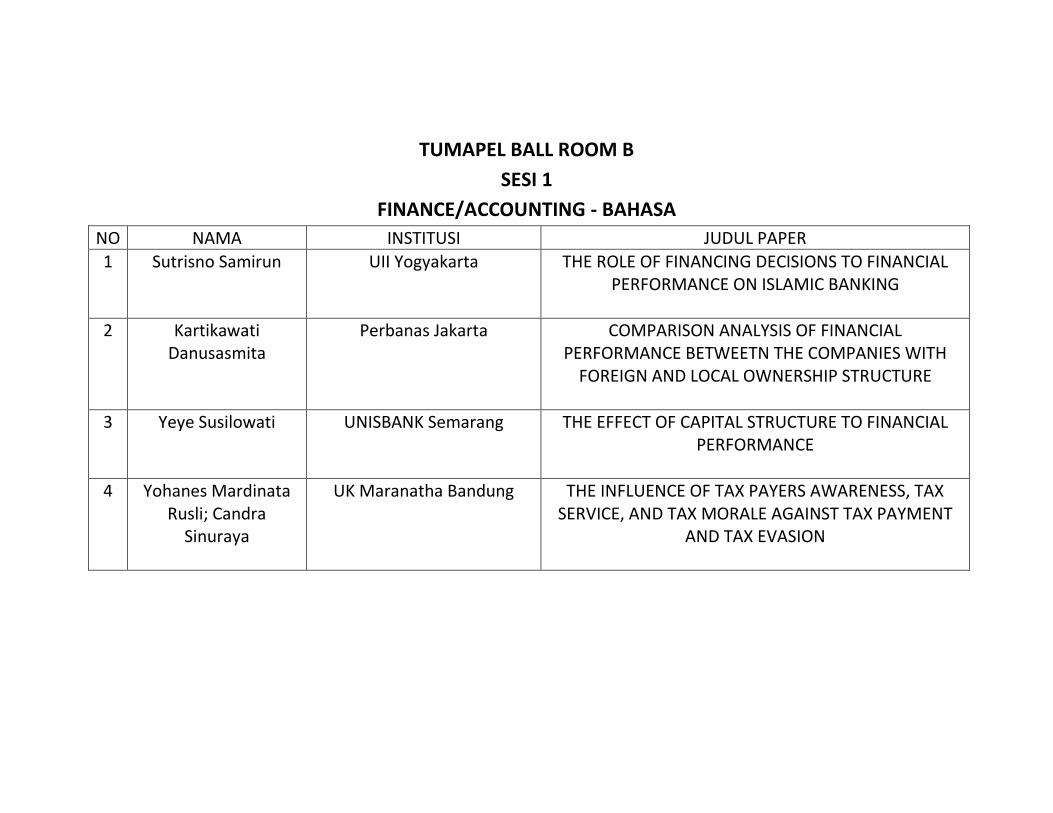
FINANCE/ACCOUNTING - BAHASA
NO NAMA INSTITUSI JUDUL PAPER
1 Sutrisno Samirun
UII Yogyakarta
THE ROLE OF FINANCING DECISIONS TO FINANCIAL PERFORMANCE ON ISLAMIC BANKING
2 Kartikawati Danusasmita
Perbanas Jakarta
COMPARISON ANALYSIS OF FINANCIAL PERFORMANCE BETWEETN THE COMPANIES WITH
FOREIGN AND LOCAL OWNERSHIP STRUCTURE
3 Yeye Susilowati
UNISBANK Semarang
THE EFFECT OF CAPITAL STRUCTURE TO FINANCIAL PERFORMANCE
4 Yohanes Mardinata
Rusli; Candra Sinuraya
UK Maranatha Bandung
THE INFLUENCE OF TAX PAYERS AWARENESS, TAX SERVICE, AND TAX MORALE AGAINST TAX PAYMENT
AND TAX EVASION

TUMAPEL BALL ROOM B
SESI 2
FINANCE/ACCOOUNTING - BAHASA
NO NAMA INSTITUSI JUDUL PAPER
1 I Nyoman Putra Yasa
UN Mahasaraswati Denpasar
THE EFFECT OF REPUTATION, ETHICS, SELF ESTEEM AND RISK PREFERENCES ON BUDGETARY SLACK
MANAGERS BANK PERKREDITAN RAKYAT (BPR) IN BALI
2 Reza Widhar Pahlevi; Sutrisno
UII Yogyakarta
ANALYSIS OF FACTORS AFFECTING THE STOCK UNDERPRICING CASES OF INITIAL PUBLIC OFFERING IN
INDONESIA STOCK EXCHANGE
3 I Putu Edy Arizona
UN Mahasaraswati Denpasar
THE INFLUENCE OF COMPLEXITY OF OPERATION ON THE AUDIT DELAY
4 I Gede Cahyadi Putra
UN Mahasaraswati Denpasar
THE INFLUENCE OF THE COMPONENTS OF INTERNAL CONTROL STRUCTURE ON CREDIT EFFICIENCY ON
LOCAL CREDIT INSTITUTIONS IN DENPASAR

TUMAPEL BALL ROOM B
SESI 3
FINANCE/ACCOOUNTING - BAHASA
NO NAMA INSTITUSI JUDUL PAPER
1 Dwi Puryati
STIE Ekuitas Bandung
EFFECT OF FINANCIAL PERFORNAMCE TO CORPORATE SOCIAL RESPONSIBILITY WITH GOOD CORPORATE
GOVERNANCE MECHANISM AS MODERATING VARIABLE
2 Amelia Setyawan; Ria Satyarini
Unika Parahyangan
SOCIAL RETURN ON INVESTMENT AND ECONOMIC INCENTIVES IN PUBLIC COMPANIES
3 Novi Khoiriawati;
Dian Anita Nuswantara; Tri
Agastya Kharismawati
Universitas Negeri Surabaya (UNESA)
EFFECT OF FINANCIAL LITERACY ON STUDENTS CONSUMPTIVE BEHAVIOR
4 Reni Marlina
STIE Ekuitas Bandung
EVALUATING CORPORATE SOCIAL RESPONSIBILITY TO FINANCIAL PERFORMANCE IN BANKING COMPANIES

TUMAPEL BALL ROOM B
SESI 4
FINANCE/ACCOUNTING - BAHASA
NO NAMA INSTITUSI JUDUL PAPER 1 Eka Handriani
UNDIP
IMPLEMENTATION OF SOCIAL RESPONSIBILITY
DIVERSIFIED (SRD) TO IMPROVE FIRM VALUE: STUDY IN CORPORATE GOVERNANCE STRUCTURE
2 Dini Arwaty
Universitas Widyatama,
Bandung
ANALYSIS OF INFLUENCE OF PERFORMANCE AUDIT TO PUBLIC SERVICE QUALITY AT SOCIAL HEALTH
INSURANCE
3 Rosemarie Sutjiati
UK Maranatha Bandung
EFFECT OF NET PROFIT MARGIN, OPERATING PROFIT MARGIN, ECONOMIC VALUE ADDED, AND EARNING PER SHARE TO STOCK PRICE OF PHARMACEUTICAL
INDUSTRY COMPANIES LISTED IN INDONESIAN FOREIGN EXCHANGE IN 2008-2011 PERIODS
4 Yudi Wahyudin Suwandi
STIE Ekuitas Bandung
FINANCIAL PERFORMANCE ANALYSIS OF ROA AND ROE BJB ISLAMIC BANK BEFORE AND AFTER THE SPIN
OFF
5 Mohammad Fakhruddin
UN Kanjuruhan Malang
THE INFLUENCE OF SOCIAL CAPITAL ON LOAN PAYMENT BEHAVIOR COMMUNITY SELF HELP GROUP

Mudzakkir
TUMAPEL BALL ROOM C
SESI 1
FINANCE/ACCOUNTING - BAHASA
NO NAMA INSTITUSI JUDUL PAPER 1 Isfenti Sadalia; Fivi
Rahmatus Sofiyah
Universitas Sumatra Utara
IMPACT OF FINANCIAL QUALITY AND FIRM SIZE ON CORPORATE FINANCIAL LEVERAGE CHOICE IN
REGIONAL BANK INDONESIA
2 Ni Made Sunarsih
UN Mahasaraswati Denpasar
EFFECT OF PERSONALITY TYPE ON AUDITORS CHARACTERISTIC, WORKLOAD, PROFESSIONAL SKEPTICISM TOWARD THE ABILITY TO DETECT
KECURANGAN
3 Hasanudin
UNDIP
THE EFFECT OF MOMENTUM STRATEGY TO PORTFOLIO PERFORMANCE
4 Lia Amaliawiati; Lasmanah
Faculty of business management
Widyatama University
ANALYSIS THE INFLUENCE OF EFFECTIVENESS INTERMEDIATION FUNCTION BANKS ON EFFICIENCY BANK ( CASE STUDY : CONVENTIONAL BANKS AND
ISLAMIC BANKS IN INDONESIA)
TUMAPEL BALL ROOM C
SESI 2
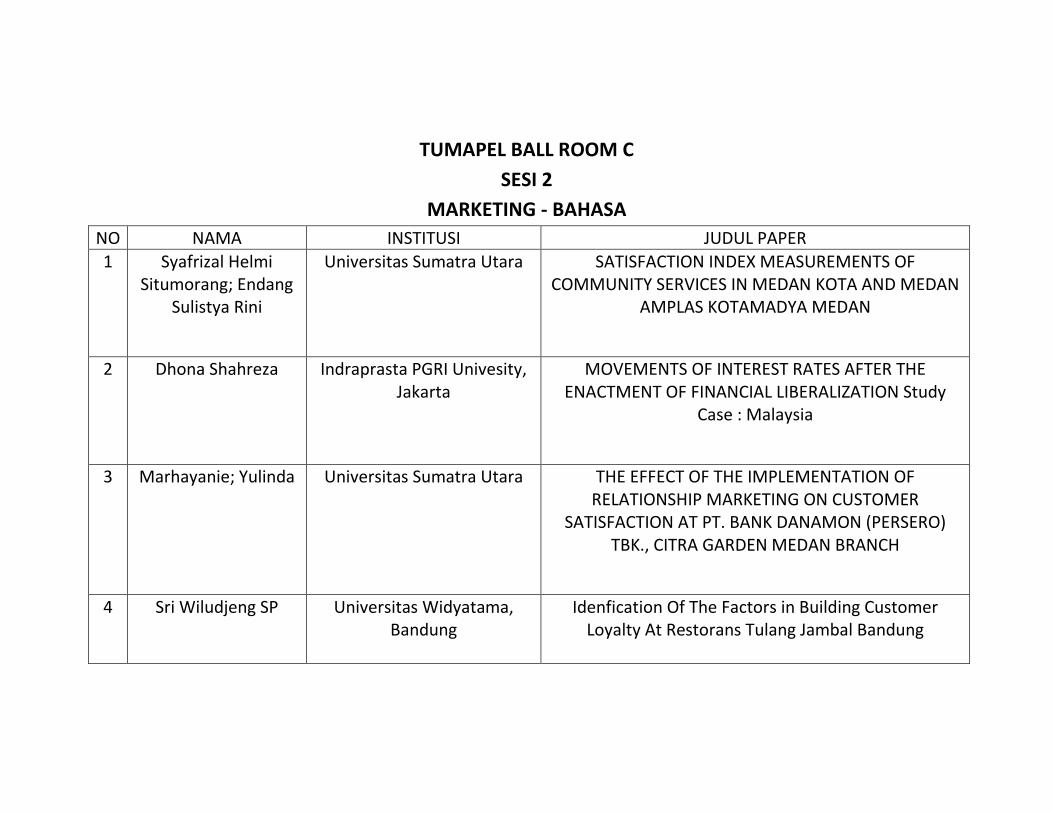
MARKETING - BAHASA
NO NAMA INSTITUSI JUDUL PAPER
1 Syafrizal Helmi Situmorang; Endang
Sulistya Rini
Universitas Sumatra Utara
SATISFACTION INDEX MEASUREMENTS OF COMMUNITY SERVICES IN MEDAN KOTA AND MEDAN
AMPLAS KOTAMADYA MEDAN
2 Dhona Shahreza
Indraprasta PGRI Univesity,
Jakarta
MOVEMENTS OF INTEREST RATES AFTER THE ENACTMENT OF FINANCIAL LIBERALIZATION Study
Case : Malaysia
3 Marhayanie; Yulinda
Universitas Sumatra Utara
THE EFFECT OF THE IMPLEMENTATION OF RELATIONSHIP MARKETING ON CUSTOMER
SATISFACTION AT PT. BANK DANAMON (PERSERO) TBK., CITRA GARDEN MEDAN BRANCH
4 Sri Wiludjeng SP
Universitas Widyatama, Bandung
Idenfication Of The Factors in Building Customer Loyalty At Restorans Tulang Jambal Bandung

TUMAPEL BALL ROOM C
SESI 3
MARKETING AND FINANCE - ENGLISH
NO NAMA INSTITUSI JUDUL PAPER
1 Diana Aqmala; Astohar
UNDIP
THE EFFECT OF RELIGIOSITY DIMENSION TO THE QUALITY AND PRICE CONSUMER ORIENTATION OF
THE INDONESIAN MOSLEM CONSUMER
2 Nyoman Indah Kusuma Dewi
Bali State Polytechnic
CORPORATE SOCIAL RESPONSIBILITY PROGRAMME AS PART OF COMPLEMENTOR RELATIONSHIP IN
HOTELS’ NETWORK: THE CASE OF HOTEL INDUSTRY IN BALI, THE REPUBLIC OF INDONESIA
3 Robby Ardijanto, Indri Hapsari,
Zulaicha Parastuty
UBAYA
Increasing Hypermarket Retail Communication Mix Effectiveness by Digital Catalog
4 Lasmanah; Lia Amaliawati
Universitas Widyatama, Bandung
THE PREDICTION OF FINANCIAL DISTRESS ANALYSIS AND ITS IMPLICATION TO STOCK PRICE'S
TRANSFORTATION SECTOR IN INDONESIA STOCK EXCHANGE 2007-2011

TUMAPEL BALL ROOM C
SESI 4
FINANCE/ACCOUNTING - ENGLISH
NO NAMA INSTITUSI JUDUL PAPER
1 I Made Surya Negara
Universitas Udayana
DETERMINANTS OF BANK LIQUIDITY IN INDONESIA
2 Atika Syuliswati
State Polytechnic of Malang
PERFORMANCE BASED BUDGETING IMPLEMENTATION: CASE STUDY AT STATE
POLYTECHNIC OF MALANG
3 Siti Puryandani
STIE Bank BPD Semarang
ANALYSIS OF CAPITAL STRUCTURE, LUQUIDITY AND EARNINGS GROWTH EARNINGS RESPONSE
COEFFICIENT AGAINST CORPORATE BANKING IN INDONESIA STOCK EXCHANGE
4 Michella Maria Virgine Prayogo, Yie Ke Feliana, Aurelia Carina Christanti
Sutanto
Ubaya
FINANCIAL CONDITION MODERATED THE EFFECTIVENESS OF AUDIT COMMITTEE TO REDUCE
EARNINGS MANAGEMENT
5 Anastasia Fenella Sutanto; Felizia Arni
Ubaya
RELATED PARTY TRANSACTIONS AND EARNINGS MANAGEMENT IN INDONESIAN PUBLICLY LISTED

Rudiawarni
MANUFACTURING COMPANIES PERIOD 2010-2012
TOHJAYA MEETING ROOM
SESI 1
MARKETING/BAHASA
NO NAMA INSTITUSI JUDUL PAPER 1 Dhian Tyas Untari Indraprasta PGRI University,
Jakarta MULTI DIMENSIONAL SCALLING METODE TO
DETERMINE TOURISM POSITIONING OF BENGKULU CITY
2 Dhian Tyas Untari Universitas Indraprasta PGRI Jakarta
ECOPRENEURSHIP: CONCEPT OF RESPONSIBLE ENTREPRENEURSHIP
3 Ria Astuti Andrayani;
Sri Seto; Purwohandoko
Universitas Negeri Surabaya (UNESA)
EFFECT OF BRAND AWARENESS, BRAND ASSOCIATION, AND PERCIEVED QUALITY ON DECISION TO CHOOSE STATE UNIVERSITY IN
SURABAYA
4 Mutia Tri Satya; Lina Said; Abdul Fidayan
STIE Ekuitas Bandung
COMPARISON TRADITIONAL PACKAGING WITH GREEN PACKAGING ON CHIPS INDUSTRY IN
BANDUNG

TOHJAYA MEETING ROOM
SESI 2
MARKETING/BAHASA
NO NAMA INSTITUSI JUDUL PAPER
1 Singgih Santoso
UK Duta Wacana Yogya
AWARENESS AND USAGE OF INTERNET BANKING ANALYSIS AND ITS DEVELOPMENT STRATEGY: CASE
STUDY IN YOGYAKARTA SPECIAL REGION
2 Lindiawatie; Khoirul Umam
Universitas Indraprasta PGRI Jakarta
GREEN MARKETING: ISLAMIC ECONOMIC PRESPECTIVE
3 Maria Mia Kristanti
Unika Widya Mandala
THE INFLUENCE OF GREEN MARKETING AND TRIPPLE
BOTTOM LINE TO COMPETITIVE ADVANTAGES THROUGH SUSTAINABLE MARKETING, CORPORATE
SOCIAL RESPONSIBILITY, BRAND EQUITY, CONSUMER BEHAVIOR AND CONSUMER SOCIAL RESPONSIBILITY
IN HYPERCOMPETITION OF GLOBALIZATION: AN ECONOMIC VALUE-ADDED (EVA) APPROACH
4 Ari Setiyaningrum
UNDIP
CAN THE GOOD CORPORATE ETHICS STATEMENTS AND CORPORATE SOCIAL RESPONSIBILITY (CSR)
CREATE POSITIVE CONSUMER RESPONSES ON THE

COMPANY AND ITS PRODUCTS? A CASE STUDY OF DJARUM'S CSR IN FACULTY OF ECONOMICS AND
BUSINESS DIPONEGORO UNIVERSITY
TOHJAYA MEETING ROOM
SESI 3
MARKETING/BAHASA
NO NAMA INSTITUSI JUDUL PAPER 1 Ritha Dalimunthe
Universitas Sumatra Utara
THE INFLUENCE OF NURSING CARE PATIENT
PERCEPTION TO PATIENT LOYALTY ON 3rd CLASS WARD OF REGIONAL GENERAL HOSPITAL ON BINJAI
OF 2011
2 Widyastuti; Monika Tiarawati
Universitas Negeri Surabaya (UNESA)
THE IMPLEMENTATION OF INFORMATION TECHNOLOGY AND INNOVATION STRATEGY IN
CREATING COMPETITIVE ADVANTAGE IN SMALL AND MEDIUM ENTERPRISES BEADS IN JOMBANG
3 Atin Hafidiah & Dusa Sumartaya
UNPAS Bandung
THE EFFECT OF TAX PROPAGANDA TOWARD TAXPAYER COMPLIANCE OF SMALL BUSINESS
CATEGORY IN KIARACONDONG DISTRICT BANDUNG CITY
4 Arlina Nurbaity Lubis; Yeni Absah
Universitas Sumatra Utara
COMPARATIVE ANALYSIS OF CUSTOMER RELATIONSHIP MANAGEMENT AT GRAND ASTON
HOTEL MEDAN AND POLONIA HOTEL MEDAN AND
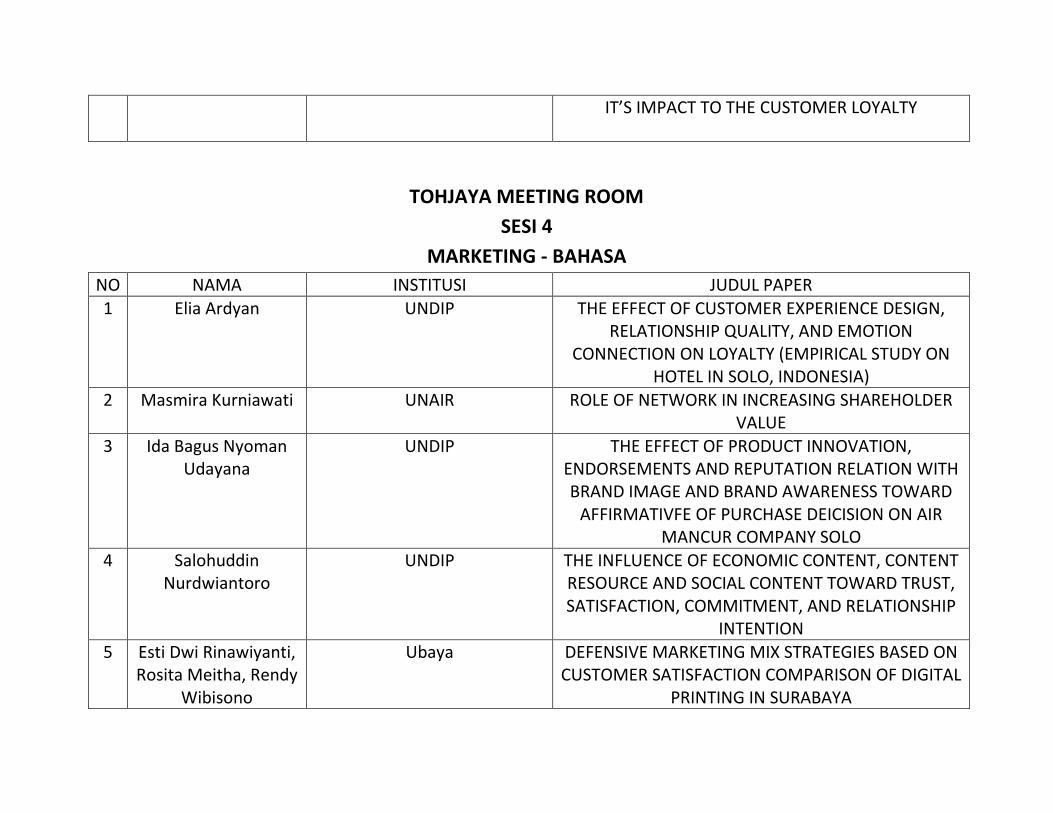
IT’S IMPACT TO THE CUSTOMER LOYALTY
TOHJAYA MEETING ROOM
SESI 4
MARKETING - BAHASA
NO NAMA INSTITUSI JUDUL PAPER
1 Elia Ardyan
UNDIP
THE EFFECT OF CUSTOMER EXPERIENCE DESIGN, RELATIONSHIP QUALITY, AND EMOTION
CONNECTION ON LOYALTY (EMPIRICAL STUDY ON HOTEL IN SOLO, INDONESIA)
2 Masmira Kurniawati
UNAIR
ROLE OF NETWORK IN INCREASING SHAREHOLDER VALUE
3 Ida Bagus Nyoman Udayana
UNDIP
THE EFFECT OF PRODUCT INNOVATION, ENDORSEMENTS AND REPUTATION RELATION WITH BRAND IMAGE AND BRAND AWARENESS TOWARD
AFFIRMATIVFE OF PURCHASE DEICISION ON AIR MANCUR COMPANY SOLO
4 Salohuddin Nurdwiantoro
UNDIP
THE INFLUENCE OF ECONOMIC CONTENT, CONTENT RESOURCE AND SOCIAL CONTENT TOWARD TRUST, SATISFACTION, COMMITMENT, AND RELATIONSHIP
INTENTION
5 Esti Dwi Rinawiyanti, Rosita Meitha, Rendy
Wibisono
Ubaya
DEFENSIVE MARKETING MIX STRATEGIES BASED ON CUSTOMER SATISFACTION COMPARISON OF DIGITAL
PRINTING IN SURABAYA

RANGGAWUNI MEETING ROOM
SESI 1
HUMAN RESOURCES - BAHASA
NO NAMA INSTITUSI JUDUL PAPER
1 Ilham Mubarok Ritongga; Prihatin
Lumbanraja
STIE Harapan Medan; USU
FORMING ORGANIZATIONAL COMMITMENT THROUGH THE FACTORS OF THE PERFORMANCE LECTURERS(A Case Study at Sekolah Tinggi Ilmu
Ekonomi Harapan, Medan)
2 Endy Sarwoko
UN Kanjuruhan Malang
DETERMINING FACTORS OF ENTREPRENEURIAL COMPETENCY
3 Meily Margaretha; Ratna Widiastuti
UK Maranatha Bandung
GREEN HUMAN RESOURCE MANAGEMENT IN THE CREATIVE INDUSTRY
4 Farida Yuliaty
Universitas Sangga Buana, YPKP Bandung
TRIPLE BOTTOM LINE OF BUSINESS AS A PRESPECTIVE BUSINESS ETHICS IN CREATING GREEN
BUSINESS ON THE CORPORATE ORGANIZATION

RANGGAWUNI MEETING ROOM
SESI 2
HUMAN RESOURCES - BAHASA
NO NAMA INSTITUSI JUDUL PAPER
1 Rini Sarianti & Rahmiati
Universitas Negeri Padang
EXAMINING THE INFLUENCE OF ORGANIZATIONAL CLIMATE AND ATTITUDE TOWARD KNOWLEDGE SHARING ON KNOWLEDGE SHARING INTENTION
2 Bambang Suko Priyono; Tristiana
Rijanti
UNISBANK Semarang
THE USE OF PERSON ORGANIZATION FIT AS MODERATING VARIABLE IN RELATION AMONG
QUALITY OF WORK LIFE, ORGANIZATIONAL COMMITMENT, ORGANIZATIONAL CITIZENSHIP
BEHAVIOR AND PERFORMANCE
3 Jun Surjanti
Universitas Negeri Surabaya (UNESA)
ECONOMIC LEARNING BASE EDUCATIONAL FOR SUSTAINABILITY DEVELOPMENT ESD MELALUI
HUTAN MANGROOVE
4 Elisabet Siahaan; Parapat Gultom
Universitas Sumatra Utara
THE IMPACT OF RECRUITMENT SYSTEM, SUCCESSION DEVELOPMENT, TO INCREASE THE EFFECTIVENESS OF THE WORK OF EMPLOYEES
THROUGH COMPENSATION AS VARIABLE

INTERVENING IN NIAGARA HOTEL PARAPAT
RANGGAWUNI MEETING ROOM
SESI 3
HUMAN RESOURCES - BAHASA
NO NAMA INSTITUSI JUDUL PAPER
1 Helmi Buyung Aulia Safrizal
Universitas Trunojoyo Madura
THE IMPACT OF ORGANIZATIONAL COMMITMENT ON JOB SATISFACTION AND EMPLOYEES
PERFORMANCE
2 Maskudi
UNDIP
THE MEDIATING EFFECT OF HIGH PERFORMANCE WORK SYSTEMS IN THE ORGANIZATIONAL CULTURE
AND INFORMATION TECHNOLOGY TOWARDS MANAGERIAL PERFORMANCE: A STUDY AT
COOPERATIVE IN SEMARANG CITY, PROVINCE OF CENTRAL JAVA, INDONESIA
3 Artha Febriana
UNDIP
MODERATING EFFECT OF MOTIVATION ON THE RELATIONSHIP OF EMOTIONAL INTELLIGENCE AND
JOB PERFORMANCE
4 Intan Novela Q. Aini
UNDIP
ORGANIZATION IDENTIFICATION AS A BASIS OF ALUMNI BEHAVIOR SUPPORT ON THEIR ALMA
MATER (Study in Indonesian State University Alumni)

RANGGAWUNI MEETING ROOM (15)
SESI 4
HUMAN RESOURCES - BAHASA
NO NAMA INSTITUSI JUDUL PAPER 1 Helmiatin
Universitas Terbuka, Jakarta
THE EFFECT OF TRANSFORMATIONAL LEADERSHIP
AND QUALITY OF WORK LIFE TOWARD ORGANIZATIONAL CITIZENSHIP BEHAVIOR AT
UNIVERSITAS TERBUKA
2 Friska Sipayung; Lisa Marlina
Universitas Sumatra Utara
DESIGN ORGANIZATION , ORGANIZATIONAL CLIMATE AND BURNOUT ON HOSPITAL
3 Siti Zulaikha Wulandari; Intan
Ratnawati
UNDIP
THE INFLUENCE OF RELIGIOSITY ON GREEN CAMPUS BEHAVIOR
4 Fitri Wulandari
UNDIP
SPIRITUALITY IN WORKPLACE, INDIVIDUAL SPIRITUALITY AND WORK BEHAVIOUR: STUDY OF HIGHER EDUCATION EMPLOYEES IN INDONESIA
5 Sri Mulyati Universitas Terbuka, Jakarta DETERMINANTS OF LEARNING ORIENTATION AND

MOTIVATION ON EMPLOYEES PERFORMANCE
ANUSAPATI A
SESI 1
MARKETING - ENGLISH
NO NAMA INSTITUSI JUDUL PAPER
1 Sulhaini
Universitas Mataram
MAPPING ORGANIZATIONAL CULTURE AND RELATIONAL CAPABILITY OF SMALL AND MEDIUM
SIZED ENTERPRISES IN LOMBOK INDONESIA
2 Resanti Lestari
Politeknik Piksi Ganesha Bandung
INTEGRATED MARKETING COMMUNICATION AS A CONCEPTIUAL MODEL TO BUILD POTENTIAL
MARKETSHARE
3 Muchsin Muthohar
UII Yogyakarta
THE INFLUENCE OF PRODUCT AND SERVICE QUALITY, LOCATION AND CSR PROGRAM TOWARD
CUSTOMER SATISFACTION
4 Kardison Lumban Batu; Yoestini
UNDIP
FIRM ADVANTAGES-BASED SCR: STRATEGY TO SUSTAIN & MAINTAIN GREEN BUSINESS
PERFORMANCE
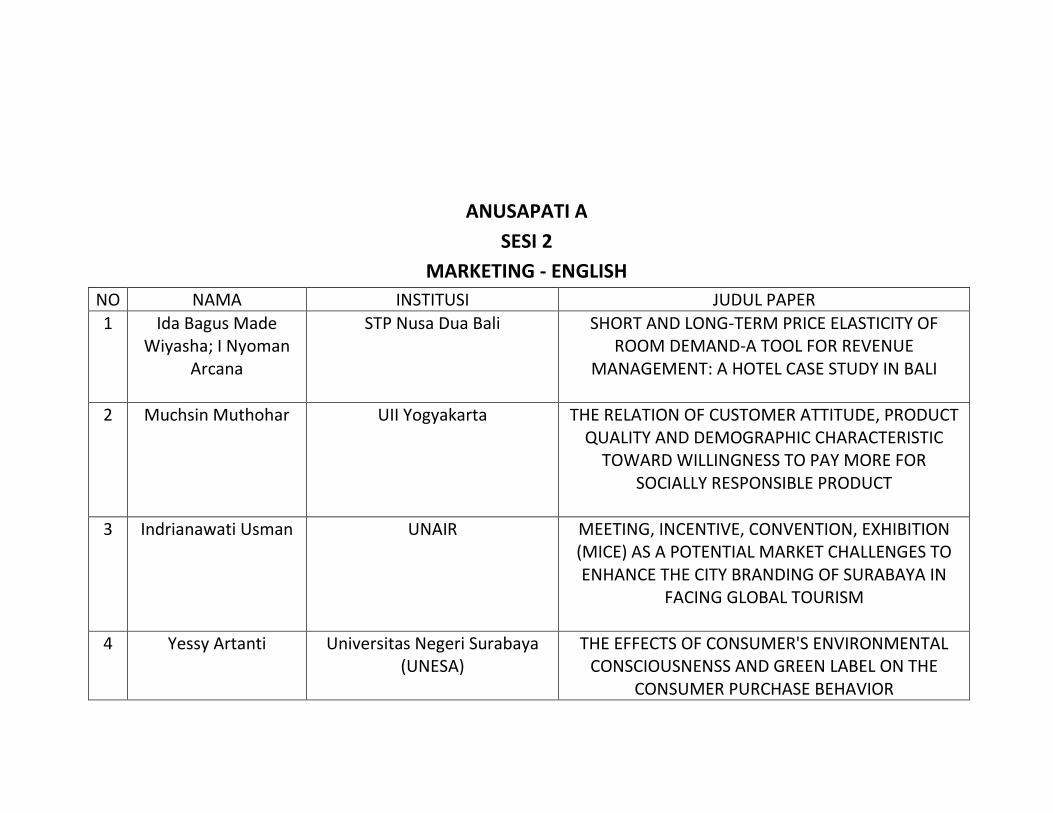
ANUSAPATI A
SESI 2
MARKETING - ENGLISH
NO NAMA INSTITUSI JUDUL PAPER
1 Ida Bagus Made Wiyasha; I Nyoman
Arcana
STP Nusa Dua Bali
SHORT AND LONG-TERM PRICE ELASTICITY OF ROOM DEMAND-A TOOL FOR REVENUE
MANAGEMENT: A HOTEL CASE STUDY IN BALI
2 Muchsin Muthohar
UII Yogyakarta
THE RELATION OF CUSTOMER ATTITUDE, PRODUCT QUALITY AND DEMOGRAPHIC CHARACTERISTIC
TOWARD WILLINGNESS TO PAY MORE FOR SOCIALLY RESPONSIBLE PRODUCT
3 Indrianawati Usman
UNAIR
MEETING, INCENTIVE, CONVENTION, EXHIBITION (MICE) AS A POTENTIAL MARKET CHALLENGES TO ENHANCE THE CITY BRANDING OF SURABAYA IN
FACING GLOBAL TOURISM
4 Yessy Artanti
Universitas Negeri Surabaya (UNESA)
THE EFFECTS OF CONSUMER'S ENVIRONMENTAL CONSCIOUSNENSS AND GREEN LABEL ON THE
CONSUMER PURCHASE BEHAVIOR
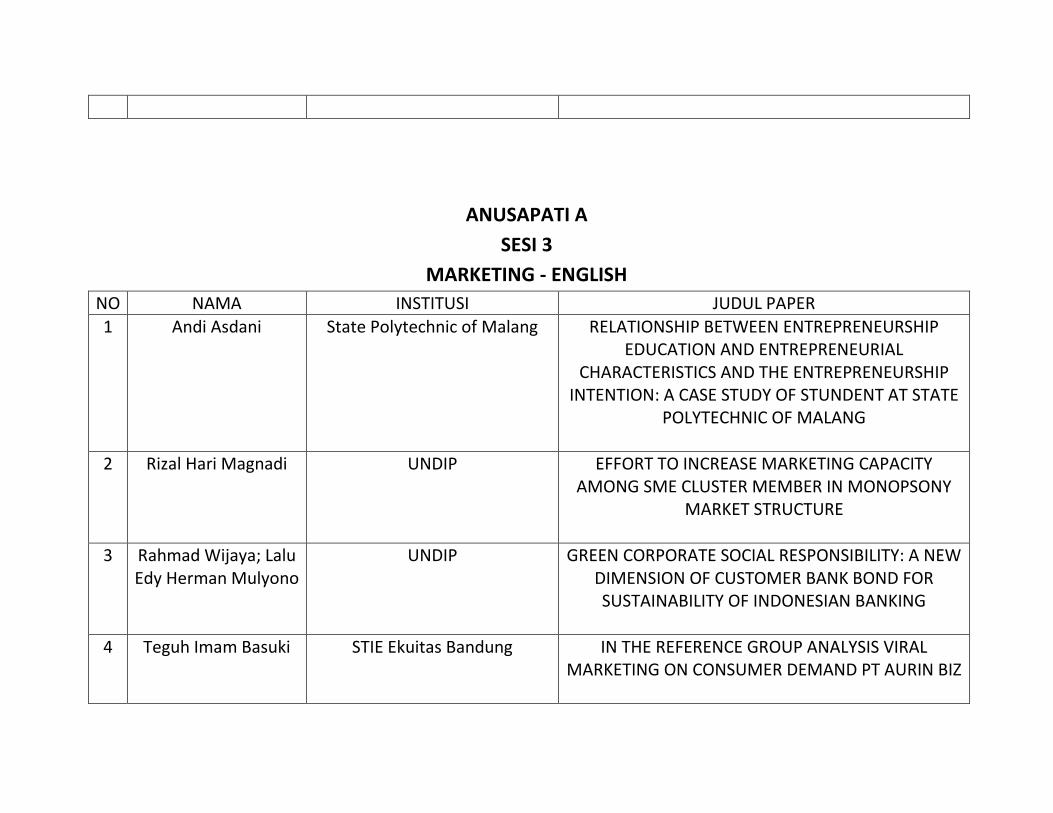
ANUSAPATI A
SESI 3
MARKETING - ENGLISH
NO NAMA INSTITUSI JUDUL PAPER
1 Andi Asdani
State Polytechnic of Malang
RELATIONSHIP BETWEEN ENTREPRENEURSHIP EDUCATION AND ENTREPRENEURIAL
CHARACTERISTICS AND THE ENTREPRENEURSHIP INTENTION: A CASE STUDY OF STUNDENT AT STATE
POLYTECHNIC OF MALANG
2 Rizal Hari Magnadi
UNDIP
EFFORT TO INCREASE MARKETING CAPACITY AMONG SME CLUSTER MEMBER IN MONOPSONY
MARKET STRUCTURE
3 Rahmad Wijaya; Lalu Edy Herman Mulyono
UNDIP
GREEN CORPORATE SOCIAL RESPONSIBILITY: A NEW DIMENSION OF CUSTOMER BANK BOND FOR SUSTAINABILITY OF INDONESIAN BANKING
4 Teguh Imam Basuki
STIE Ekuitas Bandung
IN THE REFERENCE GROUP ANALYSIS VIRAL MARKETING ON CONSUMER DEMAND PT AURIN BIZ
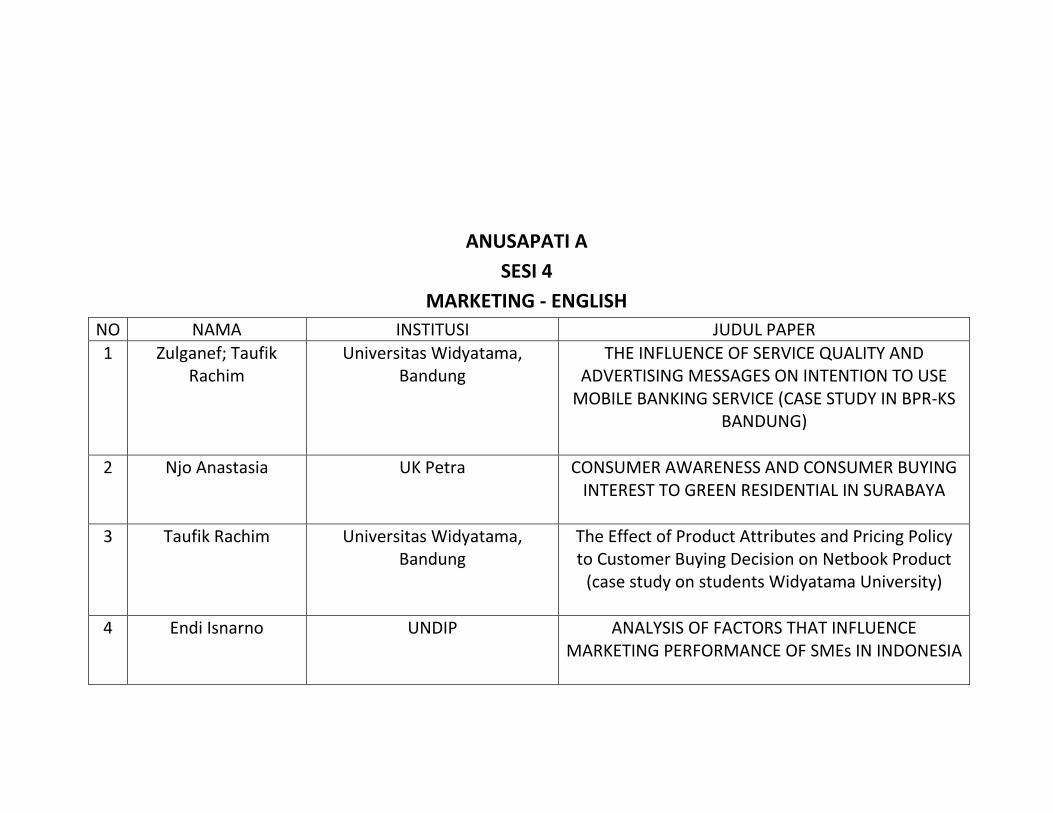
ANUSAPATI A
SESI 4
MARKETING - ENGLISH
NO NAMA INSTITUSI JUDUL PAPER
1 Zulganef; Taufik Rachim
Universitas Widyatama, Bandung
THE INFLUENCE OF SERVICE QUALITY AND ADVERTISING MESSAGES ON INTENTION TO USE
MOBILE BANKING SERVICE (CASE STUDY IN BPR-KS BANDUNG)
2 Njo Anastasia
UK Petra
CONSUMER AWARENESS AND CONSUMER BUYING
INTEREST TO GREEN RESIDENTIAL IN SURABAYA
3 Taufik Rachim
Universitas Widyatama, Bandung
The Effect of Product Attributes and Pricing Policy to Customer Buying Decision on Netbook Product
(case study on students Widyatama University)
4 Endi Isnarno
UNDIP
ANALYSIS OF FACTORS THAT INFLUENCE MARKETING PERFORMANCE OF SMEs IN INDONESIA

ANUSAPATI B
SESI 1
HUMAN RESOURCES - ENGLISH
NO NAMA INSTITUSI JUDUL PAPER
1 Andreas Haryjanto; Christantius Dwiatmadja
UK Satya Wacana
HOW TO GENERATE SUSTAINED COMPETITIVE ADVANTAGE IN A SMALL FAMILY BUSINESS
2 Christantius Dwiatmadja
UK Satya Wacana
HUMAN CAPITAL AND THE SUCCESS OF SME BUSINESS PERFORMANCE
3 Ade Irma Anggraeni
UNDIP
CREATING GOOD CITIZEN THROUGH ETHICAL VALUES
4 Didik Subiyanto
UNDIP
Leadership Development, Change-Oriented
Organizational Citizenship Behavior : Communication Forum Quality as an Mediation
Variable

ANUSAPATI B
SESI 2
FINANCE - ENGLISH
NO NAMA INSTITUSI JUDUL PAPER
1 Harjum Muharam
UNDIP
VAR ANALYSIS ON MUTUAL RELATIONSHIP BETWEEN STOCK PRICE INDEX AND EXCHANGE RATE AND THE ROLE OF WORLD OIL PRICE AND
WORLD GOLD PRICE
2 Perwito
Politeknik Piksi Ganesha Bandung
ANALYZED THE FUNDAMENTAL FACTORS OF STOCK RETURN
3
Juli Meliza; Isfenti Sadalia; Khaira Amalia Fachrudin
Universitas Sumatra Utara
THE FINANCIAL BEHAVIOR OF INVESTORS USING DISCRIMINANT ANALYSIS APPROACH
4 Gine Das Prena
Kopertis Wilayah VIII Dpk Undiknas University
Social,Culture and religion value implemantation in LPD (lembaga Perkreditan Desa) Bali

ANUSAPATI B
SESI 3
FINANCE/ACCOUNTING - ENGLISH
NO NAMA INSTITUSI JUDUL PAPER
1 Yasri
Universitas Negeri Padang
DETERMINANT FACTORS THAT IS CONSIDERED BY SME'S IN SHOOSING FINANCING THROUGH BMT (Baitul Maal wat Tamwil) IN WEST SUMATERA
2 i Gusti Ary Suryawathy
UN Mahasaraswati Denpasar
THE IMPACT OF FINANCIAL DECISIONS, PROFITABILITY AND SIZE OF THE COMPANY ON
FIRM'S VALUE (AN EMPIRICAL STUDY FROM MANUFACTURING COMPANIES LISTED IN
INDONESIA STOCK EXCHANGE PERIOD 2009-2011)
3 Albertus Herry Sulistiyo, Stevanus
Hadi Darmadji, Imanuel Goestaman
Ubaya PRACTICE OF CURRENT STATE MAPPING AS PART OF VALUE STREAM MAPPING TO INCREASE PROCESS EFFICIENCY AT PT X’S FINANCE SERVICES DEPARTMENT IN SURABAYA
4 Liza Veronica Yahya; Dianne Frisko
Ubaya HOW FAR FIRM CHARACTERISTIC PLAYS A ROLE IN CORPORATE SOCIAL RESPONSIBILITY PROGRAM AND REPORTING: Study in Indonesian Mining and

Banking Industry
ANUSAPATI B
SESI 4
MARKETING, HUMAN RESOURCES, AND STRATEGIC - BAHASA
NO NAMA INSTITUSI JUDUL PAPER
1 Liza Mumtazah Damarwulan
UNDIP
Liza Mumtazah Damarwulan
2 Chicilia Nova Yatna & Andhy Setyawan
Perbanas Jakarta
THE USE OF REUSABLE SHOPPING BAG AS FORM AS GREEN MARKETING IN RETAIL INDUSTRY
3 Andi Deby Grecia
UNDIP
COWORKERS INTERPERSONAL RELATIONSHIP AS ONE WAY TO EFFORT AN EMPLOYEE'S
PERFORMANCE IMPROVEMENT
4 Endy Sarwoko
UN Kanjuruhan Malang DETERMINING FACTORS OF ENTREPRENEURIAL COMPETENCY
5 Muhammad Kholis; Etty Puji Lestari
Universitas Terbuka, Jakarta
THE PRACTICES OF REGIONAL AUTONOMY IN CENTRAL JAVA AND ITS IMPLICATION ON
ECONOMIC COMPETITIVENESS
1
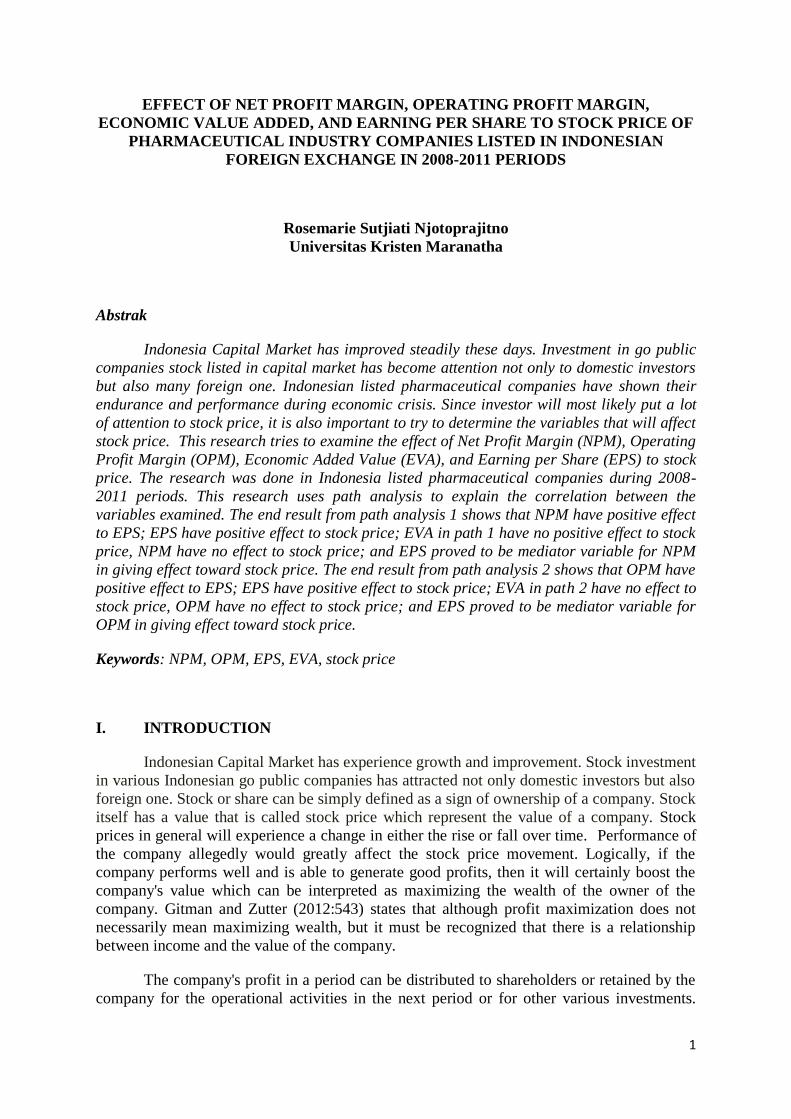
EFFECT OF NET PROFIT MARGIN, OPERATING PROFIT MARGIN,
ECONOMIC VALUE ADDED, AND EARNING PER SHARE TO STOCK PRICE OF
PHARMACEUTICAL INDUSTRY COMPANIES LISTED IN INDONESIAN
FOREIGN EXCHANGE IN 2008-2011 PERIODS
Rosemarie Sutjiati Njotoprajitno
Universitas Kristen Maranatha
Abstrak
Indonesia Capital Market has improved steadily these days. Investment in go public
companies stock listed in capital market has become attention not only to domestic investors
but also many foreign one. Indonesian listed pharmaceutical companies have shown their
endurance and performance during economic crisis. Since investor will most likely put a lot
of attention to stock price, it is also important to try to determine the variables that will affect
stock price. This research tries to examine the effect of Net Profit Margin (NPM), Operating
Profit Margin (OPM), Economic Added Value (EVA), and Earning per Share (EPS) to stock
price. The research was done in Indonesia listed pharmaceutical companies during 2008-
2011 periods. This research uses path analysis to explain the correlation between the
variables examined. The end result from path analysis 1 shows that NPM have positive effect
to EPS; EPS have positive effect to stock price; EVA in path 1 have no positive effect to stock
price, NPM have no effect to stock price; and EPS proved to be mediator variable for NPM
in giving effect toward stock price. The end result from path analysis 2 shows that OPM have
positive effect to EPS; EPS have positive effect to stock price; EVA in path 2 have no effect to
stock price, OPM have no effect to stock price; and EPS proved to be mediator variable for
OPM in giving effect toward stock price.
Keywords: NPM, OPM, EPS, EVA, stock price
I. INTRODUCTION
Indonesian Capital Market has experience growth and improvement. Stock investment
in various Indonesian go public companies has attracted not only domestic investors but also
foreign one. Stock or share can be simply defined as a sign of ownership of a company. Stock
itself has a value that is called stock price which represent the value of a company. Stock
prices in general will experience a change in either the rise or fall over time. Performance of
the company allegedly would greatly affect the stock price movement. Logically, if the
company performs well and is able to generate good profits, then it will certainly boost the
company's value which can be interpreted as maximizing the wealth of the owner of the
company. Gitman and Zutter (2012:543) states that although profit maximization does not
necessarily mean maximizing wealth, but it must be recognized that there is a relationship
between income and the value of the company.
The company's profit in a period can be distributed to shareholders or retained by the
company for the operational activities in the next period or for other various investments.
2
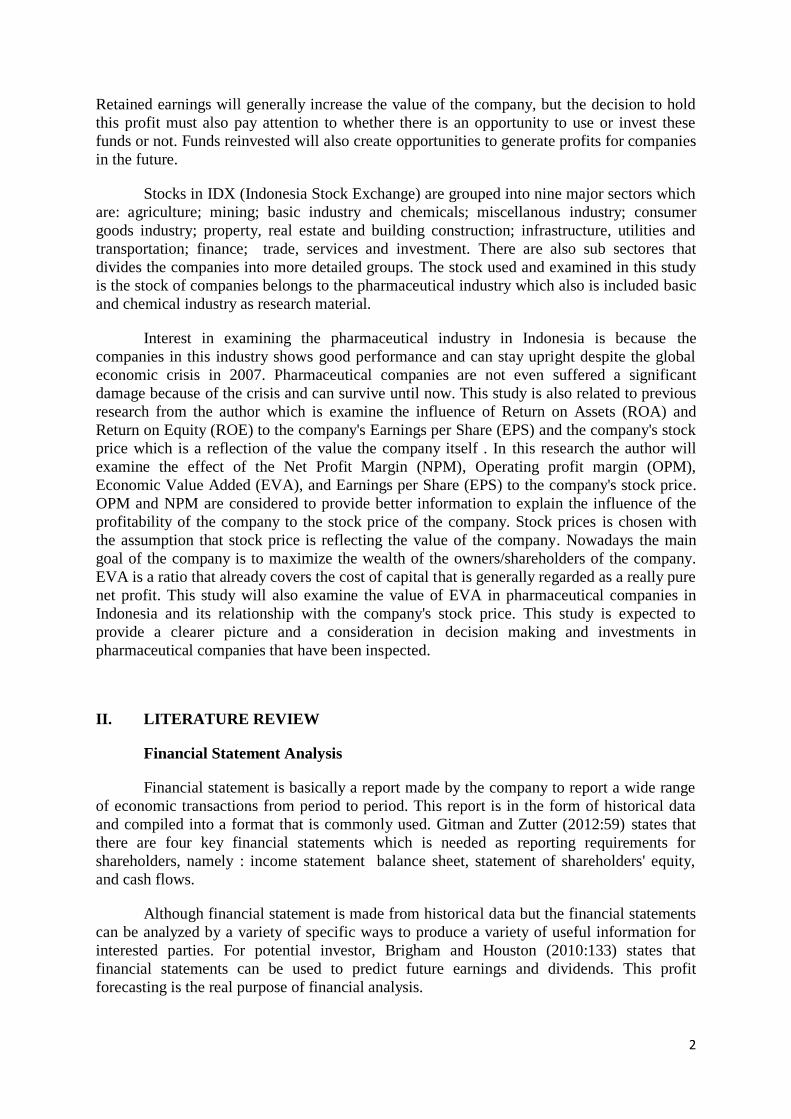
Retained earnings will generally increase the value of the company, but the decision to hold
this profit must also pay attention to whether there is an opportunity to use or invest these
funds or not. Funds reinvested will also create opportunities to generate profits for companies
in the future.
Stocks in IDX (Indonesia Stock Exchange) are grouped into nine major sectors which
are: agriculture; mining; basic industry and chemicals; miscellanous industry; consumer
goods industry; property, real estate and building construction; infrastructure, utilities and
transportation; finance; trade, services and investment. There are also sub sectores that
divides the companies into more detailed groups. The stock used and examined in this study
is the stock of companies belongs to the pharmaceutical industry which also is included basic
and chemical industry as research material.
Interest in examining the pharmaceutical industry in Indonesia is because the
companies in this industry shows good performance and can stay upright despite the global
economic crisis in 2007. Pharmaceutical companies are not even suffered a significant
damage because of the crisis and can survive until now. This study is also related to previous
research from the author which is examine the influence of Return on Assets (ROA) and
Return on Equity (ROE) to the company's Earnings per Share (EPS) and the company's stock
price which is a reflection of the value the company itself . In this research the author will
examine the effect of the Net Profit Margin (NPM), Operating profit margin (OPM),
Economic Value Added (EVA), and Earnings per Share (EPS) to the company's stock price.
OPM and NPM are considered to provide better information to explain the influence of the
profitability of the company to the stock price of the company. Stock prices is chosen with
the assumption that stock price is reflecting the value of the company. Nowadays the main
goal of the company is to maximize the wealth of the owners/shareholders of the company.
EVA is a ratio that already covers the cost of capital that is generally regarded as a really pure
net profit. This study will also examine the value of EVA in pharmaceutical companies in
Indonesia and its relationship with the company's stock price. This study is expected to
provide a clearer picture and a consideration in decision making and investments in
pharmaceutical companies that have been inspected.
II. LITERATURE REVIEW
Financial Statement Analysis
Financial statement is basically a report made by the company to report a wide range
of economic transactions from period to period. This report is in the form of historical data
and compiled into a format that is commonly used. Gitman and Zutter (2012:59) states that
there are four key financial statements which is needed as reporting requirements for
shareholders, namely : income statement balance sheet, statement of shareholders' equity,
and cash flows.
Although financial statement is made from historical data but the financial statements
can be analyzed by a variety of specific ways to produce a variety of useful information for
interested parties. For potential investor, Brigham and Houston (2010:133) states that
financial statements can be used to predict future earnings and dividends. This profit
forecasting is the real purpose of financial analysis.

3
Financial Ratio Analysis
One form of financial statement analysis is ratio analysis. Brigham and Houston
(2010:133) state that financial ratios are designed to help us evaluate the financial statements.
Financial ratios that are calculated from financial statements can be compared with previous
years to determine the performance of companies or can be compared with the industry ratio
to determine the company's performance compared to other companies in the same industry.
Net Profit Margin
One financial ratios examined in this study is the Net Operating Margin (NPM) ratio.
Sugiono (2009:86) states that the net profit margin shows how much the company earned net
profit. Another suggestion is from Callahan, et.al. (2011:30) states that the net profit margin
(NPM) indicates the percentage of sales remaining after paying all expenses and income
taxes.
Operating Margin
For OPM ratio, Callahan, et. al. (2011:30) stated that the Operating Profit Margin
(OPM) indicates the percentage of sales remaining after paying all expenses except income
tax.
Earning Per Share
Claymanet.al. (2008) stated that the Earning per Share (EPS) is the amount of revenue
generated in a period for each share of common stock. EPS of a company in general is
considered important by management and shareholders and reflects the amount of money that
is generated from common stock investments (Gitman and Zutter, 2010:79)
Or
Economic Value Added
Grant (2003:4) stated that basically Economic Value Added (EVA) theory based on
two principles: first, a company has not been truly profitable before the company is able to
produce return of invested capital that exceeds the "opportunity cost of capital" and second,
that that wealth is created when corporate managers make positive NPV investment decisions
for shareholders.
EVA formula is as follow:
EVA = NOPAT – Cost of Capital
NOPAT = Invested Capital x ROIC
-

4
Cost of Capital = Invested Capital x WACC
ROIC = Return on Invested Capital
WACC = Weighted Average Cost of Capital
Brigham and Houston (2010:165) states that EVA is different from traditional
accounting measure of profits due to the EVA is explicitly not only consider the cost of debt,
but also the cost of equity. This means that the use of EVA also pay attention to capital
structure, and can be used to identify activities or projects that provide a higher return than
the cost of capital. Brigham and Houston (2010:165) states that EVA depends on three
factors: the rate of return as reflected in the ROE; risks that will affect the cost of equity, and
size which is measured by equity used. Because EVA requires a more complete calculation
with various estimations, not all companies are able to use the EVA calculation.
Stock/share can be simply interpreted as a sign of ownership of a company. Stock
itself consists of several kinds including common stock and preferred stock. Performers of
investing activities in stock are called investors. Weston and Brigham (1993) stated that the
stock price is the price at the time of the stock sold in the market. Stock price is generally
regarded as a measure that reflects the value of a company. The stock price will generally
undergo changes from time to time. Investors who intend to invest the funds will certainly put
attention to the movement of the stock price to ensure that the investment does not suffer loss
or even better can obtain the expected profit. There is ample factors that affect stock prices.
The internal factor is the performance of the company itself which logically will affect the
stock price of a company. But beyond that there is also the possibility of other factors that
could affect the stock price of a company. Tandelilin (2010) states that the stock price is a
reflection of investors' expectations of the factors of earnings, cash flow, and the rate of
return from required by investors. These three factors are also greatly influenced by macro-
economic performance.
III. RESEARCH METHODS
Research Object
This study was conducted with the object of research is the go public pharmaceutical
industry companies listed in Indonesia Stock Exchange during the period 2008 to 2011.
Types of Research
This study, based on its explanation level can be defined as associative research.
Riduwan (2008:165) states that associatives is a problem that link or influence between two
or more variables. This study was included in the study simmetrical associative and causal.
Riduwan (2008:165) states that the simetrical relationship is a relationship that is
characterized by togetherness between two or more variables, whereas the causal relationship
is a relationship that is characterized by affecting action between two or more variables.
This study was made to test the hypothesis by using historical data; the hypothesis is
formulated by using the theory, empirical research, or exploratory studies (Suliyanto,
2005:67).

5
Data Collection Method
Data collection methods are techniques or methods that can be used by researchers to
collect data (Riduwan, 2008:51)
The method used here to collect data is done by collecting documentation data.
(Secondary data collection techniques) and data collected is relevant to this study. Other
method used here to support the theory is analytical strategis using the financial statements of
the companies in the industry. These financial statements are examined and processed using
SPSS.
This study also used purposive sampling method. The method is a sampling technique
used by researcher if the researcher has specific considerations in the determination of sample
collection or can be said sample are taken for a particular purpose (Riduan, 2008:20).
Certain Criteria is set out in the stock sample selection. The sample used was a sample
of stock in the pharmaceutical industry with data collection from the period 2010 to 2011.
Companies that are taken into the sample are companies that have been listed in IDX as the
go pulic companies for at least 5 years and have been audited. The data used is the historical
data which is yearly financial statement of companies that have been audited and published.
Method of Data Analysis and Research Paradigm
Classic assumption test has become requirement that must be implemented to support
the accuracy of subsequent statistical tests. The classic assumption made in this study is
multicollinearity test, autocorrelation test, and heteroscedasticity test. After a series of these
early tests, then the regression analysis can be performed in order to determine how the
relationships of NPM variables, OPM, EVA, and EPS to stock price.
Besides those analyses, path analysis is also conducted in order to determine how
NPM, OPM, EVA, and EPS variables deliver its impact to company stock proce.
It also conducted a path analysis to determine how the variables NPM, OPM, EVA,
and EPS provide / deliver impact to the company's stock price. The objective of the analysis
is to describe the pathway due to direct or indirect cause of several variables, against some of
the other variables selected as the variable result. Here is the track correlation developed as a
research paradigm
NPM
OPM
EPS Harga Saham
EVA
Stock Price
Figure 1
Path Analysis Research Paradigm

6
From the picture above it is seen that this research will also test the role of EPS
variables as mediating variable for variable NPM or OPM in giving its effect to the
company's stock price. From this paradigm is then defined two pathways in path analysis
such as:
Figure 2
Path Analysis 1 Research Paradigm
Figure 3
Path Analysis 2 Research Paradigm
Hypothesis
Riduwan (2008:163) states that hypothesis is a temporary answer or alleged to be
tested again truth. While the research hypothesis is the working hypothesis which is
formulated to address the problem by using existing theories related/relevant to the research
problem and not yet based on facts and real field data support (Riduwan, 2008:163).
OPM EPS
EVA
Stock Price
Z2 Z1
NPM EPS
EVA
Stock Price
Z2 Z1

7
The hypothesis that will be used by the authors in this study is causal hypothesis
which states the relationship between variables where one variable changes will or can cause
changes in another variable.
Based on the formulation of the problem and based on framework developed by the
authors, hypotheses are formulated in the form of associative hypothesis. Riduwan
(2008:168) states that the associative hypothesis is formulated to provide an answer to the
problem which is characterized by relationship. In accordance with other research then the
author made the causal associative hypothesis. The formulation of this hypothesis is as
follows:
a. H1: NPM has positive effect on EPS
b. H1: EPS has a positive effect on stock prices
c. H1: EVA has positive effect on stock prices (path analysis 1)
d. H1: NPM has a positive effect on stock prices
e. H1: EPS acts as a mediating variable for the effect of NPM to stock prices
f. H1: OPM has positive effect on EPS
g. H1: EPS has a positive effect on stock prices
h. H1: EVA positive effect on stock prices (path analysis 2)
i. H1: OPM has positive effect on stock prices
j. H1: EPS acts as a mediating variable for the effect of OPM on stock prices
IV. RESULT AND DISCUSSION
The data analyzed is a financial statement data that is on the annual balance sheet and
income statement that ends on each December 31. After doing a search on the ratio of NPM,
OPM, and EVA and added with the ratio of EPS and stock price then the next step is to
perform statistical tests as described earlier. From the analysis conducted statistical
descriptions are obtained and it shows:
Table 1. Descriptive Statistics
N Minimum Maximum Mean Std. Deviation
Stock Price 54 50.00 152000.00 18272.7593 36585.45315
EVA 54 -98048.3300 1049667.0000 64367.149815 199945.8633761
OPM 54 -.1031 .4713 .134581 .1234130
NPM 54 -.0930 .3512 .094420 .0968611
EPS 54 -7061.2100 14162.6400 1638.397130 4094.7962710
Valid N (listwise) 54
From the above table it is known that the number of samples are 54 and shows the
minimum value, maximum value and average value of each variable. Because the sample is
derived from a variety of different companies, it shows big difference from minimum and
maximum value from each examined variables.

8
Here are discussed the results of the analysis of the first path analysis:
Figure 4. Alternative Result of Path Analysis 1 Model
Table 2. First Path Analysis Model Equation
Model Model Equation R-square Z (error) Sumber
1 EPS = f(NPM) 0.786 0.462601 Appendix 5
2 Stock Price = f(NPM, EPS, EVA) 0.246 0.868332 Appendix 6
Table 3. Dirrect Effect and Indirect Effect of Path Analysis 1
Types of Effect Variables Dirrection Stand. Beta Effect
Direct Effect EVA --> Stock Price -0.031 0.031
Direct Effect NPM --> Stock Price -0.207 0.207
Indirect Effect NPM --> EPS --> Stock Price 0.887*0.666 0.590742
From the results shown in figure 4 (the first path analysis) indicated that the
pharmaceutical companies that are examined shows EPS acts as a mediating variable, due to
the indirect effect (NPM Stock Price EPS) is greater than the direct effect ( NPM
Stock Price). This means that this path is accepted as the correct path and then the next step is
to examine hypotheses pertaining to the first path analysis.
The Test results conducted to the pharmaceutical companies examined showed that
NPM has positive effect on EPS which is equal to 78 percent (H1 is accepted), but the results
of hypothesis testing showed that the NPM has no direct effect to stock prices but give its
effect to the stock price by first giving effect to mediation variable EPS. Then EPS variable
give positive effect to stock prices. (H1 is accepted). While EVA variables do not have a
positive effect to stock prices (H1 rejected). NPM variables also had no effect on stock prices
(H1 rejected).
NPM EPS
EVA
Stock Price
-0.031 (0.810)
0.887
(0.000)
0.666 (0.021)
Z2 Z1
-0.207 (0.462)

9
Table 4. Summary of First Path Analysis Hypothetical Test
Hypothesis Research Model
Estimation Result Conclusion
H11: NPM has positive effect to
EPS
b1 = 0.887
Sig. b1 = 0.000
H1 is supported by test result
H12: EPS has a positive effect to
stock prices
b2 = 0.666
Sig. b2 = 0.021
H1 is supported by test result
H13: EVA has positive effect to
stock prices (path analysis 1)
b3 = -0.0.31
Sig. b3 = 0.810
H1 is not supported, EVA has no
positive effect to stock price
H14: NPM has a positive effect to
stock prices
b4 = -0.207
Sig. b4 = 0.462
H1 is not supported, NPM has
no effect to stock price
H15: EPS acts as a mediating
variable for the effect of NPM to
stock prices
b1*b2 > |b4|
0.5907 > 0.207
H1 is supported by test result,
EPS act as mediation variables
for NPM effect to stock price.
Furthermore the second path analysis will be discussed as follows:
Figure 5. Alternative Result of the Second Path Analysis Model
OPM EPS
EVA
Stock Price
0.006 (0.963)
0.909
(0.000)
0.977 (0.002)
Z2 Z1
-0.542 (0.078)
10
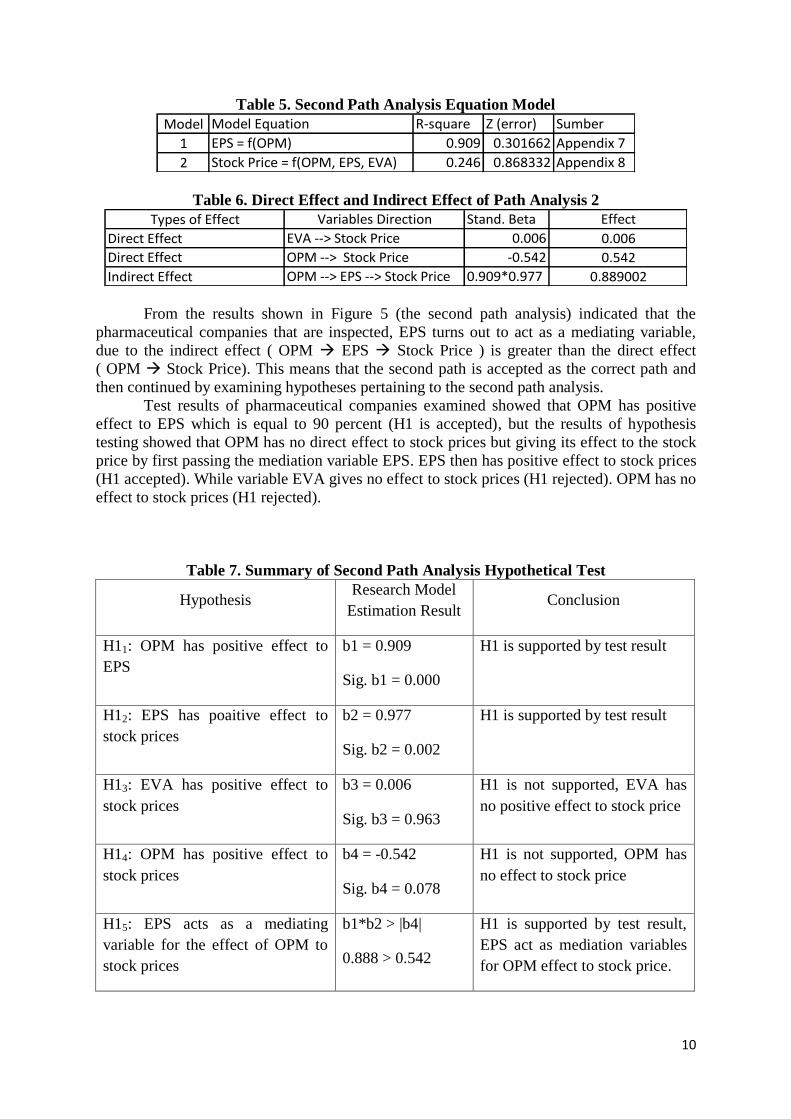
Table 5. Second Path Analysis Equation Model
Model Model Equation R-square Z (error) Sumber
1 EPS = f(OPM) 0.909 0.301662 Appendix 7
2 Stock Price = f(OPM, EPS, EVA) 0.246 0.868332 Appendix 8
Table 6. Direct Effect and Indirect Effect of Path Analysis 2
Types of Effect Variables Direction Stand. Beta Effect
Direct Effect EVA --> Stock Price 0.006 0.006
Direct Effect OPM --> Stock Price -0.542 0.542
Indirect Effect OPM --> EPS --> Stock Price 0.909*0.977 0.889002
From the results shown in Figure 5 (the second path analysis) indicated that the
pharmaceutical companies that are inspected, EPS turns out to act as a mediating variable,
due to the indirect effect ( OPM EPS Stock Price ) is greater than the direct effect
( OPM Stock Price). This means that the second path is accepted as the correct path and
then continued by examining hypotheses pertaining to the second path analysis.
Test results of pharmaceutical companies examined showed that OPM has positive
effect to EPS which is equal to 90 percent (H1 is accepted), but the results of hypothesis
testing showed that OPM has no direct effect to stock prices but giving its effect to the stock
price by first passing the mediation variable EPS. EPS then has positive effect to stock prices
(H1 accepted). While variable EVA gives no effect to stock prices (H1 rejected). OPM has no
effect to stock prices (H1 rejected).
Table 7. Summary of Second Path Analysis Hypothetical Test
Hypothesis Research Model
Estimation Result Conclusion
H11: OPM has positive effect to
EPS
b1 = 0.909
Sig. b1 = 0.000
H1 is supported by test result
H12: EPS has poaitive effect to
stock prices
b2 = 0.977
Sig. b2 = 0.002
H1 is supported by test result
H13: EVA has positive effect to
stock prices
b3 = 0.006
Sig. b3 = 0.963
H1 is not supported, EVA has
no positive effect to stock price
H14: OPM has positive effect to
stock prices
b4 = -0.542
Sig. b4 = 0.078
H1 is not supported, OPM has
no effect to stock price
H15: EPS acts as a mediating
variable for the effect of OPM to
stock prices
b1*b2 > |b4|
0.888 > 0.542
H1 is supported by test result,
EPS act as mediation variables
for OPM effect to stock price.
11
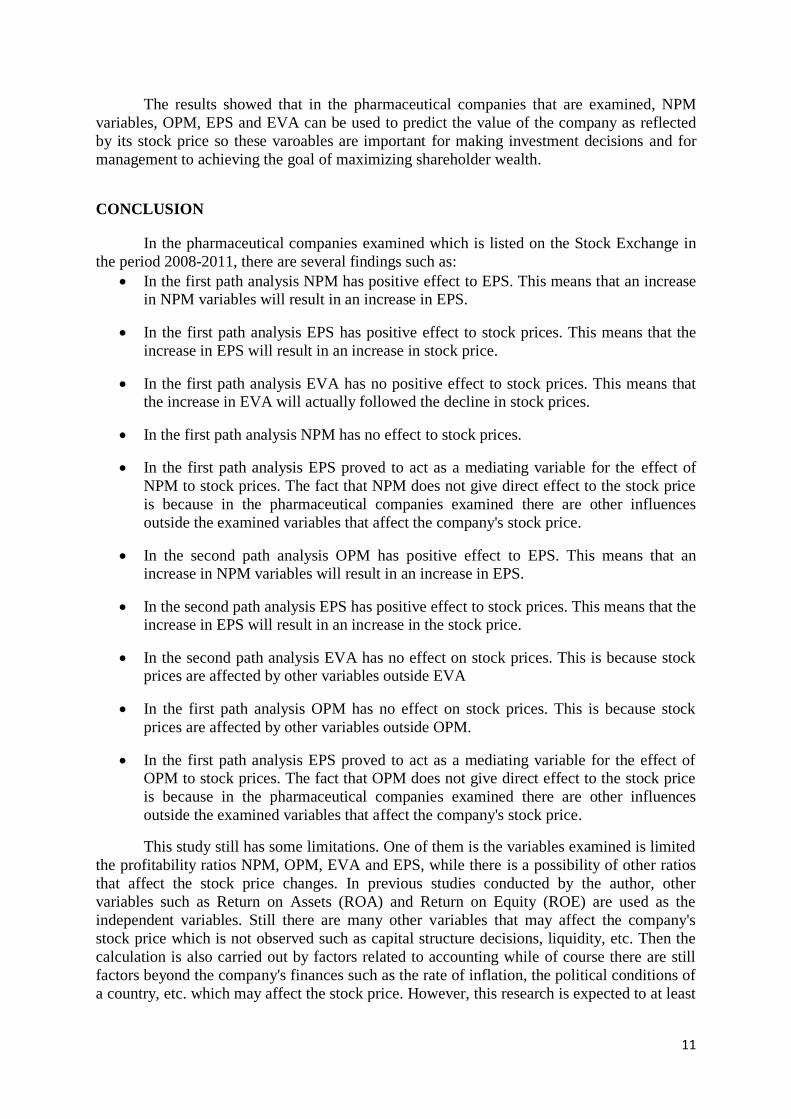
The results showed that in the pharmaceutical companies that are examined, NPM
variables, OPM, EPS and EVA can be used to predict the value of the company as reflected
by its stock price so these varoables are important for making investment decisions and for
management to achieving the goal of maximizing shareholder wealth.
CONCLUSION
In the pharmaceutical companies examined which is listed on the Stock Exchange in
the period 2008-2011, there are several findings such as:
In the first path analysis NPM has positive effect to EPS. This means that an increase in NPM variables will result in an increase in EPS.
In the first path analysis EPS has positive effect to stock prices. This means that the
increase in EPS will result in an increase in stock price.
In the first path analysis EVA has no positive effect to stock prices. This means that the increase in EVA will actually followed the decline in stock prices.
In the first path analysis NPM has no effect to stock prices.
In the first path analysis EPS proved to act as a mediating variable for the effect of
NPM to stock prices. The fact that NPM does not give direct effect to the stock price
is because in the pharmaceutical companies examined there are other influences
outside the examined variables that affect the company's stock price.
In the second path analysis OPM has positive effect to EPS. This means that an increase in NPM variables will result in an increase in EPS.
In the second path analysis EPS has positive effect to stock prices. This means that the increase in EPS will result in an increase in the stock price.
In the second path analysis EVA has no effect on stock prices. This is because stock prices are affected by other variables outside EVA
In the first path analysis OPM has no effect on stock prices. This is because stock
prices are affected by other variables outside OPM.
In the first path analysis EPS proved to act as a mediating variable for the effect of OPM to stock prices. The fact that OPM does not give direct effect to the stock price
is because in the pharmaceutical companies examined there are other influences
outside the examined variables that affect the company's stock price.
This study still has some limitations. One of them is the variables examined is limited
the profitability ratios NPM, OPM, EVA and EPS, while there is a possibility of other ratios
that affect the stock price changes. In previous studies conducted by the author, other
variables such as Return on Assets (ROA) and Return on Equity (ROE) are used as the
independent variables. Still there are many other variables that may affect the company's
stock price which is not observed such as capital structure decisions, liquidity, etc. Then the
calculation is also carried out by factors related to accounting while of course there are still
factors beyond the company's finances such as the rate of inflation, the political conditions of
a country, etc. which may affect the stock price. However, this research is expected to at least
12
provide input and a clearer picture of the factors that will affect the value of a company
which is reflected in its share price.
REFERENCES
Arief Sugiono (2009). Manajemen Keuangan: Untuk praktisi Keuangan. Jakarta: Grasindo
Brigham, E.F. dan Houston, J.F. (2010). Dasar-dasar manajemen Keuangan, ed-11. Jakarta:
Salemba Empat.
Callahan, K.R., Stetz, G.S., and Brooks, L.M. (2011). Project Management Accounting:
Budgeting, Tracking, and Reporting Cost and Profitability, 2nd
ed. New Jersey: John
Wiley & Sons, Inc.
Clayman, M.R., Fridson, M.S., and Troughton, G.H. (2008). Corporate Finance: A Practical
Approach. New Jersey: John Wiley and Sons, Inc.
Downes, J. dan Goodman, J.E. (1991). Dictionary of Finance and Investment Terms. New
York: Barrons
Grant, J.L. (2003). Foundations of Economic Value Added, 2nd
ed. New Jersey: John Wiley &
Sons, Inc.
Gitman, L.J., dan Zutter, C.J. (2012). Principles of Managerial Finance: Global Edition,
13th
ed. England: Pearson Education Limited.
Hanafi, M.M (2004). Manajemen Keuangan. Yogyakarta: BPFE
Jogiyanto. 2004. Metode Penelitian Bisnis Salah Kaprah dan Pengalaman-pengalaman, Cetakan
Pertama. Yogyakarta: BPFE.
Pratomo, E.P. dan Nugraha, U. (2000). Reksadana: Solusi Perencanaan Investasi di Era
Modern. Jakarta: Gramedia Pustaka Utama.
Rahardjo, S. (2006). Kiat membangun Aset Kekayaan: Panduan Investasi Saham dari A
sampai Z. Jakarta: PT Elex Media komputindo.
Riduwan. (2008). Dasar-dasar Statistika. Bandung: Alfabeta.
Sartono, R.A. (2001). Manajemen Keuangan: Teori dan Aplikasi. Yogyakarta: BPFE
Suliyanto. (2005). Analisis Data dalam Aplikasi Pemasaran. Bogor: Ghalia
Indonesia.Sunariyah, (2004), Pengantar Pengetahuan Pasar Modal, Yogyakarta: Penerbit
UPP AMP YKPN
Tandelilin, E. (2010). Portofolio dan Investasi: Teori dan Aplikasi, ed 1. Kanisius:
Yogyakarta: Kanisius.

13
Usman, R. (2001). Aspek-aspek Hukum Perbankan di Indonesia. Jakarta: Gramedia opustaka
Utama.
Widoatmojo, S. (2005). Cara Sehat Investasi di Pasar Modal: Pengantar Menjadi Investor
Profesional. Jakarta: Elex Media komputindo.

14
APPENDIX 1. SPSS Output Result for Regression Model Equation
EPS = f (NPM)
Variables Entered/Removedb
Model
Variables
Entered
Variables
Removed Method
1 NPMa . Enter
a. All requested variables entered.
b. Dependent Variable: EPS
Model Summary
Model R R Square
Adjusted R
Square
Std. Error of the
Estimate
1 .887a .786 .782 1910.9798556
a. Predictors: (Constant), NPM
ANOVAb
Model Sum of Squares df Mean Square F Sig.
1 Regression 6.988E8 1 6.988E8 191.348 .000a
Residual 1.899E8 52 3651844.009
Total 8.887E8 53
a. Predictors: (Constant), NPM
b. Dependent Variable: EPS
Coefficientsa
Model
Unstandardized Coefficients
Standardized
Coefficients
t Sig. B Std. Error Beta
1 (Constant) -1901.141 364.830 -5.211 .000
NPM 37487.022 2709.996 .887 13.833 .000
a. Dependent Variable: EPS

15
APPENDIX 2. SPSS Output Result for Regression Model Equation
Stock Price = f (NPM, EPS, EVA)
Variables Entered/Removedb
Model Variables Entered
Variables
Removed Method
1 EVA, EPS, NPM . Enter
Model Summary
Model R R Square
Adjusted R
Square
Std. Error of the
Estimate
1 .496a .246 .201 32709.98708
a. Predictors: (Constant), EVA, EPS, NPM
ANOVAb
Model Sum of Squares df Mean Square F Sig.
1 Regression 1.744E10 3 5.814E9 5.434 .003a
Residual 5.350E10 50 1.070E9
Total 7.094E10 53
Coefficientsa
Model
Unstandardized Coefficients
Standardized
Coefficients
t Sig. B Std. Error Beta
1 (Constant) 16290.179 7713.508 2.112 .040
NPM -78348.100 105651.244 -.207 -.742 .462
EPS 5.950 2.489 .666 2.391 .021
EVA -.006 .024 -.031 -.242 .810
a. Dependent Variable: Stock Price

16
APPENDIX 3. SPSS Output Result for Regression Model Equation EPS = f (OPM)
Variables Entered/Removedb
Model
Variables
Entered
Variables
Removed Method
1 OPMa . Enter
a. All requested variables entered.
b. Dependent Variable: EPS
Model Summary
Model R R Square
Adjusted R
Square
Std. Error of the
Estimate
1 .909a .826 .823 1722.3230651
a. Predictors: (Constant), OPM
ANOVAb
Model Sum of Squares df Mean Square F Sig.
1 Regression 7.344E8 1 7.344E8 247.579 .000a
Residual 1.543E8 52 2966396.740
Total 8.887E8 53
a. Predictors: (Constant), OPM
b. Dependent Variable: EPS
Coefficientsa
Model
Unstandardized Coefficients
Standardized
Coefficients
t Sig. B Std. Error Beta
1 (Constant) -2420.968 348.556 -6.946 .000
OPM 30162.877 1916.973 .909 15.735 .000
a. Dependent Variable: EPS

17
APPENDIX 4. SPSS Output Result for Regression Model Equation Stock Price = f (OPM, EPS, EVA)
Variables Entered/Removedb
Model Variables Entered
Variables
Removed Method
1 EVA, EPS, OPM . Enter
a. All requested variables entered.
b. Dependent Variable: Stock Price
Model Summary
Model R R Square
Adjusted R
Square
Std. Error of the
Estimate
1 .533a .284 .241 31871.18074
a. Predictors: (Constant), EVA, EPS, OPM
ANOVAb
Model Sum of Squares df Mean Square F Sig.
1 Regression 2.015E10 3 6.717E9 6.613 .001a
Residual 5.079E10 50 1.016E9
Total 7.094E10 53
a. Predictors: (Constant), EVA, EPS, OPM
b. Dependent Variable: Stock Price
Coefficientsa
Model
Unstandardized Coefficients
Standardized
Coefficients
t Sig. B Std. Error Beta
1 (Constant) 25531.006 8992.058 2.839 .007
OPM -160656.029 89174.169 -.542 -1.802 .078
EPS 8.725 2.682 .977 3.253 .002
EVA .001 .023 .006 .046 .963
a. Dependent Variable: Stock Price

18