tug version jose felgueiras november 9, 2010 enabling tpf operations & coverage productivity...
TRANSCRIPT
TUG Version
Jose Felgueiras
November 9, 2010
Enabling TPF Operations & Coverage productivity with YODA

2
Agenda
• Overview of YODA• Technical work flow• Coverage and Operations Tools• Coverage and Operations Monitors• Coverage and Operations Reports• Questions
3
Overview of YODA
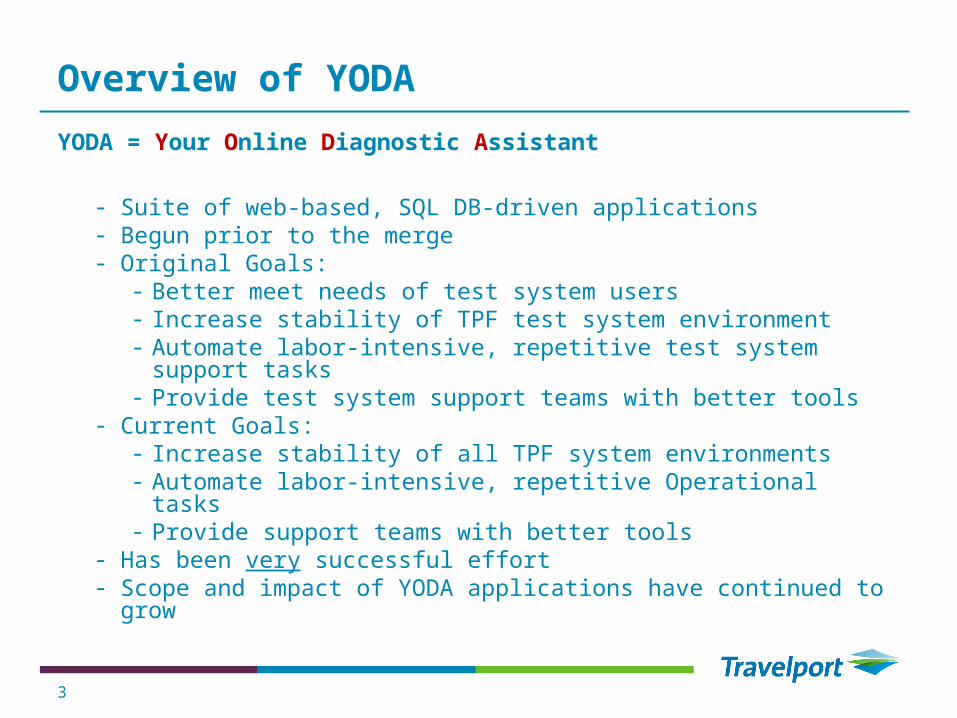
YODA = Your Online Diagnostic Assistant
- Suite of web-based, SQL DB-driven applications- Begun prior to the merge - Original Goals:
- Better meet needs of test system users- Increase stability of TPF test system environment- Automate labor-intensive, repetitive test system support tasks- Provide test system support teams with better tools
- Current Goals:- Increase stability of all TPF system environments- Automate labor-intensive, repetitive Operational tasks- Provide support teams with better tools
- Has been very successful effort- Scope and impact of YODA applications have continued to grow

User Services
Business Services
Data Services
4
Technical Diagram
Web Clients (IE)
IIS
ASPASP
ASPASP
DLLDLL
DLLDLL
SQL Server
TOS
z/VM
z/OS

5
YODA Main and Menus

YODA Tools6
Examples of YODA Tools
• Console Logs• TPF Reference• BOATS (Book Out A Test Systems)• TPF LOADSETS• ATM (Automated Task Manager)• TPF OPS/DASD• TPF OPS/TAPES• CNN (Coverage Notification Network)

YODA Tools7
Console Logs (view)Users can view TPF console logs for all systems. Production, Copy and Test.

YODA Tools8
Console Logs (search)Users can search TPF console logs for a selected range date. Clicking in one of the found occurrences, a part of the console will display with the select occurrence highlighted in red.

YODA Tools9
Console Logs (merge)Users can merge TPF console logs for easy problem diagnosis.
YODA Tools10
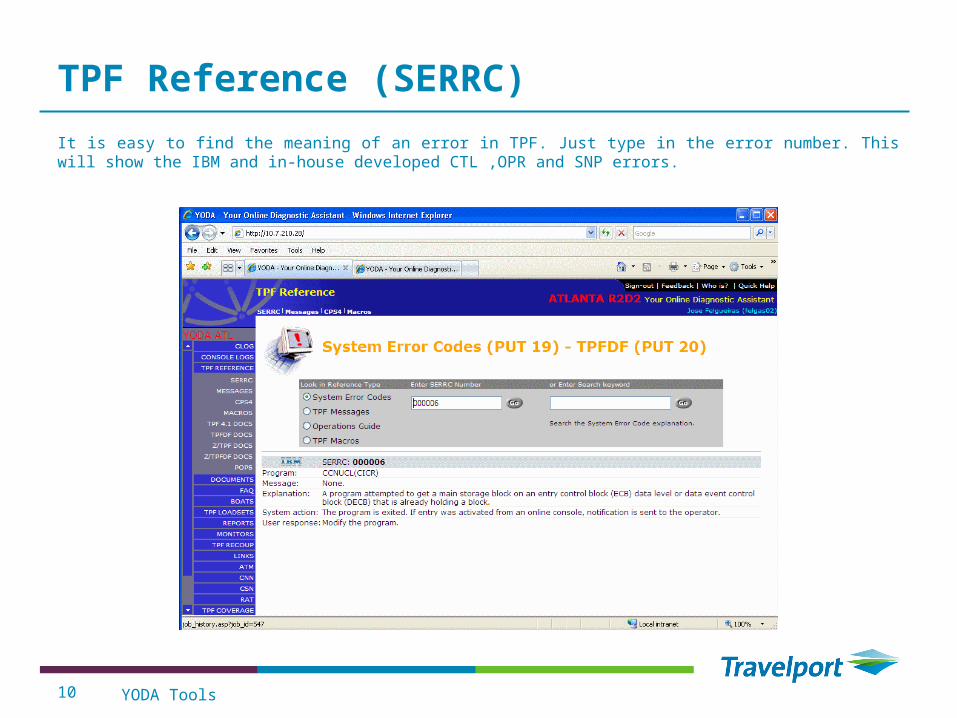
TPF Reference (SERRC)
It is easy to find the meaning of an error in TPF. Just type in the error number. This will show the IBM and in-house developed CTL ,OPR and SNP errors.

YODA Tools11
TPF Reference (Messages)
Quickly and easily find the meaning of a TPF message using its message prefix. All IBM and in-house developed messages will be displayed.

YODA Tools12
TPF Reference (CPS4)
Quickly and easily find the format of a TPF command. All IBM and in-house developed TPF commands will be displayed.
YODA Tools13
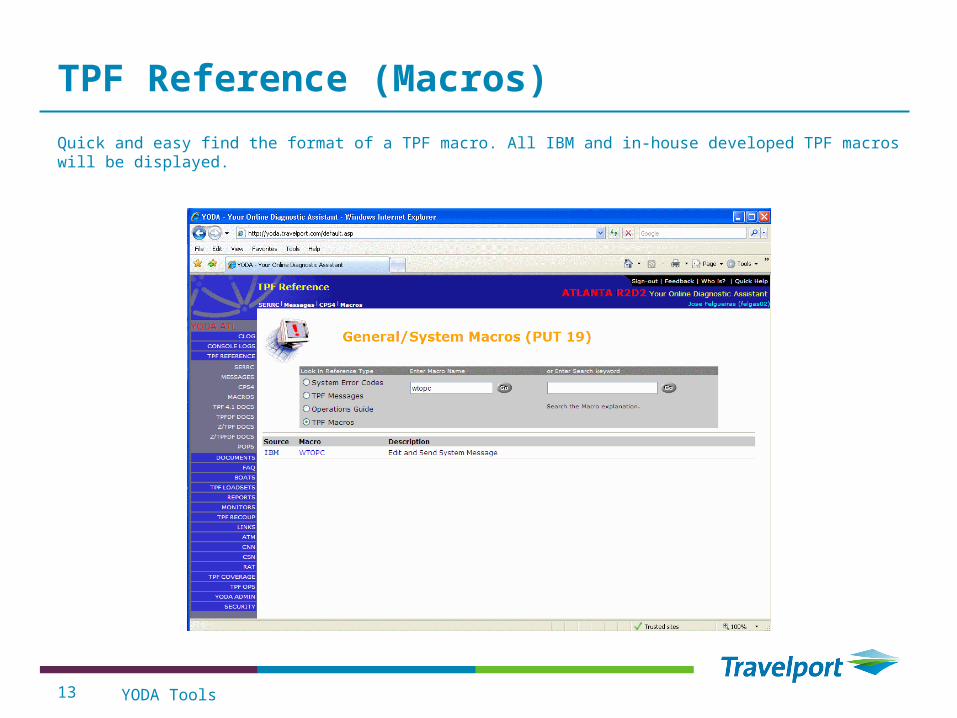
TPF Reference (Macros)
Quick and easy find the format of a TPF macro. All IBM and in-house developed TPF macros will be displayed.

YODA Tools14
BOATS (Complex configuration)
With this tool, TPF developers, can request and setup their own private test system (partition) without the need to involve TPF Test Systems Operations (TSD).

YODA Tools15
BOATS (Dispatcher)
The automation Dispatcher is the application that performs all the actions to IPL or shut-down a TPF partition. I does it automatically by scheduled time or on demand. Only Command Center stuff or the system’s owners can operate this page.

YODA Tools16
TPF LOADSETS (Load)
TPF Developers can load LOADSETS in private and common test partitions. This action gets logged for future reference.

YODA Tools17
TPF LOADSETS (Program Version)
On this page users can search for program versions loaded to production systems.

YODA Tools18
ATM (Main display)
This is the main display for ATM. It refreshes every 5 minutes and keeps the status of 24 hours of tasks. Right clicking on a task will prompt a menu from where several options are available.

YODA Tools19
ATM (Task history)
This page shows the results of the last 50 executions of a task. Clicking on the schedule start time will take us to the next slide.

YODA Tools20
ATM (Detailed task history)
This page shows the detailed commands and responses from a TPF system during the execution of a task.

YODA Tools21
DASD (Control Unit definitions)
On this page, authorized users, can see all defined Control units (CU) , create new ones, update or delete existing ones. Clicking on the CU’s name will show all the Logical Control Units (LCU) for the CU and the TPF systems that have DASD on them.

YODA Tools22
DASD (Databases in Control Unit)
When clicking on the CU’s name, users will get to this page which shows all the LCU in the CU and the Databases (TPF Systems) on it. Clicking in one of the Systems names will take us to the next slide.
YODA Tools23
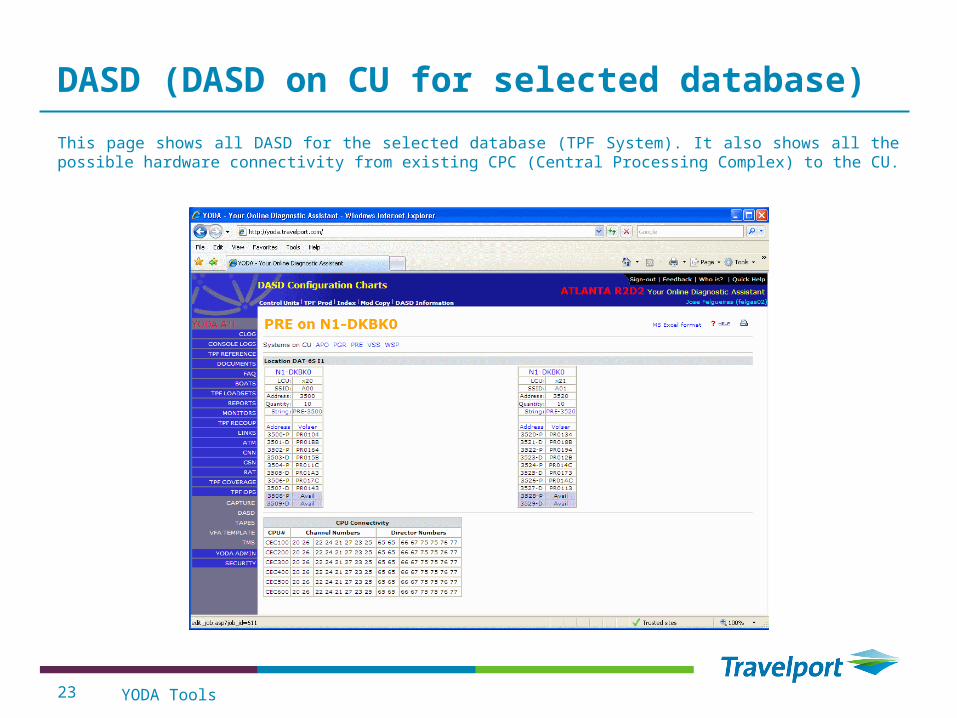
DASD (DASD on CU for selected database)
This page shows all DASD for the selected database (TPF System). It also shows all the possible hardware connectivity from existing CPC (Central Processing Complex) to the CU.

YODA Tools24
DASD (all DASD for selected System)
This page shows all DASD for the selected TPF System. The display is sorted by CU/LCU.

YODA Tools25
DASD (MODS go offline)
This page shows all the MODS offline for the selected TPF System. Users can create a script to bring all MODS online in the same device or in spares.

YODA Tools26
DASD (script for AMOD UP)
This page shows all options for a created script. Temporary working list contains the copy FROM and TO. User selects AMOD UP Script.

YODA Tools27
DASD (Creating scripts)
Users can create scripts for AMOD UP/DOWN without MODS being offline.
YODA Tools28
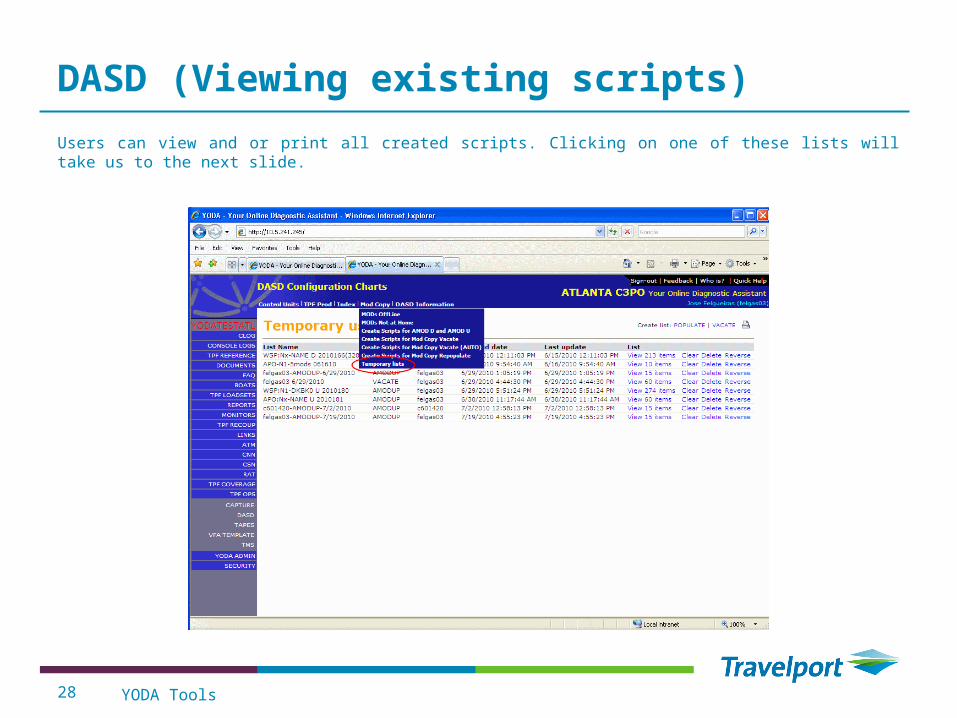
DASD (Viewing existing scripts)
Users can view and or print all created scripts. Clicking on one of these lists will take us to the next slide.
YODA Tools29
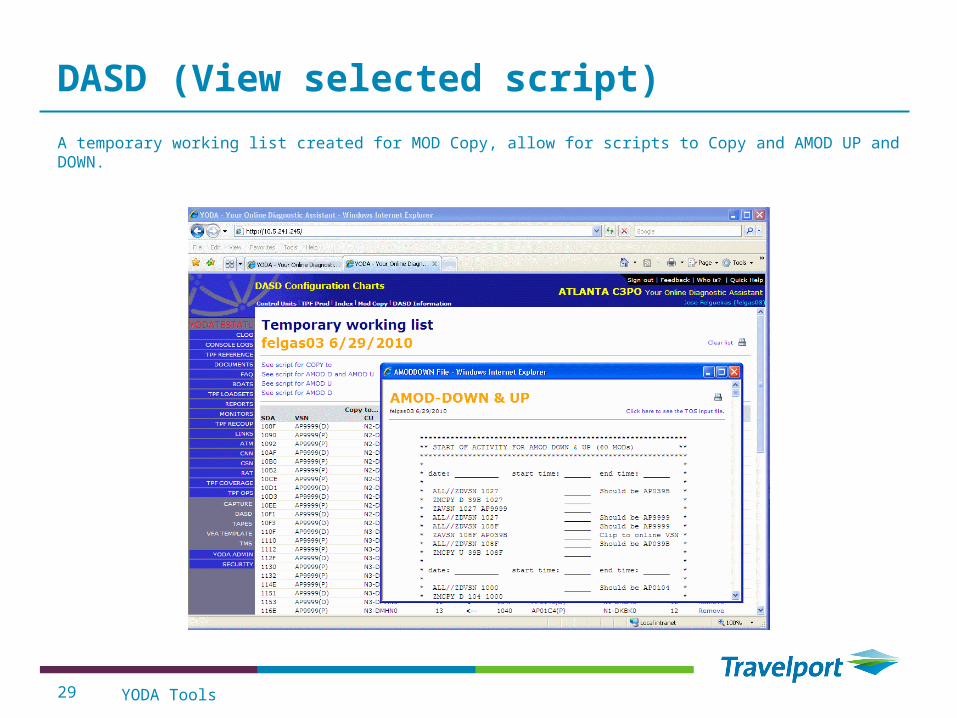
DASD (View selected script)
A temporary working list created for MOD Copy, allow for scripts to Copy and AMOD UP and DOWN.
YODA Tools30
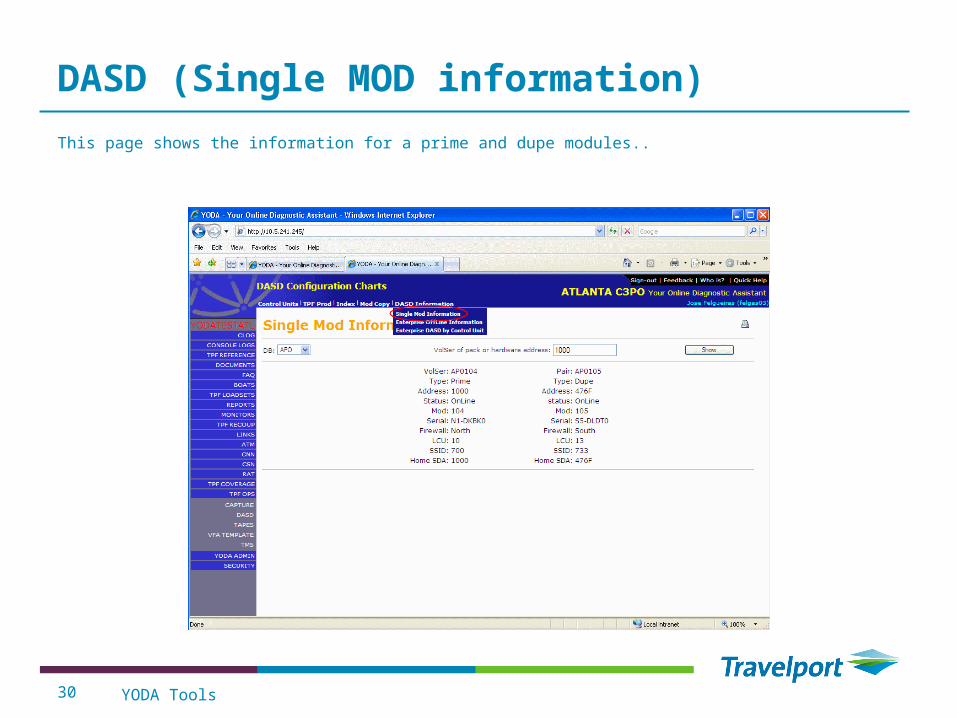
DASD (Single MOD information)
This page shows the information for a prime and dupe modules..
YODA Tools31
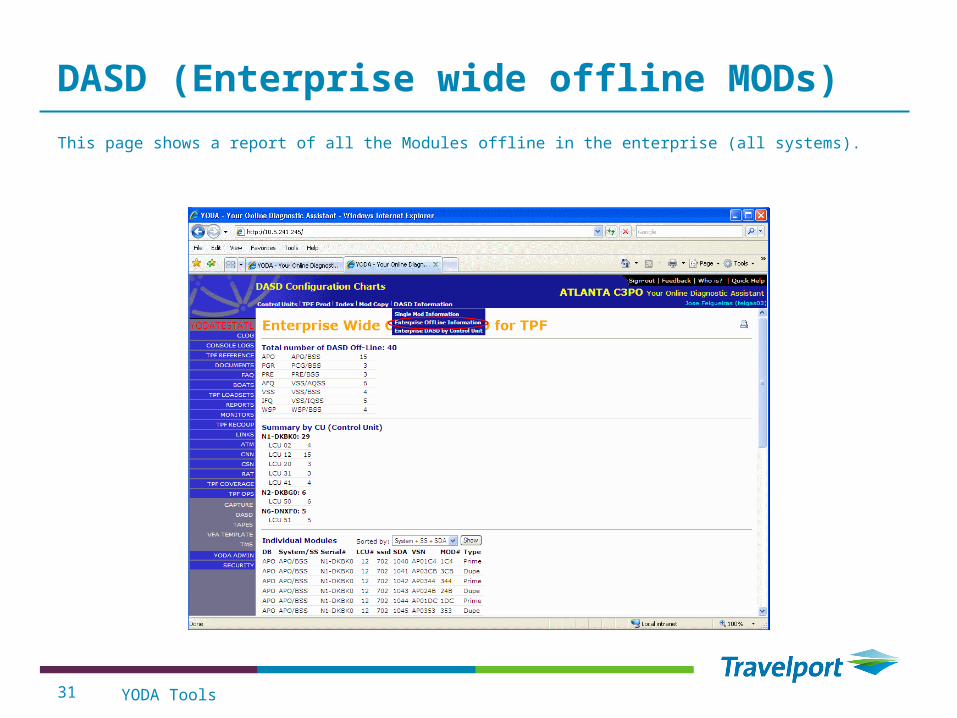
DASD (Enterprise wide offline MODs)
This page shows a report of all the Modules offline in the enterprise (all systems).
YODA Tools32
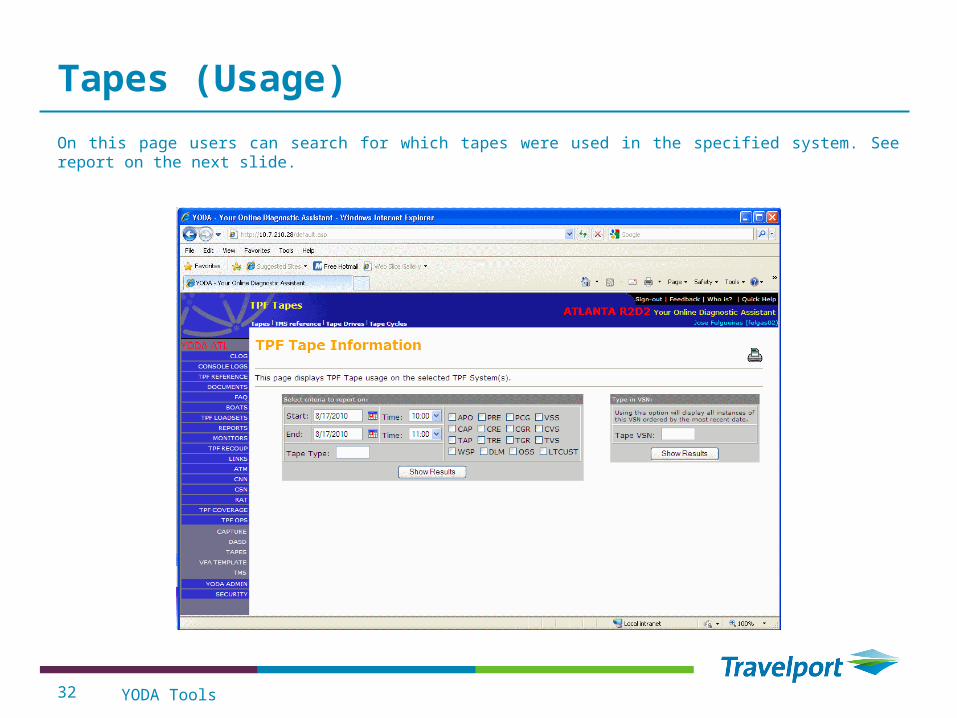
Tapes (Usage)
On this page users can search for which tapes were used in the specified system. See report on the next slide.

YODA Tools33
Tapes (Usage)
This page shows the result of the query from the previous slide. It tell us which RTL tapes were mounted in the requested system/date.

YODA Tools34
CNN (Coverage Notification Network)
This can monitor any TPF utility defined on it. It allows the user to issue a print report of all the utilities run for a specific day.

YODA Tools35
CNN (Runsheet for Complex)
This report shows the RUNSHEET for a Complex since the start to the end of the selected day.
YODA Monitors36
Examples of YODA Monitors
• Graphical Complex Monitor• Dumps In Loads

YODA Monitors37
Graphical Complex Monitors
Graphical Complex Monitor for Production.
YODA Monitors38
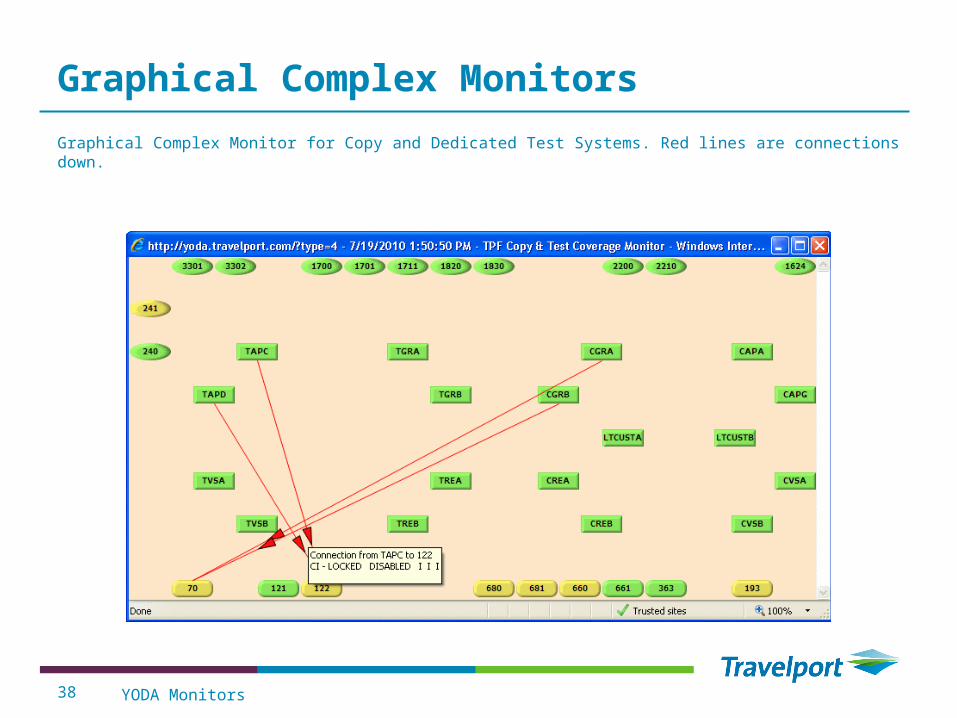
Graphical Complex Monitors
Graphical Complex Monitor for Copy and Dedicated Test Systems. Red lines are connections down.

YODA Monitors39
Dumps in Loads
This monitor keeps track of all the Loads performed to TPF. Clicking on the Loadset-name will show the activation and clicking on the “Pgms” will show all the programs in the Loadset.
YODA Monitors40
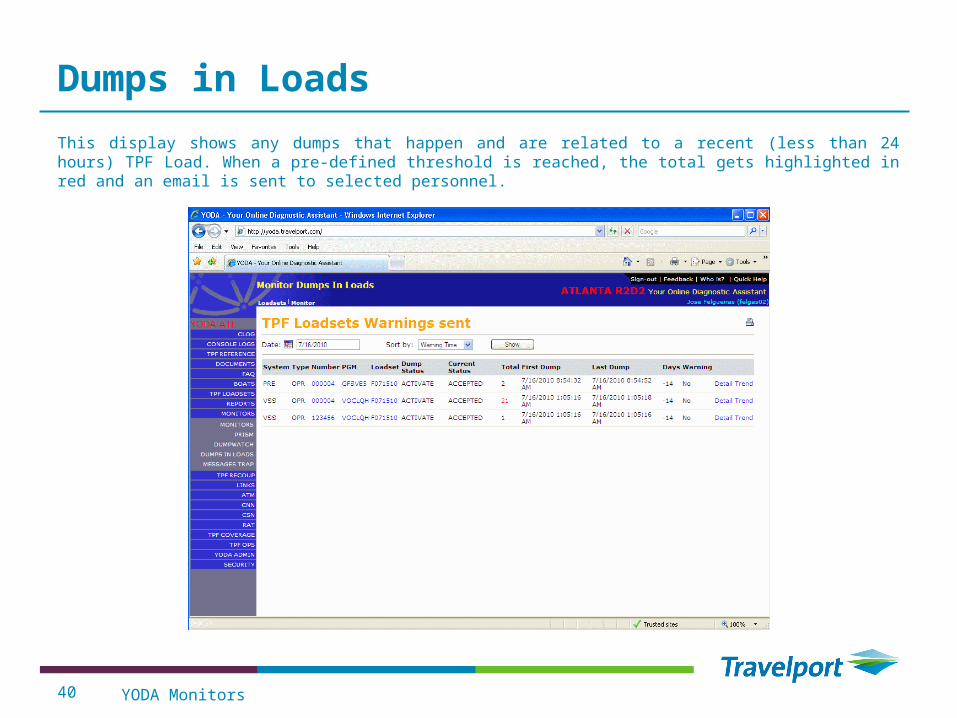
Dumps in Loads
This display shows any dumps that happen and are related to a recent (less than 24 hours) TPF Load. When a pre-defined threshold is reached, the total gets highlighted in red and an email is sent to selected personnel.

YODA Reports41
Examples of YODA Reports
• Apollo Stability (special customer reports)• CRAS Entries (all entries from CRAS sets)• Dumps Reports (real-time). Graphics, Top 10, Search, Trending,
Times, Summary, in Loadsets• Dumps Daily Report• Dumpwatch• RECOUP online and offline analysis and Trending for BC, EA, LA• PDU

YODA Reports42
Apollo Stability
This is a special page that centralizes the most important reports for a customer.

YODA Reports43
Apollo Stability (Top 10 errors)
Sample of one of the Apollo Stability reports.

YODA Reports44
TPF System entries (PRC & CRAS)
This page allows users to search for any entry made to the TPF systems from the Prime CRAS or any other CRAS terminal.

YODA Reports45
TPF System entries (PRC & CRAS)
This page shows the search for the keyword “ZCYCL” for all production systems.

YODA Reports46
Dumps Count Graphics
This page allows all users to display the Dump counts for all systems in several different combinations.

YODA Reports47
Dumps Top 10
This page allows all users to display the Top 10-25 dumps for a system or combination of systems. Application development groups can find out if offending segments belong to them.
YODA Reports48
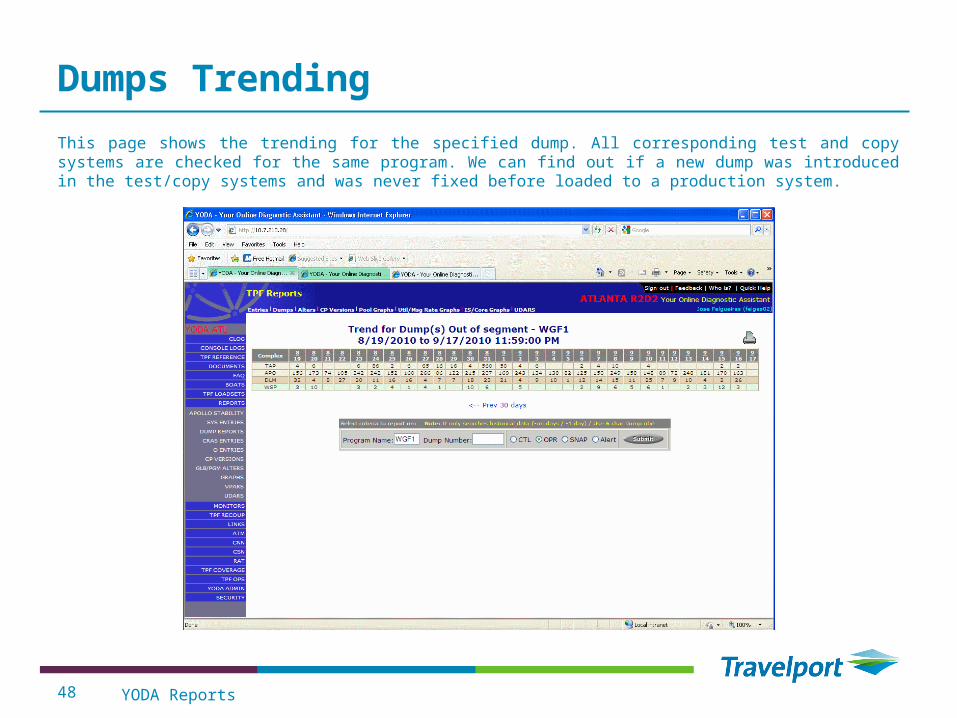
Dumps Trending
This page shows the trending for the specified dump. All corresponding test and copy systems are checked for the same program. We can find out if a new dump was introduced in the test/copy systems and was never fixed before loaded to a production system.

YODA Reports49
Dumps Daily Report
This page shows all the dump (counts) for the day. It displays the new, last 7 days and last 60 days of dumps that occurred today with the mean and standard deviation.
YODA Reports50
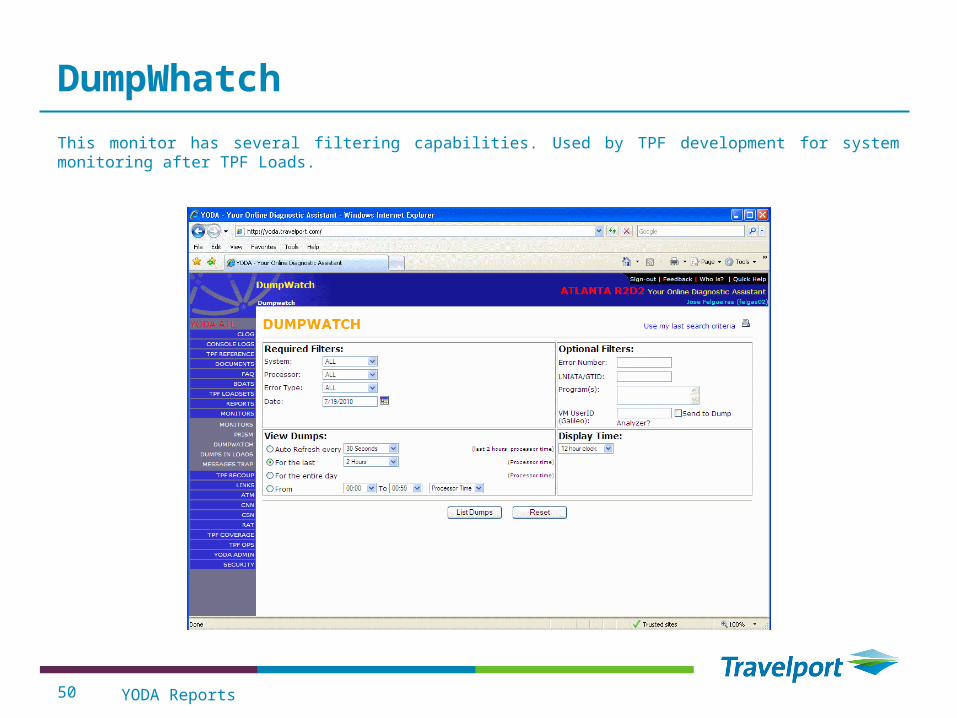
DumpWhatch
This monitor has several filtering capabilities. Used by TPF development for system monitoring after TPF Loads.
YODA Reports51
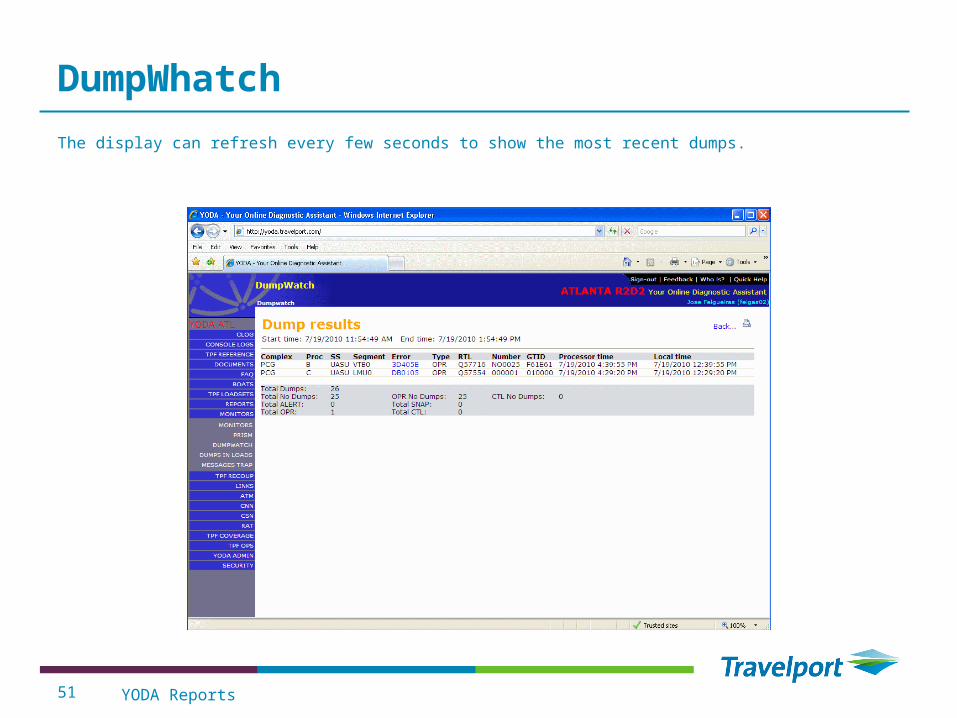
DumpWhatch
The display can refresh every few seconds to show the most recent dumps.

YODA Reports52
Recoup offline Lost Addresses
This page shows the offline Lost Addresses report for the selected system/date. Clicking on the “T” link will show the users the trend for the ID for the last 6 months. Clicking in the record ID will show the ownership and usage of the record. Clicking on the counts will show the top 25 record File Addresses.

YODA Reports53
Recoup offline Lost Addresses trend by ID
This page shows the offline Lost Addresses trend for the last 6 months.
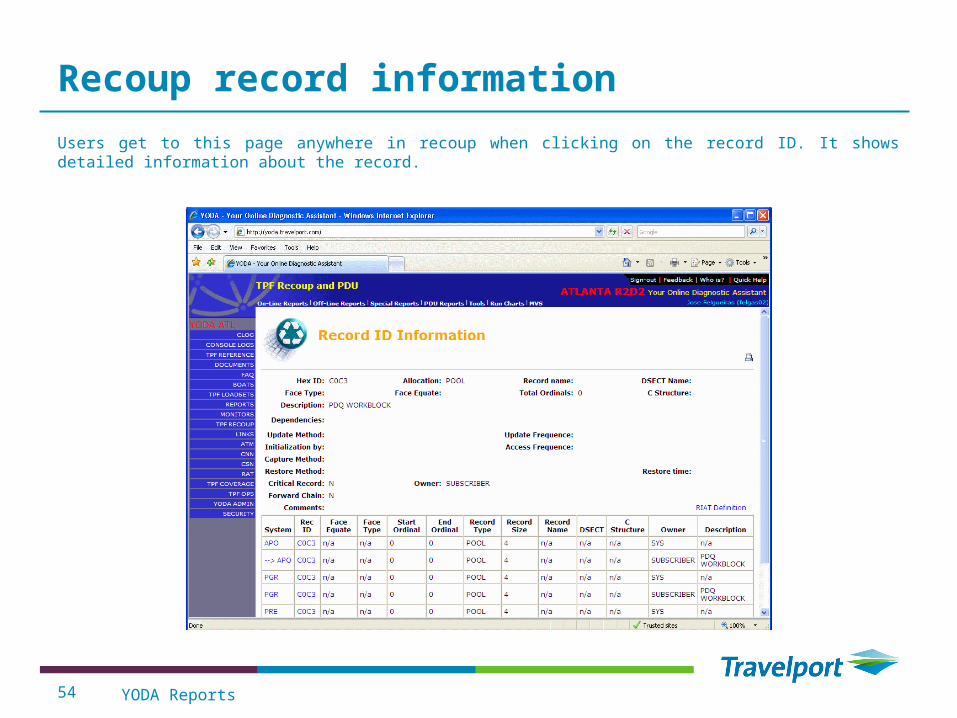
YODA Reports54
Recoup record information
Users get to this page anywhere in recoup when clicking on the record ID. It shows detailed information about the record.

YODA Reports55
Recoup Special reports Lost Addresses
Users can see special reports built to aid in analyzing recoup. These will show trends for the last 6 weeks. This is an example of the Lost Addresses special report where users can compare, week by week, the increase of records by ID.

YODA Reports56
Recoup PDU pool returned
Users can see the PDU runs and returned pools. In this page, users can see the last few runs of a PDU and the amount of pool returned.

57
Questions?
You want what? Operations Lights off?
A while it will be to get there!
For more information, please contact:[email protected] , [email protected] or
58
Copyright
©2010 Travelport Inc. All rights reserved. All Travelport logos and marks as well as all other Travelport proprietary materials depicted herein are the property of Travelport Inc. and/or its affiliates.
Notes About Examples
All screen examples and other inserts associated with system output are provided for illustration purposes only. They are
provided as illustrative examples of system functionality and are not meant to represent actual screen responses, rates,
etc.
Copyright