tuberculosis in the uk 2013 report tables and figures slide-set
TRANSCRIPT

Tuberculosis in the UK 2013 report
Tables and figures slide-set

1. Tuberculosis case reports, UK, 2000-2012
2 Tuberculosis in the UK: 2013 report
0
1
2
3
4
5
6
7
8
9
10
11
12
13
14
15
0
1,000
2,000
3,000
4,000
5,000
6,000
7,000
8,000
9,000
10,000
2000 2001 2002 2003 2004 2005 2006 2007 2008 2009 2010 2011 2012
Rat
e (p
er 1
00,
000)
Nu
mb
er o
f ca
ses
Year
Number of cases Rate per 100,000
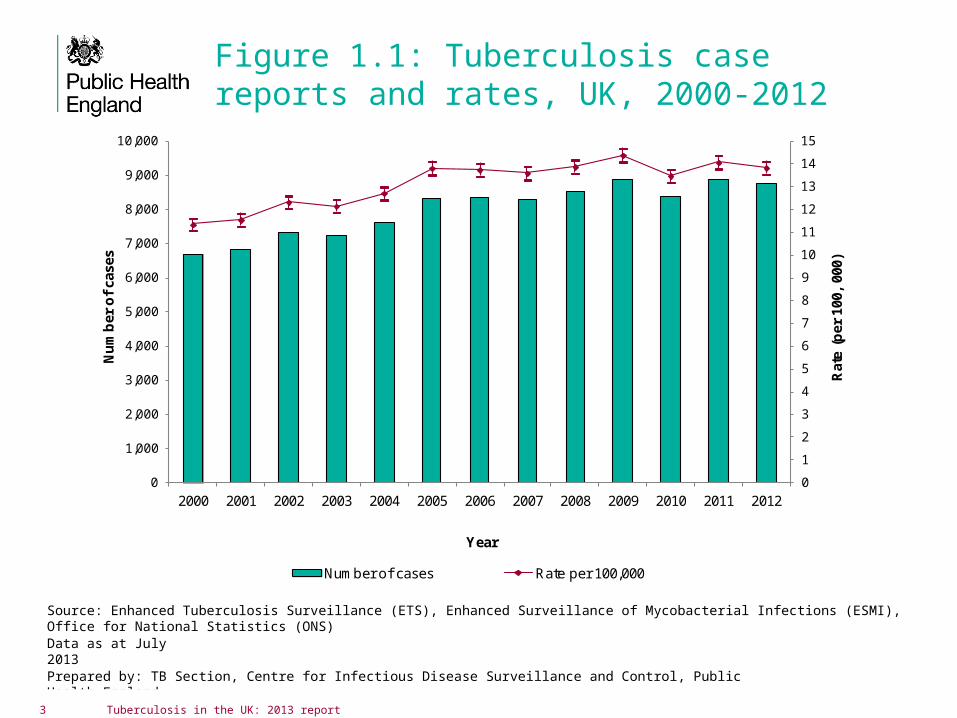
Figure 1.1: Tuberculosis case reports and rates, UK, 2000-2012
Source: Enhanced Tuberculosis Surveillance (ETS), Enhanced Surveillance of Mycobacterial Infections (ESMI), Office for National Statistics (ONS)
Data as at July 2013
Prepared by: TB Section, Centre for Infectious Disease Surveillance and Control, Public Health England
3 Tuberculosis in the UK: 2013 report

Figure 1.2: Tuberculosis case reports and rates by country, UK, 2012
Source: Enhanced Tuberculosis Surveillance (ETS), Enhanced Surveillance of Mycobacterial Infections (ESMI), Office for National Statistics (ONS)
Data as at July 2013
Prepared by: TB Section, Centre for Infectious Disease Surveillance and Control, Public Health England
4 Tuberculosis in the UK: 2013 report
0.0
2.0
4.0
6.0
8.0
10.0
12.0
14.0
16.0
18.0
0
1,000
2,000
3,000
4,000
5,000
6,000
7,000
8,000
9,000
10,000
England Northern Ireland Wales Scotland Total
Rat
e (p
er 1
00,
000)
Nu
mb
er o
f ca
ses
Country
Number of cases Rate per 100,000

5 Tuberculosis in the UK: 2013 report
Figure 1.3. Three-year average tuberculosis case rates by local area*, UK, 2010-2012 *England – Local authorities, Wales and Scotland – Health Boards, NI – data not available
Source: Enhanced Tuberculosis Surveillance (ETS), Enhanced Surveillance of Mycobacterial Infections (ESMI), Office for National Statistics (ONS)Data as at July 2013
Prepared by: TB Section, Centre for Infectious Disease Surveillance and Control, Public Health England
© Crown copyright and database rights 2013 Ordnance Survey 100016969
London
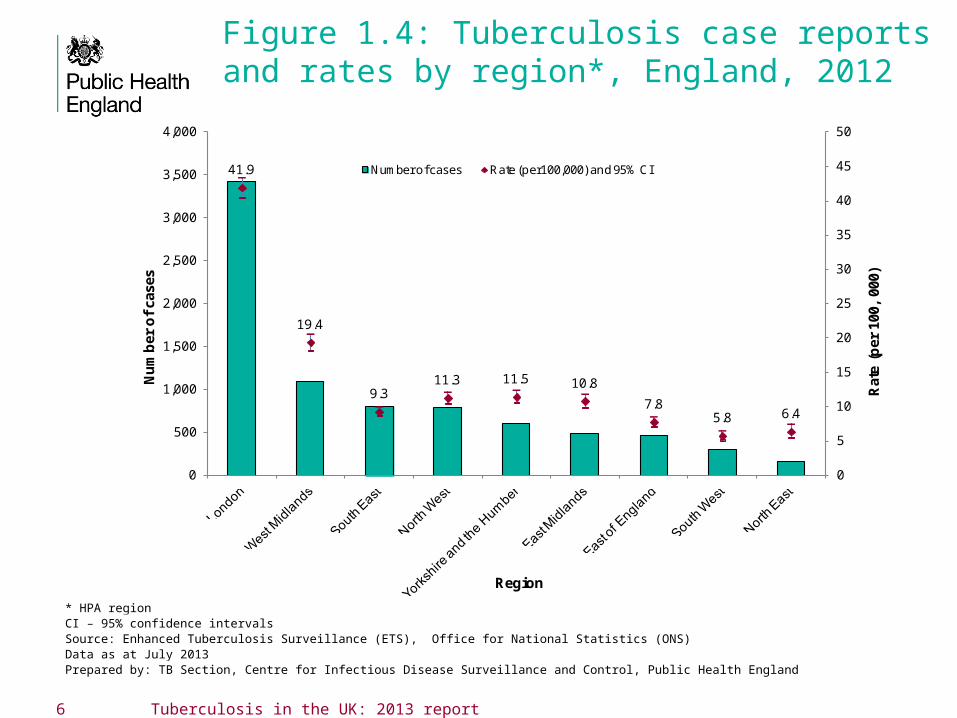
41.9
19.4
9.311.3 11.5 10.8
7.85.8 6.4
0
5
10
15
20
25
30
35
40
45
50
0
500
1,000
1,500
2,000
2,500
3,000
3,500
4,000
Rat
e (p
er 1
00,
000)
Nu
mb
er o
f ca
ses
Region
Number of cases Rate (per100,000) and 95% CI
6 Tuberculosis in the UK: 2013 report
Figure 1.4: Tuberculosis case reports and rates by region*, England, 2012
* HPA regionCI – 95% confidence intervals Source: Enhanced Tuberculosis Surveillance (ETS), Office for National Statistics (ONS) Data as at July 2013 Prepared by: TB Section, Centre for Infectious Disease Surveillance and Control, Public Health England

Figure 1.5: Tuberculosis case reports and rates by PHE Centre, England, 2012
7 Tuberculosis in the UK: 2013 report
6.37.8
4.7
11.0
3.9
10.7
17.3
7.4
41.8
6.4
11.914.5
6.5
19.3
11.4
0
5
10
15
20
25
30
35
40
45
50
0
500
1,000
1,500
2,000
2,500
3,000
3,500
4,000
Rat
e (p
er 1
00,
000)
Nu
mb
er o
f ca
ses
PHE Centre
Number of cases Rate per 100,000
CI - confidence intervals Source: Enhanced Tuberculosis Surveillance (ETS), Office for National Statistics (ONS) Data as at July 2013 Prepared by: TB Section, Centre for Infectious Disease Surveillance and Control, Public Health England

Figure 1.6: Tuberculosis case reports by place of birth and country, UK, 2012
Source: Enhanced Tuberculosis Surveillance (ETS), Enhanced Surveillance of Mycobacterial Infections (ESMI)
Data as at July 2013
Prepared by: TB Section, Centre for Infectious Disease Surveillance and Control, Public Health England
8 Tuberculosis in the UK: 2013 report
5,819
48 185 73
2,020
39 142 56
0%
10%
20%
30%
40%
50%
60%
70%
80%
90%
100%
Per
cen
tag
e o
f ca
ses
Country (% where place of birth known)
Non UK-born UK-born

Figure 1.7: Tuberculosis case reports by place of birth and PHE Centre, England, 2012
92101
352326
73298
701 168227
2,807
192
221 120
35
58100
192130
37101
340 8079
566
115
73 45
43
0%
10%
20%
30%
40%
50%
60%
70%
80%
90%
100%
Per
cen
tag
e o
f ca
ses
PHE Centre (% where place of birth known)
Non UK-born UK-born
Source: Enhanced Tuberculosis Surveillance (ETS), Enhanced Surveillance of Mycobacterial Infections (ESMI)
Data as at July 2013
Prepared by: TB Section, Centre for Infectious Disease Surveillance and Control, Public Health England
9 Tuberculosis in the UK: 2013 report
0
100
200
300
400
500
600
0 5 10 15 20 25 30 35 40 45 50+
Nu
mb
er o
f ca
ses
Years since entry to diagnosis
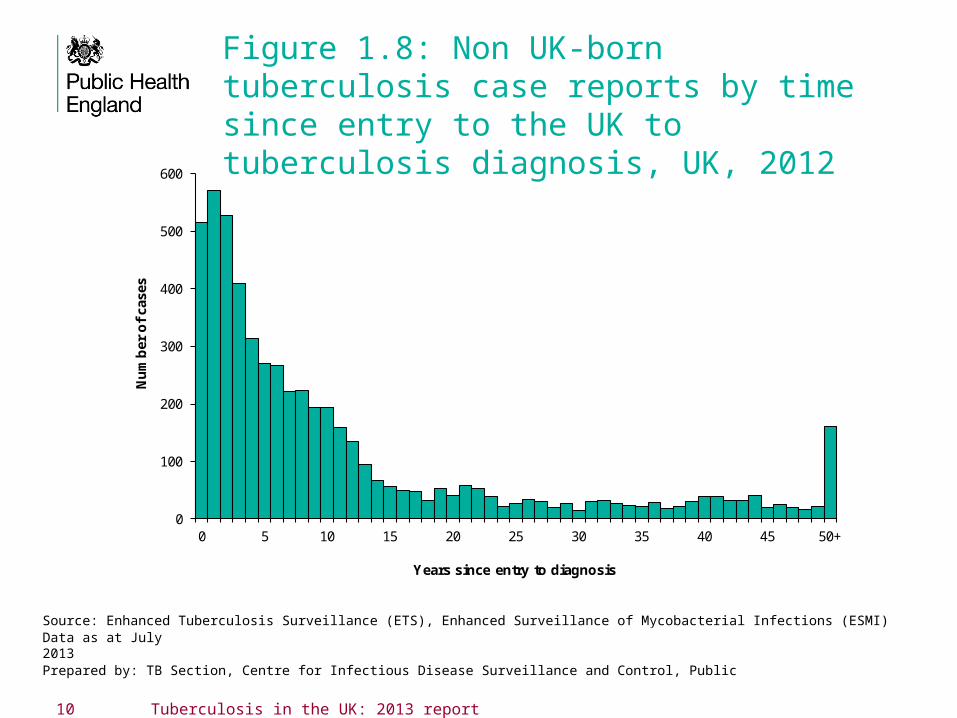
Figure 1.8: Non UK-born tuberculosis case reports by time since entry to the UK to tuberculosis diagnosis, UK, 2012
Source: Enhanced Tuberculosis Surveillance (ETS), Enhanced Surveillance of Mycobacterial Infections (ESMI)
Data as at July 2013
Prepared by: TB Section, Centre for Infectious Disease Surveillance and Control, Public Health England
10 Tuberculosis in the UK: 2013 report

Table 1.1: Most frequent countries of birth for non UK-born tuberculosis cases, UK, 2012
* Where country of birth was known; **Years
Source: Enhanced Tuberculosis Surveillance (ETS), Enhanced Surveillance of Mycobacterial Infections (ESMI)
Data as at July 2013
Prepared by: TB Section, Centre for Infectious Disease Surveillance and Control, Public Health England
11 Tuberculosis in the UK: 2013 report
Country of birthNumber of
casesPercentage
of cases*Median time since
entry UK (IQR)**
India 1,858 30.7 4 (2 - 13)
Pakistan 1,091 18.0 7 (2 - 21)
Somalia 380 6.3 8 (3 - 12)
Bangladesh 276 4.6 7 (2 - 23)
Nepal 216 3.6 2 (1 - 5)
Nigeria 184 3.0 5 (1 - 10)
Philippines 136 2.3 5 (2 - 9)
Zimbabwe 132 2.2 9 (7 - 11)
Kenya 98 1.6 13 (6 - 40)
Sri Lanka 98 1.6 7 (2 - 15)
Eritrea 87 1.4 4 (2 - 5)
Romania 78 1.3 2 (0 - 4)
Afghanistan 75 1.2 5 (2 - 10)
Poland 71 1.2 5 (2 - 7)
Others (each <1%) 1,265 21.1 5 (1 - 13)
Total* 6,045 100 6 (2 -13)

Figure 1.9: Tuberculosis case reports and rates by ethnic group and place of birth, England, Wales and Northern Ireland, 2012
3
2836
1231 39
187 6 9
30
178
53
243
215
123
27
68
0
50
100
150
200
250
300
0
500
1,000
1,500
2,000
Whi
te
Bla
ck-C
arib
bea
n
Bla
ck-A
fric
an
Bla
ck-O
ther
Ind
ian
Pak
ista
ni
Ban
gla
des
hi
Chi
nese
Mix
ed /
Oth
er
Whi
te
Bla
ck-C
arib
bea
n
Bla
ck-A
fric
an
Bla
ck-O
ther
Ind
ian
Pak
ista
ni
Ban
gla
des
hi
Chi
nese
Mix
ed /
Oth
er
UK-born Non UK-born
Rat
e (p
er 1
00,0
00)
Nu
mb
er o
f ca
ses
Place of birth/Ethnic group
Number of cases
Rate (per 100,000)
Source: Enhanced Tuberculosis Surveillance (ETS), Rates by place of birth calculated using Labour Force Survey population estimates.
Data as at July 2013
Prepared by: TB Section, Centre for Infectious Disease Surveillance and Control, Public Health England
12 Tuberculosis in the UK: 2013 report

Figure 1.10: Tuberculosis case reports and rates by age group and place of birth, UK, 2012
Source: Enhanced Tuberculosis Surveillance (ETS), Enhanced Surveillance of Mycobacterial Infections (ESMI), Office for National Statistics (ONS)
Data as at July 2013
Prepared by: TB Section, Centre for Infectious Disease Surveillance and Control, Public Health England
0
20
40
60
80
100
120
140
0
100
200
300
400
500
600
700
800
900
1,000
1,100
1,200
Rat
e (p
er 1
00,0
00)
Nu
mb
er o
f ca
ses
Age group (years)
UK-born Non UK-born
Rate in UK-born Rate in non UK-born
13 Tuberculosis in the UK: 2013 report
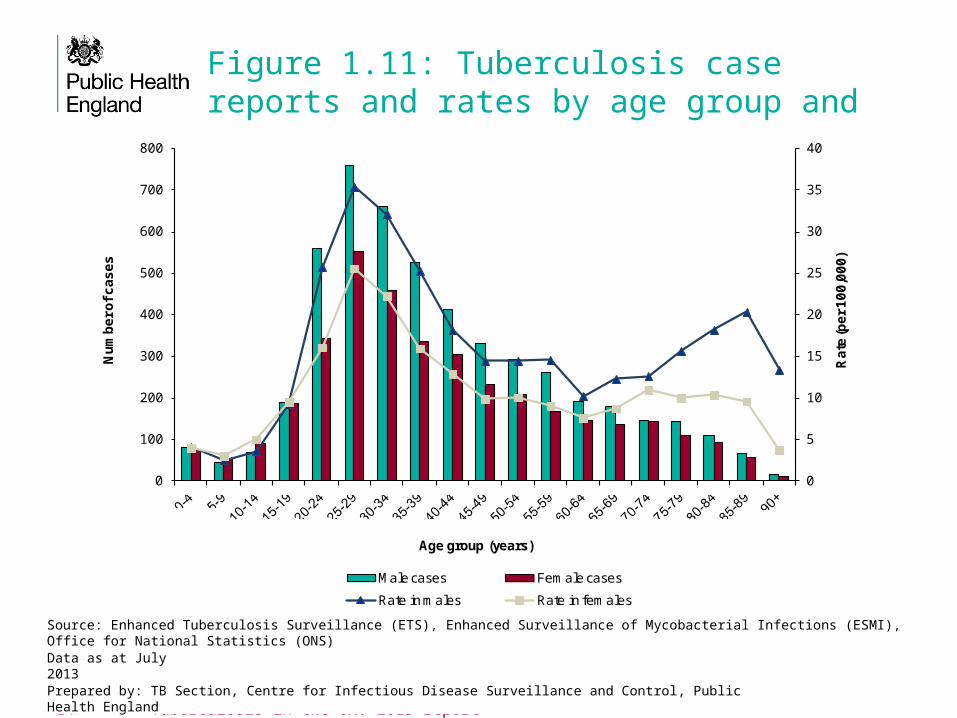
Figure 1.11: Tuberculosis case reports and rates by age group and sex, UK, 2012
0
5
10
15
20
25
30
35
40
0
100
200
300
400
500
600
700
800
Ra
te (p
er
10
0,0
00
)
Nu
mb
er
of
ca
se
s
Age group (years)
Male cases Female cases
Rate in males Rate in females
14 Tuberculosis in the UK: 2013 report
Source: Enhanced Tuberculosis Surveillance (ETS), Enhanced Surveillance of Mycobacterial Infections (ESMI), Office for National Statistics (ONS)
Data as at July 2013
Prepared by: TB Section, Centre for Infectious Disease Surveillance and Control, Public Health England

Figure 1.12: Tuberculosis case reports and rates by place of birth, UK, 2000-2012
4 4 4 4 4 4 4 4 4 4 4 4 4
76 77
88 8993
9891
85 86 8682 84
80
0
20
40
60
80
100
120
0
1,000
2,000
3,000
4,000
5,000
6,000
7,000
2000 2001 2002 2003 2004 2005 2006 2007 2008 2009 2010 2011 2012
Rat
e (p
er 1
00,0
00)
Nu
mb
er o
f ca
ses
Year
UK-born Non UK-born
Rate UK-born Rate Non UK-born
15 Tuberculosis in the UK: 2013 report
Source: Enhanced Tuberculosis Surveillance (ETS), Enhanced Surveillance of Mycobacterial Infections (ESMI), Office for National Statistics (ONS)
Data as at July 2013
Prepared by: TB Section, Centre for Infectious Disease Surveillance and Control, Public Health England

Figure 1.13: Proportion of tuberculosis case reports by site of disease (pulmonary/extra-pulmonary), UK, 2000-2012
Source: Enhanced Tuberculosis Surveillance (ETS), Enhanced Surveillance of Mycobacterial Infections (ESMI)
Data as at July 2013
Prepared by: TB Section, Centre for Infectious Disease Surveillance and Control, Public Health England
16 Tuberculosis in the UK: 2013 report
0
10
20
30
40
50
60
70
80
90
100
2000 2001 2002 2003 2004 2005 2006 2007 2008 2009 2010 2011 2012
Per
cen
tag
e o
f ca
ses
(%)
Year
Pulmonary Extra-pulmonary

Table 1.2: Tuberculosis case reports by site of disease, UK, 2012
Site of disease* Number of cases Percentage**
Pulmonary 4,563 52.1
Extra-thoracic lymph nodes 1,872 21.4
Intra-thoracic lymph nodes 946 10.8
Other extra-pulmonary 619 7.1
Pleural 651 7.4
Gastrointestinal 471 5.4
Bone – spine 394 4.5
Cryptic± 46 0.5
Miliary± 197 2.3
Bone – other 218 2.5
CNS – meningitis 187 2.1
Genitourinary 137 1.6
CNS – other 80 0.9
Laryngeal 16 0.2
Unknown extra-pulmonary 15 0.2
17 Tuberculosis in the UK: 2013 report
Source: Enhanced Tuberculosis Surveillance (ETS), Enhanced Surveillance of Mycobacterial Infections (ESMI)
Data as at July 2013
Prepared by: TB Section, Centre for Infectious Disease Surveillance and Control, Public Health England
*With or without disease at another site **Percentage of cases with known sites of disease (8751)±For Scotland cases, this includes both cryptic and miliary site
CNS - Central Nervous System Total percentage exceeds 100% due to infections at more than one site

Figure 1.14: Child to adult ratio in notifications rate, UK, 2000-2012
The child-to-adult ratio is the ratio of the case notification rate in children under 15 years of age, to that in adults. A declining trend in the ratio suggests a decrease in ongoing transmission (European Centre for Disease Prevention and Control).
0.00
0.10
0.20
0.30
0.40
2000 2001 2002 2003 2004 2005 2006 2007 2008 2009 2010 2011 2012
Rat
io:
case
no
tifi
cati
on
rat
e ch
ild
ren
/ad
ult
s
Source: Enhanced Tuberculosis Surveillance (ETS), Enhanced Surveillance of Mycobacterial Infections (ESMI)
Data as at July 2013
Prepared by: TB Section, Centre for Infectious Disease Surveillance and Control, Public Health England
18 Tuberculosis in the UK: 2013 report

2. Microscopy, culture confirmation, speciation and drug susceptibility
19 Tuberculosis in the UK: 2013 report
20 Tuberculosis in the UK: 2013 report
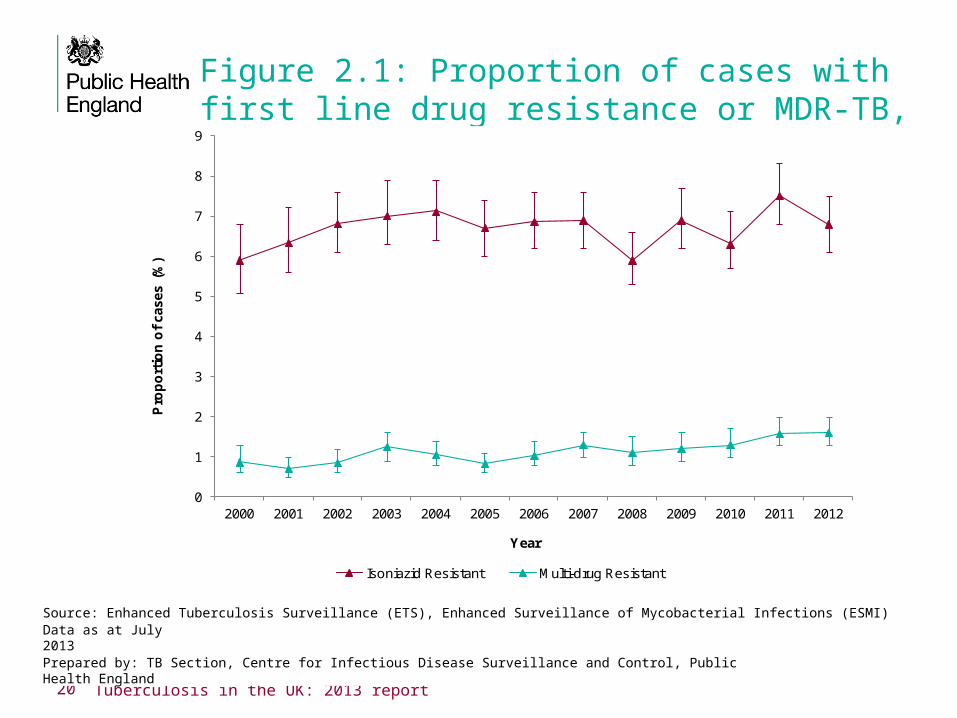
Figure 2.1: Proportion of cases with first line drug resistance or MDR-TB, UK, 2000-2012
0
1
2
3
4
5
6
7
8
9
2000 2001 2002 2003 2004 2005 2006 2007 2008 2009 2010 2011 2012
Pro
po
rtio
n o
f cas
es (
%)
Year
Isoniazid Resistant Multi-drug Resistant
Source: Enhanced Tuberculosis Surveillance (ETS), Enhanced Surveillance of Mycobacterial Infections (ESMI)
Data as at July 2013
Prepared by: TB Section, Centre for Infectious Disease Surveillance and Control, Public Health England

21 Tuberculosis in the UK: 2013 report
Table 2.1: Number and proportion of tuberculosis cases with drug resistance by age group, UK, 2012
n % n % n %
0-14 10 9.7 10 9.7 7 6.8 103
15-44 240 7.2 264 7.9 65 2.0 3,333
45-65 77 7.6 78 7.7 8 0.8 1012
65+ 24 3.4 27 3.8 1 0.1 703
Age Group
Isoniazid Resistant to any Multi-drug
Total**resistant first line drug* resistant
*First line drugs - isoniazid, rifampicin, ethambutol and pyrazinamide**First line drugs – isoniazid, rifampicin, ethambutol and pyrazinamide**Culture confirmed cases with drug susceptibility results for at least isoniazid and rifampicin
Source: Enhanced Tuberculosis Surveillance (ETS), Enhanced Surveillance of Mycobacterial Infections (ESMI)
Data as at July 2013
Prepared by: TB Section, Centre for Infectious Disease Surveillance and Control, Public Health England
22 Tuberculosis in the UK: 2013 report
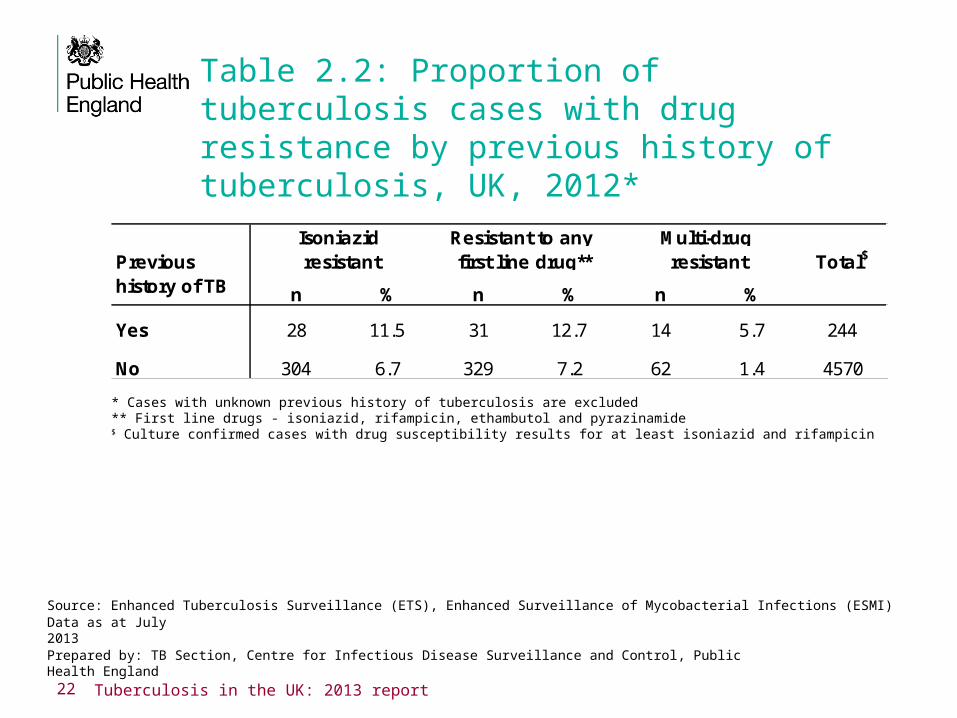
Table 2.2: Proportion of tuberculosis cases with drug resistance by previous history of tuberculosis, UK, 2012*
* Cases with unknown previous history of tuberculosis are excluded** First line drugs - isoniazid, rifampicin, ethambutol and pyrazinamide$ Culture confirmed cases with drug susceptibility results for at least isoniazid and rifampicin
Source: Enhanced Tuberculosis Surveillance (ETS), Enhanced Surveillance of Mycobacterial Infections (ESMI)
Data as at July 2013
Prepared by: TB Section, Centre for Infectious Disease Surveillance and Control, Public Health England
n % n % n %
Yes 28 11.5 31 12.7 14 5.7 244
No 304 6.7 329 7.2 62 1.4 4570
Previous history of TB
Isoniazid Multi-drugTotal$resistant resistant
Resistant to any first line drug**

23 Tuberculosis in the UK: 2013 report
Table 2.3: Number and proportion of tuberculosis cases with drug resistance by place of birth, UK, 2012*
* Cases with unknown previous history of tuberculosis are excluded** First line drugs - isoniazid, rifampicin, ethambutol and pyrazinamide$ Culture confirmed cases with drug susceptibility results for at least isoniazid and rifampicin
n % n % n %
UK born 64 5.3 70 5.8 9 0.7 1,216
Non-UK born 274 7.4 296 8.0 71 1.9 3,709
Central Europe 6 4.3 6 4.3 5 3.6 139
East Europe 19 35.2 20 37.0 13 24.1 54
West Europe 10 10.4 10 10.4 5 5.2 96
East Mediterranean 2 4.9 3 7.3 0 0.0 41
East Asia 4 6.5 4 6.5 0 0.0 62
South Asia 151 7.0 163 7.6 31 1.4 2,144
South East Asia 19 10.1 23 12.2 2 1.1 189
North Africa 0 0.0 0 0.0 0 0.0 35
Sub-Saharan Africa 51 6.2 54 6.6 13 1.6 819
North America and Oceania 0 0.0 0 0.0 0 0.0 5
South and Central America and the Caribbean 7 10.3 8 11.8 0 0.0 68
Total$Place of birthIsoniazid
resistant
Resistant to any
first line drug**
Multi-drug
resistant
Source: Enhanced Tuberculosis Surveillance (ETS), Enhanced Surveillance of Mycobacterial Infections (ESMI)
Data as at July 2013
Prepared by: TB Section, Centre for Infectious Disease Surveillance and Control, Public Health England

24 Tuberculosis in the UK: 2013 report
54
243
7
54
8
20
1
13
0
2
4
6
8
10
12
14
UK-born Non UK-born UK-born Non UK-born
Isoniazid resistant Multi-drug resistant
Pro
po
rtio
n o
f ca
ses
(%)
No previous history of TB
Previous history of TB
Source: Enhanced Tuberculosis Surveillance (ETS), Enhanced Surveillance of Mycobacterial Infections (ESMI)
Data as at July 2013
Prepared by: TB Section, Centre for Infectious Disease Surveillance and Control, Public Health England
* Cases with unknown place of birth and unknown previous history of TB are not includedCulture confirmed cases with drug susceptibility results for at least isoniazid and rifampicin
Figure 2.2: Proportion of tuberculosis cases isoniazid and multi-drug resistance by place of birth and previous history of tuberculosis, UK, 2012*

25 Tuberculosis in the UK: 2013 report
Source: Enhanced Tuberculosis Surveillance (ETS), Enhanced Surveillance of Mycobacterial Infections (ESMI)
Data as at July 2013
Prepared by: TB Section, Centre for Infectious Disease Surveillance and Control, Public Health England
*Proportion were calculated out of those who were tested
Figure 2.3: Proportion* of multi-drug resistance cases from Eastern Europe, South Asia and Sub-Saharan Africa with additional resistance, UK, 2012
4
8 8
2 25
14
32
0
2
8
0 0 00
10
20
30
40
50
60
70
80
90
100
Resistant to all 1stline drugs (H, R, E
and Z)
Resistant to at leastone second line drug
Resistant to at leastone injectable drug
Resistant to at leastone Fluoroquinolone
Extensively drugresistant tuberculosis
(XDR)
Pro
po
rtio
n o
f M
DR
cas
es (
%)
Eastern Europe
South Asia
Sub-Saharan Africa

3. Strain typing, 2010-2012
26 Tuberculosis in the UK: 2013 report

Table 3.1: Number and proportion of culture confirmed cases typed or with 23 loci typed by year and country
27 Tuberculosis in the UK: 2013 report
Culture confirmed
cases
Cases with a strain type*
Number of cases
clustered**
Number of clusters
Estimated proportion of cases likely due to
recent transmission$
n n (%) n n % 2-4 5-9 10+
England, Wales and Northern Ireland‡ 14,692 11,745 (79.9) 6,113 1,401 40 1,110 198 93
England§ 14,248 11,491 (80.6) 5,973 1,371 40 1,084 198 89
Wales 296 167 (56.4) 26 12 8 12 0 0
Northern Ireland# 148 87 (58.8) 21 9 14 9 0 0
Number of clusters by cluster
size
Source: Enhanced Tuberculosis Surveillance (ETS)
Data as at July 2013
Prepared by: TB Section, Centre for Infectious Disease Surveillance and Control, Public Health England
* Culture confirmed cases with a MIRU-VNTR profile with at least 23 complete loci** Clustered cases are clustered within geographical area$ Calculated using the n-1 method (number of cases in a cluster-number of clusters/number of cases with a strain type)‡ The number of clusters in England, Wales and Northern Ireland is higher than the sum of all clusters in the three countries because it includes clusters that span more than one country§ The number of clusters in England is higher than the sum of all PHEC clusters because it includes clusters that span more than PHEC# The number of culture confirmed cases in Northern Ireland reported here is less than the 157 culture confirmed cases known about locally

Table 3.2: Number of tuberculosis cases and proportion of clustering stratified by place of birth, 2010-2012
Source: Enhanced Tuberculosis Surveillance (ETS)
Data as at July 2013
Prepared by: TB Section, Centre for Infectious Disease Surveillance and Control, Public Health England
Culture confirmed
cases
Cases with a strain type*
Number of cases
clustered
Number of clusters
Estimated proportion of cases likely due to
recent transmission**
Proportion of cases with a unique strain
n n (%) n n % %
England, Wales and
Northern Ireland$ 14,692 11,745 (80) 6,113 1,401 40 48.0
UK-born‡ 3,327 2,756 (82.8) 1,779 669 40 35.4
Non UK-born§ 10,782 8,549 (79.3) 4,111 1,229 34 51.9
* Culture confirmed cases with a MIRU-VNTR profile with at least 23 complete loci** Calculated using the n-1 method (number of cases in a cluster-number of clusters/number of cases with a strain type)$ The number of cases in England, Wales and Northern Ireland is higher than the sum UK-born and non UK-born as 583 cases have unknown UK-born information‡ Number of clusters with at least one UK-born person in the cluster§ Number of clusters with at least one non UK-born person in the cluster
28 Tuberculosis in the UK: 2013 report

4. TB treatment outcomes, UK, 2001-2011
29 Tuberculosis in the UK: 2013 report

30 Tuberculosis in the UK: 2013 report
Table 4.1: Treatment outcome at 12 months for tuberculosis cases, UK, 2011*
* Excludes MDR-TB and RMP-resistant TB cases. Not evaluated includes missing, unknown and transferred out
Source: Enhanced Tuberculosis Surveillance (ETS), Enhanced Surveillance of Mycobacterial Infections (ESMI)
Data as at July 2013
Prepared by: TB Section, Centre for Infectious Disease Surveillance and Control, Public Health England
Treatment outcome n %
Completed 7,302 82.9
Died 434 4.9
Lost to follow-up 435 4.9
Still on treatment 289 3.3
Stopped 88 1.0
Not evaluated 257 2.9
Total 8,805 100
31 Tuberculosis in the UK: 2013 report
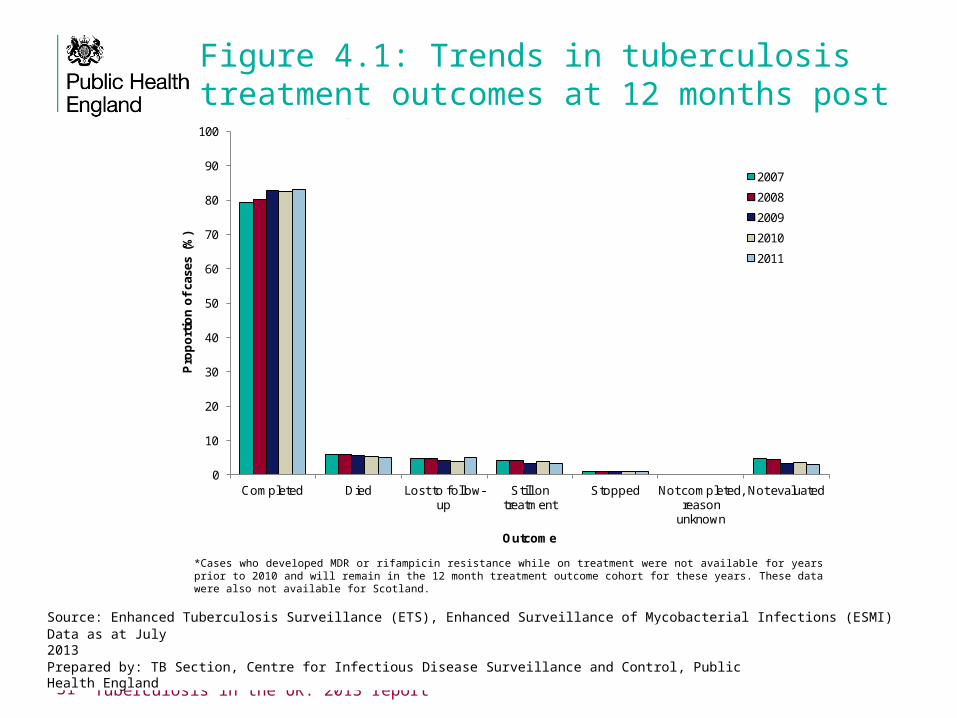
Figure 4.1: Trends in tuberculosis treatment outcomes at 12 months post start of treatment, UK*
*Cases who developed MDR or rifampicin resistance while on treatment were not available for years prior to 2010 and will remain in the 12 month treatment outcome cohort for these years. These data were also not available for Scotland.
Source: Enhanced Tuberculosis Surveillance (ETS), Enhanced Surveillance of Mycobacterial Infections (ESMI)
Data as at July 2013
Prepared by: TB Section, Centre for Infectious Disease Surveillance and Control, Public Health England
0
10
20
30
40
50
60
70
80
90
100
Completed Died Lost to follow-up
Still on treatment
Stopped Not completed, reason
unknown
Not evaluated
Pro
po
rtio
n o
f ca
ses
(%)
Outcome
2007
2008
2009
2010
2011

32 Tuberculosis in the UK: 2013 report
Figure 4.2: Proportion of cases completing treatment by Country and PHE Centre, UK, 2011
0
10
20
30
40
50
60
70
80
90
100P
erce
nta
ge
of
case
s
Country/PHE centre
Source: Enhanced Tuberculosis Surveillance (ETS), Enhanced Surveillance of Mycobacterial Infections (ESMI)
Data as at July 2013
Prepared by: TB Section, Centre for Infectious Disease Surveillance and Control, Public Health England

33 Tuberculosis in the UK: 2013 report
Table 4.1: Relationship between tuberculosis diagnosis and cause of death at 12 months, UK, 2011
Relationship between TB and death n %
TB caused death 63 14.5
TB contributed to death 123 28.3
TB incidental to death 109 25.1
Unknown 139 32.0
Total 434 100
Source: Enhanced Tuberculosis Surveillance (ETS), Enhanced Surveillance of Mycobacterial Infections (ESMI)
Data as at July 2013
Prepared by: TB Section, Centre for Infectious Disease Surveillance and Control, Public Health England

34 Annual report on tuberculosis surveillance in the UK 2013
Figure 4.3: Treatment outcomes at 12 months for tuberculosis cases by place of birth, UK, 2011
Source: Enhanced Tuberculosis Surveillance (ETS), Enhanced Surveillance of Mycobacterial Infections (ESMI)
Data as at July 2013
Prepared by: TB Section, Centre for Infectious Disease Surveillance and Control, Public Health England
0
10
20
30
40
50
60
70
80
90
100
Completed Died Lost to follow-up Still on treatment
Stopped Not evaluated
Pro
po
rtio
n o
f ca
ses
(%)
Outcome
Non UK-born
UK-born

35 Annual report on tuberculosis surveillance in the UK 2013
Figure 4.4: Treatment outcomes at 12 months for tuberculosis cases with at least one social risk factor, UK, 2011
0
10
20
30
40
50
60
70
80
90
Completed Died Lost to follow-up Still on treatment Stopped Not evaluated
Per
cen
tag
e o
f ca
ses
Outcome
No known social risk factor
Known social risk factor
Source: Enhanced Tuberculosis Surveillance (ETS), Enhanced Surveillance of Mycobacterial Infections (ESMI)
Data as at July 2013
Prepared by: TB Section, Centre for Infectious Disease Surveillance and Control, Public Health England
0
10
20
30
40
50
60
70
80
90
Completed Died Lost to follow-up Still on treatment Stopped Not evaluated
Pro
po
rtio
n o
f ca
ses
(%)
Outcome
No known social risk factor
Known social risk factor

36 Annual report on tuberculosis surveillance in the UK 2013
Figure 4.5: Treatment outcomes at 12 months for tuberculosis cases with previous history of TB, UK, 2011
0
10
20
30
40
50
60
70
80
90
Completed Died Lost to follow-up Still on treatment Stopped Not evaluated
Pro
po
rtio
n o
f ca
ses
(%)
Outcome
No previous history of TB
Previous history of TB
Source: Enhanced Tuberculosis Surveillance (ETS), Enhanced Surveillance of Mycobacterial Infections (ESMI)
Data as at July 2013
Prepared by: TB Section, Centre for Infectious Disease Surveillance and Control, Public Health England

37 Annual report on tuberculosis surveillance in the UK 2013
Table 4.3: Treatment outcome at 24 months for MDR and rifampicin resistant tuberculosis cases, UK, 2010
Treatment outcome n %
Completed 49 72.1
Died 0 0.0
Lost to follow-up 6 8.8
Still on treatment 7 10.3
Stopped 4 5.9
Not completed, no reason 1 1.5
Not evaluated 1 1.5
Total 68 100
Source: Enhanced Tuberculosis Surveillance (ETS), Enhanced Surveillance of Mycobacterial Infections (ESMI)
Data as at July 2013
Prepared by: TB Section, Centre for Infectious Disease Surveillance and Control, Public Health England