tuberculosis in new south wales - health.nsw.gov.au · • there were 540 tuberculosis (tb) cases...
TRANSCRIPT

Tuberculosis in New South Wales
Surveillance Report 2017

1
Produced by: NSW TB Program COMMUNICABLE DISEASES BRANCH Health Protection NSW Locked Mail Bag 961 North Sydney NSW 2059 Email: [email protected] www.health.nsw.gov.au/infectious/pages/default.aspx This work is copyright. It may be reproduced in whole or in part for study and training purposes subject to the inclusion of an acknowledgement of the source. It may not be reproduced for commercial usage or sale. Reproduction for purposes other than those indicated above requires written permission from Health Protection NSW. SHPN (HP NSW) 190008 ISBN 978-1-76081-061-0 Suggested citation: NSW Tuberculosis Program, Communicable Diseases Branch. Tuberculosis in New South Wales – Surveillance Report 2017. Sydney: Health Protection NSW, 2019. © Health Protection NSW 2019 January 2019

2
Contents
Summary ...................................................................................................................................................................... 3 Introduction .................................................................................................................................................................. 4 Methods ....................................................................................................................................................................... 5
Definitions ................................................................................................................................................................. 5 Statistical analyses ..................................................................................................................................................... 6
Section 1: Demographics ................................................................................................................................................. 7 Demographics ............................................................................................................................................................ 8 Age and Sex .............................................................................................................................................................. 8 Place of residence ...................................................................................................................................................... 9 Country of Birth ....................................................................................................................................................... 10 Australian born cases ................................................................................................................................................ 13 Overseas born cases ................................................................................................................................................. 13 Length of Stay in Australia ......................................................................................................................................... 14 Risk Factors ............................................................................................................................................................. 15 HIV Testing ............................................................................................................................................................. 16
Section 2: Clinical Presentation....................................................................................................................................... 17 Site of Infection ....................................................................................................................................................... 17 Laboratory Testing ................................................................................................................................................... 18 Drug susceptibility testing (DST) ................................................................................................................................. 19 Disease Classification and Treatment........................................................................................................................... 20
Section 3: Outcomes .................................................................................................................................................... 21 Clinical Outcomes ..................................................................................................................................................... 21 Contact Investigations............................................................................................................................................... 22
Section 4: Discussion .................................................................................................................................................... 23 Conclusion: ............................................................................................................................................................. 24 Acknowledgements:.................................................................................................................................................. 24
References .................................................................................................................................................................. 25

3
Summary
• There were 540 tuberculosis (TB) cases notified in New South Wales (NSW) in 2017, similar to the number notified in 2016.
• Notification rate was 6.9 cases per 100,000 population. • Overseas born TB cases accounted for 91% of cases. The most frequently reported countries of birth were
India, Vietnam and Philippines. • Of the 50 Australian born cases, five (10%) identified as Aboriginal or Torres Strait Islander people. • Notification rates were highest in Western Sydney and Sydney Local Health Districts. • The most frequently reported risk factors were being born, or past residence (≥3mths), in a high risk country
for TB, having an immunosuppressive health condition or being on immunosuppressive therapy, or known contact with TB.
• 78% of cases had laboratory confirmation by culture or polymerase chain reaction (PCR), with 22% of cases receiving a clinical diagnosis only.
• Of those cases with laboratory confirmation, eight cases were classified as having multi-drug resistant TB (MDR-TB) and no cases had extensively drug resistant TB (XDR-TB). This represents 1% of all cases and is consistent with previous years.

4
Introduction Tuberculosis (TB) is a bacterial disease caused by infection with Mycobacterium tuberculosis. Globally TB remains a disease of public health significance with the World Health Organization (WHO) estimating 10 million new cases in 2017, and an estimated 1.6 million deaths [1]. People living with HIV have a 16-27 times greater risk of developing TB than those without HIV [2]. Drug resistant TB is an increasing threat globally, with over 550,000 cases of rifampicin resistant TB estimated worldwide in 2017, of which 82%, 451,000 cases, had multi drug resistant TB (MDR-TB) [1]. Almost half of these cases were reported from three countries – India, China, and the Russian Federation [1]. Australia continues to have a low incidence of TB, with the Australian Government Department of Health reporting a rate of 5.8 cases per 100,000 population in 2017 [3]. In 2014, the proportion of TB cases with HIV/TB co-infection in Australia was reported at 2% [4]. Mortality from TB in Australia is very low with 1% of cases reported to have died from TB in 2014 [3]. Australia is committed to working towards the ‘End TB Strategy’ target of a 20% reduction in TB incidence by 2020, compared with 2015 [4]. The NSW TB Program, through a network of dedicated TB services (chest clinics) across the state, continue to focus on active case finding, early diagnosis, and effective treatment of cases and contacts to minimise local transmission of TB in NSW. Surveillance of TB in NSW is conducted under the NSW Public Health Act 2010. The purpose of this report is to describe the epidemiology of TB in NSW in 2017.
Image: CDC PHIL #18139: Scanning Electron Microscopy image of Mycobacterium Tuberculosis Credit: National Institute of Allergy and Infectious Diseases (NIAID)
5
Methods
Data were extracted from the Notifiable Conditions Information Management System (NCIMS) on 15 August 2018 for all confirmed cases of TB notified from 1 January 1997 to 31 December 2017. Population data including NSW mid-year population estimates, estimated populations by country of birth and population estimates by local health district (LHD) were obtained from the Australian Bureau of Statistics (ABS) via the Secure Analytics for Population Health Research and Intelligence System.
Definitions
Laboratory confirmed TB is isolation of Mycobacterium tuberculosis complex (M. tuberculosis, M. bovis, or M. africanum, excluding M. bovis var BCG) by culture or detection of M. tuberculosis complex by nucleic acid testing except where this is likely to be due to previously treated or inactive disease.
Clinically confirmed TB is when a clinician experienced in TB makes a clinical diagnosis of TB disease [5]. Cases of latent TB infection are not included.
Pulmonary TB is disease affecting the lung, excluding the pleura.
Extrapulmonary TB is disease affecting any other region of the body, including the pleura.
High risk countries are those with an annual TB incidence of 40 cases per 100,000 population per year or more in 2017, as per estimates in WHO Global Tuberculosis Report 2017 at the time the data were collected [1].
MDR-TB are cases with isolates that demonstrate resistance to at least isoniazid and rifampicin [6]
Extensively drug-resistant TB (XDR-TB) are cases in which isolates demonstrated resistance to isoniazid and rifampicin, as well as additional resistance to any fluoroquinolone, and to at least one injectable second-line drug (capreomycin, kanamycin or amikacin) [6].
Permanent resident is a person who holds a permanent visa (or has become an Australian citizen) and is usually resident in Australia.
Overseas student is a person studying or seeking study, training, or skills development in Australia.
Visitor is a person entering Australia temporarily for tourism, to visit family and friends, to undergo pre-arranged medical treatment or for business related purposes.
Refugee / humanitarian is a person in humanitarian need overseas or a person already in Australia who arrived on a temporary visa or in an unauthorised manner, claiming Australia’s protection.
Unauthorized person is an unlawful non-citizen.

6
Statistical analyses
Notification data were analysed using descriptive and analytic methods. Overseas-born cases were categorised into regions of birth using ABS standards. Notification rates per 100,000 population per year were calculated for the whole of NSW using select fields from demographic, clinical, risk factor and contact management data categories. Notification rates for TB by LHD of residence were calculated and mapped using R (R core team, Vienna, Austria, 2018). Data were analysed using SAS® Enterprise Guide® (version 4.3, SAS Institute, Cary, NC, USA).
7
Section 1: Demographics
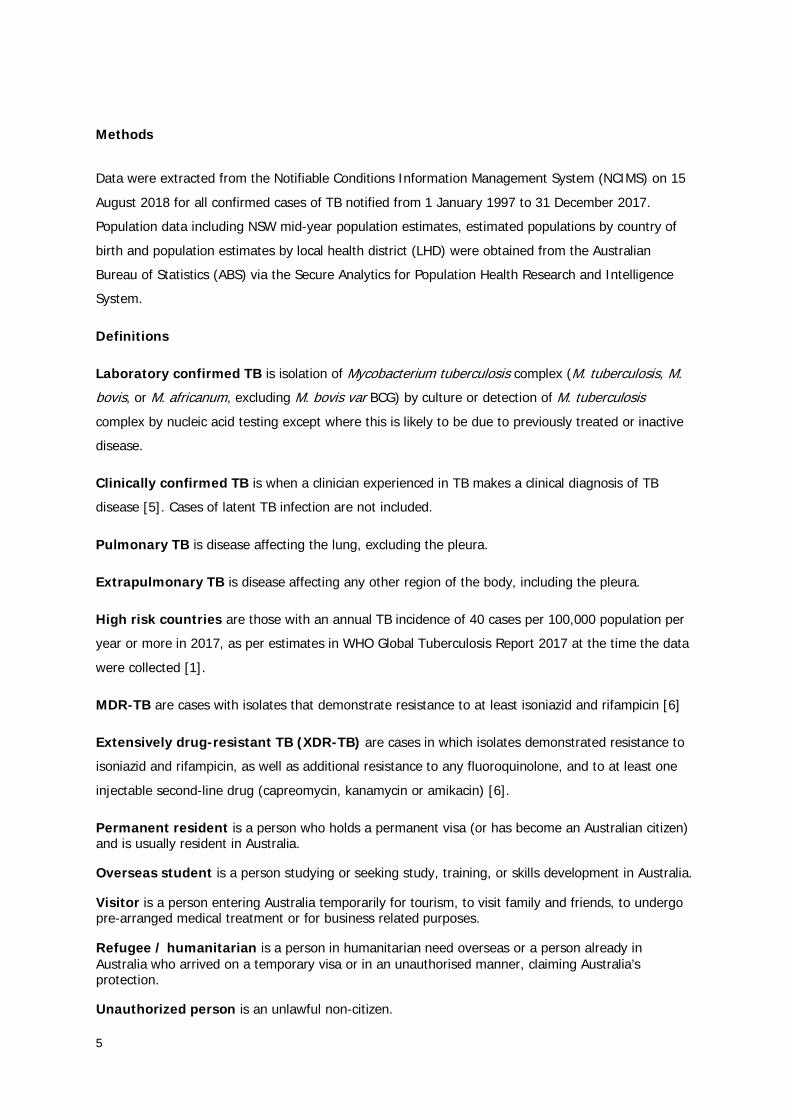
There were 540 notified cases of TB in 2017 in NSW (Figure 1). These cases comprised 37% of the total notified cases in Australia in 2017 (1,442 cases) [3]. It is unknown why case notifications fluctuate from year to year, underlying factors may include immigration and TB screening patterns.
The annual notification rate of TB in 2017 in NSW was 6.9 cases per 100,000 population per year. The 2017 rate has remained steady compared to 2016. The highest rate of the past 20 years was in 1999 (7.7 cases per 100,000) with another peak in 2011 (7.5 cases per 100,000). The number of notifications received in 2017 was equal to the number notified in 2011, but a lower rate due to population increases. (Figure 1).
Figure 1: Number and rate of TB disease notifications, NSW, 1998-2017
2017
540 6.9
Number of cases notified
Rate per 100,000 population
0123456789
0
100
200
300
400
500
600
Not
ifica
tion
rate
per
100
,000
pop
ulat
ion
Num
ber o
f cas
es
Year
Number of cases Notification rate/100,000

8
Demographics Of the 540 cases of TB notified in 2017, 57% of cases were male (n=307). The median age among males was 40 years (range 3-96 years); while the median age among females was 35 years (range 4 months-95 years). The median age overall was 38 years (range 4 months-96 years). Nearly half the cases notified were aged between 20 and 39 years (n=259) with a peak in both the number of notifications and the rate of notifications in the 25-29 year age group (n=76, rate=13 cases per 100,000). A second peak in the rate of notifications was observed in those aged 85 years and over (10 cases per 100,000). There were two cases notified in children aged less than five years (<1%) (Figures 2 and 3).
Age and Sex Sex
Figure 2: Number of TB notifications by age group and sex, NSW, 2017
Age Overall
Range: 4 months-96 years Median: 38 years
Age by Sex
Range: 3-96 years Median: 40 years
Range: 4 months-95 years Median: 35 years
Figure 3: Age specific TB notification rate (per 100,000 population per year), NSW, 2017
05
1015202530354045
Num
ber o
f not
ifica
tions
5 year age group
Male Female
02468
10121416
TB n
otifi
catio
n ra
te
5 year age group
57% Male
43% Female
Male
Female

9
Place of residence Western Sydney Local Health District (LHD) had the highest notification rate, with 14.9 cases per 100,000 population (n=144), followed by Sydney LHD with 11.5 cases per 100,000 population (n=75) (Figure 4). Nepean Blue Mountains LHD had the highest rate among LHDs in outer Sydney at 2.3 cases per 100,000 population (n=9), followed by Central Coast with 2.0 cases per 100.000 population per year (n=7). Of LHDs comprising regional NSW, Southern NSW LHD had the highest rate at 3.7 cases per 100,000 (n=8) followed by Murrumbidgee LHD at 3.4 cases per 100,000 (n=10). For data on individual LHDs see Table 1. These variations in notification rates largely reflect the immigration patterns of people born in high prevalence countries into NSW. Figure 4: Age and sex standardised rate of notified TB cases per 100,000 population per year by Local Health District of residence, NSW, 2017
10.5 2.0 1.8 Rate per 100,000,
Metropolitan Sydney (Sydney, South Western Sydney, Western
Sydney, Northern Sydney and South Eastern Sydney LHDs)
Rate per 100,000, Outer Sydney
(Illawarra Shoalhaven, Central Coast and
Nepean Blue Mountains LHDs)
Rate per 100,000, Regional NSW
(Far West, Western NSW, Northern NSW, Mid North Coast, Hunter New England, Southern
NSW and Murrumbidgee LHDs)
Far West Western NSW
Murrumbidgee
Southern NSW
Hunter New England
Northern NSW
Mid North Coast
Nepean Blue Mountains
Central Coast
Illawarra Shoalhaven
South Western Sydney
Northern Sydney
Western Sydney
Sydney
South Eastern Sydney

10
Country of Birth In 2017, 91% (n=490) of cases were born overseas. Of these, 94% (n=461) were born in a high risk country (HRC) for TB. There were 63 individual countries of birth reported among NSW TB cases (Table 2), with the most commonly reported countries of birth being India (15% of all cases, n=81), Vietnam (11%, n=60), and Philippines (11%, n=58) (Figure 6). Of cases born in a HRC, 48% (n=219) were born in a country within the WHO Western Pacific region, and a further 43% (n=196) were born in a country within the WHO South East Asian region. The Eastern Mediterranean region accounted for 4% (n=19), African region 4% (n= 19), American region 1% (n=6), and European region <1% (n=2).
9% 91% 94% 63 Proportion of cases who are Australian born
Proportion of cases born overseas
Proportion of overseas born cases born in high TB risk countries
Total countries of birth reported
Table 1: Age and sex standardised rate of notified TB cases per 100,000 population per year by Local Health District of residence, NSW, 2017
Local Health District Number Rate Western Sydney 144 14.9 Sydney 75 11.5 South Western Sydney 107 10.8 South Eastern Sydney 88 9.5 Northern Sydney 52 5.7 Southern NSW 8 3.7 Murrumbidgee 10 3.4 Nepean Blue Mountains 9 2.3 Central Coast 7 2.0 Mid North Coast 4 1.8 Illawarra Shoalhaven 7 1.7 Hunter New England 15 1.6 Western NSW 3 1.1 Northern NSW 1 0.3 Far West NSW 0 0

11
Table 2: Countries of birth of TB cases, NSW, 2017 Country of birth Number of cases Proportion of cases
India 81 15% Vietnam 60 11%
Philippines 58 11% Australia 50 9%
Nepal 49 9% China 47 9%
Indonesia 23 4% Bangladesh 16 3%
Thailand 13 2% Fiji 10 2%
Other 133 25% Total 540 100%
The median age of Australian born cases has decreased in 2017 compared to previous years while the median age of overseas born cases has remained similar to previous years. Males tended to be older at diagnosis compared to females, which is consistent with previous years. In 2017, the median age at diagnosis for Australian born cases was 34 years; 27 years for females (range 4 months-71 years) and 50 years for males (range 3-91 years). For overseas born cases, the median age at TB diagnosis was 38 years; 36 years for females (range 16-95 years) and 40 years for males (range 5-96 years). Over 50% of overseas born cases were aged between 20 and 39 years at diagnosis (Figure 5). Figure 5: Age at TB diagnosis, by place of birth and sex, NSW, 2017
of TB cases notified in NSW by country of Birth, 2015-2016

12
Figure 6. Number of TB cases by country of birth, NSW, 2017
Australia
China
India Vietnam
Fiji
Nepal Philippines
Indonesia Bangladesh
Thailand

13
Australian born cases Of the 50 Australian born cases in 2017, 10% (n=5) identified as Aboriginal (Figure 7). The number of TB cases who identify as Aboriginal fluctuates from year to year and the number notified in 2017 is about average since 2008. The average rate of TB among Indigenous Australians over the past 10 years is four times higher than that among non-Indigenous Australian born cases (relative rate = 4.1, 95% confidence interval 3.1 to 5.4); a difference found to be statistically significant (p<0.0001). Over the 10 years to 2017, the rate in Indigenous Australians remained relatively unchanged (p>0.05) and the rate in non-Indigenous Australians decreased slightly, although this decrease was not found to be statistically significant (p>0.05). Figure 7: Number and rate of notified TB in Australian born cases by Indigenous status, NSW, 2008-2017
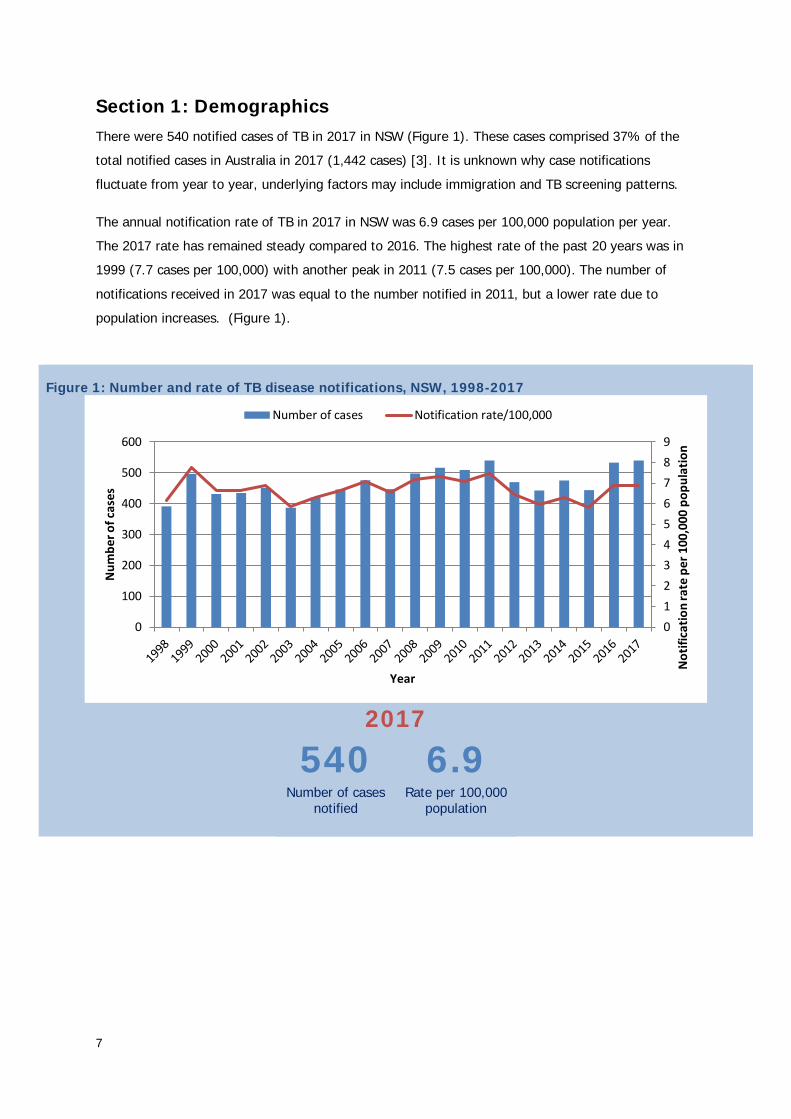
Overseas born cases Of the 490 overseas born cases in 2017, those born in a HRC for TB (n=461) had a shorter median length of stay in Australia prior to diagnosis of TB (6 years, range 0-67 years) when compared to the other overseas born cases (n=29) (18 years, range 0-67 years) (Figure 8). Two-thirds of the overseas born cases were permanent residents at the time of diagnosis (n=293, 60%), 18% (n=87) were overseas students, 10% (n=49) were visitors, 2% (n=9) were refugees, <1% (n=2) were unauthorised persons, 7% (n=32) were on other types of visas, and 4% (n=18) had an unknown or missing Australian status (Table 3). Some Australian visas require the applicant to undergo a medical examination prior to the visa being granted. These include all permanent visa applicants and some temporary visa applicants depending on how long they intend to stay in Australia, if they intend to work or study, and their country of origin. If the medical examination shows that the visa
0
1
2
3
4
5
0
10
20
30
40
50
60
70
2008 2009 2010 2011 2012 2013 2014 2015 2016 2017 Not
ifica
tion
rate
per
100
,000
pop
ulat
ion
Num
ber o
f cas
es
Year
Australian born non-Indigenous cases Indigenous Australian cases
Australian born non-Indigenous rate Indigenous Australians rate
14
applicant might be at increased risk of developing active TB, offshore applicants are placed on a TB Health Undertaking (TBU) and onshore applicants are placed on an Onshore Deferral. Both are required to be followed up by the health authorities in Australia prior to their visa being approved. Of the 461 NSW TB cases born in HRCs, 17% (n=78) were on a TBU or Onshore Deferral at the time of diagnosis, a further 10% (n=46) had previously been on a TBU, 70% (n=322) had never been on a TBU and for 3% (n=15) the TBU status was unknown.
Length of Stay in Australia
17%
Figure 8: Median years spent in Australia prior to TB diagnosis, among overseas born cases, by country of birth risk category, NSW, 2017
HRC = High risk country (TB incidence >40 cases per 100,000 population)
Proportion of NSW TB cases, born in a HRC, currently on a TB
Health Undertaking at diagnosis with TB
10%
Proportion of NSW TB cases, born in a HRC, who have previously
been on a TB Health Undertaking
70%
Proportion of NSW TB cases, born in a HRC, who have never been
on a TB Health Undertaking
Table 3: Residency status of TB cases at diagnosis, NSW, 2017 Residency status Number of cases Percentage Permanent resident 293 60% Overseas student 87 18% Visitor 49 10% Refugee / humanitarian entrant 9 2% Unauthorised person 2 <1% Other 32 7% Unknown/ missing status 18 4% Total 490 100%
0 10 20 30 40 50 60 70 80
All
Non HRC
HRC
Years (yrs) spent in Australia prior to TB diagnosis
6 yrs
6 yrs
18 yrs

15
Risk Factors The most commonly reported risk factor for all notified cases in 2017 was being born overseas in a HRC for TB (86%, n=463). Past residence for three months or more in a HRC that was not the person’s country of birth (13%, n=70) and health conditions causing immunosuppression, or being on immunosuppressive therapy were the next highest reported risk factors (13%, n=70). Being either a household member or having other close contact with another person with TB was reported by 11% (n=59) of cases. There was variation in reported risk factors between Australian and overseas born cases. In Australian born cases, the most frequently reported risk factor was having a household or close contact with TB (30%, n=15), followed by past residence in a HRC (more than 3 months) (22%, n=11). For overseas born cases, 95% (n=463) were born in a HRC. Other reported risk factors can be found in Table 4. Table 4: Reported risk factors for TB* among notified case, by place of birth, NSW, 2017 All cases Australian born Overseas born N % N % N % Total 540 100% 50 100% 490 100% Born in a HRC 463 86% n/a n/a 463^ 95% Past residence (≥3 months) in a HRC 70 13% 11 22% 59 12% Immunosuppressive health condition/therapy 70 13% 10 20% 60 12% Household member or close contact with TB 59 11% 15 30% 44 9% Previously diagnosed with TB 35 6% 3 6% 32 7% Ever employed in healthcare 30 6% 3 6% 27 6% Australian born child of parent(s) born in HRC 9 2% 9 18% n/a n/a Ever homeless/residing in a shelter 6 1% 1 2% 5 1% Ever resided in a correctional facility 5 1% 2 4% 3 1% Ever employed in an institution 2 <1% 0 0% 2 <1% Other 11 2% 2 4% 9 2% Not able to be determined 17 3% 10 20% 7 1%
*Multiple risk factors can be recorded ^Born in a HRC is recorded as well as country of birth, as some countries may have been high incidence when the person was born but are no longer considered HRC
Australian born cases
1st 2nd 3rd
Household member or close contact with TB
≥3 months spent in a high risk country
(other than country of birth)
Immunosuppressive health condition or therapy
Overseas born cases
1st 2nd 3rd
Born in a high risk country
Immunosuppressive health condition or therapy
≥3 months spent in a high risk country
(other than country of birth)

16
HIV Testing Over the 10 year period to 2017, there has been a 34% increase in the proportion of TB cases tested for HIV at the time of TB diagnosis, from 55% in 2008 to 89% in 2017 (Figure 9). Of cases tested in 2017, 2% (n=9) were co-infected with HIV and TB. Of the nine TB cases who were HIV positive in 2017, 89% (n=8) were male, 67% (n=6) were overseas born, and 67% (n=6) were diagnosed with HIV at/around the same time as their TB notification (<4 weeks prior to TB notification or up to 2 months post TB notification). At least five cases (56%) appear to have been tested due to their TB diagnosis (information not available for the remaining case). Three cases (33%) were diagnosed with TB after a previous unrelated HIV diagnosis. Figure 9: Proportion of TB cases tested for HIV at TB diagnosis, NSW, 2017
89%
9
Proportion of NSW TB cases
tested for HIV at diagnosis, 2017 Number of NSW TB cases co-
infected with HIV, 2017
100%
Target for TB cases tested for HIV
at diagnosis
0%10%20%30%40%50%60%70%80%90%
100%
2008 2009 2010 2011 2012 2013 2014 2015 2016 2017
Prop
ortio
n of
TB
case
s tes
ted
for H
IV a
t di
agno
sis
Year
17
Section 2: Clinical Presentation
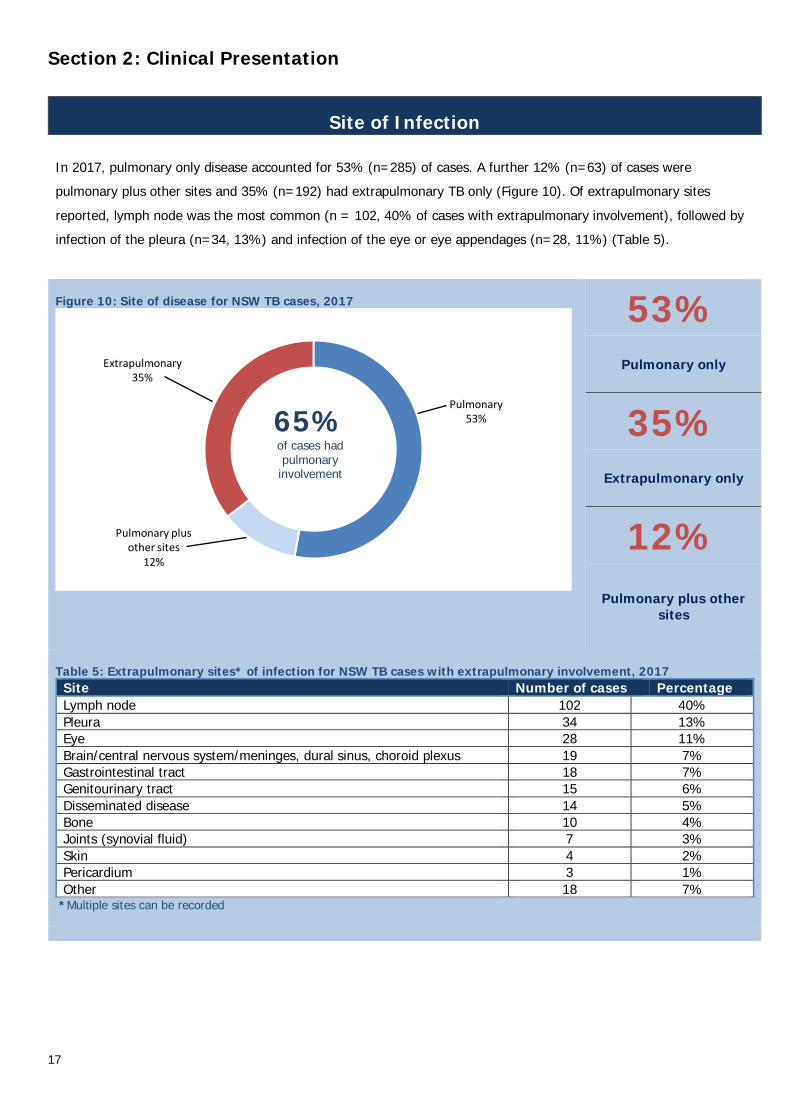
Site of Infection In 2017, pulmonary only disease accounted for 53% (n=285) of cases. A further 12% (n=63) of cases were pulmonary plus other sites and 35% (n=192) had extrapulmonary TB only (Figure 10). Of extrapulmonary sites reported, lymph node was the most common (n = 102, 40% of cases with extrapulmonary involvement), followed by infection of the pleura (n=34, 13%) and infection of the eye or eye appendages (n=28, 11%) (Table 5).
Figure 10: Site of disease for NSW TB cases, 2017
53% Pulmonary only
35% Extrapulmonary only
12%
Pulmonary plus other sites
Table 5: Extrapulmonary sites* of infection for NSW TB cases with extrapulmonary involvement, 2017 Site Number of cases Percentage Lymph node 102 40% Pleura 34 13% Eye 28 11% Brain/central nervous system/meninges, dural sinus, choroid plexus 19 7% Gastrointestinal tract 18 7% Genitourinary tract 15 6% Disseminated disease 14 5% Bone 10 4% Joints (synovial fluid) 7 3% Skin 4 2% Pericardium 3 1% Other 18 7%
*Multiple sites can be recorded
Pulmonary53%
Pulmonary plus other sites
12%
Extrapulmonary35%
65% of cases had pulmonary
involvement

18
Laboratory Testing Of the 540 TB cases in 2017, 78% (n=422) of diagnoses were laboratory confirmed; 69% (n=373) were cultured, and an additional 9% laboratory diagnosed by molecular methods (polymerase chain reaction (PCR)) only (n=49). Clinical diagnoses were made in the remaining 22% (n=118) of cases (Figure 11). Laboratory confirmation was more commonly obtained for pulmonary involvement (84%, n=291), compared to those with extrapulmonary disease only (68%, n=131). A greater proportion of laboratory confirmation by PCR only occurred in cases with pulmonary involvement (59%, n=29), compared to PCR only confirmation of extrapulmonary cases (41%, n=20). For the ten year period to 2017, there has been a significant increase (p<0.0001) in the proportion of cases confirmed using PCR only, while a significant decrease (p=0.02) in the number of cases with clinical diagnosis has been seen over the same period (Figure 12). The majority of cases notified in NSW in 2017 (74%, n=397) were tested for TB as part of an investigation of clinical symptoms.
74% Figure 11: Method of diagnosis of TB, laboratory vs. clinical, NSW, 2017
Proportion of TB cases identified via investigation of
symptomatic disease
15% Proportion of NSW TB cases identified via immigration,
occupational or other health screening
3% Proportion of NSW TB cases
identified via contact investigation
Figure 12: Method of laboratory confirmation of diagnosis of TB cases, NSW, 2008-2017
12%
Decrease in diagnoses made on clinical grounds only since 2008
350%
Increase in diagnoses confirmed by PCR only since
2008
5%
Decrease of diagnoses confirmed by culture since
2008
Culture confirmed69%
PCR only9%
Clinical diagnosis22%
0%
10%
20%
30%
40%
50%
60%
70%
80%
2008 2009 2010 2011 2012 2013 2014 2015 2016 2017
Prop
ortio
n of
TB
case
s
Year
Clinical PCR Only Culture positive
78% of cases were
laboratory confirmed
19
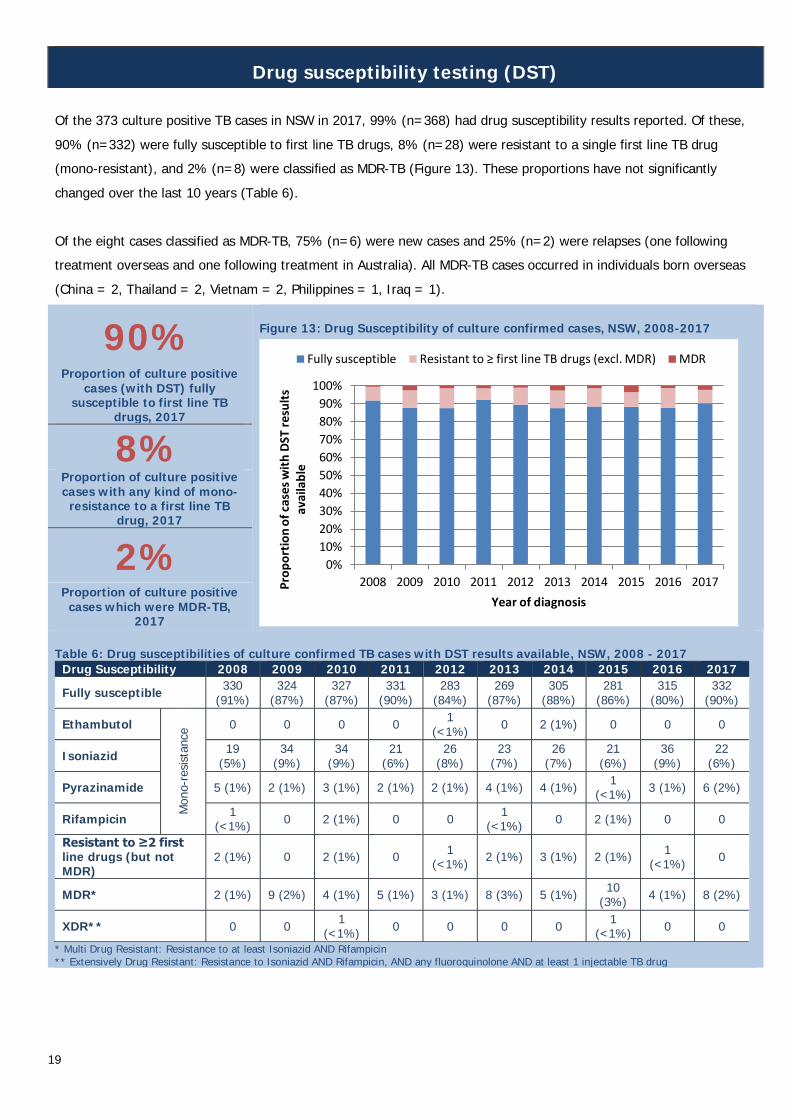
Drug susceptibility testing (DST) Of the 373 culture positive TB cases in NSW in 2017, 99% (n=368) had drug susceptibility results reported. Of these, 90% (n=332) were fully susceptible to first line TB drugs, 8% (n=28) were resistant to a single first line TB drug (mono-resistant), and 2% (n=8) were classified as MDR-TB (Figure 13). These proportions have not significantly changed over the last 10 years (Table 6). Of the eight cases classified as MDR-TB, 75% (n=6) were new cases and 25% (n=2) were relapses (one following treatment overseas and one following treatment in Australia). All MDR-TB cases occurred in individuals born overseas (China = 2, Thailand = 2, Vietnam = 2, Philippines = 1, Iraq = 1).
90% Figure 13: Drug Susceptibility of culture confirmed cases, NSW, 2008-2017
Proportion of culture positive cases (with DST) fully
susceptible to first line TB drugs, 2017
8% Proportion of culture positive cases with any kind of mono-
resistance to a first line TB drug, 2017
2% Proportion of culture positive
cases which were MDR-TB, 2017
Table 6: Drug susceptibilities of culture confirmed TB cases with DST results available, NSW, 2008 - 2017 Drug Susceptibility 2008 2009 2010 2011 2012 2013 2014 2015 2016 2017
Fully susceptible 330 (91%)
324 (87%)
327 (87%)
331 (90%)
283 (84%)
269 (87%)
305 (88%)
281 (86%)
315 (80%)
332 (90%)
Ethambutol
Mon
o-re
sista
nce 0 0 0 0 1
(<1%) 0 2 (1%) 0 0 0
Isoniazid 19 (5%)
34 (9%)
34 (9%)
21 (6%)
26 (8%)
23 (7%)
26 (7%)
21 (6%)
36 (9%)
22 (6%)
Pyrazinamide 5 (1%) 2 (1%) 3 (1%) 2 (1%) 2 (1%) 4 (1%) 4 (1%) 1 (<1%) 3 (1%) 6 (2%)
Rifampicin 1 (<1%) 0 2 (1%) 0 0 1
(<1%) 0 2 (1%) 0 0
Resistant to ≥2 first line drugs (but not MDR)
2 (1%) 0 2 (1%) 0 1 (<1%) 2 (1%) 3 (1%) 2 (1%) 1
(<1%) 0
MDR* 2 (1%) 9 (2%) 4 (1%) 5 (1%) 3 (1%) 8 (3%) 5 (1%) 10 (3%) 4 (1%) 8 (2%)
XDR** 0 0 1 (<1%) 0 0 0 0 1
(<1%) 0 0 * Multi Drug Resistant: Resistance to at least Isoniazid AND Rifampicin ** Extensively Drug Resistant: Resistance to Isoniazid AND Rifampicin, AND any fluoroquinolone AND at least 1 injectable TB drug
0%10%20%30%40%50%60%70%80%90%
100%
2008 2009 2010 2011 2012 2013 2014 2015 2016 2017Prop
ortio
n of
cas
es w
ith D
ST re
sults
av
aila
ble
Year of diagnosis
Fully susceptible Resistant to ≥ first line TB drugs (excl. MDR) MDR
20
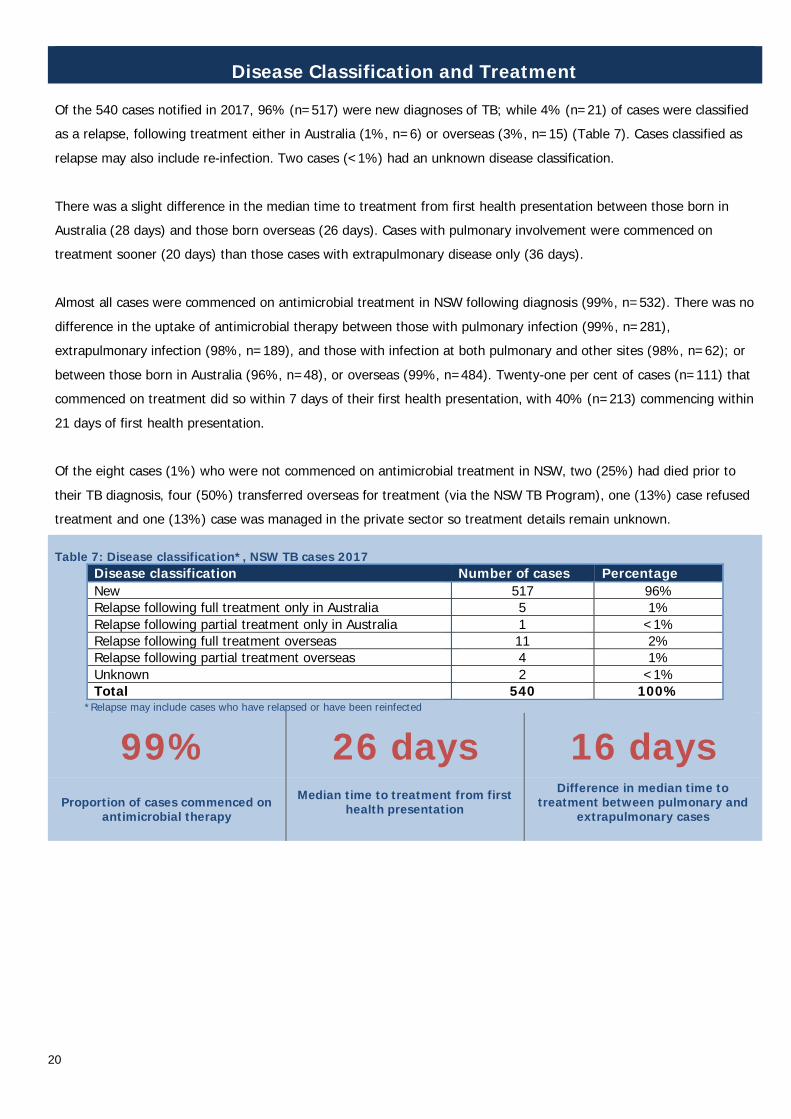
Disease Classification and Treatment Of the 540 cases notified in 2017, 96% (n=517) were new diagnoses of TB; while 4% (n=21) of cases were classified as a relapse, following treatment either in Australia (1%, n=6) or overseas (3%, n=15) (Table 7). Cases classified as relapse may also include re-infection. Two cases (<1%) had an unknown disease classification. There was a slight difference in the median time to treatment from first health presentation between those born in Australia (28 days) and those born overseas (26 days). Cases with pulmonary involvement were commenced on treatment sooner (20 days) than those cases with extrapulmonary disease only (36 days). Almost all cases were commenced on antimicrobial treatment in NSW following diagnosis (99%, n=532). There was no difference in the uptake of antimicrobial therapy between those with pulmonary infection (99%, n=281), extrapulmonary infection (98%, n=189), and those with infection at both pulmonary and other sites (98%, n=62); or between those born in Australia (96%, n=48), or overseas (99%, n=484). Twenty-one per cent of cases (n=111) that commenced on treatment did so within 7 days of their first health presentation, with 40% (n=213) commencing within 21 days of first health presentation. Of the eight cases (1%) who were not commenced on antimicrobial treatment in NSW, two (25%) had died prior to their TB diagnosis, four (50%) transferred overseas for treatment (via the NSW TB Program), one (13%) case refused treatment and one (13%) case was managed in the private sector so treatment details remain unknown. Table 7: Disease classification*, NSW TB cases 2017
Disease classification Number of cases Percentage New 517 96% Relapse following full treatment only in Australia 5 1% Relapse following partial treatment only in Australia 1 <1% Relapse following full treatment overseas 11 2% Relapse following partial treatment overseas 4 1% Unknown 2 <1% Total 540 100%
*Relapse may include cases who have relapsed or have been reinfected
99% 26 days 16 days
Proportion of cases commenced on antimicrobial therapy
Median time to treatment from first health presentation
Difference in median time to treatment between pulmonary and
extrapulmonary cases

21
Section 3: Outcomes
Clinical Outcomes Clinical outcomes are reported for cases diagnosed in the previous year (for non MDR-TB cases) or two years previously (for MDR-TB cases) to allow time for treatment completion. Clinical outcomes for non MDR-TB cases from 2016 and MDR-TB cases from 2015 are recorded in Table 8. Of the non-MDR 2016 cases 86% (n=460) completed treatment, consisting of 8% (n=37) who were considered cured (culture positive prior to treatment and culture negative after completion of treatment) and 92% (n=423) who completed treatment (without demonstration of cure). There were six TB-related deaths reported. Seven cases (1%) defaulted before completion of treatment; the remainder had either transferred overseas, died of a non-TB related cause, were continuing on treatment at the time of analysis, or outcome was unknown. Of those cases in 2016 where the outcome was known (excluding continues on treatment, transferred overseas and outcome unknown), 93% of cases successfully completed treatment. Of the 11 cases classified as MDR-TB (including 1 case who was XDR-TB) in 2015, 10 (91%) completed treatment and 1 (9%) transferred overseas.
95%
Table 8: Clinical outcomes of non MDR-TB cases diagnosed in 2016 and MDR-TB cases diagnosed in 2015*
Year of diagnosis 2016
Non MDR cases
2015 M/XDR-TB
Total cases 529 11 Alive Completed treatment 423 (79%) 10 (91%) Cured 37 (7%) - Defaulted 7 (1%) - Continues on treatment 8 (1%) - Transferred overseas 25 (5%) 1 (9%) Treatment failure 0 (0%) - Outcome unknown 4 (<1%) - Died Cause related to TB 6 (1%) - Unrelated to TB 22 (4%) - Outcome unknown
0 (0%) -
*Outcome data are reported for the year prior for non MDR cases and 2 years prior for MDR cases to allow time for treatment completion
Proportion of cases who survived in 2016
0%
Proportion of surviving cases with treatment failure
1%
Proportion of cases who died due to TB

22
Contact Investigations Of the 540 TB notifications received in 2017, 88% (n= 473) had contact information completed in NCIMS at the time of analysis. A total of 1,559 contacts had been identified and of these, 58% (n=906) were recorded to have completed screening. Of the 906 contacts screened, 1% (n=11) were found to have TB disease, 3% (n=31) had a tuberculin skin test (TST) conversion (where serial skin tests are conducted with an increase of at least 10mm induration between consecutive readings, indicating likely acquisition of tuberculosis infection from the case patient), and 27% (n=242) had a positive TST result on initial screening (indicating likely tuberculosis infection earlier in their life). Of those with a positive TST 93% (n=225) had a risk factor for TB other than recent exposure to the infectious case (such as having been born in, or spent greater than three months in a TB high risk country). There were 78 (9%) contacts commenced on preventative treatment. The median number of contacts per case was one (range 0-155), and 1% (n=7) of contact investigations involved more than 20 contacts.
88% 1,559 58%
Proportion of NSW TB cases, 2017, with contact
information recorded Total contacts identified 2017
Proportion of identified contacts completing
screening, 2017
There were 113 sputum or respiratory smear positive cases notified in 2017, these cases are generally considered to be more infectious than smear negative cases. Over 81% of smear positive cases (n=92) had contact information available identifying 849 contacts. Of these contacts, 416 (49%) were recorded as having completed screening where 4 (<1%) were found to have active TB disease, 17 (4%) had TST conversion, and 135 (32%) had a positive TST result on initial screening. There were 47 (11%) contacts commenced on preventative treatment.

23
Section 4: Discussion Following a decline in the 2012-2015 period, TB notifications in NSW increased in 2016 and remained higher in 2017; consistent with national trends [3]. The notification rate of TB in NSW remained steady compared with 2016 and was consistent with rates seen in the previous ten-year period from 2002 to 2011. The majority of TB cases in NSW continue to occur in persons born overseas, particularly among those born in countries with a high incidence of TB. The burden of TB disease in NSW is concentrated in local health districts with large populations of migrants from countries in the South-East Asian and Western Pacific regions; reflective of both the global epidemiology of TB, and current trends in migration patterns. The rate of TB in NSW remains low by global comparison [1] .
The proportion of Australian born cases of TB remained steady. The notification rate in the Australian born non-Indigenous population has remained relatively unchanged for more than a decade. The rate in Australian born Indigenous people in NSW is on average 3.5 times higher than in non-Indigenous Australian born people, however fluctuates from year to year.
Risk factors reported among NSW TB cases in 2017 were similar to those reported in previous years in NSW and nationally. Birth or previous residence longer than three months in a TB high risk country remain the most commonly reported risk factors. There was a 5% increase in the proportion of Australian born cases where household or close contact with TB was reported as a risk factor, compared with the previous report from 2015-2016 [7].
Drug resistance, including multi-drug resistance and mono-resistance to isoniazid and rifampicin, continue to pose a challenge to the control and management of TB, both globally and within NSW. There has been no statistically significant change to the proportions of drug resistant cases as a group or to individual drugs over a 10 year period in NSW. Monitoring and review of NSW TB cases identified as drug resistant continues to be a priority of the NSW TB Program.
The proportion of NSW TB cases tested for HIV at the time of diagnosis continues to increase. The prevalence of HIV among NSW TB cases remains low, with one per cent of cases tested found to have HIV.
Ninety-three per cent of non MDR-TB cases in 2016 successfully completed treatment where the outcome was known (excluding continues on treatment, transferred overseas and outcome unknown). Mortality among NSW TB cases remained stable (5%), with one per cent of cases reported to have died due to TB. NSW continued to see low rates of treatment default (1%) and treatment failure (0%), among surviving TB cases in 2016. One per cent of cases diagnosed in 2016 were reported as still being on treatment; in some cases this may because of extended treatment due to extensive disease, or cases may have finished treatment and the data was not updated prior to this report. All MDR-TB cases in 2015 successfully completed treatment (excluding the one case transferred overseas where the outcome is unknown). Despite the low incidence, TB control in Australia remains an ongoing challenge. TB control cannot be viewed in the context of one country alone, and the global epidemiology of this disease has significant impact on control measures in low incidence countries, due to increasing international travel to and migration from high incidence countries. This is particularly true for Australia as 62% of incident TB cases globally in 2017 occurred in the Western Pacific, and South East Asian regions [1].

24
Conclusion:
Whilst NSW had the equal highest number of cases of TB in NSW in the past 20 years in 2017, the number of cases and notification rate remain low compared to global incidence. Where previous reports have highlighted the success and efficacy of the NSW TB Program, this report reinforces the notion that the control and elimination of TB in an individual country must be considered in the context of the global epidemiology of TB.
While the rate of TB in NSW remains low and consistent with that observed nationally [3], the increase in the number of cases in 2016 and 2017 compared to the four previous years is a reminder that this is not the time for complacency. TB anywhere remains a challenge everywhere. Drug resistance and continuing high prevalence in neighbouring countries, particularly in the presence of high rates of travel to and migration from these countries pose an ongoing challenge to the control efforts of TB in NSW. The WHO END TB strategy calls for a 20% reduction in incident cases of TB by 2020 compared to 2015. The NSW TB Program, along with the network of Chest Clinics around the state remains dedicated to the control of TB within our borders, through timely and appropriate identification and management of cases, and their contacts.
Acknowledgements:
The NSW TB Program would like to acknowledge the staff from the network of chest clinics and associated public health units across NSW who collected the data. Thanks are also extended to the nurses and doctors of NSW TB services for their continued dedication to the control and management of TB in NSW. The NSW TB Program would also like to acknowledge the Mycobacterium Reference Laboratory at the Institute for Clinical Pathology and Medical Research, Westmead.

25
References
1. World Health Organization, Global tuberculosis report 2018. 2018, World Health Organization: Geneva, Switzerland. 2. World Health Organization, Tuberculosis and HIV. 2018: Geneva, Switzerland. 3. Commonwealth Department of Health, Notification Rate of Tuberculosis 1991 to 2017. 2018: Canberra, Australia. 4. Toms, C., Stapledon, R., Coulter, C., Douglas, P., National Tuberculois Advisory Committee, Tuberculosis notifications in
Australia, 2014. Communicable Disease Intelligence, 2017. 41(3): p. E247-263. 5. Commonwealth Department of Health. Tuberculosis case definition. 2010. Updated 22 December 2010 [cited 2018];
Available from: http://www.health.gov.au/internet/main/publishing.nsf/Content/cda-surveil-nndss-casedefs-cd_tb.htm. 6. World Health Organization, Definitions and reporting framework for tuburculosis - 2013 revision (updated December
2014). 2014: Geneva, Switzerland. 7. New South Wales Health, Tuberculosis in New South Wales 2012-2014. 2015, NSW Health: Sydney, Australia.