tube investments of india limited - bseindia.com · website: - e-mail id:...
TRANSCRIPT

INDIA
16th August, 2018
National Stock Exchange of India Ltd Exchange Plaza, 5th Floor Plot No.C/1, G Block Bandra-Kurla Complex Sandra (E) Mumbai 400 051
Dear Sirs,
Tube Investments of India Limited (Formerly known as Tl Financial Holdings Limited) Dare House, 234, N.S.C. Bose Road, Chennai 600 001, India Tel: 91.44.4217 7770-5 Fax: 91.44.4211 0404 Website: www.tiindia.com CIN: L35 1 OOTN2008PLC069496
BSE Ltd. 25th Floor Phiroze Jeejeebhoy Towers, Dalal Street Fort Mumbai 400 001
Sub: Submission of Annual Report for FY 2017-18 -ISIN INE974X01010
In continuation to our letter dated 19th July, 2018, as required under Regulation 34 of the SEBI (Listing Obligations and Disclosure Requirements) Regulations, 2015, we submit the Annual Report of the Company comprising the information as per sub-regulation (2) of the aforesaid Regulation, adopted at the 10th Annual General Meeting of the Company held on 13th August, 2018.
Kindly take the same on record.
Thanking you,
Yours faithfully, For TUBE INVESTMENTS OF INDIA LIMITED
s(}~ ~ COMPANY SECRETARY
Encl :
~ murugappa

1
TUBE INVESTMENTS OF INDIA LIMITED(formerly, TI Financial Holdings Limited)
(CIN: L35100TN2008PLC069496) Registered Office: “Dare House”, 234 N S C Bose Road, Chennai 600 001 Website: www.tiindia.com - E-mail id: [email protected]
Phone: 044-42177770-5 – Fax: 044-42110404
NOTICE OF ANNUAL GENERAL MEETINGNOTICE is hereby given that the TENTH ANNUAL GENERAL MEETING of the Members of Tube Investments of India Limited (formerly, TI Financial Holdings Limited) will be held on Monday, the 13th August, 2018 at 3.30 P.M. at T T K Auditorium, The Music Academy, 168 (Old no. 306), T T K Road, Chennai - 600 014 to transact the following business:
ORDINARY BUSINESS
1. To consider and if deemed fit, to pass, with or without modification(s), the following resolution as an ORDINARY RESOLUTION:
RESOLVED that the Audited Financial Statements of the Company for the financial year ended 31st March, 2018, the Reports of the Board of Directors and the Auditors thereon, be and are hereby received and adopted.
2. To consider and if deemed fit, to pass, with or without modification(s), the following resolution as an ORDINARY RESOLUTION:
RESOLVED that the Audited Consolidated Financial Statements of the Company for the financial year ended 31st March, 2018 and the Report of the Auditors thereon, be and are hereby received and adopted.
3. To consider and if deemed fit, to pass, with or without modification(s), the following resolution as an ORDINARY RESOLUTION:
RESOLVED that out of the profits for the financial year ended 31st March, 2018, a final dividend at the rate of ` 0.50 (fifty paise) only per share on the equity share capital of the Company, as recommended by the Board of Directors, be and the same is hereby declared for the financial year, 2017-18 and that the said dividend be paid to the Members whose names appear on the Register of Members as on 13th August, 2018 or their mandatees, in case the shares are held in physical form, thus making a total dividend of ` 1.75 per equity share of ` 1 each for the financial year, including the interim dividend of ` 1.25 per share already paid.
RESOLVED FURTHER that in respect of shares held in electronic form, the dividend be paid to the beneficial holders of the dematerialised shares as on 13th August, 2018 as per details furnished by the depositories for this purpose.
4. To consider and if deemed fit, to pass, with or without modification, the following resolution as an ORDINARY RESOLUTION:
RESOLVED that pursuant to Section 152 and other applicable provisions of the Companies Act, 2013, the Rules thereunder (including any statutory modification(s) of re-enactment thereof for the time being in force), Mr. M M Murugappan (holding DIN 00170478), Chairman, who retires by rotation, be and is hereby re-appointed as a Director of the Company, liable to retire by rotation.
5. To consider and if deemed fit, to pass, with or without modification(s), the following resolution as an ORDINARY RESOLUTION:
RESOLVED that pursuant to Section 139 and other applicable provisions, if any, of the Companies Act, 2013 and the Rules thereunder (including any statutory modification(s) or re-enactment thereof for the time being in force), the Company hereby ratifies the appointment of Messrs. S R Batliboi & Associates LLP (LLP Identity no. AAB-4295), Chartered Accountants (Firm registration no.101049W/E300004) as the Statutory Auditors of the Company to hold office from the conclusion of this (10th) Annual General Meeting until the conclusion of the next (11th) Annual General Meeting of the Company on a remuneration of `33 lakhs for the financial year, 2018-19 plus applicable taxes and reimbursement of out-of-pocket expenses incurred by them in connection with the said audit.
SPECIAL BUSINESS
6. To consider and if deemed fit, to pass, with or without modification(s), the following resolution as an ORDINARY RESOLUTION:
RESOLVED that pursuant to the provisions of Sections 152, 161 and other applicable provisions of the Companies Act, 2013, the Rules thereunder (including any statutory modification(s) or re-enactment thereof for the time being in force) and the Securities and Exchange Board of India (Listing Obligations and Disclosure Requirements)

2
Regulations, 2015, as amended from time to time, Mr. Ramesh K B Menon (holding DIN 05275821), Additional Director, who holds office up to the date of this Annual General Meeting, be and is hereby appointed as a non-executive Director of the Company, liable to retire by rotation.
7. To consider and if deemed fit, to pass, with or without modification(s), the following resolution as a SPECIAL RESOLUTION:
RESOLVED that pursuant to the provisions of Section 13 and other applicable provisions, if any, of the Companies Act, 2013, including any statutory modifications or re-enactment thereof, for the time being in force, and the Rules framed thereunder, consent of the Members of the Company be and is hereby accorded for the alteration of existing sub-clause 10 under III(B) of the Memorandum of Association of the Company by inclusion of the words “or for political purposes” immediately after the word “institutions” occurring in the said sub-clause 10 and also for deletion of the existing words “but not to any political purposes” occurring at the end of the said sub-clause 10, such that after the aforesaid alterations, the amended sub-clause 10 to read as under:
10. To give donations or subscriptions to any religious, charitable or social institutions or for political purposes or to give any charity incidental or conducive to any business that may be carried on by the Company.
RESOLVED FURTHER that for the purpose of giving effect to this resolution, the Board (including Committee(s) thereof and/or any Director or any individual delegated with powers necessary for the purpose) be and is hereby authorised to do all such acts, deeds, matters and things, as may be necessary, proper or expedient without being required to seek any further consent or approval of the Company or otherwise to the end and intent that they shall be deemed to have been given all necessary approval thereto expressly by the authority of this resolution.
8. To consider and if deemed fit, to pass, with or without modification(s), the following resolution as a SPECIAL RESOLUTION:
RESOLVED that pursuant to Section 42 and other applicable provisions, if any, of the Companies Act, 2013 (“the Act”) read with the Companies (Prospectus and Allotment of Securities) Rules, 2014 and/or other applicable Rules [including any statutory modification(s) or re-enactment thereof for the time being in force] and further subject to such approvals, as may be required, consent of the Company be and is hereby accorded to the Board of Directors of the Company (“the Board”) to offer, issue and allot Secured Redeemable Non-convertible Debentures (“NCDs”), in one or more series or tranches, on private placement basis, to eligible investors under the applicable laws, regulations, guidelines etc., in such manner, and wherever necessary or required, in consultation with merchant bankers/and or advisors or others, on such terms and conditions (including such coupon rates as may be negotiated) and for such purposes/objectives of the Company as the Board may, in its absolute discretion, decide at the time of issue of the NCDs, provided that the total amount so raised by the Company, through issuance of such NCDs (including the premium thereon, if any, as may be decided by the Board), shall not exceed, during the period commencing from the date of conclusion of the 10th Annual General Meeting till the date of conclusion of the next/immediately succeeding 11th Annual General Meeting, an aggregate sum of `500 crores.
RESOLVED FURTHER that the Board be and is hereby authorised to do all such acts, deeds, matters and things and execute all documents or writings, as may be necessary or proper or expedient for the purpose of giving effect to this resolution including creation of security in favour of the lenders as may become necessary, intimating the concerned authorities or such other regulatory body/ies and for matters connected therewith or incidental thereto including delegating all or any of the powers conferred herein to any Committee of the Directors or any Director(s) or Officer(s) of the Company to the extent permitted under the Act and the Rules thereunder.
9. To consider and if deemed fit, to pass, with or without modification(s), the following resolution as an ORDINARY RESOLUTION:
RESOLVED that pursuant to the provisions of Section 148(3) and other applicable provisions, if any, of the Companies Act, 2013 and the Rules thereunder [including any statutory modification(s) or re-enactment thereof, for the time being in force], the remuneration payable during the financial year 2019-20 to M/s. S Mahadevan & Co., Cost Accountants (holding Registration No.000007) appointed by the Board of Directors of the Company to conduct the audit of the cost records of the Company for the financial year 2018-19, amounting to `3,00,000/- (Rupees three lakhs) in addition to reimbursement of out-of-pocket expenses incurred in connection with the said audit but excluding taxes, as may be applicable, be and is hereby ratified and confirmed.
RESOLVED FURTHER that the Board of Directors of the Company be and is hereby authorised to do all acts and take all such steps as may be necessary, proper or expedient to give effect to this resolution.
By Order of the BoardPlace : Chennai S SureshDate : 7th May, 2018 Company Secretary

3
NOTES:
1. A Member entitled to attend and vote is entitled to appoint a proxy to attend and vote instead of himself and the proxy need not be a Member. The proxy form is annexed herewith. The duly completed proxy form must be sent so as to reach the Company not less than 48 hours before the commencement of the meeting.
2. A person shall not act as proxy on behalf of Members exceeding fifty in number and holding in the aggregate more than 10% of the total share capital of the Company carrying voting rights. A Member holding more than 10% of the total share capital of the Company carrying voting rights may appoint a single person as proxy and such person shall not act as a proxy for any other person or shareholder.
3. Statement of material facts in respect of the Special Business under Item nos.6 to 9 (pursuant to Section 102 of the Companies Act, 2013) is annexed hereto.
4. The Register of Members and the Share Transfer Books of the Company will remain closed from Wednesday, 1st August, 2018, to Monday, 13th August, 2018 (both days inclusive).
5. Members are requested to intimate the Registrar and Transfer Agent viz., Karvy Computershare Private Ltd, Karvy Selenium Tower B, Plot 31-32 Gachibowli, Financial District, Nanakramguda, Hyderabad - 500 032 (RTA), not later than 1st August, 2018, of any change in their address/details about their Bank Account number, Name of the Bank, Bank’s Branch name and address to enable the Company to remit the dividend electronically or alternatively, for incorporating in the dividend warrants. For shares held in dematerialised form, change in address/Bank account particulars may be intimated directly to the Member’s Depository Participant(s).
6. Members holding shares in physical form are encouraged to nominate a person to whom their shareholding in the Company shall vest in the event of their demise. Nomination forms will be sent to the Members on request, by the RTA.
7. SEBI has recently directed all companies and their RTAs to immediately seek from shareholders, who hold shares in physical mode and have not furnished their PAN and Bank account details, details of the same. Hence, such Members are advised to furnish a self-attested copy of their PAN card and cancelled cheque leaf relating to their Bank account to the Company/RTA at the earliest.
8. All Members who hold their shares in physical mode are further advised to dematerialise their shares at the earliest as SEBI has decided that securities of listed companies can be transferred only in the dematerialised form from 4th December, 2018.
9. Electronic (soft) copy of the Notice of the 10th Annual General Meeting of the Company inter alia indicating the process and manner of e-voting along with the Attendance Slip & Proxy Form and the Annual Report for 2017-18 is being sent to all the Members whose e-mail IDs are registered with the Company/Depository Participant(s) for communication purposes unless any Member has requested for a hard copy of the same. For Members who have not registered their e-mail address, physical copies of the Notice of the 10th Annual General Meeting of the Company inter alia including the process and manner of e-voting along with the Attendance Slip & Proxy Form and the Annual Report for 2017-18 are being sent in the permitted mode.
10. All documents referred in the accompanying Notice and the Statement shall be open for inspection in physical or in electronic form at the Registered Office of the Company during normal business hours (9.30 a.m. to 5.30 p.m.) on all working days except Saturdays and Sundays, up to and including the date of the Annual General Meeting and also at the meeting.

4
ANNEXURE TO THE NOTICE
Details of the Director seeking re-appointment at the 10th Annual General Meeting vide Item no.4 of the Notice dated 7th May, 2018
[Pursuant to Regulation 36 of the Securities and Exchange Board of India (Listing Obligations and Disclosure Requirements) Regulations, 2015]
The resume of Mr. M M Murugappan, in brief and other details required to be provided pursuant to Regulation 36 of the Securities and Exchange Board of India (Listing Obligations and Disclosure Requirements) Regulations, 2015 is provided below for the consideration of the Members:
Mr. M M Murugappan
Mr. M M Murugappan holds a Masters degree in Chemical Engineering from the University of Michigan. He was appointed as a Director of the Company with effect from 1st August, 2017 and he is the Chairman of the Company.
Details of other Directorships and memberships in Committees held by him are as follows:
ChairmanCarborundum Universal Ltd (listed company)Coromandel International Ltd (listed company) TI Financial Holdings Ltd (listed company)Cholamandalam MS General Insurance Co. LtdWendt India Ltd (listed company)Cholamandalam Health Insurance LtdVolzhsky Abrasive Works, Russia
DirectorMahindra and Mahindra Ltd (listed company)Cyient Ltd (listed company)Ambadi Investments LtdMurugappa Organo Water Solutions Private LtdM M Muthiah Research FoundationIdea Lab (India) Private LtdI I T Madras Research Park
Committee Memberships / Chairmanships
Audit CommitteeChairmanCyient LtdMemberMahindra & Mahindra LtdAmbadi Investments LtdStakeholders Relationship CommitteeChairmanTube Investments of India LtdTI Financial Holdings LtdWendt India LtdCarborundum Universal LtdMemberAmbadi Investments LtdNomination and Remuneration CommitteeChairman (Governance)Mahindra and Mahindra LtdMemberTube Investments of India LtdCyient LtdTI Financial Holdings LtdRisk Management CommitteeChairmanCyient LtdMemberMahindra & Mahindra LtdCholamandalam MS General Insurance Co. LtdLoans CommitteeChairmanTube Investments of India Ltd
Investment CommitteeMemberCarborundum Universal LtdCholamandalam MS General Insurance Co. LtdShares & Debentures CommitteeChairmanTube Investments of India Ltd.Corporate Social Responsibility CommitteeChairmanTI Financial Holdings LtdCholamandalam MS General Insurance Co. LtdMemberAmbadi Investments LtdR & D CommitteeChairmanMahindra & Mahindra LtdBorrowing CommitteeMemberAmbadi Investments LtdManagement CommitteeChairmanCholamandalam MS General Insurance Co. LtdBusiness CommitteeMemberCholamandalam MS General Insurance Co. Ltd
Mr. M M Murugappan holds 18,90,385 equity shares of the Company.
The other details relating to Mr. M M Murugappan pursuant to the Secretarial Standard on General Meetings appear in the Annual Report under Directors’ Profile, Corporate Governance Report and annexure thereto.

5
The Board recommends his appointment as a Director liable to retire by rotation for approval by the Members of the Company.
Mr. M M Murugappan is not related to the other Directors and Key Managerial Personnel of the Company, and their relatives.
Except Mr. M M Murugappan, being the appointee, none of the Directors and Key Managerial Personnel of the Company and their relatives, is concerned or interested, financially or otherwise, in the resolution relating to his re-appointment as Director of the Company.
Statement in respect of the Special Business under Item nos. 6 to 9 (pursuant to Section 102 of the Companies Act, 2013) of the Notice dated 7th May, 2018
Item no.6
Mr. Ramesh K B Menon, holding DIN 05275821 was appointed as an Additional Director of the Company with effect from 16th November, 2017 pursuant to Section 161(1) of the Companies Act, 2013 (“the Act”) and holds office up to the date of the ensuing Annual General Meeting. The Company has received the requisite consent and disclosure forms from him. The Company has also received a notice in writing from a Member under Section 160 of the Act in respect of Mr. Ramesh K B Menon’s appointment.
Mr. Ramesh K B Menon is a graduate in Science from Jai Hind College, Mumbai and an alumnus of XLRI, Jamshedpur. Mr. Menon had earlier worked with Madura Coats as its Director - HR, South Asia and his experience with Madura Coats spanned twenty-seven years where he had handled several HR leadership assignments including as the HR Head for South Asia & Africa Regions, consisting of thirteen countries.
Details of other Directorships and memberships in Committees held by him are as follows:
DirectorE.I.D. Parry (India) Ltd (listed company)Ambadi Enterprises LtdParry Enterprises India LtdParry Murray and Company LtdParry Agro Industries LtdTriumph Electoral Trust
Committee MembershipsAudit CommitteeMemberAmbadi Enterprises LtdParry Enterprises India LtdParry Agro Industries LtdStakeholders Relationship CommitteeMemberE.I.D Parry India LtdNomination and Remuneration CommitteeMemberE.I.D Parry India Ltd
Mr. Ramesh K B Menon does not hold any shares of the Company.
The other details relating to Mr. Ramesh K B Menon pursuant to the Secretarial Standard on General Meetings appear in the Annual Report under Directors’ Profile, Corporate Governance Report and annexure thereto.
The Board recommends his appointment as a Director liable to retire by rotation for approval by the Members of the Company.
Mr. Ramesh K B Menon is not related to the other directors and Key Managerial Personnel of the Company and their relatives.
Except Mr. Ramesh K B Menon, being the appointee, none of the Directors and Key Managerial Personnel of the Company and their relatives, is concerned or interested, financially or otherwise, in the resolution relating to his appointment as Director of the Company.
Item no.7
Section 182 of the Companies Act, 2013 provides that a company other than a government company and a company which has been in existence for less than three financial years may contribute any amount directly or indirectly to any political party.
sub-clause 10 under III(B) viz, Objects Incidental or Auxiliary to the Attainment of Main Objects in the Memorandum of Association (MoA) of the Company expressly stipulates that the Company cannot contribute to any political purposes.
To remove the impediment in contributing for political purposes, as and when proposed, it is proposed that the aforesaid Sub-clause 10 under III(B) of the MoA be altered by insertion of words to provide for making of political contributions. Such alteration to the MoA would require the approval of the Members in general meeting.
Accordingly, approval of the Members is sought by way of a Special Resolution under the applicable provisions of the Act and the Rules thereunder for alteration of the existing sub-clause 10 under III(B) viz, Objects Incidental or Auxiliary to the Attainment of Main Objects in the MoA as per details provided in the resolution under the Notice. The Board recommends the resolution for approval by the shareholders of the Company.
None of the Directors of the Company and Key Managerial Personnel of the Company and their relatives is concerned or interested in the aforesaid Special Resolution.

6
Item no.8
The Companies Act, 2013 (‘the Act”) stipulates that private placement offer/invitation of securities, not made in compliance with the provisions of the said Act and Rules framed thereunder shall be treated as a public offer requiring compliance with the Securities Contracts (Regulation) Act, 1956 and the Securities and Exchange Board of India Act, 1992.
The Company in the ordinary course of business raises long-term borrowings, either by way of term loans, inter-corporate deposits, external commercial borrowing(s) or debentures. It is estimated that the Company will be resorting to an aggregate long-term borrowing of `500 Cr. in the coming months, which may be in any one mode (or) in a combination of modes, including through issue of secured redeemable non-convertible debentures (NCDs) on private placement basis. If the Company proposes to raise long-term borrowing by such issue of NCDs on private placement basis, the Act mandates that the Company shall obtain prior approval of its shareholders by means of a Special Resolution in respect of such borrowing through NCDs during the year.
Accordingly, approval of the Members is sought by way of a Special Resolution under the applicable provisions of the Act and the Rules thereunder for issue of NCDs on private placement basis for a maximum sum of `500 Cr, including such premium thereon, if any, as may be decided by the Board and at such coupon rates as may be negotiated and also creation of necessary security therefore, as part of the long-term borrowing programme of the Company, during the period commencing from the date of conclusion of the 10th Annual General Meeting till the date of conclusion of the next/immediately succeeding 11th Annual General Meeting. The Board recommends the resolution for approval by the shareholders of the Company.
None of the Directors of the Company and Key Managerial Personnel of the Company and their relatives is concerned or interested in the aforesaid Special Resolution.
Item no.9
In terms of the Companies (Cost Records and Audit) Rules, 2014, as amended, some of the products of the Company are covered under the requirement of conduct of audit of the cost records.
M/s. S Mahadevan & Associates were appointed by the Board of Directors, on the recommendation of the Audit Committee, as the Cost Auditors to conduct an audit of the cost records in respect of the aforementioned products of the Company for the financial year, 2018-19 on the remuneration payable to them as per details furnished under Item no.9 of the Notice of the Annual General Meeting.
In terms of Section 148 of the Companies Act, 2013, read with the Companies (Audit and Auditors) Rules, 2014, as amended, the remuneration payable to the Cost Auditor is required to be ratified by the shareholders of the Company. The Board recommends the resolution for approval by the shareholders of the Company.
None of the Directors of the Company and Key Managerial Personnel of the Company and their relatives is concerned or interested in the aforesaid Ordinary Resolution.
By Order of the BoardPlace : Chennai S SureshDate : 7th May, 2018 Company Secretary

7
INSTRUCTIONS FOR ELECTRONIC VOTING [e-voting]I. In compliance with the provisions of Section 108 of the Companies Act, 2013, Rule 20 of The Companies (Management and Administration)
Rules, 2014 as substituted by the Companies (Management and Administration) Amendment Rules, 2015 (“Amended Rules 2015”) and Regulation 44 of the Securities and Exchange Board of India (Listing Obligations and Disclosure Requirements) Regulations, 2015 (“Regulations”), the Company is pleased to provide the Members the facility to exercise their right to vote on the resolutions proposed for consideration at the 10th Annual General Meeting (AGM) by electronic means and the business may be transacted through e-voting services. The facility of casting the votes by the Members using an e-voting system from a place other than the venue of the AGM (“remote e-voting”) is being provided by M/s. Karvy Computershare Private Limited (“Karvy”).
II. Mr. R Sridharan of M/s. R Sridharan & Associates, Company Secretaries will act as the Scrutiniser to scrutinise the e-voting process in a fair and transparent manner.
III. The remote e-voting period commences on Wednesday, 8th August 2018 (9.00 a.m. Indian Standard Time) and ends on Sunday, 12th August 2018 (5.00 p.m. Indian Standard Time). During this period, Members of the Company, holding shares either in physical form or in dematerialised form, as on the Cut-off Date of 6th August 2018, may cast their vote electronically. The remote e-voting module shall be disabled by Karvy for voting thereafter. Once the vote on a resolution is cast by the Member, the Member shall not be allowed to change it subsequently.
IV. The process and manner for remote e-voting are as under:
A. In case of Members receiving e-mail from Karvy (for Members whose e-mail IDs are registered with the Company/Depository Participant(s):
i) Open your web browser during the voting period and navigate to https://evoting.karvy.com
ii) Enter the login credentials (i.e. User ID and password). In case of physical folio, User ID will be the EVEN number followed by folio number. In case of Demat account, User ID will be your DP ID and Client ID. However, if you are already registered with Karvy for e-voting, you can use your existing User ID and password for casting your vote.
iii) After entering these details appropriately, click on “LOGIN”.
iv) You will now reach password change menu wherein you are required to mandatorily change your password. The new password shall comprise of minimum 8 characters with at least one upper case (A-Z), one lower case (a-z), one numeric value (0-9) and a special character (@,#,$, etc.). The system will prompt you to change your password and update your contact details like mobile number, e-mail ID etc., on first login. You may also enter a secret question and answer of your choice to retrieve your password in case you forget it. It is strongly recommended that you do not share your password with any other person and that you take utmost care to keep your password confidential.
v) You need to login again with the new credentials.
vi) On successful login, the system will prompt you to select the e-voting event.
vii) Select the EVENT of Tube Investments of India Limited and click on “SUBMIT”.
viii) Now you are ready for e-voting as “Cast Vote” page opens.
ix) On the voting page, enter the number of shares (which represents the number of votes) as on the Cut-off Date under “FOR/AGAINST” or alternatively, you may partially enter any number in “FOR” and partially “AGAINST” but the total number in “FOR/AGAINST” taken together not exceeding your total shareholding as mentioned herein above. You may also choose the option “ABSTAIN”. If the shareholder does not indicate either “FOR” or “AGAINST” it will be treated as “ABSTAIN” and the shares held will not be counted under either head.
x) Shareholders holding multiple folios/demat accounts shall choose the voting process separately for each folio/demat accounts.
xi) Voting has to be done for each item of the Notice separately. In case you do not desire to cast your vote on any specific item, it will be treated as abstained.
xii) You may then cast your vote by selecting an appropriate option and click on “Submit”.
xiii) A confirmation box will be displayed. Click “OK” to confirm, else “CANCEL” to modify. Once you have voted on the resolution, you will not be allowed to modify your vote. During the voting period, Members can login any number of times till they have voted on the resolution(s).
xiv) Corporate/institutional Members (i.e. other than Individuals, HUF, NRI etc.) are also required to send scanned certified true copy (PDF format) of the board resolution/authority letter etc., together with attested specimen signature(s) of the duly authorised representative(s), to the Scrutiniser at e-mail [email protected] with a copy marked to [email protected]. The scanned image of the above mentioned documents should be in the naming format “TII - 10th AGM”.
B. In case of Members receiving physical copies of the Notice of AGM (for Members whose email IDs are not registered with the Company/Depository Participant(s) or requesting physical copy):
i) E-Voting Event Number (EVEN), User ID and Password is provided in the Attendance Slip.
ii) Please follow all steps from sl. no. (i) to sl. no. (xiv) above to cast vote.
C. Voting at AGM:
The Members who have not cast their vote electronically can exercise their voting rights at the AGM. The Company will make necessary arrangements in this regard at the AGM venue.

8
Other instructions:
i) In case of any queries, you may refer Help & FAQ section of https://evoting.karvy.com (Karvy website) or call Karvy on 040-67162222 & Toll-free No.1-800-3454-001.
ii) You can also update your mobile number and e-mail id in the user profile details of the folio which may be used for sending future communication(s).
iii) The voting rights of Members shall be in proportion to their shares of the paid-up equity share capital of the Company as on the Cut-off Date viz., 6th August, 2018. However, a person who is not a Member as on the Cut-off Date should treat this Notice for information purpose only. The remote e-voting will not be allowed beyond the aforesaid date and time and the e-voting module shall be disabled by Karvy upon expiry of the aforesaid period. Once the vote on a resolution is cast by the Member, he will not be allowed to change it subsequently or cast the vote again.
iv) Any person who acquires shares of the Company and becomes a Member of the Company after dispatch of the Notice to the shareholders and holding shares as on the Cut-off Date of 6th August, 2018, may obtain the login ID and password by sending a request at [email protected]. However, if you are already registered with Karvy for remote e-voting then you can use your existing user ID and password for casting your vote. If you forget your password, you can reset your password by using “Forgot user details/Password” option available on https://evoting.karvy.com
v) Since the Company is required to provide the Members the facility to cast their vote by electronic means, shareholders of the Company, holding shares either in physical form or in dematerialised form, as on the Cut-off Date and not casting their vote electronically, may cast their vote at the AGM venue. Facility will be available at the venue.
vi) Members who have cast their votes through remote e-voting may also attend the AGM. However, those Members are not entitled to cast their vote again in the AGM.
vii) Voting facility will be provided to the Members through electronic voting system or through ballot/polling paper at the AGM venue. A Member can opt for only one mode of voting i.e. either through remote e-voting or voting at the AGM. Thus, voting facility at the AGM shall be used only by those who have not exercised their right to vote through remote e-voting.
viii) The Chairman shall, at the AGM, at the end of discussion on the resolutions on which voting is to be held, allow voting with the assistance of the Scrutiniser, by use of e-voting for all those Members who are present at the AGM who have not cast their votes by availing the remote e-voting facility.
ix) The Scrutiniser shall after the conclusion of voting at the AGM will first count the votes cast at the meeting and thereafter unblock the votes cast through remote e-voting in the presence of at least two witnesses not in the employment of the Company who shall make, within forty-eight hours of the conclusion of the AGM, a consolidated Scrutiniser’s Report of the total votes cast in favour or against, if any, to the Chairman or a person authorised by him in writing, who shall countersign the same and declare the result of the voting forthwith.
x) The results declared along with the Scrutiniser’s Report shall be placed on the Company’s website www.tiindia.com and on the website of Karvy immediately after the declaration of result by the Chairman or a person authorised by him in writing. The results shall also be immediately forwarded to the Stock Exchange(s).
V. All documents referred in the accompanying Notice and the Statement shall be open for inspection at the Registered Office of the Company during normal business hours (9.30 a.m. to 5.30 p.m.) on all working days except Saturdays and Sundays, up to and including the date of the AGM.
Route Map to AGM Venue

TUBE INVESTMENTS OF INDIA LIMITEDAnnual Report 2017-18
REPOSITIONINGFOR GROWTHTube Investments of India Limited
CIN: L35100TN2008PLC069496‘Dare House’, No. 234 N.S.C Bose Road, Chennai - 600001.
Tel: 044-42177770-5 Fax: 044-42110404Email: [email protected]
Website: www.tiindia.com

Cautionary Statement Certain expectations and projections regarding the future performance of the Company referenced in the Annual Report constitute forward-looking statements. These expectations and projections are based on currently available competitive, financial and economic data, along with the Company’s operating plans and are subject to certain future events and uncertainties, which could cause actual results to differ materially from those indicated by such statements.
Corporate Overview 01 Repositioning for growth
02 Business Segments
03 Financial Highlights
04 Engineering Business
06 Metal Formed Products Business
08 Bicycles Business
10 From the Desk of the Chairman
12 From the Desk of the Managing Director
14 Our Parentage
15 Corporate Information
16 Board of Directors
Management Reports 17 Board’s Report & Management Discussion and Analysis
35 Report on Corporate Governance
46 General Shareholder Information
Financial Statements 75 Standalone Financial Statements
142 Consolidated Financial Statements
Contents

Corporate Overview Management Reports Financial Statements
Annual Report 2017-18 1
Repositioning for growthAligning to these evolving dynamics of our diverse business segments, we are repositioning ourselves for growth through moves that are timely and strategic. As auto industry is expected to continue its growth momentum, we are increasing capacities in engineering and metal formed products business, by removing the bottlenecks and expanding capacities across various manufacturing locations. Customer-centric new product development will continue to remain the focus area in our engineering and metal formed products businesses. We are also building significant operational and competitive advantage for our business segments by leveraging on our in-house Technology Centre. We will continue to explore further opportunities in exports, by focusing on new customers and geographies.
Realising that the bicycle industry is undergoing volume contraction and shifting towards the value segment, we rationalised manufacturing footprint, besides making a tactical investment to strengthen the supply chain.
People development and Operational Excellence will continue to be the focus areas for us, to keep pace with the growth.
The dynamics of our business continue to evolve. The auto component industry is expected to grow at a CAGR of 10% - 12% in the next two years. With a major portion of our revenues coming from the auto industry, our business growth will continue to be driven by the growth momentum in the auto industry. The bicycle opportunity is shifting towards premium bikes. The expected GDP growth of 7% - 8% in the coming years and high levels of Government spending on infrastructure like railways are expected to provide further fillip to our businesses.

Tube Investments of India Limited(Formerly known as TI Financial Holdings Limited)
2 Annual Report 2017-18
Business Segments
Manufacture and supply of high quality safety critical CDW tubes, ERW and tubular components for automobile application, large-diameter tubes for hydraulic cylinders and off-road application and special grade Cold Rolled Steel Strips (CRSS)
Engineering
Manufacture and supply of sheet metal formed products, industrial chains, motor casings, agri blades and fine blanked components for automotive, industrial and railway
segments
Metal Formed Products
Manufacture and marketing of wide range of bicycles and accessories from standard bicycles to premium bicycles for kids, health and performance segments. Our brands command
a leadership position in India.
Bicycles

Corporate Overview Management Reports Financial Statements
Annual Report 2017-18 3
Financial Highlights
4,598
4,109
FY17 FY18
Net Revenue (` in Cr.)
403395
PBITDA before exceptional items (` in Cr.)
FY17 FY18
218202
PBT before exceptional items (` in Cr.)
FY17 FY18

Tube Investments of India Limited(Formerly known as TI Financial Holdings Limited)
4 Annual Report 2017-18
Engineering Business Repositioning for growth
Tube Investments of India Limited(Formerly known as TI Financial Holdings Limited)
ROCE
23%
2016-17
26%
2017-18
Net Revenue (` in Cr.)
2,317
1,866
2016-17 2017-18
PBIT (` in Cr.)
175
146
2016-17 2017-18
4 Annual Report 2017-18

Corporate Overview Management Reports Financial Statements
Annual Report 2017-18 5
Our increased focus on ‘specials’ segment of cold-rolled-strips business, requires handling of higher levels of strength and thickness in material. We continue to be a preferred source for our customers for their critical applications. Additional demand from our fine blanking business and import substitution opportunities, provide further growth opportunities to this product segment. We are making necessary investments to upgrade our facilities to meet these requirements.
During the year, our large diameter tubes plant achieved stabilisation in terms of quality and delivery levels and registered 63% growth in volumes with improved profitability. In order to improve the profitability further, we are making investments to remove the bottlenecks and also to widen the product portfolio.
Despite the current de-globalisation scenario, our Engineering Business is constantly on the lookout for new export opportunities in European and Asian markets. Dedicated business development teams have been put in place and product-specific business development is in progress to make inroads into new export markets and customer segments. Additional investments have been planned to build, capability and also to improve testing facilities, across all the manufacturing locations.
This Business is also taking various initiatives like customer-centric product development, Customer Relationship Management initiatives, dedicated technical support etc. which can improve customer satisfaction levels further. The national and international quality awards won by our teams are a testimony to our consistently high quality levels, environmental and safety standards and customer satisfaction.
The Indian auto industry reached a new milestone in FY 2017-18, with the two-wheeler industry crossing the 20-million mark for the first time and the passenger vehicle industry also growing at a healthy pace of 6%. Our Engineering Business also registered a revenue growth of 24%. We expect the growth momentum in auto industry to continue in FY 2018-19 also. The Engineering Business of our Company, being a key supplier to the automotive industry, is well positioned to reap benefits of this growth.
The first phase of our new Greenfield manufacturing facility at Rajpura, Punjab is going to boost the production capacity in FY 2018-19, besides providing us the advantage of operating closer to the automotive customer cluster in North.
Corporate Overview Management Reports Financial Statements
Annual Report 2017-18 5

Tube Investments of India Limited(Formerly known as TI Financial Holdings Limited)
6 Annual Report 2017-18
Metal Formed Products Business Repositioning for growth
1,156
1,038
2016-17 2017-18
Net Revenue (` in Cr.) PBIT (` in Cr.)
102
88
2016-17 2017-18
26%24%
2016-17 2017-18
ROCE
Tube Investments of India Limited(Formerly known as TI Financial Holdings Limited)
6 Annual Report 2017-18

Tube Investments of India Limited(Formerly known as TI Financial Holdings Limited)
6 Annual Report 2017-18
Metal Formed Products Business Repositioning for growth
1,156
1,038
2016-17 2017-18
Net Revenue (` in Cr.) PBIT (` in Cr.)
102
88
2016-17 2017-18
26%24%
2016-17 2017-18
ROCE
Tube Investments of India Limited(Formerly known as TI Financial Holdings Limited)
6 Annual Report 2017-18
Corporate Overview Management Reports Financial Statements
Annual Report 2017-18 7
Robust growth in automotive industry, improving industrial activity across multiple sectors and increasing focus on customer safety in railways, enabled a 11% growth in our Metal Formed Products Business segment in FY 2017-18.
The strong growth witnessed in two-wheeler industry in FY 2017-18 is expected to continue in the near future also. Further expansion in capacities is planned across manufacturing and assembly plants to meet this expected growth in demand from OEMs and replacement market. Our flagship brands namely Diamond, Diamond Razer, Diamond Racing Special, Diamond Razer Magic, Diamond Duro and Rombo are positioned for various segments delivering high value in performance and reliability.
In the industrial chains segment, we will continue to grow exports business by developing new global OE business in material handling and agricultural segments through new product development.
The fine blanking business will continue to be our focus area. The growth in domestic passenger vehicle industry, exports and import-substitution opportunities are encouraging us to go for creation of additional capacities in this area, with an investment of about `80 Cr. We are also aiming to become the preferred supplier to global tier 1 vendors, for their global requirements.
With already established market leadership in car doorframes business, we are also gearing up with additional investment to meet the demand from customers for their new product launches in FY 2018-19.
With safety becoming a priority, Indian railways is completely moving towards stainless steel LHB coaches from mild steel coaches. Our division achieved a growth of 41% during the year, with strong demand from ICF and MCF facilities of railways. In addition to expansion in capacity at its current Chennai location, our division is also making necessary investment to convert the erstwhile wagon facility at Uttarakhand into a coach facility. With expected demand of 50,000 coaches from railways in the near future, this division is aiming for significant growth in the coming years.
Our Metal Formed Products Business, recently, launched a new product category in rotavator blades and is currently testing the market in Southern states of India, leveraging on the marketing channels of the group’s agri-business.
Corporate Overview Management Reports Financial Statements
Annual Report 2017-18 7

Tube Investments of India Limited(Formerly known as TI Financial Holdings Limited)
8 Annual Report 2017-18
Bicycles Business Repositioning for growth
Tube Investments of India Limited(Formerly known as TI Financial Holdings Limited)
1,3031,343
2016-17 2017-18
Net Revenue (` in Cr.)
0.33
36
2016-17 2017-18
PBIT (` in Cr.)
0.1%
12%
2016-17 2017-18
ROCE
8 Annual Report 2017-18

Corporate Overview Management Reports Financial Statements
Annual Report 2017-18 9
For our Bicycles Business, FY 2017-18 was a year of strategic repositioning. With a clear understanding that the Indian bicycles industry is headed for steady decline in overall volumes, we undertook prudent steps to rationalise our manufacturing infrastructure and overheads.
New product development, which is one of our key strengths, delivered 66 new models and 81 refreshes during the year, which contributed 27% of our overall sales in trade. This will continue to be our focus area in the coming years. During the year, one of our special models “Brut+” won the CII Design Excellence Award, competing against all the major automotive brands.
We expect that consumer aspirations would steadily grow – individual retail buyers would upgrade from standard variant to specials, whereas the performance cycling segment would score robust growth over a sustainable period. On the distribution front, two extremely different formats of e-commerce as well as experiential retail, would redefine the way bicycles are bought.
In the premium segment, we achieved volume growth of 29%, ably supported by good growth in Montra and Roadeo brands and addition of 48 new stores of our flagship ‘Track & Trail’. With a view to strengthen sourcing and manufacturing for premium segment, we made two strategic controlling investments in Creative Cycles and Great Cycles in Sri Lanka.
Considering the revised dynamics of the industry, we are exploring new avenues for growth, like Public Bike Sharing (PBS), strategic partnerships with the major e-commerce players; digitisation initiatives such as analytics, omni-channel portal; and accelerated expansion of distribution.
In pursuit of sustainable cost efficiency, we are also focusing on various initiatives to reduce fixed cost and material cost.
Corporate Overview Management Reports Financial Statements
Annual Report 2017-18 9

Tube Investments of India Limited(Formerly known as TI Financial Holdings Limited)
10 Annual Report 2017-18
From The Desk of The Chairman
“With the tally of growth enabling positive factors and an enhanced commitment to Operational Excellence, we are confident that the Company will be on a sustainable growth path.”
Dear Shareholders,
In 2017, the global economy rebounded with 3.7% growth. This momentum is expected to continue with favourable market sentiment and accommodative financial conditions. The International Monetary Fund (IMF), in its World Economic Outlook, April 2018 report predicts the World GDP growth rate to strengthen further by 10 basis points in 2018 and 2019.
The Indian economy grew at 6.7% in 2017-18 and is forecasted to grow to 7.4% and 7.8% in 2018 and 2019 respectively. With Indian government’s focus on ‘Make in India’, investments in infrastructure, combined with rising disposable incomes will lead to expanding business opportunities. Favourable agro-climatic conditions accompanied by a good harvest will further enhance rural demand and boost growth in the country. India is the world’s biggest market for two-wheelers, with a large customer base residing in rural India. We expect that the two-wheeler segment will continue to show higher growth, owing to a predicted normal monsoon leading to better growth in the rural economy. The implementation of the Goods and Services Tax (GST) should support accelerated manufacturing activity.
During the year, the Indian automobile sector registered a growth of 14%, with overall two-wheeler segment growing by 15%. In four wheelers, domestic sales of passenger vehicles
10 Annual Report 2017-18

Corporate Overview Management Reports Financial Statements
Annual Report 2017-18 11
Customer Relationship Management, Production, Business Continuity, IT Security and Human Resource Management.
With the tally of growth-enabling positive factors and an enhanced commitment to Operational Excellence, we are confident that the Company will be on a sustainable growth path.
My most grateful thanks to our Board for their continued support and counsel as also to our Managing Director Mr. L Ramkumar, the senior leadership and the entire TI team for the dedicated contribution. Mr. S Sandilya and Mr. Hemant M Nerurkar, Independent Directors on our Board retire in August 2018. I thank them for their great contribution and insight and for being available to my colleagues and me at all times. Mr. L Ramkumar, our Managing Director also retires from the Company in August 2018 after a career spanning over three decades. I wish him well in his retirement.
As shareholders you have been a great support to the Company. May it continue always. We are indeed grateful for your enduring trust in us.
Yours sincerely,
M M Murugappan
and commercial vehicles segments grew by 8% and 20% respectively. This helped the growth of Engineering and Metal Formed Products businesses to a great extent. India plans to shift to BS VI emission norms by 2020. The growth in commercial automotive market continues to be strong due to sustained nationwide focus on standards of emissions and fuel-efficient technologies. The government is in the finalisation stages for framing policies for phasing out vehicles older than 15 years. This move will accelerate the demand for automobiles, especially in the commercial market space. Indian railways and industrial sectors are also expected to witness increasing demand in the coming years on the back of various government initiatives.
This year, the Company had taken few strategic decisions towards greater manufacturing efficiencies, higher cost savings and future growth. Restructuring the manufacturing footprint in the Bicycles business and new manufacturing plant at Rajpura for our Engineering business were the major initiatives. These moves, combined with the sharp focus on R&D will help optimise our potential in the manufacturing business and grow value for our stakeholders.
We also implemented a centralised price control system for indirect materials, as a part of our control process enhancement. The Company also invested strategically to implement the latest technologies in all the processes – ranging from

Tube Investments of India Limited(Formerly known as TI Financial Holdings Limited)
12 Annual Report 2017-18
From The Desk of Managing Director
Dear Shareholders,
The GDP growth of 6.7% and robust growth in auto industry made 2017-18 a good year for the Company. Your Company recorded a growth of 12% in overall revenues and 8% growth in Profits before Tax and exceptional items. All the businesses have delivered good performance, except the Bicycles Business, wherein the overall industry is in a downward trend. Strong growth in auto industry, emphasis on infrastructure development and improving industry sentiment – all acted as propellants for our growth during the year.
ENGINEERINGThe Engineering Business registered a growth of 24% in revenue and 20% in Profit before Interest and Tax (PBIT). Our focus on increasing domestic volumes, expansion of facilities and cost-efficiencies enabled growth for the segment. Our new facility at Rajpura is all set to commence production. Our Company is the only domestic player to have multiple plants at 4 different locations - closer to customer clusters. The Large Diameter Tubes Plant registered a good volume growth of 63% and also moved towards posting positive PBIT in Q4. Our focus on quality enhancement for the customers paid good dividends. This could be achieved by active employee involvement in the improvement and break-through projects. Receipt of awards by our teams in regional, national and international forums is a testimony to this achievement.
BICYCLESThe overall bicycles market is undergoing a significant transformation with decrease in commuting segment. The bicycles industry volumes in the trade segment went down by 10%. Our volumes witnessed a decline of 27% and specials by 7%. We closed down our facility at Nashik and rationalised our manufacturing capacities.
The government orders for standard cycles continued to flow in, with more welfare schemes being announced. The volumes supplied on government orders grew by 31% in FY 2017-18.
There was continued growth in the performance cycles segment where we grew by 29%. During the year, we
“The Company is well positioned to meet the emerging challenges and to encash the opportunities for accelerated growth in future.”
12 Annual Report 2017-18

Corporate Overview Management Reports Financial Statements
Annual Report 2017-18 13
High strength hydro-formable tubes for twist beams of cars through induction heating technology have been commercialised, and are being regularly supplied to auto OEMs.
The Technology Centre has been upgraded with state-of-the-art testing machines to complement materials testing and analysis capabilities. This will help partnering with automotive customers in new product development with new age steels.
The Technology Centre is developing tests for dynamic performance of motorcycle chains for process and product improvement to insure proper product selection and specification for discerning customers, using specially built test equipment.
Interactions with knowledge bodies of global repute in the steel domain and with premier academic institutes to stay benchmarked with the latest developments on the engineering front in materials development, processing and computational methods will be continued. The Company is benchmarking with the product quality levels of high end hydraulic tubing to be able to reach export and domestic markets.
The Information Technology function is working on exclusive use of Customer Relationship Management, Business Intelligence and Analytics as well as mobile apps to enhance productivity of field sales force.
PEOPLEPeople capability enhancement through Operational Excellence was the area of focus. The Operational Excellence initiative has taken deep roots in the organisation. As part of this movement, 12,986 improvement projects were implemented (2% more than the previous year). These projects substantially improved customer service, cost and quality. We are glad to mention that 90 teams from the Company won awards and recognition at state, national and international level competitions conducted by various agencies like ABK-AOTS, QCFI etc. We wish to acknowledge the efforts and thank all employees for their continuous dedication and unstinted support to the journey of excellence. The Company continues to focus on developing a leadership pipeline to meet the various challenges.
The Company is well positioned to meet the emerging challenges and to encash the opportunities for accelerated growth in future. I thank all our shareholders, employees, customers and supply chain partners for their continued support to the Company in all its endeavors.
Yours sincerely,
L Ramkumar
strengthened the supply chain for premium cycles by acquiring 80% holding in two companies in Sri Lanka – M/s Great Cycles (Private) Limited and M/s Creative Cycles (Private) Limited.
We added 48 more Track and Trail stores during the year, bringing our total count to 227 outlets. The Division is also actively tapping potential in emerging opportunities like public bike sharing and sales through online sales platforms.
METAL FORMED PRODUCTSMetal Formed Products had a revenue growth of 11%, supported by growth in two wheeler and passenger vehicles of 16% and 5% respectively.
The Fine Blanking business grew by 29%. We are expanding our capacity further in this focus area. Industrial Chains saw a growth of 8% supported by revival in industrial activity. Auto Chains grew by 17% driven by growth in two wheelers. We continued to get major orders for new door frame projects. Further investment is planned in this area to meet the requirements of the new models being launched by our key customers.
The Railway Coaches segment registered a robust growth of 41% supported by strong demand from the Railways. We are planning for further capacity enhancement in this area, expecting this growth trend to continue in the near future. Our continuing focus on quality enabled us to win several quality awards from customers.
SUBSIDIARIESShanthi Gears performed well during the year with a 16% growth in revenue, supported by growth across several segments including distributors and OEMs and also in strategic areas like railways and off-highway segments. Order booking registered a strong growth of 11%.
Our subsidiary in France ‘Sedis’ performed well during the year. There was a 9% growth in sales with good improvement in bottom line. In the year 2017-18, TI Tsubamex Private Limited registered a revenue of `25 Cr.
TECHNOLOGY The Technology Centre has indigenously built a Tube Mill capable of making thick walled tubes which is expected to provide significant operational and competitive advantage for the tubing business. The tube straightening process has been upgraded by commissioning of a series of machines built through in-house design and development. Precision Tube Process capabilities have since been improving across locations in our business units.
Several machine vision systems have been deployed for inspection of automotive components to ensure high reliability in performance in the Metal Formed Products Business. Data from these systems are used for ongoing process quality improvement.

Tube Investments of India Limited(Formerly known as TI Financial Holdings Limited)
14 Annual Report 2017-18
The fundamental principle of economic activity is that no man you transact with will lose, then you shall not.
Murugappa Group is one of India’s leading business conglomerates. The Group was established in 1900 and is presently `329 Billion. It has 28 businesses, including nine listed Companies traded in NSE & BSE.
The Group is headquartered in Chennai. Major companies of the Group include Carborundum Universal Ltd., Cholamandalam Investment and Finance Company Ltd., Cholamandalam MS General Insurance Company Ltd., Coromandel International Ltd., Coromandel Engineering Company Ltd., E.I.D. Parry (India) Ltd., Parry Agro Industries Ltd., Shanthi Gears Ltd., Tube Investments of India Ltd., and Wendt (India) Ltd.
The Group has wide geographical presence all over India and its span across 6 continents. The Group has renowned brands like BSA, Hercules, Ballmaster, Ajax, Parry’s, Chola, Gromor, Shanthi Gears and Paramfos. The Group has professionalism and a workforce of over 35,000 employees.
Our Parentage
Corporate Overview Management Reports Financial Statements
Annual Report 2017-18 15
Corporate InformationBOARD OF DIRECTORS
M M Murugappan, Chairman
L Ramkumar, Managing Director
Vellayan Subbiah, Managing Director (Designate)
Hemant M Nerurkar
Madhu Dubhashi
Pradeep V Bhide
Ramesh K B Menon
S Sandilya
COMPANY SECRETARY
S Suresh
REGISTERED OFFICE
‘Dare House’, 234 N.S.C. Bose Road, Chennai 600 001.
PLANTS
Engineering
Tube Products of India, Avadi, Chennai
Tube Products of India, Tiruttani
Tube Products of India, Shirwal, Satara
Tube Products of India, Mohali
Bicycles
TI Cycles of India, Ambattur, Chennai
TI Cycles of India, Rajpura
Metal Formed Products
TIDC India, Ambattur, Chennai
TIDC India, Kazipally, Medak
TIDC India, Uttarakhand
TI Metal Forming, Nemilicherry, Chennai
TI Metal Forming, Kakkalur, Chennai
TI Metal Forming, Bawal
TI Metal Forming, Pune
TI Metal Forming, Uttarakhand
TI Metal Forming, Sanand
Company Identification Number L35100TN2008PLC069496
Auditors
S R Batliboi & Associates LLP
Chartered Accountants
BankersBank of America
HDFC Bank Limited
Standard Chartered Bank
State Bank of India
The Hongkong & Shanghai Banking Corporation Limited

Tube Investments of India Limited(Formerly known as TI Financial Holdings Limited)
16 Annual Report 2017-18
Our Board of Directors
Mr. M M Murugappan, Chairman
Mr. M M Murugappan (62 years; DIN-00170478) holds a Masters degree in Chemical Engineering from the University of Michigan, USA. He joined the Board in August, 2017. He is currently the Chairman of Carborundum Universal Ltd., TI Financial Holdings Ltd., Cholamandalam MS General Insurance Co. Ltd. and Wendt (India) Ltd. He is also on the Board of various companies including Mahindra & Mahindra Ltd. and Cyient Ltd.
Mrs. Madhu Dubhashi, Non-Executive Director
Ms. Madhu Dubhashi (67 years; DIN-00036846) is an Economics (Hon.) Graduate and has a Post Graduate Diploma in Management from Indian Institute of Management, Ahmedabad. She has an experience of about four decades in the financial/financial services sector, having worked for various institutions like ICICI Ltd., Standard Chartered Bank etc. She joined the Board in August, 2017. She is on the Board of various companies including Axis Finance Ltd. and Majesco Ltd.
Mr. L Ramkumar, Managing Director
Mr. L Ramkumar (62 years; DIN-00090089) is a Cost Accountant and has a Post Graduate Diploma in Management from Indian Institute of Management, Ahmedabad. He joined the Board in October, 2008. He has over 37 years of rich and varied experience in management.
Mr. Vellayan Subbiah, Managing Director (Designate)
Mr. Vellayan Subbiah (48 years; DIN-01138759) is a Bachelor of Technology in Civil Engineering from IIT Madras and holds a Masters in Business Administration from the University of Michigan. He has over 23 years of work experience in consulting, technology and financial services. He was appointed as Managing Director (Designate) of the Company, with effect from 19th August, 2017. He was earlier the Managing Director of Cholamandalam Investment and Finance Company Ltd. He is on the Board of various companies including SRF Ltd. and Havells India Ltd.
Mr. Hemant M Nerurkar, Non-Executive Director
Mr. Hemant M Nerurkar (69 years; DIN-00265887) is a Graduate in Metallurgical Engineering and has over three and a half decades of rich experience in the steel industry. He joined the Board in August, 2017. He has served as Managing Director (India and South-East Asia) of Tata Steel Limited between 2009 and 2013. He is currently the Chairman of TRL Krosaki Refractories Ltd. He is also on the Board of various companies including NCC Ltd., and Igarashi Motors India Ltd.
Mr. Pradeep V Bhide, Non-Executive Director
Mr. Pradeep V Bhide, I.A.S. (Retd.) (68 years; DIN-03304262) is a Graduate in Science and Law. He also holds a Masters degree in Business Administration with specialisation in Financial Management. He joined the Board in August, 2017. In a career spanning 37 years in the Indian Administrative Service, Mr. Bhide has held senior positions at the State and Central levels. He is on the Board of various companies including Glaxo SmithKline Pharmaceuticals Ltd., Heidelberg Cement India Ltd., NOCIL Ltd. and L&T Finance Ltd.
Mr. S. Sandilya, Non-Executive Director
Mr. S Sandilya (70 years; DIN-00037542) is a Commerce Graduate and has a Post Graduate Diploma in Management from Indian Institute of Management, Ahmedabad. He joined the Board in August, 2017. He is the Group Chairman, Eicher Group. He is on the Board of various companies including Rane Brake Lining Ltd. and Mastek Ltd.
Mr. Ramesh K B Menon, Non-Executive Director
Mr. Ramesh K B Menon (58 years; DIN-05275821 is a graduate in Science from Jai Hind College, Mumbai and an alumnus of XLRI, Jamshedpur. Mr. Menon heads the Human Resources function of the companies in the Group. He had earlier worked with Madura Coats Ltd, as its Director - HR, South Asia for twenty-seven years. He joined the Board in November, 2017.

Annual Report 2017-18 17
Corporate Overview Management Reports Financial Statements
Board’s Report & Management Discussion and AnalysisDear Shareholders,
The Directors take pleasure in presenting the 10th Annual Report together with the audited financial statements of the Company for the year ended 31st March 2018.
1. Business Environment
With growth in the Gross Domestic Product (GDP) averaging 7.5% between 2014-15 and 2016-17, India can be rated as among the best performing economies in the world. Although growth is expected to decline to 6.7% in 2017-18, bringing the four year average to 7.3%, the broad story of India’s GDP growth to be significantly higher than most economies of the world remains intact. It is all the more creditable that this growth has been achieved in a milieu of lower inflation, improved current account balance and notable reduction in the fiscal deficit to GDP ratio.
In addition to the introduction of Goods & Services Tax (GST), the year also witnessed noteworthy steps being taken towards resolving the problems associated with Non-Performing Assets (NPAs) of banks, further liberalization of Foreign Direct Investment (FDI) etc., thereby strengthening the reform momentum. After remaining in the negative territory for a couple of years, growth of exports rebounded into the positive zone during 2016-17 and further strengthened in 2017-18. There was an augmentation in the foreign exchange reserves of the country, which closed at an all-time high of US$414 billion. As with any major reform, implementation of the GST is fraught with issues that businesses are still grappling with so as to familiarize themselves with the nuances of the new legislation. The months just before and after GST implementation saw a slowdown in business activity which had a dampening impact on the economy as businesses were assessing the impact of the legislation before taking major business decisions. Government played a very active role in clarifying many vexed and contentious issues, simplifying and relaxing many of the compliance processes due to which business activity has steadily picked up now.
Globally, economic activity continued to firm up during the year. The global output is estimated to have grown by 3.7% in 2017, 0.5% higher than in 2016. Global growth forecasts for 2018 and 2019 have been projected at 3.9%, reflective of the increased growth momentum
and the expected impact of the recently approved U.S. tax policy changes to cut corporate income-tax rates.
However, the system of rules and regulations that governed world trade for the last several decades is under serious threat. Perhaps the clearest threat to world trade comes from the US Administration which decided to impose tariffs of 25% on steel articles and 10% on aluminium products imported from all countries except Canada and Mexico ostensibly to protect the local industry. At the very least, this shift is likely to mean a substantial change in the way international trade is organised.
The recent developments suggest the danger of an all-out trade war between countries.
In an eventful year that followed the demonetisation and ban on sale and registration of BS (Bharat Stage)-III vehicles in the previous year, the Indian automobile sector managed to grow 14% during 2017-18. In the four wheeler segment, passenger vehicle and commercial vehicle sale volumes were up by 8% and 20%. In the two wheeler segment, scooters grew by 20% and motor cycles grew by 14%.
2. Standalone Financial Highlights ` in Cr.
Particulars 2017-18 2016-17
Sale of Products - Gross 4409.98 4207.77
Excise Duty on Sales (74.57) (282.63)
Sale of Products - Net 4335.41 3925.14
Profit Before Exceptional Items and Tax
217.94 201.50
Provision for Impairment on Investments
(25.25) -
Profit Before Tax 192.69 201.50
Tax Expense (56.23) (42.55)
Profit After Tax 136.46 158.95
3. Performance Overview
During 2017-18, the Company achieved a net turnover of 4̀,335 Cr., growing 10% over the previous year’s `3,925 Cr. The Profit before Depreciation, Interest, Exceptional Items and Tax was at 4̀03 Cr. as against `395 Cr. in the previous year. The Profit before Tax and Exceptional Items was at `218 Cr. as against `202 Cr. in the previous year, a growth of 8%.
On account of various market factors, changes in future project potential and accumulated losses, the Company

18 Annual Report 2017-18
Tube Investments of India Limited(Formerly known as TI Financial Holdings Limited)
has recognised during the year an impairment loss of `25.25 Cr. in the Statement of Profit and Loss in respect of investment made in joint ventures.
The Cycles and Accessories segment recorded revenue, net of excise duty of `1,303 Cr as compared to `1,343 Cr. during 2016-17, a de-growth of 3%, since the Cycles market was sluggish. The operating profit before interest and tax stood at `0.33 Cr. as compared to `36 Cr. during the previous year. The lower profit was mainly due to the mix between Institutional and Trade sales and costs incurred towards closure of the Nashik Plant with the objective of achieving cost efficiency and consolidation of overall capacity at two locations viz., Ambattur (Chennai) and Rajpura (Punjab).
The Engineering segment registered revenue, net of excise duty of ̀ 2,317 Cr. as compared to ̀ 1,866 Cr. during the previous year, a growth of 24%. The operating profit before interest and tax stood at `175 Cr. as compared to `146 Cr. during 2016-17, registering a growth of 20%. The increase in exports and stabilisation of the Large Diameter Tube manufacturing facility contributed to the increase in profits of the segment.
The Metal Formed Products segment recorded revenues, net of excise duty of `1,157 Cr. as compared to `1,038 Cr. during the previous year, a growth of 11%. The operating profit before interest and tax stood at `102 Cr. as compared to `88 Cr. during the previous year, a growth of 16%.
4. Business Review – Standalone
4.1. Cycles and Components
TI’s Presence
The Cycles and Components segment of the Company comprises bicycles of the Standard and Special variety including alloy bikes & specialty performance bikes, cycling accessories, bicycle components sold as spares and home fitness equipment.
Industry Scenario
Bicycles fall under two distinct categories - Standards and Specials. While Standard cycles are largely used for commuting, especially in small towns & rural areas, Specials cycles cater to recreational usage, where the product is used for fun, fitness and leisure activities. As per the industry estimates, bicycle industry volumes grew by 5% during 2017-18. While orders from the Government Schemes witnessed a growth of 30% over previous year, trade volumes witnessed a decline of around 10% during the year. The year 2017-18 was a very challenging one for the bicycle industry with
the Standards segment registering a drop of 21% over previous year in trade. On the other hand, due to increasing aspirations, higher purchasing power, international exposure to usage patterns and growing fitness consciousness, the use of high-end special bicycles continued to receive impetus, contributing to the continued steady growth of sale volumes year-on-year.
Nearly 80% of the country’s requirements are met by four major players. The smaller regional players and imports constitute the balance. The Company enjoys a share of over one-fourth of the total organised market with a much higher share in the premium segment.
Review of Performance
The segment sold over 37.6 lakh bicycles during the year, which was however lower by 4.9% when compared with 2016-17. The thrust on Specials segment was driven by a concerted effort to enhance consumer experience through exclusive retail outlets under the brand “Track & Trail”. 48 new Track & Trail outlets were opened in 2017-18 and many more migrated from the older format, taking the total of exclusive “Track & Trail” outlets to 227. The segment also made a strong entry into e-commerce with a presence in well-known e-commerce portals like Flipkart and Amazon apart from its own e-commerce portal, www.trackandtrail.in.
In 2017-18, 67 new model bicycles were launched and 60 old models were refreshed, contributing to 41% of the turnover from such new products and refreshes. Multiple innovations were introduced for the first time in the industry, notable among them being the Anti-Slip Chain and a range of ergonomic handlebars. One of the marquee models Brut+ received the best design award in the Automotive category for 2017-18 from the Confederation of Indian Industry (CII).
On the consumer outreach front, a large scale school contact programme was conducted across the States of Maharashtra, Uttar Pradesh and Karnataka, reaching about 2.7 lac children. The objective of the programme was to get children (in the age group of 8-14 years) excited about cycling, while teaching them road safety, basics of cycling and self-defence for girls. Through the year, the bicycle brands of the segment were consistently active on the digital medium. Mach City, a brand which helps urban adults rediscover cycling, was awarded the Best Social Media brand by Social Samosa, a leading online platform for analysis and research relating to social media.

Annual Report 2017-18 19
Corporate Overview Management Reports Financial Statements
As the Company has started ramping up its production in 2017-18 in the newly commissioned state-of-the-art bicycle manufacturing plant at Rajpura (Punjab), which has an installed capacity of 2,50,000 bicycles per month, the segment has closed down the Nashik facility to derive cost efficiencies through consolidation of overall capacities.
4.2. Engineering
TI’s Presence
The Engineering Segment of the Company consists of cold rolled steel strips and precision steel tubes viz., Cold Drawn Welded tubes (CDW) and Electric Resistance Welded tubes (ERW). These products primarily cater to the needs of the automotive, boiler, bicycle, general engineering and process industries. The Company is further engaged in the manufacture of large diameter welded tubes mainly for non-auto application. In the past, such products were largely imported.
Industry Scenario
During 2017-18, the overall automotive industry growth was at 15%. The passenger vehicle, commercial vehicle and two-wheeler segments registered growth of 5%, 10% and 16% respectively over the last fiscal. In the two wheeler segment, the sale volumes in scooters grew by 20%, while motorcycles grew by 16%.
In Cold Rolled Steel Strips, in a market which is dominated by integrated steel manufacturers, the Company continued to be a ‘niche player’ by focussing on special grades catering to varied applications in different sizes and grades.
Review of Performance
The Engineering segment continued on the growth path on the back of growth in the domestic auto industry and in exports by taking good advantage of the capabilities, regional plants and distribution network of the segment.
During the year, volumes of the tubes business grew 18%, while the cold rolled steel strips business grew 11%. The Large Diameter Tube manufacturing plant, which caters to the requirements of the power, infrastructure, off-highway and general engineering segments further stabilized during the year. Plans have been drawn up for optimum utilisation of this facility and improvement in the market share.
During the year under review, the segment registered revenue net of excise duty of `2,317 Cr. as compared to `1,866 Cr. during the previous year. The operating profit before interest and tax stood at `175 Cr. as
compared to `146 Cr. during 2016-17, registering a strong growth of 20%.
Increase in volumes in the domestic market, modernisation of facility and further enhancement in efficiencies were the key business emphasis areas aiding improved profitability during 2017-18.
The US Department of Commerce had initiated an investigation on the imports of cold-drawn steel mechanical tubes from India and some other countries in response to a complaint of dumping from the local manufacturers. Based on frivolous grounds, the US Department of Commerce has determined a Countervailing Duty (CVD) of 42.60% and an Anti-dumping Duty (AD) of 5.87% on the Company’s export of cold-drawn tubes to the US market. Taking into account the 25% tariff imposed under Section 232 of the US Trade Expansion Act, 1962, the total tariff works out to 73.5%, making the export of cold-drawn tubes to the US unviable. The CVD and AD will be revised based on the first review by the US Department of Commerce scheduled some time in May 2019.
4.3. Metal Formed Products
TI’s presence
Automotive & industrial chains, fine blanked products, stamped products, roll-formed car doorframes and cold rolled formed sections for railway wagons and passenger coaches constitute the Metal Formed Products segment.
Industry scenario
During 2017-18, the two wheeler segment grew 16% driven by scooter growth of 20% and the passenger vehicles segment by 5%. The segment is one of the major players manufacturing roller chains and fine blanked parts for the automotive industry in India. The replacement market for chains and sprockets continued to register a good growth due to the increasing two wheeler population. The domestic demand for industrial chains has grown moderately.
With international car majors continuing to invest in the country and increasingly using India as an export base, many component manufacturers have the opportunity to cater to the global needs of automobile manufacturers and their Tier 1 suppliers. Within the railway segment, the freight sub-segment is yet to show any sign of a major revival. The passenger coach segment witnessed huge growth as the Ministry of Railways is focussing on passenger safety by initiating conversion of all old type coaches into stainless steel. This segment has achieved

20 Annual Report 2017-18
Tube Investments of India Limited(Formerly known as TI Financial Holdings Limited)
41% growth over previous year, supplying to various customers.
Review of Performance
Sale of automotive chains and industrial chains grew by 18% and 8% respectively when compared to 2016-17 in volume terms. The Company continued to expand its presence in the aftermarket segment benefiting from the two-wheeler population growth. Fine blanked components volumes grew by 29% primarily through new parts developed for the four wheeler segment. Though exports volume registered a growth of 5% over 2016-17, the challenges faced continued due to the difficult demand conditions in Europe.
Doorframe sale volumes were higher at 6% during 2017-18 due to higher sales on select models with two of the renowned auto majors. The focus is on generating more business from the auto OEMs, leveraging the Tier-1 position with specific emphasis on roll form products and other tubular parts used in passenger cars. In addition, growing the casings vertical with efforts spread across sectors catering to new customers for both four wheeler and two wheeler auto electrical manufacturers, strengthening the current position in respect of coach parts, expanding the customer base and foraying into agri-rotovators blades and other farm implements are some of the opportunities that will be looked into closely to sustain the drive towards growth.
During the year, the doorframe operations at Halol which catered exclusively to the requirements of a major auto MNC for one of its car models was suspended and the fixed assets moved to other locations due to the said auto MNC discontinuing the said car model.
The chains business segment will continue its core business processes to handle both volume fluctuations and change in the product mix to meet customers’ demand. The replacement market continues to provide opportunities for growth notwithstanding good competition and the business expects to strengthen on the sales structure, deepen its coverage and launch new products for new categories.
During the year under review, the segment recorded revenue net of excise duty of `1,157 Cr. as compared to `1,038 Cr. during the previous year, a growth of 11%. The operating profit before interest and tax stood at `102 Cr. as compared to `88 Cr. during the previous year, a growth of 16%.
5. Dividend
The Board of Directors has recommended a Dividend of `0.50 (fifty paise) per share on equity share of face value of `1 each for the financial year ended 31st March,
2018. Together with the interim dividend of `1.25 per share, paid on 28th February, 2018, the total dividend for the year works out to `1.75 per share on equity share of face value of `1 each. The final dividend, if approved by shareholders, will be paid on or after 17th August, 2018.
The policy on Dividend Distribution as approved by the Board is uploaded and available on the following link on the Company’s website, http://www.tiindia.com/article/values/601. The Policy also forms part of this Annual Report for the information of shareholders as Annexure-A.
6. Share Capital
The paid up Equity Share Capital as on 31st March 2018 was `18.75 Cr.
7. Finance
Cash and Cash Equivalents as at 31st March 2018 were `19.25 Cr. The Company continues to focus on judicious management of its working capital. Receivables, inventories and other working capital parameters were kept under strict check through continuous monitoring.
7.1. Non-Convertible Debentures
During the year, Non-Convertible Debentures (NCDs) aggregating `125 Cr. were redeemed and NCDs for `100 Cr. were issued. As on 31st March 2018, NCDs aggregating 4̀50 Cr. were outstanding.
7.2. Deposits
The Company has not accepted any fixed deposits under Chapter V of the Companies Act, 2013 and as such no amount of principal and interest were outstanding as on 31st March 2018.
7.3. Particulars of Loans, Guarantees or Investments
During the year, the Company has not given any loans or guarantees under the provisions of Section 186 of the Companies Act, 2013. The Company made the following investments:
- Subscribed to 40,00,000 Equity Shares of `10 each of TI Tsubamex Private Ltd, for an aggregate amount of 4̀ Cr;
- Subscribed to 37,50,000 Equity Shares of `10 each of TI Absolute Concepts Private Ltd., for an aggregate amount of `3.75 Cr.;
- Acquired by way of purchase 40,00,000 Equity Shares of Sri Lankan Rupees (SLR) 10 each of Great Cycles (Private) Ltd., for an aggregate consideration of `16.98 Cr.
- Acquired by way of purchase 40,00,000 Equity Shares of SLR 10 each of Creative Cycles (Private) Ltd., for an aggregate consideration of `6.47 Cr.

Annual Report 2017-18 21
Corporate Overview Management Reports Financial Statements
8. Consolidated Financial Highlights ` in Cr.
Particulars 2017-18 2016-17
Revenue from Operation 5116.28 4820.20
Profit Before Exceptional items and Tax
230.17 228.55
Exceptional items (3.26) -
Profit Before Tax and Exceptional Items
226.91 228.55
Tax Expense (58.32) (46.75)
Profit for the year before Minority Interest and share of profit from Associate
168.59 181.80
Share of loss from Associate (13.08) (7.45)
Net Profit for the Year 155.51 174.35
9. Business Review – Subsidiaries and Joint Ventures
9.1. Shanthi Gears Ltd (SGL)
SGL, a subsidiary of the Company, recorded revenue net of excise duty of `214 Cr. in 2017-18 against `184 Cr. in the previous year. Profit before tax was `33 Cr. (previous year: `29 Cr.). During the year, SGL renewed its focus on re-establishing itself in the market and gaining new customers.
SGL continued to look at enlarging its market presence, create a robust channel, enhance its process capabilities and launch new products to meet the growing expectations of customers.
9.2. Financière C10 SAS (FC10)
FC10, the Company’s wholly-owned subsidiary in France, recorded a consolidated revenue of Euro 33 Mn in 2017 (previous year: Euro 30 Mn). The profit/loss before tax for the year was Euro 0.14 Mn (previous year: loss before tax Euro 0.19 Mn). The consolidated results of FC10 include results of its subsidiaries viz., Sedis SAS (France), Sedis GmbH (Germany) and Sedis Co Ltd (UK).
9.3. TI Tsubamex Private Limited (TTPL)
TTPL is a joint venture of the Company with M/s. Tsubamex Company Limited, Japan to engage in the business of design and engineering of sheet metal dies and fixtures and providing related services The Company presently holds 78.3% of TTPL’s equity capital.
During the course of 2017-18, TTPL successfully completed and delivered varied projects for different auto OEMs and their Tier 1 suppliers. The highlight was delivery of skin panel dies for an auto major’s new project. The company was able to attract, recruit and train tool & die engineers from reputed polytechnics
such as Nettur Technical Training Foundation (NTTF) and Murugappa Polytechnic. This paved the way for reducing dependence on high cost contract shop floor personnel. Efforts are in progress to reduce the fixed costs further.
The joint venture partner is providing continuous support by way of assigning specific experts to work alongside TTPL’s employees and impart specific skills in die assembly and die finishing.
TTPL recorded a revenue net of excise duty of `25.72 Cr. for 2017-18 and recorded a loss before tax of `6.98 Cr. (previous year: `5.81 Cr.).
9.4. Great Cycles (Private) Limited (GCPL)
GCPL is the Company’s subsidiary in Sri Lanka acquired in March 2018. The Company presently holds 80% of GCPL’s equity capital.
9.5. Creative Cycles (Private) Limited (CCPL)
CCPL is the Company’s subsidiary in Sri Lanka acquired in March 2018. The Company presently holds 80% of CCPL’s equity capital.
9.6. TI Absolute Concepts Private Limited (TIACPL)
TIACPL is the joint venture between the Company and M/s. Absolute Speciality Foods Chennai Private Limited with regard to the operation of bicycle theme based restaurants under the concept of ‘Ciclo Café’.
During the year under review, the Company had invested in the aggregate `3.75 Cr. in the equity share capital of TIACPL, with the joint venture partner also making an equal contribution as envisaged under the Joint Venture Agreement. The Company presently holds 50% of TIACPL’s equity capital.
Ciclo Cafes operated by TIACPL are functioning at Kotturpuram (Chennai), Hyderabad and Bengaluru.
TIACPL achieved a turnover of `11 Cr. for 2017-18 and recorded a loss before tax of `16 Cr.
The Statement containing salient features of the financial statements of the Company’s Subsidiaries / Associate Companies / Joint Ventures is attached as Annexure-B. The Consolidated Financial Statements of the Company and its subsidiaries, prepared in accordance with the Indian Accounting Standards, form part of the Annual Report.
Further, consequent to the demerger sanctioned by the National Company Law Tribunal, Chennai vide its Order dated 17th July, 2017 and effective 1st April, 2016 viz., the Appointed Date under the Scheme of Arrangement

22 Annual Report 2017-18
Tube Investments of India Limited(Formerly known as TI Financial Holdings Limited)
(Demerger), Cholamandalam Investment and Finance Company Limited ceased to be an Associate of the Company, Cholamandalam MS General Insurance Company Limited ceased to be subsidiary of the Company and Cholamandalam MS Risk Services Limited ceased to be the Joint Venture of the Company.
10. Financial Review
10.1. Profits & Profitability
The Profit before Tax and Exceptional Items registered a growth of 8%, through continued control on costs, better operating efficiencies, stabilisation of Large Diameter Tube manufacturing Plant and reduction of interest costs. On certain occasions, the Company was not able to fully recover the increase in cost from its customers.
All the business segments of the Company maintained their focus on servicing customers, improving efficiencies, controlling working capital and reducing resources employed in the business.
10.2. Capital Expenditure
The Company’s Large Diameter Tube manufacturing Plant got stabilized during the current year. The Company continues to invest in facilities with a view to servicing its customers in a more timely and efficient manner, modernising its assets and aims to be the best in class. The Company continues to assess the trends emerging in the industry and the changing requirements of its customers and invest appropriately for the long-term. The Company completed the construction of a new plant in Rajpura, Punjab to manufacture precision tubes. The installation of major equipment has been completed and trial production is underway. The Company is also investing further in fine blanking area to meet the growing customer demand.
10.3. Interest Cost
The Company’s average cost of borrowing reduced to 7% p.a., since interest cost for the year was lower due to the lower quantum of borrowings and lower interest rates.
10.4. Internal Control Systems
Internal Control Systems in the organisation are looked at as the key to its effective functioning. The Company believes that internal control is one of the key pillars of governance which provides freedom to the management within a framework of appropriate checks and balances. Given the nature of business and size of operations, the Company has designed and instituted a robust
Internal Control System that comprises well-defined organisation structure, roles and responsibilities, documented policies and procedures, to prevent business risks through a framework of internal controls and processes. These controls ensure:
a) Recording of transactions are accurate, complete and properly authorised;
b) Adherence to Accounting Standards, compliance to applicable Statutes, Company policies and procedures and timely preparation of financial statements;
c) Effective usage of resources and safeguarding of assets;
d) Prevention and detection of frauds/errors;
e) Efficient conduct of operations.
To ensure efficient Internal Control Systems, the Company has a well-established, independent and multi-disciplinary in-house Internal Audit function that carries out periodic audits across locations and functions. The scope and authority of the Internal Audit function is derived from the Internal Audit charter duly approved by the management. The Internal Audit function reviews compliance vis-à-vis the established design of the internal control, as also the efficiency and effectiveness of operations. Internal Audit function is responsible for providing, assurance on compliance with operating systems, internal policies and legal requirements, as well as, suggesting improvements to systems and processes.
The summary of the Internal Audit findings and status of implementation of action plans for risk mitigation, are submitted to the Audit Committee every quarter for review, and concerns if any, are reported to the Board. This process ensures robustness of Internal Control System and compliance with laws and regulations including resource utilization and system efficacy.
Revenue and capital expenditures are governed by approved budgets and the levels are defined by a delegation of authority mechanism. Review of capital expenditure is undertaken with reference to benefits expected in line with the policy for the same.
Investment decisions are subject to formal detailed evaluation and approved by the relevant authority as defined in the delegation of authority mechanism. The Audit Committee reviews the plan for internal audit, significant internal audit observations and functioning of the Company’s Internal Audit department on a periodic basis.

Annual Report 2017-18 23
Corporate Overview Management Reports Financial Statements
10.5. Internal Financial Control Systems with reference to the Financial Statements
The Company has complied with the specific requirements of the Companies Act, 2013 which call for establishment and implementation of an Internal Financial Control framework that supports compliance with requirements of the Act in relation to the Directors’ Responsibility Statement.
The Company’s business processes are enabled by an Enterprise-wide Resource Platform (ERP) as its core IT system. The operating management is not only responsible for revenue and profitability, but also for maintaining financial discipline and accountability. The systems and processes are continuously improved by adopting best in class processes, automation and implementing latest Information Technology tools.
The Company has a formal system of internal financial control to ensure the reliability of financial and operational information, and regulatory and statutory compliances. The Company’s business processes are enabled by the ERP for monitoring and reporting processes resulting in financial discipline and accountability.
11. Enterprise Risk Analysis and Management
The Company has an established risk assessment and
minimization framework. This framework provides a
mechanism to identify the risk, evaluation of likelihood
of happening and consequences. It also provides for
assessment of options to mitigate the risk and develop
appropriate risk management plans. There are normal
constraints of time, efficiency and cost.
The Risk Management Committee of the Board of
Directors reviews the risk mitigation plans periodically
to monitor the key risks of the Company and evaluate
the management of such risks for effective mitigation.
During the year under review, the Risk Management
Committee met twice viz., on 6th November, 2017
and 13th February, 2018 and reviewed the risks and
mitigation plans of the SBUs of the Company.
Some of the risks associated with the businesses and the
related mitigation plans are discussed hereunder. The
risks given below are not exhaustive and the evaluation
of risk is based on management’s perception.
11.1. Bicycles and Components
Risk Why considered as Risk Mitigation Plan/Counter Measure
Product Obsolescence Risk • Availability of alternatives• Increased affordability for motorised
vehicles• Shrinking road space for cycling
• Higher variety, especially of premium bikes• Products based on customer need• “Cycling” as a concept beyond commuting
– leisure, fitness, fun and recreationSourcing Risk • Dependence on vendor base
• Consistent quality and supplies• 25% of vendors located in residential area
• Continuous upgrading of vendor capability• Relationship building• Imports from quality sources• Reconfigure & relocate vendor base
Competition Risk • Competition from domestic suppliers• Imports
• Enhancing the Brand awareness• Introducing new models with a healthy
innovation funnel• Consistent quality and timely delivery• Enhancing price competitiveness
Volume & Profitability Risk • Rapid decline in Standards segment• Low price competition in Specials segment• Growth in Premium segment not sufficient
to offset the overall drop in volume• Higher fixed cost related to volume
• Drive growth in Premium cycles segment• Build capability to compete in Specials
segment at various price points• Cost reduction measures to enhance
profitability
Technology Risk • Lack of capacity and capability to handle large scale shift to alloy bikes
• Capability building for manufacture and assembly of alloy bikes
• Establishing reliable source for high-end bikes

24 Annual Report 2017-18
Tube Investments of India Limited(Formerly known as TI Financial Holdings Limited)
11.2. Engineering
Risk Why considered as Risk Mitigation Plan/Counter Measure
User Industry Concentration Risk
• Significant exposure to auto sector
• Time lag in pass through of input cost changes
• New products/applications to existing customers
• Introduction of new products catering to non-auto users
• Leverage application engineering skills for tubular solutions
• Drive operational efficiencies vigorously
• Cost reduction through operational excellence initiatives
Technology Obsolescence Risk
• Cheaper alternatives for auto applications affecting revenue streams
• Imbibing new and relevant technologies
• Equipment upgradations
Raw Material Risk • Volatility in steel price
• Inconsistency in quality
• High inventory holding
• Alliance with steel producers
• Global sourcing
• Strategic sourcing
• Rationalization and standardization of grades
• Move to products with higher value addition
Competition Risk • Competition from integrated steel mills
• New entrants with financial strength
• Imports
• Consistent quality and timely delivery
• Import substitution, development of new grades
• Product range of offering leveraging all businesses of the Company
• Innovate on products, process and applications
• Leveraging metallurgy skills
Export related risks • Increased trade protectionism and import tariff
• Global competition
• Need for higher capability
• Identification of new export markets and customers
• Capability building
• Enhanced domestic sales

Annual Report 2017-18 25
Corporate Overview Management Reports Financial Statements
11.3. Metal Formed Products
Risk Why considered as Risk Mitigation Plan/Counter Measure
Product Risk • Revenues are model specific • Indigenization of equipment
• Pursue options for other business using the same facilities
• Model specific investments to be done by OEMs
• More rigorous analysis of risks before taking up the project
User Industry Concentration Risk
• Dependence on auto sector
• Impact of slow down
• Diversification into non-auto business
• Focus on industrial applications
• Develop range of power transmission products
Customer Retention Risk • Availability of alternative source
• Disruption in supplies
• Cost competitiveness through Operational Excellence initiatives
• Leverage design strength
• Leverage proximity to customer
• Build technology superiority
• Product - plant rationalizationEntry of competition • Low technology barrier
• Impact on profit
• Leverage position with customer as technology leader
• Continuous upgrading of technical specifications
• Cost reduction
• Concentration in focus marketsEntry of internationally established players in domestic market
• Better product range
• Tie-up with local player/end user
• ‘High quality’ image
• Enhance product portfolio leveraging acquisition
• Leverage leadership and competitive position in industry
• Strengthen collaboration with R&D team of customers
• Pursue opportunities in systems/components
• Pursue options for collaborating with other multi-national player(s) of repute
Sourcing Risk • Dependence on a few vendors for certain components
• Vendor relationship building
• Enhancing vendor base, both locally as well as overseas
• Leveraging strength of combined entityPricing risk • Year-on-Year price reduction expectation
• Price recovery due to dependence on a few OEMS
• Utilisation of existing assets, optimal investment assumptions and reduced cost of operations
• Value engineering and value analysis in business re-engineering process
• Claims from customer for lower volumes
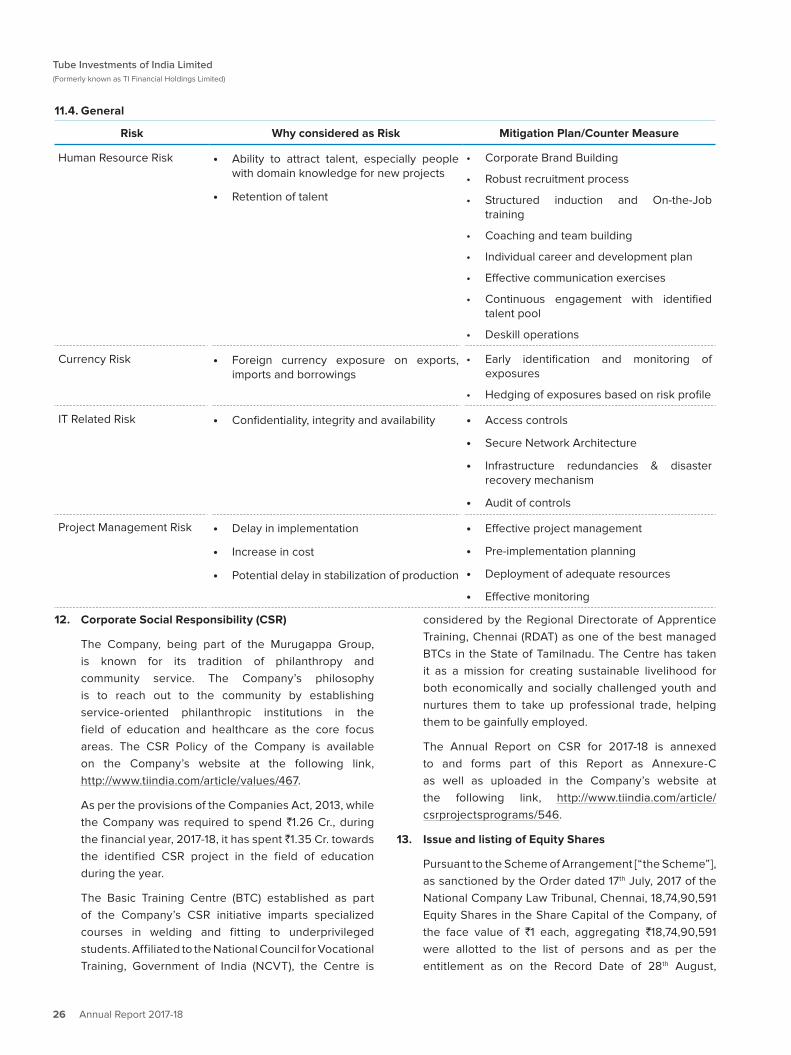
26 Annual Report 2017-18
Tube Investments of India Limited(Formerly known as TI Financial Holdings Limited)
11.4. General
Risk Why considered as Risk Mitigation Plan/Counter Measure
Human Resource Risk • Ability to attract talent, especially people with domain knowledge for new projects
• Retention of talent
• Corporate Brand Building
• Robust recruitment process
• Structured induction and On-the-Job training
• Coaching and team building
• Individual career and development plan
• Effective communication exercises
• Continuous engagement with identified talent pool
• Deskill operations
Currency Risk • Foreign currency exposure on exports, imports and borrowings
• Early identification and monitoring of exposures
• Hedging of exposures based on risk profile
IT Related Risk • Confidentiality, integrity and availability • Access controls
• Secure Network Architecture
• Infrastructure redundancies & disaster recovery mechanism
• Audit of controls
Project Management Risk • Delay in implementation
• Increase in cost
• Potential delay in stabilization of production
• Effective project management
• Pre-implementation planning
• Deployment of adequate resources
• Effective monitoring
12. Corporate Social Responsibility (CSR)
The Company, being part of the Murugappa Group, is known for its tradition of philanthropy and community service. The Company’s philosophy is to reach out to the community by establishing service-oriented philanthropic institutions in the field of education and healthcare as the core focus areas. The CSR Policy of the Company is available on the Company’s website at the following link, http://www.tiindia.com/article/values/467.
As per the provisions of the Companies Act, 2013, while the Company was required to spend `1.26 Cr., during the financial year, 2017-18, it has spent `1.35 Cr. towards the identified CSR project in the field of education during the year.
The Basic Training Centre (BTC) established as part of the Company’s CSR initiative imparts specialized courses in welding and fitting to underprivileged students. Affiliated to the National Council for Vocational Training, Government of India (NCVT), the Centre is
considered by the Regional Directorate of Apprentice Training, Chennai (RDAT) as one of the best managed BTCs in the State of Tamilnadu. The Centre has taken it as a mission for creating sustainable livelihood for both economically and socially challenged youth and nurtures them to take up professional trade, helping them to be gainfully employed.
The Annual Report on CSR for 2017-18 is annexed to and forms part of this Report as Annexure-C as well as uploaded in the Company’s website at the following link, http://www.tiindia.com/article/csrprojectsprograms/546.
13. Issue and listing of Equity Shares
Pursuant to the Scheme of Arrangement [“the Scheme”], as sanctioned by the Order dated 17th July, 2017 of the National Company Law Tribunal, Chennai, 18,74,90,591 Equity Shares in the Share Capital of the Company, of the face value of `1 each, aggregating `18,74,90,591 were allotted to the list of persons and as per the entitlement as on the Record Date of 28th August,

Annual Report 2017-18 27
Corporate Overview Management Reports Financial Statements
2017, as submitted for the purpose by the Registrar & Share Transfer Agent viz., Karvy Computershare Private Limited. Despatch of physical Share Certificates by post/crediting the demat account of the allottees was completed on 19th September, 2017. The Equity Shares of the Company were admitted to listing on the Stock Exchanges viz., BSE Ltd and National Stock Exchange of India Ltd., and commenced trading on the Stock Exchanges with effect from 2nd November, 2017 under the Stock Symbol “TIINDIA” (NSE)/Stock Code 540762 (BSE).
14. Global Depository Receipts Programme
The Company established a Global Depository Receipts ("GDR") Programme by executing a Depository Agreement on 29th January, 2018 with Bank of New York Mellon, New York, USA ("BNYM") pursuant to which BNYM acts as the Depository for the GDRs issued in respect of 42,23,460 (representing 2.25% of the Company's paid up capital) underlying equity shares of the Company allotted pursuant to the Scheme of Arrangement for Demerger between Tl Financial Holdings Limited (formerly Tube Investments of India Limited - Demerged Company) and the Company (the Resulting Company).
15. Corporate Governance
The Company is committed to maintaining high standards of corporate governance.
As stated above, with the listing of its equity shares on the Stock Exchanges, the Company became a listed company with effect from 2nd November, 2017. The Company was wholly in compliance with the requirements of the Listing Agreement with the Stock Exchanges as well as the SEBI Listing Regulations.
A report on corporate governance together with a certificate from the Auditors is annexed in accordance with the terms of the SEBI Listing Regulations as Annexure-D and forms part of the Board’s Report. The Managing Director and the Chief Financial Officer have submitted a certificate to the Board regarding the financial statements and other matters in terms of Part B of Schedule II [Corporate Governance] of the SEBI Listing Regulations.
The Report further contains details as required to be provided in the Board’s Report on the policy on Directors’ appointment and remuneration including the criteria, annual evaluation by the Board and Directors, composition and other details of Board committees, implementation of risk management policy, whistle-blower policy/vigil mechanism, dividend policy etc.
16. Business Responsibility Reporting
For the financial year 2017-18, the Company forms part of the top 500 listed entities of the country based on market capitalisation. Accordingly, as required under the SEBI Listing Regulations which mandate the inclusion of a Business Responsibility Report as part of the Annual Report for the top 500 listed entities, the Business Responsibility Report forms part of the Annual Report as Annexure-E.
The Business Responsibility Policy of the Company is displayed in the Company’s website at the following link, http://www.tiindia.com/article/values/667.
17. Human Resources
The Company continues to leverage its strength in human capital by attracting the right talent, nurturing & developing, and retaining them to meet the short-term and long-term organization goals. The key HR imperatives were addressed through Organization Structure & Design, building technical & Operational Excellence (OPEX) capabilities, building leadership & talent pool, productivity improvement and employee cost reduction programs, maintaining cordial Industrial Relations and digitizing HR processes.
The Company is successful in attracting talent from outside and during the year close to two hundred people were hired across different levels and functions. Behavioural event and competency based interviewing training for strengthening the talent acquisition process was also initiated during the year.
Senior leaders have been investing lot of time and efforts in identifying and developing succession pipeline for critical positions in the organization. The transition management programmes viz., Ascend & Aspire have been very successful and as part of the programme, implementation of Individual Development Plans (IDPs) for talent pool identified through these programmes is being facilitated. The IDPs are being reviewed regularly and On-the-Job projects, job enlargement/job rotation, mentoring support to the target group are being provided. Coaching & mentoring was done for select talent across the organization with an intent of developing future leaders. Internal employees have been given opportunities to take up higher roles and grow in the system.
Several initiatives have been taken up towards enhancing the technical capability of employees across businesses. Focus was towards building an internal team of Subject Matter Experts (SMEs) in critical areas. Employees were trained in areas like Six Sigma, Value

28 Annual Report 2017-18
Tube Investments of India Limited(Formerly known as TI Financial Holdings Limited)
Stream Mapping (VSM), energy management and welding through in-house training, on-the-job training, certification programs, live projects and mentoring. The SMEs are deployed in improvement projects across businesses. A Technical Training Laboratory has also been established for welding at the Basic Training Centre, Avadi, which is being used to enhance the Metal Inert Gas (MIG) welding skills of employees as well as vendors’ employees.
The OPEX programme drives operational efficiency, capability development and employee involvement towards continual improvement. The objective is to achieve the benchmark targets in the eight OPEX verticals.
The total number of permanent employees on the rolls of the Company as on 31st March, 2018 is 3,365.
Industrial relations remained cordial at all the Company’s units during the period under review.
The information relating to employees and other particulars required under Section 197 of the Companies Act, 2013 read with Rule 5 of the Companies (Appointment & Remuneration of Managerial Personnel) Rules 2014 will be provided upon request. In terms of Section 136 of the Companies Act, 2013, the Report and Accounts are being sent to the Members, excluding the information on employees, particulars of which are available for inspection by the Members at the Registered Office of the Company during business hours on all working days of the Company up to the date of the forthcoming Annual General Meeting. If any Member is interested in obtaining a copy thereof, such Member may write to the Company Secretary in the said regard.
The disclosure with regard to remuneration as required under Section 197 of the Act read with Rule 5 of the Companies (Appointment and Remuneration of Managerial Personnel) Rules, 2014 is attached and forms part of this Report as Annexure-F.
18. Prevention of sexual harassment at workplace
The Company has policy on prevention of sexual harassment at workplace in line with the requirement of the Sexual Harassment of Women at the Workplace (Prevention, Prohibition & Redressal) Act, 2013. An internal Complaints Committee (ICC) to redress complaints received regarding sexual harassment has been constituted. The policy extends to all employees (permanent, contractual, temporary and trainees). Employees at all levels are being sensitized about the new Policy and the remedies available thereunder. No
complaints were received and disposed off during the year under review.
19. Employee Stock Option Scheme
In accordance with the Scheme of Arrangement for Demerger sanctioned by the National Company Law Tribunal, during the year, 3,63,763 Stock Options under the Company’s Employee Stock Option Plan (ESOP 2017) were granted to eligible employees at the rate of 1 Stock Option for each Stock Option held and outstanding in the erstwhile Tube Investments of India Limited viz., the Demerged Company under the Scheme.
Further, a grant of 10,86,480 Stock Options and 2,62,200 Stock Options to eligible employees of the Company under the ESOP 2017 with graded vesting periods in respect of each of said grants was also made to eligible employees during the year.
During the year under review, the Company has issued 45,777 equity shares to eligible employees consequent to exercise by them of the stock options vested under the ESOP 2017.
Details in respect of the Company’s ESOP 2017 as required under the relevant SEBI Regulations are displayed in the Company’s website at the following link, http://www.tiindia.com/article/values/554.
20. Directors’ Responsibility Statement
The Board of Directors confirm that the Company has in place a framework of internal financial controls and compliance system, which is monitored and reviewed by the Audit Committee and the Board besides the statutory, internal and secretarial auditors. To the best of their knowledge and belief and according to the information and explanations obtained by them, your Directors make the following statements in terms of Section 134(3)(c) of the Companies Act, 2013:
a) that in the preparation of the annual Financial Statements for the year ended 31st March 2018, the applicable accounting standards have been followed along with proper explanation relating to material departures, if any;
b) that such accounting policies as mentioned in the Notes to the Financial Statements have been selected and applied consistently and judgment and estimates have been made that are reasonable and prudent so as to give a true and fair view of the state of affairs of the Company as at 31st March, 2018 and of the profit of the Company for the year ended on that date;

Annual Report 2017-18 29
Corporate Overview Management Reports Financial Statements
c) that proper and sufficient care has been taken for the maintenance of adequate accounting records in accordance with the provisions of the Companies Act, 2013 for safeguarding the assets of the Company and for preventing and detecting fraud and other irregularities;
d) that the annual Financial Statements have been prepared on a going concern basis;
e) that proper internal financial controls to be followed by the Company have been laid down and that the financial controls are adequate and were operating effectively; &
f) that proper systems have been devised to ensure compliance with the provisions of all applicable laws and that such systems were adequate and operating effectively.
21. Auditors
M/s. S R Batliboi & Associates LLP, Chartered Accountants (LLP Identity no.AAB-4295) were appointed as Statutory Auditors at the previous 9th Annual General Meeting held on 6th November, 2017 for a period of five years viz., from the conclusion of the said 9th Annual General Meeting till the conclusion of the 14th Annual General Meeting. In terms of the resolution passed by the Members, the said appointment is subject to ratification by the Members at every Annual General Meeting and their remuneration will be recommended to the Shareholders at the time of taking up such ratification of appointment each year.
Accordingly, the Board recommends the ratification of, and the terms of remuneration payable to, the Statutory Auditors as set out in the resolution contained in the Notice of the ensuing Annual General Meeting.
M/s. S Mahadevan & Co., (firm no.000007), Cost Accountants were appointed as the Cost Auditors of the Company for auditing the cost accounting records maintained by the Company in respect of the applicable products for the financial year, 2018-19. Necessary resolution for ratification of their remuneration in respect of the aforesaid terms of appointment for financial year, 2018-19 forms part of the Notice for the ensuing Annual General Meeting.
22. Related Party Transactions
All related party transactions that were entered into during the financial year under review were on an arm’s length basis and were in the ordinary course of business. There are no materially significant related party transactions during the year which may have a potential conflict with the interest of the Company at
large. Necessary disclosures as required under the Indian Accounting Standards have been made in the notes to the Financial Statements.
The policy on Related Party Transactions as approved by the Board is uploaded and is available on the following link on the Company’s website, http://www.tiindia.com/article/values/476. None of the Directors had any pecuniary relationships or transactions vis-à-vis the Company.
23. Directors
Mr. M M Murugappan will retire by rotation at the ensuing Annual General Meeting under Section 152 of the Companies Act, 2013 (“the Act”) and being eligible, he offers himself for re-appointment.
Mr. Ramesh K B Menon was appointed as Additional Director (Non-Executive Director) on 16th November, 2017, liable to retire by rotation and he continues up to the ensuing Annual General Meeting. Necessary resolution proposing the appointment of Mr. Ramesh K B Menon as a Director liable to retire by rotation under Section 152 of the Companies Act, 2013 forms part of the Notice for the ensuing Annual General Meeting.
The Board takes pleasure in recommending the appointment of Mr. M M Murugappan and Mr. Ramesh K B Menon as Directors at the forthcoming Annual General Meeting.
Mr. L Ramkumar, Managing Director of the Company retires at the conclusion of the ensuing Annual General Meeting. The Board places on record its appreciation of the distinguished services rendered by Mr. L Ramkumar during his decade long association, since 2008, with TII as Managing Director before and after its demerger.
Consequent to the retirement of Mr. L Ramkumar as Managing Director at the conclusion of the forthcoming Annual General Meeting, Mr. Vellayan Subbiah assumes charge as Managing Director of the Company.
Mr. S Sandilya’s term as Independent Director ends at the conclusion of the ensuing Annual General Meeting. The Board places on record its appreciation of the distinguished services rendered by Mr. S Sandilya during his long association, since January, 2005, as Director of TII, before and after its demerger.
Mr. Hemant M Nerurkar’s term as Independent Director ends at the conclusion of the ensuing Annual General Meeting. Mr. Nerurkar has been associated with TII since May, 2014. The Board places on record its appreciation of the distinguished services rendered by Mr. Hemant M Nerurkar during his association as Director of TII, before and after its demerger.

30 Annual Report 2017-18
Tube Investments of India Limited(Formerly known as TI Financial Holdings Limited)
All the Independent Directors of the Company have furnished necessary declaration in terms of Section 149(6) of the Act affirming that they meet the criteria of independence as stipulated thereunder.
24. Declarations/Affirmations
During the year under review:
- the manufacturing business undertaking of the Demerged Company was transferred and vested into the Company pursuant to the Scheme of Arrangement sanctioned by the National Company Law Tribunal, Chennai by its Order dated 17th July, 2017. Consequently, the business of the Company is in the nature of manufacturing business;
- apart from the demerger of the Manufacturing Business Undertaking which has been given effect in the Financial Statements, there were no material changes and commitments affecting the financial position of the Company, which have occurred between the end of the financial year of the Company to which the Financial Statements relate viz., 31st March, 2018 and the date of this Report; &
- there were no significant material orders passed by the regulators or courts or tribunals impacting the Company’s going concern status and its operations in future.
25. Secretarial Audit
Pursuant to the provisions of Section 204 of the Companies Act, 2013 and The Companies (Appointment and Remuneration of Managerial Personnel) Rules, 2014, the Company has appointed Mr. R Sridharan of Messrs R. Sridharan & Associates, a firm of Company Secretaries in Practice to undertake the Secretarial Audit of the Company. The Report of the Secretarial Audit Report is annexed herewith and forms part of this Report as Annexure-G.
The Company has ensured compliance of the Secretarial Standards issued by the Institute of Company Secretaries of India during the period under review. Accordingly, no qualifications or observations or other remarks have been made by the Secretarial Auditor in his said Report.
26. Annual Return
Extract of the Annual Return is annexed and forms part of this Report as Annexure-H.
27. Key Managerial Personnel
Mr. L Ramkumar, Managing Director, Mr. K Mahendra Kumar, Chief Financial Officer and Mr. S Suresh, Company Secretary are the Key Managerial Personnel (KMPs) of the Company as per Section 203 of the Companies Act, 2013. They were appointed to their respective offices as KMPs with effect from the close of business hours on 1st August, 2017.
Mr. Vellayan Subbiah, Managing Director (Designate) - KMP was appointed with effect from 19th August, 2017.
Mr. L Ramkumar also holds office as the Managing Director (KMP) of TI Tsubamex Private Limited (TTPL), the Company’s die manufacturing joint venture with Tsubamex Co. Limited, Japan and also a subsidiary of the Company, on ‘nil’ remuneration. He was re-appointed as Managing Director (KMP) of TTPL for the period from 1st April, 2018 to 13th August, 2018 (both days inclusive).
28. Energy Conservation, Technology Absorption and Foreign Exchange Earnings and Outgo
The information on conservation of energy, technology absorption and foreign exchange earnings and outgo stipulated under Section 134(3)(m) of the Companies Act, 2013 read with Rule 8 of The Companies (Accounts) Rules, 2014 is annexed herewith and forms part of this Report as Annexure-I.
The Directors thank all Customers, Vendors, Financial Institutions, Banks, State Governments, Joint Venture Partners and Investors for their continued support to your Company’s performance and growth. The Directors also wish to place on record their appreciation of the contribution made by all the employees of the Company resulting in the good performance during the year under review.
On behalf of the Board
Chennai M M Murugappan7th May 2018 Chairman

Annual Report 2017-18 31
Corporate Overview Management Reports Financial Statements
1. Background : This Policy is formulated in accordance with Regulation 43A of the
Securities and Exchange Board of India (Listing Obligations and Disclosure Requirements), 2015 introduced on 8th July 2016. This policy will be effective from 1st August, 2017, being the date of its approval by the Board of Directors of the Company.
2. Objective : The objective of this Policy is to lay down the criteria and parameters
that are to be considered by the Board of Directors of the Company while deciding on the declaration of Dividend from time to time. This Policy is applicable to dividend declared/recommended on the equity shares of the Company and does not cover dividend on preference shares, if any, where the rate of dividend is governed by the terms of the issue of preference shares or any other form of dividend.
3. Parameters to be considered for declaration of Dividend : The Board of Directors may declare interim dividend/recommend
final dividend for consideration of shareholders of the Company. As in the past, subject to the provisions of applicable laws, the
Company’s dividend pay-out will be determined by the Board of Directors from time to time based on the available financial resources, investment requirements and other factors more fully described hereunder. Subject to these parameters, the Company would endeavour to maintain a total dividend pay-out ratio (dividend inclusive of any tax on distribution of dividend in the hands of the Company) of about 25% of the annual standalone profits after tax after adjusting for payment of preference dividend, if any.
The Board of Directors of the Company will consider the following parameters while recommending/declaring Dividend:
3.1 Financial Parameters/Internal Factors : 1. Standalone/net operating profit after tax; 2. Operating cash flow of the Company for the year; 3. Liquidity position, aggregate Debt of the Company (both
standalone and consolidated), debt service coverage position etc.;
4. Loan repayment and working capital requirements; 5. Capital expenditure requirements; 6. Resources required for funding acquisitions, mergers and/
or new businesses; 7. Cash flow required for meeting tax demands and other
contingencies; 8. Regulatory (and growth requirement of) Capital Adequacy; 9. Regulatory (and growth requirement of) Solvency; 10. Trend of dividends paid in the past years; 11. Dividend receipt from subsidiaries; 12. Any windfall, extra-ordinary or abnormal gains made by the
Company; & 13. Any other factor not explicitly covered above but which is
likely to have a significant impact on the Company. 3.2 External Factors: 1. Prevailing legal requirements, regulatory restrictions laid
down under the applicable laws including tax laws and changes made in accounting laws;
2. Dividend pay-out ratios of companies in the same industry; &
3. Any other factor that has a significant influence/impact on the Company’s working/financial position of the Company.
The Board of Directors may additionally recommend special dividend in special circumstances.
4. Circumstances under which the shareholders may not expect Dividend:
The shareholders of the Company may not expect Dividend under the following circumstances:
4.1 In the event of inadequacy of profits or whenever the Company has incurred losses;
4.2 Significant cash flow requirements towards higher working capital requirements/tax demands/or others, adversely impacting free cash flows;
4.3 An impending/ongoing capital expenditure program or any acquisitions or investment in joint ventures requiring significant allocation of capital;
4.4 Allocation of cash required for buy-back of securities; 4.5 Any of the above referred internal or external factors
restraining the Company from considering dividend.5. Utilization of retained earnings : The Company may declare dividend out of the profits of the Company
for the year or out of the profits of any previous year or years or out of the free reserves available for distribution of Dividend, after having due regard to the parameters laid down in this Policy. Profits retained in the business will be invested in the business/operations of the Company and may be used for augmenting working capital, repayment of borrowings, funding capital expenditure/acquisition(s) and for all other corporate purposes.
6. Parameters to be adopted with regard to various classes of shares: Presently, the Authorised Share Capital of the Company is divided
into equity shares of `1/- each. At present, the issued and paid-up share capital of the Company comprises only equity shares.
The Company shall first declare dividend on outstanding preference shares, if any, at the rate of dividend fixed at the time of issue of preference shares and thereafter, the dividend would be declared on equity shares.
Currently, the Company has issued one class of equity shares with equal voting rights. As and when the Company issues different class of shares, the Board of Directors may suitably amend this Policy.
7. Procedure : 7.1 The dividend proposal placed before the Board for
consideration shall be in terms of this Policy. 7.2 The Company shall ensure compliance of provisions of
applicable Laws and this Policy in relation to Dividend declared by the Company.
8. Disclosure : The Company shall make appropriate disclosures as required
under the SEBI (Listing Obligations and Disclosure Requirements) Regulations, 2015.
9. General : 9.1 This Policy would be subject to revision/amendment in
accordance with the guidelines as may be issued by Ministry of Corporate Affairs, Securities and Exchange Board of India or such other regulatory authority as may be authorized, from time to time, on the subject matter.
9.2 The Company reserves its right to alter, modify, add, delete or amend any of the provisions of this Policy.
9.3 In case of any amendment(s), clarification(s), circular(s) etc., issued by the relevant authorities, not being consistent with the provisions laid down under this Policy, then such amendment(s), clarification(s), circular(s) etc., shall prevail upon the provisions hereunder and this Policy shall stand amended accordingly from the effective date as laid down under such amendment(s), clarification(s), circular(s) etc.
Dividend Distribution PolicyAnnexure-A

32 Annual Report 2017-18
Tube Investments of India Limited(Formerly known as TI Financial Holdings Limited)
Form AOC - 1Statement containing Salient Features of the Financial Statements of Subsidiaries/Associate Companies/Joint VenturesPart A - Information in respect of each Subsidiary ` in Cr.
Sl. No.
Name of the subsidiaryShanthi Gears
Limited
Financiere C10 SAS
Sedis SAS
Sedis GmbH
Sedis Company Limited
Creative Cycles
(Private) Limited
Great Cycles
(Private) Limited
1 Reporting period of the subsidiary31-Mar-
201831-Dec-
201731-Dec-
201731-Dec-
201731-Dec-
201731-Mar-
201831-Mar-
20182 Reporting currency and exchange
rate as on the last date of the relevant financial year in the case of foreign subsidiaries
INR EUR1 EUR = `76.76
EUR1 EUR = `76.76
EUR1 EUR = `76.76
GBP1 GBP = `86.23
LKR1 LKR = `0.42
LKR1 LKR = `0.42
3 Share Capital 8.17 25.78 49.89 0.19 1.68 2.10 2.104 Reserves & Surplus 309.62 55.60 19.41 (2.60) 0.94 (0.73) 10.905 Total Assets (Non-Current and Current
Assets) 360.06 105.71 198.61 3.18 6.14 16.21 14.17
6 Total Liabilities (Non-Current and Current Liabilities)
42.27 24.33 129.31 5.59 3.52 14.84 1.17
7 Investments (Non-Current and Current Investments)
113.57 80.69 4.38 0.15 - - -
8 Turnover 214.49 5.93 243.18 6.30 8.91 5.54 1.279 Profit / (Loss) Before Tax 33.17 0.04 3.79 - (0.92) 0.13 0.1510 Provision / (Reversal) for Tax 4.59 0.01 (1.33) - - 0.12 -11 Profit / (Loss) After Tax 28.58 0.03 5.12 - (0.92) 0.01 0.1512 Proposed Dividend Nil Nil Nil Nil Nil Nil Nil13 % of Shareholding 70.12% 100.00% 100.00% 100.00% 100.00% 80.00% 80.00%
Part B - Associates and Joint Ventures(Statement pursuant to Section 129(3) of the Companies Act, 2013 related to Associate Companies and Joint Ventures)
Sl. No.
Name of the Associates/Joint Venture CompaniesTI Tsubamex Private
Limited(Joint Venture Company)
TI Absolute Concepts Private Limited
(Joint Venture Company)1 Latest Audited Balance Sheet Date 31-Mar-2018 31-Mar-20182 Share of Associate/Joint Venture held by the Company on the
year end- No. of Shares 2,35,00,000 1,37,50,000- Amount of Investment 23,50,00,000 13,75,00,000- Extent of Holding (%) 78.33% 50%
3 Description of how there is significant influence Through shareholding Through shareholding
4 Reason why the Associate/joint venture is not consolidatedIt is getting consolidated
under Equity methodIt is getting consolidated
under Equity method5 Net worth attributable to Shareholding as per latest audited
financials (` in Crores.) 7.59 3.26
6 Loss for the year (` in Crores.)- Considered in Consolidation 5.32 7.76- Not considered in Consolidation Nil Nil
Notes:1 Names of Subsidiaries/Associates/joint ventures which are yet to commence operations - Nil
2 Names of Subsidiaries/Associates/joint ventures which have been liquidated or sold during the year - Nil
Annexure-B
On behalf of the Board
Place: Chennai S Suresh K Mahendra Kumar L Ramkumar M M MurugappanDate: 7th May 2018 Company Secretary Chief Financial Officer Managing Director Chairman

Annual Report 2017-18 33
Corporate Overview Management Reports Financial Statements
Annual Report on Corporate Social Responsibility (CSR) Activities
1. A brief outline of the Company’s CSR policy, including overview of projects or programmes proposed to be undertaken and a reference to the web-link to the CSR policy and projects or programmes.
Outline of the Company’s CSR Policy
Tube Investments of India Limited (formerly, TI Financial Holdings Limited) (“Company” or “TI”), being part of the Murugappa Group firmly believes that social responsibility is not just a corporate obligation that has to be carried out but it is one’s Dharma (path of righteousness) and has been earmarking a part of its income for carrying out its social responsibilities. TI’s philanthropic endeavours are therefore a reflection of its spiritual conscience and this provides it a way to discharge its responsibilities to the various sections of the society.
The CSR Policy of the Company inter alia provides for identification of CSR projects and programmes, modalities of execution, monitoring process. The Policy can be accessed on the Company’s website (web link: http://www.tiindia.com/article/values/467).
Overview of the CSR Projects and Programmes:
TI is committed to identifying and supporting programmes aimed at -
• Empowerment of the underprivileged sections of the society through education, access to and awareness about financial services and the like;
• Provision of access to basic necessities like healthcare, drinking water & sanitation and the like;
• Working towards eradicating hunger and poverty, through livelihood generation and skill development;
• Supporting environmental and ecological balance through afforestation, soil conservation, rain water harvesting, conservation of flora & fauna and similar programmes;
• Promoting sports through training of sportspersons;
• Undertaking rural development projects;
• Promoting women empowerment and reduction of gender bias;
• Supporting traditional arts and culture;
• Any other programme that falls under TI’s CSR Policy and is aimed at the empowerment of underprivileged sections of the society.
The CSR spend during the financial year, 2017-18 has been in the area of education. Details of the same can be accessed in the Company’s website (web link: http://www.tiindia.com/article/csrprojectsprograms/546).
2. Composition of the CSR Committee:
Mr. S Sandilya (Independent Director)
Ms. Madhu Dubhashi (Independent Director)
Mr. L Ramkumar (Managing Director)
3. Average net profits of the Company during the three immediately preceding financial years:
The average net profits of the Company made during the three immediately preceding financial years as calculated under Section 135 of the Companies Act, 2013 and the Rules thereunder works out to `63.24 Cr.
4. Prescribed CSR Expenditure (two per cent of the amount as in item 3 above):
The prescribed CSR expenditure (2% of the average net profits as in 3 above) under Section 135 of the Companies Act, 2013 is `1.26 Cr.
Annexure-C

34 Annual Report 2017-18
Tube Investments of India Limited(Formerly known as TI Financial Holdings Limited)
5. Details of CSR spend during the financial year, 2017-18:
a. Total amount spent for the financial year: `1.35 Cr.
b. Amount unspent: Nil
c. Manner in which the amount spent during the financial year is detailed below: (` in Cr.)
Sl. No.
CSR Project/ Activity
identified
Sector in which the Project is covered
Projects or Programs(1) Local area or
other(2) State and district
where Projects or Programs was
undertaken
Amount Outlay
(Budget) Project or
Program wise
Amount spent on the
Projects or Programs
Cumulative expenditure
up to the reporting
period
Amount Spent - Direct (D) or through
implementing agency (IA)
1 Basic Training Centre Education Tamilnadu : Avadi in
Chennai 1.50 1.35 1.35 1.35(D)
6. Reason for not spending the prescribed CSR expenditure amount:
Not applicable as the Company has spent in excess of the mandatory minimum.
7. Responsibility Statement:
It is hereby affirmed that the implementation and monitoring of CSR Policy is in compliance with CSR objectives and Policy of the Company.
On behalf of the BoardPlace: Chennai L Ramkumar S SandilyaDate: 7th May, 2018 Managing Director Chairman, CSR Committee

Annual Report 2017-18 35
Corporate Overview Management Reports Financial Statements
Your Company believes that the fundamental objective of corporate governance is to enhance the interests of all stakeholders. The Company’s corporate governance practices emanate from its commitment towards discipline, accountability, transparency and fairness. Key elements in corporate governance are timely and adequate disclosure, establishment of internal controls and high standards of accounting fidelity, product and service quality.
Your Company also believes that good corporate governance practices help to enhance performance and valuation of the Company.
Board of Directors
The Board provides leadership, strategic guidance and objective judgement on the affairs of the Company. The Board comprises of persons of eminence with excellent professional achievements in their respective fields. The Independent Directors provide their independent judgement, external perspective and objectivity on the issues which are placed before them.
The Board of Directors of the Company consists of eight Directors, with knowledge and experience in different fields viz., engineering, manufacturing, finance and business management. Mr. M M Murugappan, Chairman (Promoter, non-executive), Mr. L Ramkumar, Managing Director (executive), Mr. Vellayan Subbiah, Managing Director (Designate) (Promoter, executive), Mr. Ramesh K B Menon (non-executive) are the non-Independent Directors in terms of the Securities and Exchange Board of India (Listing Obligations and Disclosure Requirements) Regulations, 2015 (referred to in this Report as “SEBI Listing Regulations”). Mr. Hemant M Nerurkar, Ms. Madhu Dubhashi, Mr. Pradeep V Bhide and Mr. S Sandilya are the Independent Directors in terms of the SEBI Listing Regulations. All the Independent Directors of the Company are eminent professionals. None of the Directors are related to each other.
The Company had issued letters of appointment to the said Independent Directors as required under Schedule IV to the Companies Act, 2013 and the terms and conditions of their appointment have also been be disclosed on the Company’s website www.tiindia.com [link: http://www.tiindia.com/investors/466].
On their appointment, the Independent Directors are familiarised about the Company’s operations and businesses. As part of the familiarisation programme, a handbook is provided to all Directors including Independent Directors at the time of appointment. The handbook provides a snapshot
to the Directors of their duties and responsibilities, rights, appointment process and evaluation, compensation, Board procedure and stakeholders’ expectations. The handbook also provides the Directors with an insight into the Group’s practices.
To familiarise the Director with the Company’s operations and businesses, plant visits are organised in respect of all divisions of the Company, as part of the induction programme, where the Director is taken around the facilities and explained in detail about the process. During such visit, besides interaction by the Business Heads and key executives with the Director, detailed presentations on the business of the Division are also made to the Director. Direct meetings with the Chairman and the Managing Director are further facilitated for the new appointee to familiarise him/her about the Company/its businesses and the Group practices. In addition, it is also ensured in the Board meeting agenda that besides the review of operations, information on the industry scenario in respect of the Company’s businesses, competition and strategy are presented on a quarterly basis. The details of the familiarisation programme are also disclosed on the Company’s website at the following link: http://www.tiindia.com/investors/466.
Neither of the Whole-time Directors served or serve as Independent Director in more than three listed entities. None of the Independent Directors of the Company served or serve as Independent Director in more than seven listed entities.
None of the Directors of the Company was a member of more than ten Board-level committees or a chairman of more than five such committees across all companies, in which he/she was a Director.
The Company has a well-established practice with regard to deciding the dates of meetings. The annual calendar for the meetings of the Board is finalised early on in consultation with all the Directors. A minimum of five Board meetings are held each year. Evolving strategy, annual business plans, review of actual performance and course correction, as deemed fit, constitute the primary business of the Board. The role of the Board also includes de-risking, investment, divestment and business reorganisation. Matters such as capital expenditure, recruitment of senior level personnel, safety & environment, Human Resources related developments, compliance with statutes and foreign exchange exposures are also reviewed by the Board from time to time.
The Company’s commitment to good governance practices allows the Board to effectively perform these functions.
Report on Corporate GovernanceAnnexure-D
36 Annual Report 2017-18
Tube Investments of India Limited(Formerly known as TI Financial Holdings Limited)
The Company ensures that timely and relevant information is made available to all the Directors in order to facilitate their effective participation and contribution during meetings and discussions.
Post-implementation of the Scheme of Arrangement (demerger) with effect from 1st August, 2017, there were four meetings of the Board of Directors. The dates of the Board meetings, attendance and the number of Directorships/Committee memberships held by the Directors are given in Table 1 of the annexure to this Report.
The Committees of the Board viz., Audit Committee, Nomination & Remuneration Committee, Stakeholders Relationship Committee, Corporate Social Responsibility Committee and Risk Management Committee, constituted with effect from 1st August, 2017 in accordance with the requirements of the Companies Act, 2013 and the SEBI Listing Regulations, have specific scope and responsibilities.
Audit Committee
The role of the Audit Committee, in brief, is to review financial statements, internal controls, accounting policies, internal audit report, related party transactions, risk management systems and functioning of the Whistle Blower mechanism.
The Audit Committee of the Company has three members, all of whom are Independent Directors. Mr. S Sandilya, Independent Director is the Chairman of the Committee. All the members of the Committee have excellent financial and accounting knowledge. The Chairman, Managing Director, Managing Director (Designate) and the Heads of Strategic Business Units are invitees to the meetings of the Audit Committee.
The quarterly financial results are placed before the Audit Committee for its review, suggestions and recommendations before taking the same to the Board. The statutory audit plans and progress are shared with the Committee for its review.
The quarterly financial results are placed before the Audit Committee for its review, suggestions and recommendations, before taking the same to the Board. The statutory audit plans and progress are shared with the Committee for its review. The internal audit plans are drawn up in consultation with the Managing Director, Chief Financial Officer, Heads of Strategic Business Units and the Audit Committee. The Committee reviews the observations of the internal auditor periodically. The Committee also provides guidance on compliance with the Accounting Standards and accounting policies. The statutory and internal auditors attend the Audit Committee meetings. The Committee also tracks the implementation of its guidelines/suggestions through
review of action taken reports. The terms of reference of Audit Committee are in line with the requirements of the Companies Act, 2013 and the Corporate Governance norms under the SEBI Listing Regulations.
The Committee met four times during the year ended 31st March, 2018. The composition of the Audit Committee and the attendance of each member at these meetings are given in Table 2 of the annexure to this Report.
Remuneration to Directors
The success of the organisation in achieving good performance and governance depends on its ability to attract quality individuals as executive and Independent Directors.
The Managing Directors’ compensation comprises a fixed component and a performance incentive. The compensation is determined based on the level of responsibility and scales prevailing in the industry. No sitting fees for attending Board/Committee meetings are paid to the Managing Directors.
The compensation to the non-executive Directors takes the form of commission on profits. Though the shareholders have approved payment of commission up to one per cent of the net profits of the Company for each year calculated as per the provisions of the Companies Act, 2013, the actual commission paid to the Directors will be restricted to a fixed sum. The sum is reviewed periodically taking into consideration various factors such as performance of the Company, time devoted by the Directors in attending to the affairs and business of the Company and the extent of responsibilities cast on the Directors under various laws and other relevant factors. Considering the time and efforts put in by Mr. M M Murugappan, Chairman and Mr. Pradeep V Bhide, Director towards the affairs of the Company, they are being paid a differential remuneration. The non-executive Directors are paid sitting fees also as permitted by government regulations for all Board and Committee meetings attended by them.
Nomination & Remuneration Committee
The role of the Nomination & Remuneration Committee is in accordance with the requirement of Section 178 of the Companies Act, 2013 and the SEBI Listing Regulations. Under the terms of reference, the Committee’s role includes formulation of criteria for determining qualifications, positive attributes and independence of a Director and recommending to the Board a policy relating to the remuneration for the directors, key managerial personnel and other employees; formulation of criteria for evaluation of Independent Directors and the Board; devising a policy on Board diversity and identification of persons who are qualified to become Directors and who may be appointed in senior management in accordance with the criteria laid down,
Annual Report 2017-18 37
Corporate Overview Management Reports Financial Statements
and recommend to the Board their appointment and removal. The Committee’s scope further covers recommending to the Board the appointment/re-appointment of the executive and non-executive Directors.
The Committee as constituted effective 1st August, 2017, post the Scheme of Arrangement becoming effective, consists of three members. The Chairman of the Committee is Mr. Hemant M Nerurkar, Independent Director. The other Members are Mr. S Sandilya, Independent Director and Mr. M M Murugappan, Non-Executive Director.
The Remuneration Policy of the Company provides a performance driven and market oriented framework to ensure that the Company attracts, retains and motivates high quality executives who can achieve the Company’s goals, while aligning the interests of employees, shareholders and all stakeholders in accordance with the group’s values and beliefs.
The Company’s total compensation package includes fixed compensation, variable compensation in the form of annual incentive, perquisites and benefits including health and life insurance and retirement benefits. In addition, select category of employees is eligible for long-term incentive plan in the form of stock options (ESOPs) under the Company’s Employee Stock Option Plan 2017, which has been introduced during the year (“ESOP 2017”). The ESOP 2017 is in compliance with the applicable SEBI Regulations. Details of the same are provided in the Company’s website, www.tiindia.com.
Fixed compensation is determined on the basis of size and scope of the job typically as reflected by the level or grade of the job, trends in the market value of the job and the skills, experience and performance of the employee. The annual incentive (variable pay) of senior executives is linked directly to the performance of the Business Unit and the Company through a balanced score card. A formal annual performance management process is applied to all employees, including senior executives. Annual increases in fixed and variable compensation of individual executives are directly linked to the performance ratings. Overall compensation is subject to periodic reviews which take into account data from compensation surveys conducted by specialist firms, as well as factors such as affordability based on the Company’s performance and the economic environment.
Accordingly, the Committee will determine the periodic increments in salary and annual incentive of the Executive Directors. The increments and incentive of the Managing Directors are determined on the basis of the balanced score card with its three components viz., Company financials, Company score card and strategic business unit scores being given appropriate weightage.
In addition to the above, the Committee is also vested with the powers and authority for implementation, administration and superintendence of the Employee Stock Option Plan and also to formulate the detailed terms and conditions in respect of the same.
The Committee has further laid down the qualifications, positive attributes and independence criteria in terms of Section 178(3) of the Companies Act, 2013 to be considered for nominating candidates for Board positions/re-appointment of Directors.
The Board Diversity Policy devised by the Committee sets out the approach to diversity on the Board of the Company in order to ensure a process which is transparent with diversity of thought, experience, knowledge, perspective and gender in the Board.
The Committee met three times during the year ended 31st March, 2018. The composition of the Committee and the attendance of each member at these meetings are given in Table 3 of the annexure to this Report.
The details of remuneration paid/payable to the Managing Directors and to the non-executive Directors, for the financial year ended 31st March, 2018, are given in Table 4 and Table 5 respectively of the annexure to this Report.
Corporate Social Responsibility Committee
The Corporate Social Responsibility (CSR) Committee is constituted in accordance with the requirements of the Companies Act, 2013 and the Rules thereunder. The Committee consists of three members, two of them being Independent Directors. Mr. S Sandilya, Independent Director is the Chairman of the Committee. The other Members are Ms. Madhu Dubhashi, Independent Director and Mr. L Ramkumar, Executive.
Under the terms of reference, the scope of the CSR Committee is (a) to formulate and recommend to the Board, a Corporate Social Responsibility Policy indicating the activities to be undertaken by the Company as specified under Schedule VII of the Companies Act, 2013; (b) to recommend the amount of expenditure to be incurred on the activities; and (c) to monitor the Corporate Social Responsibility Policy of the Company from time to time.
The Committee met once during the year ended 31st March, 2018. The composition of the Corporate Social Responsibility Committee and the attendance of each member at the meeting of the Committee are given in Table 7 of the annexure to this Report.
Risk Management Committee
The role of the Risk Management Committee, in brief, is to review the Risk Management Policy developed by

38 Annual Report 2017-18
Tube Investments of India Limited(Formerly known as TI Financial Holdings Limited)
the Management, Risk Management framework and its implementation thereby ensuring that an effective risk management system is in place.
The Risk Management Committee regularly monitors and evaluates the key risks of the Company and apprises the management of such risks for effective mitigation. The Committee provides support to the Board in the discharge of the Board’s overall responsibility in overseeing the risk management process. The Committee consists of three members, two of them being Independent Directors. Mr. Pradeep V Bhide, an Independent Director, is the Chairman of the Risk Management Committee. The other Members are Mr. Hemant M Nerurkar, Independent Director and Mr. L Ramkumar, Executive.
The Chairman and the Heads of Strategic Business Units are invitees to the meetings of the Committee. The Committee met two times during the year ended 31st March, 2018. The composition of the Committee and attendance of its members at the meeting are given in Table 8 of the annexure to this Report.
A statement on some of the significant risks associated with the Company’s businesses and the mitigation plans thereof are furnished as part of the Board’s Report.
Performance Evaluation
The annual performance evaluation was carried out pursuant to the provisions of the Companies Act, 2013 and the SEBI Listing Regulations. As part of the performance evaluation process, an evaluation questionnaire based on the criteria together with supporting documents was circulated to all the Board members, in advance. The process inter alia considers the individual Director’s understanding of the Company’s business, knowledge and experience, familiarity with Company’s policies, values & beliefs and Code of Conduct, involvement and participation, effectiveness as a team player, etc. The Directors evaluated themselves, the Chairman, the Managing Director, other Board members, the Board as well as the functioning of the Board Committees viz., Audit, Nomination & Remuneration, Risk Management, Corporate Social Responsibility and Stakeholders Relationship Committees on the basis of well-defined evaluation parameters as set out in the questionnaire. The duly filled in questionnaires were received back from the Chairman and all the other Directors.
To take the evaluation exercise forward, all the Independent Directors of the Company met on 22nd March, 2018, without the attendance of the non-Independent Directors and members of the management to discuss inter alia the matters specified under Schedule IV of the Companies Act, 2013 and Regulation 25(4) of the SEBI Listing Regulations.
The Board reviewed the process of evaluation of the Board of Directors and its Committees including the Chairman, the Managing Director and the individual Directors.
Subsidiary Companies
The Company does not have any ‘material non-listed Indian subsidiary company’ in terms of the SEBI Listing Regulations as at the end of 31st March, 2018.
Financiere C10 SAS is a wholly-owned subsidiary of the Company in France. Sedis SAS, France, Sedis GmbH, Germany and Sedis Co Ltd, UK are the subsidiaries of Financiere C10 SAS.
TI Tsubamex Private Limited (TTPL) is a subsidiary of the Company. The Company holds 78.3% of the share capital of TTPL.
Great Cycles (Private) Limited (GCPL) is a subsidiary of the Company. The Company holds 80% of the share capital of GCPL.
Creative Cycles (Private) Limited (CCPL) is a subsidiary of the Company. The Company holds 80% of the share capital of CCPL.
The Board of Directors is apprised of the Business Plan and the financial performance of the unlisted subsidiary companies.
The Company has formulated a policy for determining ‘material’ subsidiaries and the same is available on the Company’s website at the following link, http://www.tiindia.com/article/values/475
Related Party Transactions
During the financial year under review, all the transactions entered into with the Related Parties, as defined under the Companies Act, 2013 and the SEBI Listing Regulations were in the ordinary course of business and on arms’ length pricing basis only. Accordingly, these transactions do not attract the provision of Section 188 or disclosure in Form AOC-2 in terms of Section 134(h) of the Companies Act, 2013.
Further, there were no materially significant transactions with related parties which were in conflict with the interest of the Company.
The policy for related party transactions approved by the Board had been uploaded on the Company’s website at the following link, http://www.tiindia.com/article/values/476
Dissemination of Information
The Company is conscious of the importance of timely and proper dissemination of adequate information. A press release is given along with the publication of the quarterly/annual results, explaining the business environment and performance. This is being provided to enable the investing

Annual Report 2017-18 39
Corporate Overview Management Reports Financial Statements
community to understand the financial results better and in a more meaningful manner. The press release includes non-financial aspects such as development of new products, change in market share, price movement of raw materials and in general, the business conditions. The quarterly and audited annual financial results are normally published in ‘Business Standard’ and ‘The New Indian Express’ (English) and in ‘Dinamani’ (Tamil). Press releases are given to all the important dailies. The financial results, press releases, shareholding pattern and the presentations made to Analysts and Brokers are posted on the Company’s website. The Company’s commitment to transparency is reflected in the information-rich Annual Report, investors’ meets, periodic press releases and continuous updating of its website.
Investors’ Service
The Company promptly attends to investors’ queries/grievances. In order to provide timely services, the power to approve transfer of shares has been delegated by the Board to the Shares and Debentures Committee. The Board has also authorised the Chairman/Managing Director/Chief Financial Officer/Secretary to approve transfers/ transmissions. Share transfer requests are processed within 15 days from the date of receipt. Karvy Computershare Private Limited, Hyderabad is the Company’s share transfer agent and depository registrar.
The Stakeholders Relationship Committee specifically focuses on investor service levels. This Committee has prescribed norms for attending to the investors’ services and the Committee periodically reviews the service standard achieved by the Company and its Registrar and Transfer Agent as against the prescribed norms.
The terms of reference of the Committee are in accordance with the requirement of Section 178 of the Companies Act, 2013 and the SEBI Listing Regulations and provide for the resolution of grievances of security holders of the Company including complaints, if any, relating to transfer of shares, non-receipt of balance sheet and non-receipt of declared dividends etc.
The Committee met once during the year ended 31st March, 2018. Mr. M M Murugappan, non-executive Director, is the Chairman of the Committee and Mr. L Ramkumar, Executive is the other member. The composition of the Committee and attendance of its members at the meeting are given in Table 6 of the annexure to this Report.
No investor complaint was received during the financial year ended 31st March, 2018 and hence, no complaints were pending as at 31st March, 2018.
In order to expedite the redressal of complaints, if any, investors are requested to register their complaints and also to take follow up action, as necessary, to the exclusive e-mail
id i.e. [email protected] Mr. S Suresh, Company Secretary is the Compliance Officer.
Statutory Compliance
The Company attaches the highest importance to compliance with statutes. Every function/department of the business is aware of the requirements of various statutes relevant to them. The Company has systems in place to remain updated with the changes in statutes and the means of compliance. An affirmation regarding compliance with the statutes by the heads of businesses and functions is placed before the Board on a quarterly basis for its review.
Internal Controls
The Company is conscious of the importance of the internal processes and controls. The Company has a robust business planning & review mechanism and has adequate internal control systems commensurate with the nature of its business, size and geographical spread. These systems are regularly reviewed and improved upon.
The Chief Financial Officer and the Managing Director have certified to the Board inter alia on the accuracy of financial statements and adequacy of internal controls for the financial reporting purpose as required under the SEBI Listing Regulations, for the year ended 31st March, 2018.
Whistle Blower Policy/Vigil Mechanism
The Company has established a vigil mechanism (Whistle Blower Policy) for the employees and the Directors as an avenue to voice concerns relating to unethical behaviour, actual or suspected fraud or violation of the Company’s Code of Conduct. The said mechanism/Policy is in accordance with the requirements of Section 177 of the Companies Act, 2013 and the SEBI Listing Regulations. The Ombudsperson appointed by the Board deals with the complaints received and ensures appropriate action. The mechanism also provides for adequate safeguards against victimisation of persons using the mechanism and provides direct access to the chairperson of the Audit Committee in appropriate or exceptional cases. No person was denied access to the Audit Committee.
Compliance of Corporate Governance Norms
The Company has complied with all the mandatory requirements of corporate governance norms during the financial year ended 31st March, 2018 upon the Company becoming a listed Company effective 2nd November, 2017. Quarterly financial results of the Company are published in leading newspapers, uploaded on the Company’s website and any major developments are covered in the press releases issued by the Company and also posted on its website. Financial results for the half-year ended

40 Annual Report 2017-18
Tube Investments of India Limited(Formerly known as TI Financial Holdings Limited)
Declaration on Code of Conduct
To
The Members of Tube Investments of India Limited
This is to confirm that the Board has laid down a Code of Conduct for all Board members and Senior Management of the Company. The Code of Conduct has also been posted on the website of the Company.
It is further confirmed that all Directors and Senior Management personnel of the Company have affirmed compliance with the Code of Conduct of the Company for the year ended 31st March, 2018, as envisaged under Regulation 34(3) of the SEBI (Listing Obligations and Disclosure Requirements) Regulations, 2015.
On behalf of the BoardChennai L Ramkumar7th May, 2018 Managing Director
30th September, 2017 were not separately sent by post to the shareholders.
The Company is also in compliance with the corporate governance requirements specified under Regulations 17 to 27 and Regulation 46(2)(b) to (i) of the SEBI Listing Regulations.
In line with its stated policy of being committed to the principles and practices of good corporate governance, the Company is in compliance with most of the requirements forming part of the discretionary requirements under Schedule II, Part E of SEBI Listing Regulations. As regards the remaining discretionary requirements, the Company after careful evaluation would strive to implement the same progressively, as appropriate.
The Board of Directors has laid down a Code of Conduct for all the Board members and the senior management of the Company. The Directors and the Senior Management of the Company have furnished their affirmation of compliance with the Code during the financial year, 2017-18. The Code of Conduct has been posted on the website of the Company at the following link, http://www.tiindia.com/article/values/33. A declaration of affirmation in this regard certified by the Managing Director is annexed to this Report.
The key Policies framed in accordance with the requirements of the Companies Act, 2013 and the SEBI Listing Regulations are posted on the website of the Company at the following links, http://www.tiindia.com/article/values/34; http://www.tiindia.com/article/values/476; http://www.tiindia.com/article/values/493; http://www.tiindia.com/article/values/527; http://www.tiindia.com/article/values/538; http://www.tiindia.com/article/values/600; http://www.tiindia.com/article/values/601; http://www.tiindia.com/article/values/667 etc.,
Other Disclosures
A Management Discussion and Analysis Report highlighting the performance of individual businesses forms part of the Board’s Report.
A write up on the risks associated with the business and mitigation plans therefor also forms part of the Board’s Report.
Related party transactions during the year have been disclosed as a part of the financial statements as required under the relevant Ind AS issued by the Institute of Chartered Accountants of India.
There have been no instances of non-compliance by the Company or have any penalty or strictures been imposed on the Company by the Stock Exchanges or the Securities and Exchange Board of India or by any statutory authority on any matter related to the capital markets since listing of the Company’s equity shares on the Stock Exchanges effective 2nd November, 2017.
General Shareholder Information
A separate section has been annexed to the Annual Report furnishing various details viz., the previous Annual General Meeting, time and venue thereof, share price movement, distribution of shareholding, location of factories, means of communication etc., for shareholders’ reference.
On behalf of the BoardChennai M M Murugappan7th May, 2018 Chairman

Annual Report 2017-18 41
Corporate Overview Management Reports Financial Statements
Annexure to the Corporate Governance ReportNote: This Annexure covers details of the Board/Board Committee Meetings of TII held after the reconstitution of the Board
of Directors post coming into effect of the Scheme of Arrangement (Demerger) on 1st August, 2017.
(A) Board Meeting Dates and Attendance
Post-implementation of the Scheme of Arrangement (demerger) with effect from 1st August, 2017, the reconstituted Board of Directors of the Company met 4 times during the financial year 2017-18. The dates of the Board meetings were 9th August, 2017, 28th October, 2017, 12th February, 2018 and 23rd March, 2018.
The attendance of each Director at the meetings, the last Annual General Meeting and number of other Directorships/Committee memberships held by them, post reconstitution of the Board consequent to the demerger, as on 31st March, 2018 are as follows:
TABLE 1
Sl. No.
Name of Director
Board meetings
attended (no. of meetings
held)
Number of Directorships(a) - including the Company (out
of which as Chairman)
Number of committee
memberships(b) - including the
Company (out of which as Chairman)
Attendance at last AGM
No. of shares
held as on 31st March,
2018
1 Mr. M M Murugappan, Chairman
4(4) 10(7) 8(5) Present 18,90,385
2 Mr. L Ramkumar,Managing Director
4(4) 4(1) 2(1) Present 1,25,650
3Mr. Vellayan Subbiah*, Managing Director (Designate)
2(3) 4 1 Present 4,30,250
4 Mr. Pradeep V Bhide 4(4) 7 9(1) Present -
5 Mr. S Sandilya 2(4) 6(2) 7(4) Present -
6 Ms. Madhu Dubhashi 4(4) 7 6(4) Present -
7 Mr. Hemant M Nerurkar 4(4) 9(3) 6(3) Present -
8 Mr. Ramesh K B Menon# 2(2) 5 3Not
Applicable-
(a) Excludes foreign companies, private limited companies (not being subsidiary or holding company of a public company), alternate Directorship and companies registered under Section 8 of the Companies Act, 2013.
(b) Includes only membership in Audit and Stakeholders’ Relationship Committees. * Mr. Vellayan Subbiah was appointed as Managing Director (Designate) with effect from 19th August, 2017. # Mr. Ramesh K B Menon was appointed as Additional Director with effect from 16th November, 2017.
(B) Composition of Audit Committee and Attendance
The Committee met four times during the year ended 31st March, 2018. The dates of the Committee’s meetings were 9th August, 2017, 28th October, 2017, 12th February, 2018 and 23rd March, 2018.
The composition of the Audit Committee and the attendance of each member at these meetings are as follows:
TABLE 2
Name of the Member Number of meetings attended (Number of meetings held)
Mr. S Sandilya, Chairman 2(4)
Mr. Pradeep V Bhide 4(4)
Mr. Hemant M Nerurkar 4(4)

42 Annual Report 2017-18
Tube Investments of India Limited(Formerly known as TI Financial Holdings Limited)
(C) Composition of Nomination & Remuneration Committee and Attendance
The Committee met three times during the year ended 31st March, 2018. The dates of the Committee’s meetings were 9th August, 2017, 6th November, 2017 and 12th February, 2018. The composition of the Nomination & Remuneration Committee and the attendance of each member at these meetings are as follows:
TABLE 3
Name of the Member Number of meetings attended (Number of meetings held)
Mr. Hemant N Nerurkar, Chairman 3(3)
Mr. M M Murugappan 3(3)
Mr. S Sandilya 2(3)
(D) Remuneration of Managing Directors
The details of remuneration paid/provision made for payment to the Managing Directors are as follows:
TABLE 4 (Amount in `)
Name Salary Incentive(a) AllowancePerquisites &
Contributions(b) Total
Mr. L Ramkumar, Managing Director
1,49,56,875 1,08,23,309 1,30,93,295 57,98,900 4,46,72,379
Mr. Vellayan Subbiah, Managing Director (Designate)(c) 82,05,621 81,81,185 71,10,331 1,22,88,908 3,57,86,045
(a) Provisional and subject to determination by the Nomination & Remuneration Committee and the same will be paid after the adoption of accounts by the shareholders at the Annual General Meeting.
(b) Managing Directors’ remuneration excludes provision for Gratuity and compensated absences since the amount cannot be ascertained individually.
(c) Appointed with effect from 19th August, 2017.
The details of Options granted under ESOP 2017 of the Company to Mr. L Ramkumar, Managing Director is furnished below:
ParticularsESOP 2017
No. of SharesOptions granted 69,640Options vested 69,640Options cancelled -Options lapsed -Options exercised 69,640
(26th April, 2018)Options outstanding -Exercise Price ` 187.29/- being the market price prior to the date of grant
The Managing Director (Designate) is not eligible for grant of any stock options. The Managing Directors are subject to all other service conditions as applicable to other employees of the Company.
They are not entitled for any severance fee or other compensation for any loss of office.

Annual Report 2017-18 43
Corporate Overview Management Reports Financial Statements
(E) Remuneration of Non-Executive Directors
The details of commission provided for/sitting fees paid to non-executive Directors for the year ended 31st March, 2018 are as follows:
TABLE 5 (Amount in `)
Name of the Director Commission * Sitting fees Total
Mr. M M Murugappan , Chairman 1,00,00,000 1,75,000 1,01,75,000
Mr. Hemant M Nerurkar 7,50,000 2,60,000 10,10,000
Ms. Madhu Dubhashi 7,50,000 1,15,000 8,65,000
Mr. Pradeep V Bhide 25,00,000 2,30,000 27,30,000
Mr. S Sandilya 7,50,000 1,45,000 8,95,000
Mr. Ramesh K B Menon(a) 2,79,452 50,000 3,29,452
* Provisional and subject to determination by the Board. Commission will be paid after the adoption of accounts by the shareholders at the Annual General Meeting.
(a) Commission calculated on pro rata basis - from 16th November, 2017
(F) Composition of Stakeholders Relationship Committee and Attendance
The Committee met on 20th February, 2018 during the year ended 31st March, 2018. The composition of the Stakeholders Relationship Committee and the attendance of each member at the above meeting are as follows:
TABLE 6
Name of the Member Number of meetings attended (Number of meetings held)
Mr. M M Murugappan, Chairman 1(1)
Mr. L Ramkumar 1(1)
(G) Composition of Corporate Social Responsibility Committee and Attendance
The Committee met on 9th August, 2017 during the year ended 31st March, 2018. The composition of the Corporate Social Responsibility Committee and the attendance of each member at the above meeting are as follows:
TABLE 7
Name of the Member Number of meetings attended (Number of meetings held)
Mr. S Sandilya, Chairman 1(1)
Ms. Madhu Dubhashi 1(1)
Mr. L Ramkumar 1(1)
(H) Composition of Risk Management Committee and Attendance
The Committee met two times during the year ended 31st March, 2018. The dates of the Committee’s meetings were 6th November, 2017 and 13th February, 2018. The composition of the Risk Management Committee and the attendance of each member at this meeting are as follows:
TABLE 8
Name of the Member Number of meetings attended (Number of meetings held)
Mr. Pradeep V Bhide, Chairman 2(2)
Mr. Hemant M Nerurkar 1(2)
Mr. L Ramkumar 2(2)
On behalf of the Board
Chennai M M Murugappan7th May, 2018 Chairman

44 Annual Report 2017-18
Tube Investments of India Limited(Formerly known as TI Financial Holdings Limited)
Independent Auditor's Report on compliance with the conditions of Corporate Governance as per provisions of Chapter IV of Securities and Exchange Board of India (Listing Obligations and Disclosure Requirements) Regulations, 2015
To the Members ofTube Investments of lndia Limited (formerly known as TI Financial Holdings Limited),Dare House No. 234, N.S.C Bose Road, Chennai - 600 001, Tamil Nadu.
I. The Corporate Governance Report prepared by Tube Investments of India Limited (formerly known as TI Financial Holdings Limited) (hereinafter the "Company"), contains details as required by the provisions of Chapter IV of Securities and Exchange Board of India (Listing Obligations and Disclosure Requirements) Regulations, 2015, as amended ("the Listing Regulations") with respect to Corporate Governance for the year ended March 31, 2018. This report is required by the Company for annual submission to the Stock exchange and to be sent to the Shareholders of the Company.
Management's Responsibility
2. The preparation of the Corporate Governance Report is the responsibility of the Management of the Company including the preparation and maintenance of all relevant supporting records and documents. This responsibility also includes the design, implementation and maintenance of internal control relevant to the preparation and presentation of the Corporate Governance Report.
3. The Management along with the Board of Directors are also responsible for ensuring that the Company complies with the conditions of Corporate Governance as stipulated in the Listing Regulations, issued by the Securities and Exchange Board of India.
Auditor's Responsibility
4. Pursuant to the requirements of the Listing Regulations, our responsibility is to express a reasonable assurance in the form of an opinion whether the Company has complied with the specific requirements of the Listing Regulations referred to in paragraph 3 above.
5. We conducted our examination of the Corporate Governance Report in accordance with the Guidance Note on Reports or Certificates for Special Purposes and the Guidance Note on Certification of Corporate Governance, both issued by the Institute of Chartered Accountants of India ("ICAI"). The Guidance Note on Reports or Certificates for Special Purposes requires that we comply with the ethical requirements of the Code of Ethics issued by the Institute of Chartered Accountants of India.
6. We have complied with the relevant applicable requirements of the Standard on Quality Control (SQC) 1, Quality Control for Firms that Perform Audits and Reviews of Historical Financial Information, and Other Assurance and Related Services Engagements.
7. The procedures selected depend on the auditor's judgement, including the assessment of the risks associated in compliance of the Corporate Governance Report with the applicable criteria. Summary of key procedures performed include:
i. Reading and understanding of the information prepared by the Company and included in its Corporate Governance Report;
ii. Obtained and verified that the composition of the Board of Directors w.r.t executive and non-executive directors has been met throughout the reporting period;
iii. Obtained and read the Directors Register as on March 31, 2018 and verified that at least one women director was on the Board during the year;
iv. Obtained and read the minutes of the following committee meetings held from April 01, 2017 to March 31, 2018:
(a) Board of Directors meeting;
(b) Audit committee;
(c) Annual General meeting;
(d) Nomination and remuneration committee;
(e) Stakeholders Relationship Committee;
(f) Independent directors meeting; and
(g) Risk management committee.
Annual Report 2017-18 45
Corporate Overview Management Reports Financial Statements
v. Obtained necessary representations and declarations from directors of the Company including the independent directors ; and
vi. Performed necessary inquiries with the management and also obtained necessary specific representations from management.
The above-mentioned procedures include examining evidence supporting the particulars in the Corporate Governance Report on a test basis. Further, our scope of work under this report did not involve us performing audit test for the purposes of expressing an opinion on the fairness or accuracy of any of the financial information or the financial statements of the Company taken as a whole.
Opinion
8. Based on the procedures performed by us as referred in paragraph 7 above, and according. to the in formation and explanations given to us, we are of the opinion at the Company has complied with the conditions of Corporate Governance as stipulated in the Listing Regulations, as applicable for the year ended March 31 2018, referred to in paragraph 2 above.
Other matters and Restriction on Use
9. This report is neither an assurance as to the future viability of the Company nor the efficiency or effectiveness with which the management has conducted the affairs of the Company.
10. This report is addressed to and provided to the members of the Company solely for the purpose of enabling it to comply with its obligations under the Listing Regulations with reference to compliance with the relevant regulations of Corporate Governance and should not be used by any other person or for any other purpose. Accordingly, we do not accept or assume any liability or any duty of care or for any other purpose or to any other party to whom it is shown or into whose liands it may come without our prior consent in writing. We have no responsibility to update this report for events and circumstances occurring after the date of this report.
For S.R. Batliboi & Associates LLP Chartered Accountants ICAI Firm Registration Number: 10l049W/E300004
per Subramaman SureshPlace of Signature: Chennai PartnerDate: May 07, 2018 Membership Number : 083673

46 Annual Report 2017-18
Tube Investments of India Limited(Formerly known as TI Financial Holdings Limited)
General Shareholder InformationCompany Registration
The Company is registered in the State of Tamil Nadu. The Corporate Identity Number (CIN) of the Company is L35100TN2008PLC069496.
Registered Office
‘Dare House’, 234 NSC Bose Road, Chennai 600 001
Annual General Meeting
Day : Monday
Date : 13th August, 2018
Time : 3.30 P.M.
Venue : T.T.K. Auditorium, The Music Academy, 168 (Old no.306), T.T.K. Road, Chennai 600 014
Tentative Calendar for 2018-19
The financial year of the Company is the period ending on 31st day of March every year. The tentative calendar for Board meetings for approving the quarterly financial results is given below:
Results for the first quarter ended 30th June, 2018
:13th August, 2018
Results for the second quarter/half year ending 30th September, 2018
:2nd November, 2018
Results for the third quarter ending 31st December, 2018
:January/ February, 2019
Results for the fourth quarter ending 31st March 2019/Annual Results for the financial year 2018-19
: April/May, 2019
Book Closure for Dividend
Wednesday, 1st August, 2018 to Monday, 13th August, 2018 (both days inclusive).
Dividend
The Board of Directors has recommended the payment of a final dividend of `0.50 per Equity Share. The dividend on Equity Shares will be paid to those Members, whose names appear in the Register of Members as on Monday, 13th August, 2018 and the same will be paid on or after 17th August, 2018. During the financial year, in February, 2018, the Company paid an interim dividend of `1.25 per equity share.
In respect of shares held in electronic form, dividend will be paid on the basis of beneficial ownership as per details furnished by the depositories for the purpose.
Unclaimed Dividend
The details of dividend paid by the Company and the respective due dates of transfer of the unclaimed/ unencashed dividend to the Investor Education & Protection Fund (‘IE&P Fund’) of the Central Government are as below:
Financial year to which dividend
relates
Date of declaration
Due date of transfer to IE&P Fund
2016-17 06.11.2017 12.12.2024
2017-18 - Interim 12.02.2018 20.03.2025
As provided under the Companies Act, 1956/2013, dividends remaining unclaimed for a period of seven years shall be transferred by the Company to the IE&P Fund. In the interest of investors, the Company proposes to send reminders to the concerned investors requesting them to claim their dividend.
Instructions to Shareholders
(a) Shareholders holding shares in physical form
Requests for change of address must be sent to the Company’s Registrar & Transfer Agent viz., M/s. Karvy Computershare Private Ltd (“RTA”), not later than 1st August, 2018 to enable them to forward the dividend warrants to the latest address of Members. Members are also advised to intimate the RTA the details of their bank account to enable incorporation of the same on dividend warrants. This would help prevent any fraudulent encashment of dividend warrants.
(b) Shareholders holding shares in demat form
The Company uses National Automated Clearing House (NACH) facility for payment of dividends directly to the bank accounts of shareholders. The shareholders may use the facility by providing the bank account number to the depository participant/RTA, as may be relevant, to enable the Company to effect the dividend payment through the NACH mode. If there is any change in bank account details, Shareholders are requested to advise their Depository Participant(s)/Company’s RTA, as the case may be, immediately about the change.
Further, if in case of any change in address, Shareholders are requested to advise their Depository Participant(s) immediately about their new address.

Annual Report 2017-18 47
Corporate Overview Management Reports Financial Statements
Name and address of Stock Exchanges
Name of Stock Exchanges Address
National Stock Exchange of India Ltd.
: Exchange Plaza, 5th Floor, Plot No.C/1, G Block, Bandra-Kurla Complex, Bandra (East), Mumbai - 400 051.
BSE Ltd. : Floor 25, Phiroze Jeejeebhoy Towers, Dalal Street, Mumbai - 400 001.
Listing fee for the year ended 31st March, 2018 has been paid to the above Stock Exchanges in time.
Listing on Stock Exchanges - Equity Shares
Name of Stock Exchanges Stock Code
National Stock Exchange of India Ltd. : TIINDIA
BSE Ltd. : 540762
Non-Convertible Debentures
Listed on Wholesale Debt Segment (WDM) of National Stock Exchange of India Ltd.
Market Price Data and Comparison
Monthly high and low price of the equity shares of the Company from 2nd November, 2017 (date of commencement of trading) to 31st March, 2018 are as follows:
The equity shares of the Company were listed on 2nd November, 2017. The Monthly high and low price of the equity shares of the Company from November, 2017 to March, 2018 are as follows:
National Stock Exchange of India Ltd. BSE Ltd.
MonthHigh
`Low
`High
`Low
`
Nov. 2017 308.90 241.00 307.55 233.00
Dec. 2017 283.35 215.70 281.00 247.00
Jan. 2018 304.70 259.50 304.00 259.90
Feb. 2018 295.00 245.00 289.80 247.00
Mar. 2018 272.50 220.20 275.00 222.55
Registrar and Share Transfer Agent
Karvy Computershare Private LimitedKarvy Selenium Tower B, Plot 31-32, GachibowliFinancial District, NanakramgudaHyderabad - 500 032e-mail : [email protected] : (040) – 67162222Fax: (040) - 23420814Toll Free: 1800-345-4001
Debenture Trustees
IDBI Trusteeship Services LtdAsian Building, Ground Floor17 R Kamani MargBallard EstateMumbai - 400001e-mail : [email protected] : 022 - 66311771Fax: 022 - 66311776
0
50
100
150
200
250
300
9600
9800
10000
10200
10400
10600
10800
11000
11200
Nov-17 Dec-17 Jan-18 Feb-18 Mar-18
TI S
hare
Pric
e (in
`)
NS
E N
ifty
Nov-17 Dec-17 Jan-18 Feb-18 Mar-18NSE Nifty 10227 10531 11028 10493 10114TI Share Price 259 270 267 261 222
TI Share Price Movement Vs. NSE Nifty

48 Annual Report 2017-18
Tube Investments of India Limited(Formerly known as TI Financial Holdings Limited)
Nomination Facility
The Shareholders holding shares in physical form may avail of the nomination facility under Section 72 of the Companies Act, 2013. The nomination form (Form SH.13), along with instructions, will be provided to the Members on request. In case the Members wish to avail of this facility, they are requested to write to the Company’s RTA viz., M/s. Karvy Computershare Pvt Ltd.
Dematerialisation of Shares
The Equity shares of the Company are compulsorily traded in dematerialised form. The code number allotted by the National Securities Depository Ltd (NSDL) and Central Depository Services (India) Ltd (CDSL) to the Company is ISIN INE974X01010.
GDR Details
As at 31st March, 2018, 42,30,630 GDRs were outstanding representing an equal number of underlying Equity Shares. The aforesaid GDRs are not listed in any Stock Exchange.
Commodity Price Risk/Foreign Exchange Risk and Hedging Activities
The Company is guided by its foreign exchange (‘forex’) policy to manage its forex exposure and its attendant risks, which arise through trade transactions, namely, exports and imports, import of capital items besides short-term and long-term foreign currency borrowings. Foreign currency trade exposures are monitored Strategic Business Unit (SBU)-wise and currency-wise. The risks are managed after netting the exports and imports on monthly buckets for each currency. For capex imports, forward contracts are taken on the date of opening of the letter of credit. In respect of foreign currency borrowings, while the long-term borrowings are hedged for interest as well as for the exchange at the time of drawdown, the short-term borrowings are hedged for principal portion at the time of drawdown. Commodity Price Risk and hedging thereof are not applicable to the Company.
Share Transfer and Investor Service System
The Board has authorised Chairman/Managing Director/Chief Financial Officer/Company Secretary to approve transfers/transmissions in addition to the Committee of the Board constituted for the purpose.
Shareholding Pattern as on 31st March, 2018
Category No. of shares held % of shareholdingA Promoter & Promoter Group 9,15,07,599 48.79B Non-Promoter Holding
1 Institutional Investorsa) Mutual Funds and UTI 2,49,75,117 13.32b) Banks, Financial Institutions and Insurance Companies 38,51,387 2.05c) Foreign Institutional Investors 2,09,98,896 11.20
2 Othersa) Private Corporate Bodies 1,17,49,693 6.27b) Indian Public 2,83,77,094 15.13c) NRI 11,42,272 0.61
C Non-Promoter & Non-Publica) Bank of New York Mellon (Depository for GDR holders) 42,30,630 2.26b) Employees Welfare Trust 7,03,680 0.37Grand Total 18,75,36,368 100.00
Distribution of Shareholding as on 31st March, 2018
Category No. of holders % to Total No. of shares % to Total1 - 5000 24,072 96.57 1,04,17,137 5.55
5001 - 10000 327 1.31 24,07,494 1.2810001 - 20000 189 0.76 26,63,142 1.4220001 - 30000 77 0.31 18,68,831 1.0030001 - 40000 46 0.18 16,48,444 0.8840001 - 50000 17 0.07 7,79,471 0.4250001 - 100000 61 0.24 42,16,020 2.25 100001 & Above 139 0.56 16,35,35,829 87.20
Total 24,928 100.00 18,75,36,368 100.00

Annual Report 2017-18 49
Corporate Overview Management Reports Financial Statements
Means of Communication
The quarterly/annual results are being/will be published in the leading national English newspapers (“The New Indian Express” and “Business Standard”) and in one vernacular (Tamil) newspaper (“Dinamani”). The quarterly/annual results are also available on the Company’s website, www.tiindia.com. The Company’s website will also display official press releases, shareholding pattern, compliance report on corporate governance and presentations made to analysts and brokers.
Details of Special Resolutions passed during the last three Annual General Meetings
Date of AGMWhether any Special
Resolution was passedParticulars
30.09.2015 No Not applicable
30.09.2016 No Not applicable
06.11.2017 YesIssue of Secured Redeemable Non-Convertible Debentures on private placement basis for a maximum sum of `400 crores.
The Shareholders approved the said Special Resolution with requisite majority.
Resolution passed by Postal Ballot
During the year under review, no Special Resolution has been passed through the exercise of postal ballot.
Details of Special Resolution proposed to be conducted through Postal Ballot
No special resolution is proposed to be conducted through postal ballot at the AGM to be held on 13th August, 2018.
General Body Meeting
The date, time and venue of the last three Annual General Meetings are given below:
Year Date Time Venue
2014-15 30.09.2015 10.00 A.M.Registered Office “Dare House” 234 N S C Bose Road,Chennai - 600 001.
2015-16 30.09.2016 10.00 A.M. Same as above
2016-17 06.11.2017 3.30 P.M.T.T.K. Auditorium, The Music Academy,163 (Old No. 306) T.T.K. Road, Chennai 600 014
Unclaimed Shares
Consequent to the Scheme of Arrangement (Demerger) approved by the National Company Law Tribunal vide its Order dated 17th July, 2017, the Company had allotted during 2017-18, 1 fully paid up equity share for every 1 fully paid up equity share held in the erstwhile Demerged Company. The said allotment included 17,86,406 equity shares allotted against shares lying in the Unclaimed Suspense Account of the Demerged Company maintained in compliance with the Listing Agreement. For administrative convenience and ease of processing of claims, the Company opened a separate TII Demerger Unclaimed Share Suspense Account to hold the aforementioned 17,86,406 shares. Details of the unclaimed shares lying in the Company’s said Account are given below:
Sl. No.
ParticularsNo. of
ShareholdersNo. of Shares
1 Aggregate number of Shareholders and the outstanding shares in the TII DemergerUnclaimed Share Suspense Account ("Account") lying as on 01.09.2017 [Date of Allotment]
1988 17,86,406
2 Number of Shareholders who approached the Company for transfer of their shares from Account during the year [from 01.09.2017 to 31.03.2018]
32 35,595
3 Number of Shareholders to whom shares were transferred Account during the year [from 01.09.2017 to 31.03.2018]
32 35,595
4 Aggregate number of Shareholders and the outstanding shares lying in the Account as on 31.03.2018.
1956 17,50,811
The voting rights on the outstanding shares in the TII Demerger Unclaimed Share Suspense Account as on 31st March, 2018 shall remain frozen till the rightful owner of such shares, claims the shares. On receipt of the claim, the Company will, after verification, arrange to credit the Equity Shares to the demat account of the Shareholder concerned or deliver the Share Certificate to the Shareholder in physical mode after re-materialisation.
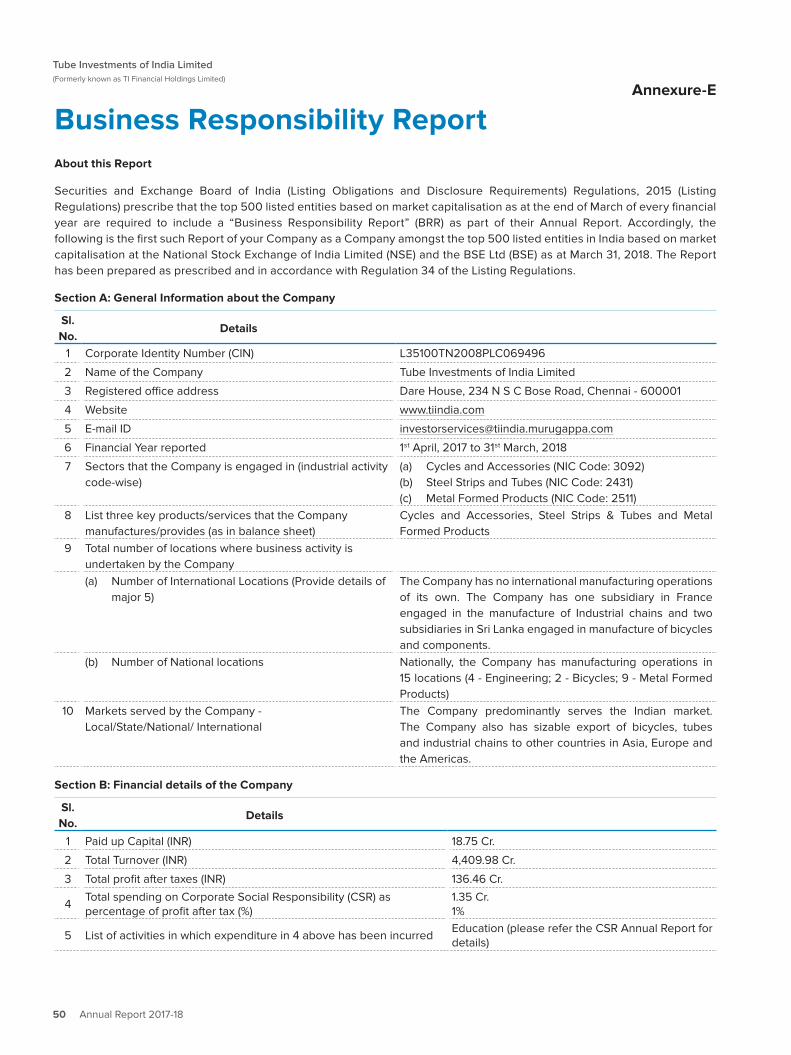
50 Annual Report 2017-18
Tube Investments of India Limited(Formerly known as TI Financial Holdings Limited)
About this Report
Securities and Exchange Board of India (Listing Obligations and Disclosure Requirements) Regulations, 2015 (Listing Regulations) prescribe that the top 500 listed entities based on market capitalisation as at the end of March of every financial year are required to include a “Business Responsibility Report” (BRR) as part of their Annual Report. Accordingly, the following is the first such Report of your Company as a Company amongst the top 500 listed entities in India based on market capitalisation at the National Stock Exchange of India Limited (NSE) and the BSE Ltd (BSE) as at March 31, 2018. The Report has been prepared as prescribed and in accordance with Regulation 34 of the Listing Regulations.
Section A: General Information about the Company
Sl.No.
Details
1 Corporate Identity Number (CIN) L35100TN2008PLC069496
2 Name of the Company Tube Investments of India Limited
3 Registered office address Dare House, 234 N S C Bose Road, Chennai - 600001
4 Website www.tiindia.com
5 E-mail ID [email protected]
6 Financial Year reported 1st April, 2017 to 31st March, 2018
7 Sectors that the Company is engaged in (industrial activity code-wise)
(a) Cycles and Accessories (NIC Code: 3092)(b) Steel Strips and Tubes (NIC Code: 2431)(c) Metal Formed Products (NIC Code: 2511)
8 List three key products/services that the Company manufactures/provides (as in balance sheet)
Cycles and Accessories, Steel Strips & Tubes and Metal Formed Products
9 Total number of locations where business activity is undertaken by the Company(a) Number of International Locations (Provide details of
major 5) The Company has no international manufacturing operations of its own. The Company has one subsidiary in France engaged in the manufacture of Industrial chains and two subsidiaries in Sri Lanka engaged in manufacture of bicycles and components.
(b) Number of National locations Nationally, the Company has manufacturing operations in 15 locations (4 - Engineering; 2 - Bicycles; 9 - Metal Formed Products)
10 Markets served by the Company -Local/State/National/ International
The Company predominantly serves the Indian market. The Company also has sizable export of bicycles, tubes and industrial chains to other countries in Asia, Europe and the Americas.
Section B: Financial details of the Company
Sl.No.
Details
1 Paid up Capital (INR) 18.75 Cr.
2 Total Turnover (INR) 4,409.98 Cr.
3 Total profit after taxes (INR) 136.46 Cr.
4Total spending on Corporate Social Responsibility (CSR) as percentage of profit after tax (%)
1.35 Cr.1%
5 List of activities in which expenditure in 4 above has been incurredEducation (please refer the CSR Annual Report for details)
Business Responsibility ReportAnnexure-E

Annual Report 2017-18 51
Corporate Overview Management Reports Financial Statements
Section C: Other details
1. Does the Company have any Subsidiary company/companies?
Yes. The Company has 4 direct subsidiaries and 3 step down subsidiaries. Of the above, 1 subsidiary is located in India and listed on the Stock Exchanges, while the rest are located abroad.
2. Do the subsidiary company/companies participate in the BR Initiatives of the parent company? If yes, then indicate the number of such subsidiary company(s).
The Indian listed subsidiary (not in the top 500 companies based on market capitalisation as on 31st March, 2018) has its own BR initiatives. The other Indian subsidiary takes/would take part in the BR initiatives of the Company. The overseas subsidiaries carry out their BR initiatives in consonance with the prevailing requirements at their respective locations.
3. Do any other entity/entities (e.g. suppliers, distributors etc.) that the Company does business with participate in the BR initiatives of the Company? If yes, then indicate the percentage of such entity/entities? [Less than 30%, 30-60%, More than 60%]
The Company does not mandate its suppliers and distributors to participate in its BR activities. However, they are encouraged to do so.
Section D: BR Information
1. Details of Director/Directors responsible for BR
Details
a) Details of the Director/Director responsible for implementation of the BR policy/policies
• DIN Number • Name • Designation
00090089L RamkumarManaging Director
b) Details of the BR head • DIN Number • Name • Designation • Telephone number• Email ID
00090089L RamkumarManaging [email protected]
2. Principle-wise (as per NVGs) BR Policy/policies
The 9 areas of business responsibility enunciated under the National Voluntary Guidelines on Social, Environmental and Economic Responsibilities of Business (NVGs) released by the Ministry of Corporate Affairs, Government of India are:
Priniciple (“P”) Area of BR
1 Businesses should conduct and govern themselves with Ethics, Transparency and Accountability;
2 Businesses should provide goods and services that are safe and contribute to sustainability throughout their life cycle;
3 Businesses should promote the well-being of all employees;
4 Businesses should respect the interests of and be responsive towards all stakeholders, especially those who are disadvantaged, vulnerable and marginalized;
5 Businesses should respect and promote human rights;
6 Business should respect, protect and make efforts to restore the environment;
7 Businesses, when engaged in influencing public and regulatory policy, should do so in a responsible manner;
8 Businesses should support inclusive growth and equitable development;
9 Businesses should engage with and provide value to their customers and consumers in a responsible manner.

52 Annual Report 2017-18
Tube Investments of India Limited(Formerly known as TI Financial Holdings Limited)
No. Questions P.1 P.2 P.3 P.4 P.5 P.6 P.7 P.8 P.9
1 Do you have policy/policies for.... Y Y Y Y Y Y Y Y Y
2 Has the policy being formulated in consultation with the relevant stakeholders?
Y Y Y Y Y Y Y Y Y
3 Does the policy conform to any national/international standards? If yes, specify?
Y Y Y Y Y Y Y Y Y
4 Has the policy being approved by the Board? Yes, has it been signed by MD/owner/CEO/appropriate Board Director?
Y Y Y Y Y Y Y Y Y
5 Does the Company have a specified committee of the Board/Director/Official to oversee the implementation of the policy?
Y Y Y Y Y Y Y Y Y
6 Indicate the link for the policy to be viewed online? http://www.tiindia.com/article/values/667.
7 Has the policy been formally communicated to all relevant internal and external stakeholders?
Y Y Y Y Y Y Y Y Y
8 Does the Company have in-house structure to implement the policy/policies?
Y Y Y Y Y Y Y Y Y
9 Does the Company have a grievance redressal mechanism related to the policy/policies to address stakeholders’ grievances related to the policy/policies?
Y Y Y Y Y Y Y Y Y
10 Has the Company carried out independent audit/evaluation of the working of this policy by an internal or external agency?
Y Y Y Y Y Y Y Y Y
The policies of the Company are based on its guiding principles and core values and are mapped to each of the principles hereunder:
Principle Applicable Policies
Businesses should conduct and govern themselves with Ethics, Transparency and Accountability.
• Values and Beliefs, called the ‘Five Lights’• Whistle Blower Policy• TII Code of Conduct
Businesses should provide goods and services that are safe and contribute to sustainability throughout their life cycle.
• Safety, Health and Environmental Policy• Operational Excellence Practices
Businesses should promote the well-being of all employees.
• Safety, Health and Environmental Policy• Policy on prevention of Sexual Harassment at the work place
Businesses should respect the interests of and be responsive towards all stakeholders, especially those who are disadvantaged, vulnerable and marginalized.
• CSR Policy
Businesses should respect and promote human rights. • Values and Beliefs, called the ‘Five Lights’• Whistle Blower Policy• Code of Conduct
Business should respect, protect and make efforts to restore the environment.
• Safety, Health and Environmental Policy• Operational Excellence Practices
Businesses, when engaged in influencing public and regulatory policy, should do so in a responsible manner.
• Values and Beliefs, called the ‘Five Lights’
Businesses should support inclusive growth and equitable development.
• CSR Policy
Businesses should engage with and provide value to their customers and consumers in a responsible manner.
• Values and Beliefs, called the ‘Five Lights’• Operational Excellence Practices

Annual Report 2017-18 53
Corporate Overview Management Reports Financial Statements
2a. If answer to Sl. No. 1 against any principle, is ‘No’, please explain why: (Tick up to 2 options):
Not Applicable
3. Governance related to BR
• Indicate the frequency with which the Board of Directors, Committee of the Board or CEO to assess the BR performance of the Company. Within 3 months, 3-6 months, annually, more than 1 year.
The BR performance revolves around a number of policies which is assessed by the BR Head monthly, quarterly and annually based upon its importance and impact on the Company’s operations and activities.
• Does the Company publish a BR or a Sustainability Report? What is the hyperlink for viewing this report? How frequently it is published?
The requirement to publish a BR Report has arisen for FY 2017-18. Besides the Annual Report, the BR Report is also available in the website of the Company at www.tiindia.com.
Section E: Principle-wise Performance
Principle 1 – Ethics, Transparency & Accountability
The Company is committed to developing governance structures, procedures and practices that ensure ethical conduct at all levels; and promoting the adoption of this principle across its value chain. Commitment to ethical and lawful business conduct is a fundamental shared value of the Board of Directors, senior management and all employees of the Company.
1. Does the policy relating to Ethics, Bribery and Corruption cover only the Company? Yes/No. Does it extend to the Group/Joint Ventures/Suppliers/ Contractors/NGOs/Others?
The Company’s policies relating to Governance rest on adhering to ethics, transparency in dealing with stakeholders, adequate and timely disclosure etc. These policies are similar across all the entities in the Group. All stakeholders of the Company - internal as well as external are expected to work within the framework of the aforesaid policies/principles. In the selection of its vendors and contractors, the Company ensures to identify and deal with those who can maintain and follow ethical standards. The Company further on a regular basis endeavours to reiterate awareness and also impart training on these values to its employees. The relevant stakeholders of the Company are also made aware of the said values from time to time.
2. How many stakeholder complaints have been received in the past financial year and what percentage was satisfactorily resolved by the management? If so, provide details thereof, in about 50 words or so.
The Company has set up a Whistle-blower mechanism as an avenue for voicing of concerns inter alia relating to unethical behavior. During the year, there were no complaints under the Company’s Whistle Blower policy. There were also no complaints from the stakeholders under the Stakeholders Relationship Committee established for voicing of grievances/issues by investors.
Principle 2 - Safety and sustainability of goods & services
The Company undertakes to assure safety and optimal resource use over the life-cycle of its products. Efforts will be made to ensure that everyone connected with it be it designers, producers, value chain members, customers and recyclers are made aware of their responsibilities.
1. List up to 3 of your products or services whose design has incorporated social or environmental concerns, risks and/or opportunities.
Bicycles
The Company, being conscious that bicycle is a common mode of transport for certain sections of the public, develops new models/products which are affordable and durable. The Company is also developing number of new models catering to the health and leisure segment of the bicycle users.
Steel Tubes
The Company has developed a number of steel tubes which are used in safety critical applications by the automotive industry. Some of Company’s products are import substitution, enabling conservation of foreign currency. The Company caters to the requirements of infrastructure industry by providing products to off-road vehicles.
Industrial/Automotive Chains
The Company has developed industrial chains that are used in elevators, escalators and travellators used in the country’s infrastructure development projects.
The Company has strong focus on managing and reducing its energy, water and waste footprint, and is in constant lookout for improvement opportunities. Some interventions taken in this regard includes implementation of ISO 14001 and OHSAS 18001 standardization systems, reducing overall dependence on direct fuel consumption at our operational sites. All these efforts have allowed us to improve upon our resource use efficiency.

54 Annual Report 2017-18
Tube Investments of India Limited(Formerly known as TI Financial Holdings Limited)
2. For each such product, provide the following details in respect of resource use (energy, water, raw material etc.) per unit of product (optional):
--
3. Does the Company have procedures in place for sustainable sourcing (including transportation)? If yes, what percentage of your inputs was sourced sustainably?
Yes. Vendors/service providers are encouraged to adopt management practices detailed under the international standards such as ISO 9001, ISO 14001, OHSAS 18001 and Company’s Environment, Health and Safety (EHS) Guidelines. The Company’s integrated operations ensure sustainable exploitation of the available resources. Joint project opportunities amongst various business units improve efficiencies in sourcing besides resulting in product efficiencies. Conscious efforts are made to ensure that everyone connected with the Company be it the designers, producers, value chain members, customers and recyclers are made aware of their responsibilities. The Company’s Operational Excellence (OPEX) practices help in achieving operational efficiencies also resulting
in energy conservation and sustainable operations. Usage of materials which are either recycled or capable of recycling assumes top priority.
4. Has the Company taken any steps to procure goods and services from local & small producers, including communities surrounding their place of work? If yes, what steps have been taken to improve their capacity and capability of local and small vendors?
The Company has developed a vendor base around many of its manufacturing locations. Capability building is the primary focus of the Company’s vendor development and management process. The Company recognises the importance of its vendor base and continuously monitored the financial health and business practices of the same.
5. Does the Company have a mechanism to recycle products and waste? If yes what is the percentage of recycling of products and waste (separately as <5%, 5-10%, >10%). Also, provide details thereof.
The Company has sustainable processes in place to recycle the products and waste, post completion of manufacturing life cycle.
1 Please indicate the total number of employees 3365
2 Please indicate the total number of employees hired on temporary/contractual/casual basis
8551
3 Please indicate the number of permanent women employees 72
4 Please indicate the number of permanent employees with disabilities 7
5 Do you have an employee association that is recognized by management? Yes
6 What percentage of your permanent employees is members of this recognized employee association?
55.78%
7 Please indicate the number of complaints relating to child labour, forced labour, involuntary labour, sexual harassment in the last financial year and pending, as on the end of the financial year.
Nil
8 What safety & skill upgradation training was provided in the last year? Safety:Safety InductionGeneral Awareness on SafetyUsage of Personal Protective Equipment (PPE) & Equipment HandlingVideo Based TrainingSkill:Class room trainingOn-the-Job training
• Permanent employees (includes women employees and employees with disabilities) 100%
• Casual/Temporary/Contractual Employees 100%
Principle 3 - Promotion of wellbeing of employees
The Company ensures a work environment that promotes well-being of all its employees. Focusing on health, safety and preventing discrimination are part of the Company’s guiding principles on employees’ well-being.

Annual Report 2017-18 55
Corporate Overview Management Reports Financial Statements
Principle 4 - Responsiveness towards stakeholders
The Company is responsive to the requirements of all its Stakeholders and this is enshrined in its Corporate Values & Beliefs of Integrity, Passion, Quality, Respect and Responsibility. These values require that the Company act as a responsible corporate citizen and change lives for the better and this is to be done in a manner that reflects humility. The Company considers its employees, business associates, suppliers, stockists, dealers, customers, shareholders/investors and communities surrounding its operations and regulatory authorities as its key stakeholders. The Company continues its engagement with them through various mechanisms such as consultations with local communities, supplier/vendor meetings, customer/employee engagement surveys, investor forums, etc. The Company’s website, www.tiindia.com provides comprehensive information to the stakeholders about the Company.
1. Has the Company mapped its internal and external stakeholders?
Yes. The Company has mapped its internal and external stakeholders.
2. Out of the above, has the Company identified the disadvantaged, vulnerable & marginalized stakeholders?
The Company identifies underprivileged communities around its business locations as disadvantaged, vulnerable and marginalised stakeholders and continuously engages with all such stakeholders identifying their needs and priorities so as to serve these needs accordingly. The systems and processes are in place to systematically identify stakeholders and for understanding their concerns and for engaging with them is reviewed from time to time.
3. Are there any special initiatives taken by the Company to engage with the disadvantaged, vulnerable and marginalized stakeholders.
The Company on a periodical basis undertakes dedicated activities as a part of its CSR initiatives for the disadvantaged, vulnerable and marginalised stakeholders in and around the Company’s factories/plants. Education, sports and health aids are provided to schools in rural/under-developed areas and to schools supporting differently abled children. The Company acknowledges the importance of skill development in this competitive environment and has set up the Basic Training Center (BTC) at the Avadi Complex of Tube Products of India, a division of the Company, with the motto of developing technical skills amongst indigent students. The BTC will provide a skill bank of a technically competent and industry ready work force drawn from socially and economically backward sections of the
society. During the year under review, the Directorate of Employment and Training, Tamilnadu (DET) completed an inspection of the BTC and impressed with its high standards, has approved an enhancement in the strength of students to 140 and also upgraded the BTC as a Basic Training Provider, which makes the Center eligible for government subsidy. All the twenty-one students of the BTC who appeared for the All India Trade Test for the National Apprentice Certificate secured first class and found suitable placements. The Company also pursues other local community assistance programmes in and around its plants’ and office locations.
Principle 5 - Promoting human rights
The Company respects the rights and dignity of all individuals and upholds the principles of human rights. The Company’s commitment to human rights and fair treatment is set out in its Code of Conduct and the Five Principles governing the group. The policy provides conduct of operations with honesty, integrity and openness with respect for human rights and interests of employees. The Company believes that a sustainable organisation rests on a foundation of ethics and respect for human rights.
1. Does the policy of the Company on human rights cover only the Company or extend to the Group/Joint Ventures/Suppliers/Contractors/NGOs/Others?
The policy of the Company on human rights is imbibed in its values represented in the Five Lights guiding the Company, its group companies and their employees across all spheres. The alignment with this value system is expected out of any person dealing with the Company.
The Company’s policy on human rights covers not only the Company but extends to its subsidiaries. The Company encourages its suppliers, contractors and others to follow the principles laid down in the five principles of its values and beliefs.
2. How many stakeholder complaints have been received in the past financial year and what percent was satisfactorily resolved by the management?
No complaint pertaining to violation of human rights was received during the financial year ended 31st March, 2018.
Principle 6- Protecting the environment
The Company takes responsibility for and accords the highest value to the protection of the environment. Accordingly, the best practices and procedures relating to environment protection are followed by all the factories of the Company. The Company strives to promote ecological sustainability and green initiatives by adopting energy saving mechanism and sensitising employees to reduce carbon foot print of the Company.

56 Annual Report 2017-18
Tube Investments of India Limited(Formerly known as TI Financial Holdings Limited)
1. Does the policy related to Principle 6 cover only the company or extends to the Group/Joint Ventures/Suppliers/ Contractors/NGOs/others.
Sustainability is an important element of the Company’s business processes. The Company encourages all its stakeholders to follow environment-friendly processes.
2. Does the Company have strategies/initiatives to address global environmental issues such as climate change, global warming etc.?
As a manufacturing company, necessary mechanisms have been set up for ensuring compliance with the laws on environment mechanisms in place to ensure compliance with the applicable environmental laws. The Company is committed to be an environment friendly organisation and has a dedicated Environmental Policy across all its business units. The Company is an active player in practising initiatives to address environmental issues and ensuring sustainable development. Almost all locations of the Company have received the ISO 14001 certificate for their Environment Management Systems and ISO 9001 for Quality Management Systems. All factories of the Company have a green belt around the plant. Other than these, the Company does not have any initiative to address global environmental issues.
3. Does the Company identify and assess potential environmental risks?
Yes. The Company does have a mechanism to identify and assess potential environmental risks in its plants, projects and operations. Environmental risk identification and mitigation is ingrained in the Company’s risk management system.
4. Does the Company have any project related to Clean Development Mechanism? If so, provide details thereof, in about 50 words or so. Also, if yes, whether any Environmental Compliance Report is filed?
No, the Company has not undertaken any specific project related to the Clean Development Mechanism as per the Kyoto Protocol. However, all the manufacturing locations of the Company are certified ISO 14001 (Environment Management System), QMS - ISO 9001 (Quality Management System), OSHAS - 18001 (Health and Safety Management System).
5. Has the Company undertaken any other initiatives on - clean technology, energy efficiency, renewable energy, etc?
The Company utilises its resources in an optimal and responsible manner ensuring sustainability through reduction, re-use, re-cycling and managing waste. Continuous efforts are on to improve energy
efficiency in every sphere of Company’s operations. Appropriate measures to check and prevent pollution are undertaken. The Company seeks to improve its environmental performance by adopting cleaner production methods, promotion of energy efficient and environmental friendly technologies. Suitable processes and systems are developed with contingency plans and processes that help in preventing, mitigating and controlling environmental damages caused due to the Company’s operations.
6. Are the emissions/wastes generated by the Company within the permissible limits given by CPCB/SPCB for the financial year being reported?
All businesses of the Company are engaged in manufacturing activity. Accordingly, it is being ensured that the emissions/wastes being generated through such activities are in compliance with the applicable environmental laws. The Company’s policy on environment and the ISO-14001 certification of its facilities emphasizes on its commitment to be an environment friendly organization setting standards in environment management.
7. Number of show cause/legal notices received from CPCB/SPCB which are pending (i.e. not resolved to satisfaction) as on end of Financial Year.
No show cause/legal notices were received from CPCB/SPCB during the Financial Year.
Principle 7- Responsibility towards public and regulatory policy
1. Is your Company a member of any trade and chamber or association? If Yes, name only those major ones that your business deals with.
Yes.
(a) Confederation of Indian Industry
(b) Southern India Chamber of Commerce & Industry
(c) Madras Management Association
(d) All India Cycle Manufacturers’ Association
(e) Employers Federation of Southern India
(f) Federation of Indian Chamber of Commerce and Industry
2. Have you advocated/lobbied through above associations for the advancement or improvement of public good? Yes/No; if yes specify the broad areas (drop box: Governance and Administration, Economic Reforms, Inclusive Development Policies, Energy Security, Water, Food Security, Sustainable Business Principles, others)
Yes. While the Company is not actively involved in lobbying, as a responsible corporate citizen, the

Annual Report 2017-18 57
Corporate Overview Management Reports Financial Statements
Company as a part of major industry associations/chambers makes recommendations/representations before regulators and associations for advancement and improvement of industrial climate in India.
The Company also represents its views/opinions on energy security, economic reforms, governance etc.
Principle 8 – Supporting inclusive growth and development
1. Does the company have specified programmes/initiatives/projects in pursuit of the policy related to Principle 8? If yes details thereof.
Yes. Please refer to the CSR Annual Report for the financial year ended 31st March, 2018.
2. Are the programmes/projects undertaken through in-house team/own foundation/external NGO/government structures/any other organization?
For the financial year, 2017-18, the budgeted CSR initiatives were implemented directly by the Company with in-house support. For projects requiring specialized experience and expertise for execution, implementing agencies are also involved.
3. Have you done any impact assessment of your initiative?
All CSR initiatives are supported by an Impact assessment to ensure that they reach the community intended and positively impact the life of those covered under the initiative.
4. What is your company's direct contribution to community development projects- Amount in INR and the details of the projects undertaken?
Please refer to the CSR Annual Report of the Boards’ Report for the FY 2017-18 for details of the direct contribution made by the Company during the financial year ended 31st March 2018.
5. Have you taken steps to ensure that this community development initiative is successfully adopted by the community?
Initiatives are identified based on the requirement of the community such that the benefits out of them are of an enduring nature. – Please refer to the CSR Annual Report for the financial year ended 31st March, 2018.
Principle 9 – Providing value to customers & consumers
The Company firmly believes in being a quality and customer centric organization offering products/goods of genuine value to all its discerning customers that meets with their expectations every time. The products/goods of the Company undergo several quality checks at every level of the production process chain. Well-defined Standard Operating Procedures (SOPs) and processes aid in identifying and eradicating process/system impediments. The Company’s overall approach on this aspect is guided by its quality policy and Operational Excellence (OPEX) practices.
1. What percentage of customer complaints/consumer cases are pending as on the end of financial year.
Pending customer complaints/consumer cases constitute a very meager percentage (less than 1%) as at the end of 31st March, 2018. Proactive steps are being taken to resolve the same at the earliest.
2. Does the Company display product information on the product label, over and above what is mandated as per local laws? Yes/No/N.A./Remarks.
Yes. Product information is displayed on all product/goods of the Company in accordance with the Legal Metrology Act, 2011 and the applicable Rules thereunder/other laws. In addition, wherever it is considered relevant and appropriate for to facilitate better usage of the product/goods by the customer, additional information about the products/goods, the use and the mode of handling thereof are also provided.
3. Is there any case filed by any stakeholder against the Company regarding unfair trade practices, irresponsible advertising and/or anti-competitive behavior during the last five years and pending as on end of financial year.
There have been no cases relating to unfair trade practices, irresponsible advertising and/or anti-competitive behavior against the Company.
4. Did your Company carry out any consumer survey/consumer satisfaction trends?
Yes. Conduct of periodical consumer surveys and mapping of customer satisfaction trends are considered and utilised by the Company on a regular basis as effective tools of business strategy to understand the customers and their needs better.

58 Annual Report 2017-18
Tube Investments of India Limited(Formerly known as TI Financial Holdings Limited)
The details of remuneration during the financial year, 2017-18 as per Rule 5(1) of the Companies (Appointment & Remuneration of Managerial Personnel) Rules, 2014, as amended, are as follows:
i. Ratio of remuneration* of each Director to the median remuneration of the employees of the Company for the financial year, 2017-18:
Name Designation Ratio#
Mr. M M Murugappan Chairman 21.48
Mr. Pradeep V Bhide Director 5.76
Mr. S. Sandilya Director 1.89
Mr. Ramesh K B Menon@ Director 0.70
Mr. Vellayan Subbiah$ Managing Director (Designate) 75.55
Mr. Hemant M Nerurkar Director 2.13
Ms. Madhu Dubhashi Director 1.83
Mr. L Ramkumar Managing Director 94.30
Note: *Remuneration includes Sitting Fees# Number of times the median remuneration@ Part of the year – from 16th November, 2017$ Part of the year – from 19th August, 2017
ii. Percentage increase in remuneration of each Director, Chief Executive Officer, Chief Financial Officer & Company Secretary in the financial year, 2017-18
Name Designation % increase
Mr. M M Murugappan Director -0.78%
Mr. Pradeep V Bhide Director -2.67%
Mr. S. Sandilya Director -22.51%
Mr. Ramesh K B Menon@ Director -
Mr. Vellayan Subbiah# Managing Director (Designate) -
Mr. Hemant M Nerurkar Director 6.88%
Ms. Madhu Dubhashi Director -1.14%
Mr. L Ramkumar Managing Director 19.53%
Mr. S Suresh Company Secretary 6.57%
Mr. K Mahendra Kumar* Chief Financial Officer -
@ Part of the year – from 16th November, 2017# Part of the year – from 19th August, 2017* Part of the year – 2016-17
iii. Percentage increase in median remuneration of employees in the financial year, 2017-18 - 13.67%
Disclosure of Remuneration Under Section 197(12) of the Companies Act, 2013 read with Rule 5(1) of the Companies (Appointment and Remuneration of Managerial Personnel) Rules, 2014
Annexure-F

Annual Report 2017-18 59
Corporate Overview Management Reports Financial Statements
iv. Number of permanent employees on the rolls of the Company as on 31.3.2018 - 3365
v. Average per centile increase already made in the salaries of employees other than the managerial personnel in the last financial year and comparison with the per centile increase in the managerial remuneration and justification thereof. Whether there are any exceptional circumstances for increase in the managerial remuneration.
Parameters
Average % increase in the salaries of employees other than managerial personnel viz., Managing Directors in the financial year, 2017-18
7.94%
Average % increase in the managerial remuneration in the financial year, 2017-18 viz., Managing Director’s remuneration
19.53%
Remarks The Managing Directors’ remuneration comprises of fixed and variable component. The annual increment in salary for the financial year, 2017-18 is determined by the Nomination & Remuneration Committee on the basis of Company financials, level of responsibility, experience and scales prevailing in the industry.
vi. Affirmation
It is affirmed that the remuneration paid to the employees during the financial year, 2017-18 is as per the Remuneration Policy of the Company.
On behalf of the Board
Place : Chennai M M MurugappanDate : 7th May, 2018 Chairman

60 Annual Report 2017-18
Tube Investments of India Limited(Formerly known as TI Financial Holdings Limited)
To,
The Members,TUBE INVESTMENTS OF INDIA LIMITED(Formerly known as “TI Financial Holdings Limited”)Dare House, No.234, N S C Bose RoadChennai - 600001
We have conducted the secretarial audit of the compliance of applicable statutory provisions and the adherence to good corporate practices by TUBE INVESTMENTS OF INDIA LIMITED (Formerly known as “TI FINANCIAL HOLDINGS LIMITED”) [Corporate Identification Number: L35100TN2008PLC069496] (hereinafter called “the Company”). Secretarial Audit was conducted in a manner that provided us a reasonable basis for evaluating the corporate conducts/statutory compliances and expressing our opinion thereon.
Based on our verification of the Company’s books, papers, minute books, forms and returns filed and other records maintained by the Company and also the information provided by the Company, its officers, agents and authorized representatives during the conduct of Secretarial Audit, We hereby report that in our opinion, the Company has, during the audit period covering the financial year ended on 31st March, 2018 complied with the statutory provisions listed hereunder and also that the Company has proper Board-processes and compliance mechanism in place.
We have examined the books, papers, minute books, forms and returns filed and other records maintained by the Company for the financial year ended on 31st March, 2018 according to the provisions of:
(i) The Companies Act, 2013 (the Act) and the rules made there under and the Companies Act, 1956 (to the extent applicable);
(ii) The Securities Contracts (Regulation) Act, 1956 (‘SCRA’) and the rules made there under;
(iii) The Depositories Act, 1996 and the Regulations and Bye-laws framed there under;
(iv) During the year under review the Company has complied with the provisions of Foreign Exchange Management Act, 1999 and the rules and regulations made there under to the extent of Overseas Direct Investment. There is no Foreign Direct Investment and External Commercial Borrowings during the year under review;
Secretarial Audit Reportfor the financial year ended 31st March, 2018
[Pursuant to Section 204(1) of the Companies Act, 2013 and Rule No.9 of the Companies (Appointment and Remuneration of Managerial Personnel) Rules, 2014]
(v) The following Regulations and Guidelines prescribed under the Securities and Exchange Board of India Act, 1992 (‘SEBI Act’) are applicable;
a) The Securities and Exchange Board of India (Substantial Acquisition of Shares and Takeovers) Regulations, 2011;
b) The Securities and Exchange Board of India (Prohibition of Insider Trading) Regulations, 2015;
c) The Securities and Exchange Board of India (Issue of Capital and Disclosure Requirements) Regulations, 2009;
d) The Employee Stock Option Plan, 2017 approved under the Securities and Exchange Board of India (Share Based Employee Benefits) Regulations, 2014;
e) The Securities and Exchange Board of India (Issue and Listing of Debt Securities) Regulations, 2008;
f) The Securities and Exchange Board of India (Registrars to an Issue and Share Transfer Agents) Regulations, 1993 regarding the Companies Act and dealing with client;
g) The Company has not delisted its Securities from any of the Stock Exchanges in which it is listed during the period under review and hence the question of complying with the provisions of the Securities and Exchange Board of India (Delisting of Equity Shares) Regulations, 2009 does not arise; and
h) The Company has not bought back any Securities during the period under review and hence the question of complying with the provisions of the Securities and Exchange Board of India (Buyback of Securities) Regulations, 1998 does not arise;
(vi) We have reviewed the systems and mechanisms established by the Company for ensuring compliances under the other applicable Acts, Rules, Regulations and Guidelines prescribed under various laws which are applicable to the Company and categorized under the following major heads/groups:
1. Factories Act, 1948;
2. Labour laws and other incidental laws related to labour and employees appointed by the Company
Annexure-G

Annual Report 2017-18 61
Corporate Overview Management Reports Financial Statements
including those on contractual basis as relating to wages, gratuity, prevention of sexual harassment, dispute resolution, welfare, provident fund, insurance, compensation etc.;
3. Industries (Development & Regulation) Act, 1951;
4. Acts relating to consumer protection including the Competition Act, 2002;
5. Acts and Rules prescribed under prevention and control of pollution;
6. Acts and Rules relating to Environmental protection and energy conservation;
7. Acts and Rules relating to hazardous substances and chemicals;
8. Acts and Rules relating to electricity, fire, petroleum, drugs, motor vehicles, explosives, boilers etc.;
9. Acts relating to protection of IPR;
10. Land revenue laws; and
11. Other local laws as applicable to various plants and offices.
With respect to Fiscal laws, based on the information & explanations provided by the management and officers of the Company and certificates placed before the Board of Directors, we report that adequate systems are in place to monitor and ensure compliance of fiscal laws as mentioned above.
We have also examined compliance with the applicable clauses/regulations of the following:
(i) Secretarial Standards with respect to Meetings of Board of Directors (SS-1) and General Meetings (SS-2) issued by The Institute of Company Secretaries of India.
(ii) The Uniform Listing Agreement entered with BSE Limited and the National Stock Exchange of India Limited pursuant to the provisions of the SEBI (Listing Obligations and Disclosure Requirements) Regulations, 2015.
During the period under review the Company has complied with the provisions of the Act, Rules, Regulations, Guidelines, Standards, etc., mentioned above.
We further report that
The Board of Directors of the Company is duly constituted with proper balance of Executive Directors, Non-Executive Directors and Independent Directors. The changes in the composition of the Board of Directors that took place during the period under review were carried out in compliance with the provisions of the Act.
Adequate notice is given to all Directors before schedule of the Board Meetings, agenda and detailed notes on agenda were sent at least seven days in advance, and a system exists for seeking and obtaining further information and clarifications on the agenda items before the meeting and for meaningful participation at the meeting. Notes on agenda which are circulated less than the specified period, the necessary compliances under the Companies Act, 2013 and Secretarial Standards on Board Meeting are complied with.
Based on the verification of the records and minutes, the decisions at the Board/Committee Meetings were taken with the consent of the Board of Directors/Committee Members and no Director/Member had dissented on any of the decisions taken at such Board/Committee Meetings.
We further report that based on review of compliance mechanism established by the Company we are of the opinion that the management has adequate systems and processes commensurate with its size and operations, to monitor and ensure compliance with all applicable laws including labour laws, rules, regulations and guidelines.
We further report that during the audit period, the Company has
a) Obtained an Order from the National Company Law Tribunal, Chennai Bench sanctioning the Scheme of Arrangement (Demerger) between Tube Investments of India Limited ("Demerged Company") and TI Financial Holdings Limited ("Resulting Company") and their respective shareholders under Sections 230 to 232 of the Companies Act, 2013 on 17th July, 2017 and the Demerged Company and the Resulting Company have filed necessary forms with the Registrar of Companies along with the certified true copy of the Order, the Scheme had become effective from 1st August, 2017 with the appointed date of 1st April, 2016.
b) Changed the objects clause of the Memorandum of Association of the Company pursuant to the Order received from The National Company Law Tribunal, Chennai Bench sanctioning the Scheme of Arrangement (Demerger) between Tube Investments of India Limited ("Demerged Company") and TI Financial Holdings Limited ("Resulting Company") and their respective shareholders under Sections 230 to 232 of the Companies Act, 2013 on 17th July, 2017.
c) Changed its name by making an application in Form INC 24 with the Registrar of Companies, Chennai on 10th August, 2017 from "TI Financial Holdings Limited" to the new name "Tube Investments of India Limited" pursuant to the Order received from

62 Annual Report 2017-18
Tube Investments of India Limited(Formerly known as TI Financial Holdings Limited)
The National Company Law Tribunal, Chennai Bench sanctioning the Scheme of Arrangement (Demerger) between Tube Investments of India Limited ("Demerged Company") and TI Financial Holdings Limited ("Resulting Company") and their respective shareholders under Sections 230 to 232 of the Companies Act, 2013.
d) Pursuant to the Scheme of Arrangement as sanctioned by the National Company Law Tribunal, Chennai Bench vide order dated 17th July, 2017, 18,74,90,591 equity shares in the share capital of the Company of the face value of `1/- were allotted on 1st September, 2017 to the members of the Demerged Company and the said shares were admitted to listing on the Stock Exchanges viz., BSE Limited and National Stock Exchange of India Limited and commenced trading on the Stock Exchanges with effect from 2nd November, 2017.
e) Obtained the approval of the Board at its meeting held on 9th August, 2017 for the investment of an amount not exceeding `5 crores in TI Absolute Concepts Private Limited.
f) Obtained the approval of the Board at the meeting held on 28th October, 2017 for the following:
i. For acquisition of upto 90% of the share capital of the following target companies for an aggregate consideration not exceeding the sum of USD 3.8 million:-
a) 45,00,000 ordinary shares constituting 90% of paid up share capital in Great Cycles Private Limited and
b) 45,00,000 ordinary shares constituting 90% of the paid up share capital in Creative Cycles Private Limited.
ii. For an investment of an amount not exceeding in the aggregate `10 crores in one or more tranches, by way of additional infusion through subscription to the equity share capital of TI Tsubamex Private Limited.
iii. For opening of a representative office of the company for its division, Tube Products of India at Suzhou, China.
g) Obtained the approval of the members at their Extra-Ordinary General Meeting held on 29th May, 2017 for amending the Capital Clause of Memorandum of Association for increasing the authorized capital of the Company from the existing `2 Crores to `25 Crores.
h) Obtained the approval of the members at their Extra-Ordinary General Meeting held on 12th July, 2017 under Section 62(1)(b) of the Act for the “Employee Stock Option Plan 2017” (‘ESOP 2017’) and grant of Stock Options to employees of the Company and its subsidiaries under the ESOP 2017.
i) Issued secured redeemable non-convertible debentures for `100 crores.
j) Redeemed secured redeemable non-convertible debentures for `125 crores.
For R.SRIDHARAN & ASSOCIATES COMPANY SECRETARIES
CS R.SRIDHARAN CP No. 3239Place : Chennai FCS No. 4775Date : 7th May, 2018 UIN : S2003TN063400

Annual Report 2017-18 63
Corporate Overview Management Reports Financial Statements
Form MGT - 9EXTRACT OF ANNUAL RETURN
as on the financial year ended on 31st March, 2018 [Pursuant to Section 92(3) of the Companies Act, 2013 and Rule 12(1) of the
Companies (Management and Administration) Rules, 2014]
I. REGISTRATION AND OTHER DETAILS
1 Corporate Identification No. : L35100TN2008PLC069496
2 Registration Date : 6th October, 2008
3 Name of the Company : Tube Investments of India Limited(formerly TI Financial Holdings Limited)
4 Category/Sub-Category of the Company : Public Company/Limited by shares
5 Address of the Registered Office and contact details : “Dare House”, 234 N S C Bose RoadChennai – 600 001Tel: 044 42177770-5Fax: 044 42110404E-mail: [email protected]
6 Whether listed company : Yes
7 Name, Address and Contact details of Registrar and Transfer Agent, if any
: Karvy Computershare Private LimitedKarvy Selenium Tower B, Plot 31-32 Gachibowli, Financial District, Nanakramguda,Hyderabad - 500 032E-mail: [email protected] : (040) - 67162222Fax : (040) – 23001153
II. PRINCIPAL BUSINESS ACTIVITIES OF THE COMPANY
All the business activities contributing 10% or more of the total turnover of the Company shall be stated:-
Sl. No.
Name and Description of main products/servicesNIC Code of the Product/Service
% to total turnover of the Company
1. Cycles and Accessories 3092 30
2. Steel Strips and Tubes 2431 45
3. Metal Formed Products 2511 25
III. PARTICULARS OF HOLDING, SUBSIDIARY COMPANIES AND ASSOCIATE COMPANIES
Sl. No.
Name of the Company
Address CIN/GLNHolding/
Subsidiary/ Associate
% of shares held
Applicable Section
1 Shanthi Gears Ltd.
304A, Trichy Road, SinganallurCoimbatore – 641 005
L29130TZ1972PLC000649 Subsidiary 70.12 2(87)(ii)
2 TI Tsubamex Private Ltd.
“Dare House”, No.234, N S C Bose RoadChennai – 600 001
U28910TN2014PTC094447 Subsidiary 78.30 2(87)(ii)
3 TI Absolute Concepts Private Ltd.
No.17/35, Second Main Road, Gandhi Nagar Adyar Chennai - 600020
U74900TN2015PTC102418 Joint Venture Co. 50.00 2(6)
Annexure-H

64 Annual Report 2017-18
Tube Investments of India Limited(Formerly known as TI Financial Holdings Limited)
Sl. No.
Name of the Company
Address CIN/GLNHolding/
Subsidiary/ Associate
% of shares held
Applicable Section
4 Financiere C10 SAS
35 Rue Des Bas Trevois 10003 TROY France, RCS Troyes 428,747,703 (No.2000 B Management 163)
Foreign Company Subsidiary 100.00 2(87)(ii)
5 Sedis SAS 35 Rue Des Bas Trevois10003 TROY France, RCS Troyes 379 720 212(No.92B Management 146)
Foreign CompanyFellow Subsidiary[Subsidiary of (4) above]
100.00 2(87)(ii)
6 Sedis GmbH Schurmannstr. 16 D-45136 EssenDeutschland
Foreign CompanyFellow Subsidiary[Subsidiary of (4) above]
100.00 2(87)(ii)
7 Sedis Co. Ltd. 248 Mackadown Lane, Kitts Green, Birmingham, D33 OLE England
Foreign CompanyFellow Subsidiary[Subsidiary of (4) above]
100.00 2(87)(ii)
8 Great Cycles (Private) Ltd.
101 C, Phase III, Export Processing Zone, Katunayake, Sri Lanka.
Foreign Company Subsidiary 80.00 2(87)(ii)
9 Creative Cycles (Private) Ltd.
101 C, Phase III, Export Processing Zone, Katunayake, Sri Lanka.
Foreign Company Subsidiary 80.00 2(87)(ii)
IV. SHAREHOLDING PATTERN (Equity Share Capital Breakup as percentage of Total Equity)
(i) Category-wise Shareholding
SI. No.
Category of Shareholders
No. of Shares held at the beginning of the year (1st April, 2017)
No. of Shares held at the end of the year (31st March, 2018) % change
during the yearDemat Physical Total
% of total Shares
Demat Physical Total% of total
Shares(A) PROMOTER(1) INDIAN(a) Individual/HUF - - - - 99,87,295 - 99,87,295 5.33 5.33
(b)Central Government/State Government(s)
- - - - - - - - -
(c) Bodies Corporate - 11,00,000* 11,00,000* 100.00* 7,11,25,795 - 7,11,25,795 37.93 62.07(d) Financial Institutions/Banks - - - - - - - - -(e) Others - - - - - - - - -
Sub-Total A(1): - 11,00,000 11,00,000 100.00 8,11,13,090 - 8,11,13,090 43.25 67.40(AA) PROMOTER GROUP(a) Individual/HUF - - - - 62,32,289 - 62,32,289 3.32 3.32
(b)Central Government/State Government(s)
- - - - - - - - -
(c) Bodies Corporate - - - - 21,06,470 - 21,06,470 1.12 1.12(d) Others - - - - 20,55,750 - 20,55,750 1.10 1.10
Sub-Total (AA): - - - - 1,03,94,509 - 1,03,94,509 5.54 5.54(A2) FOREIGN
(a)Individuals (NRIs/Foreign Individuals)
- - - - - - - - -
(b) Bodies Corporate - - - - - - - - -(c) Institutions - - - - - - - - -(d) Qualified Foreign Investor - - - - - - - - -(e) Others - - - - - - - - -
Sub-Total A(2): - - - - - - - - -Total Shareholding of Promoter and Promoter Group (A)=(A1)+(AA)+(A2)
- 11,00,000 11,00,000 100.00 9,15,07,599 - 9,15,07,599 48.79 72.94

Annual Report 2017-18 65
Corporate Overview Management Reports Financial Statements
SI. No.
Category of Shareholders
No. of Shares held at the beginning of the year (1st April, 2017)
No. of Shares held at the end of the year (31st March, 2018) % change
during the yearDemat Physical Total
% of total Shares
Demat Physical Total% of total
Shares(B) PUBLIC SHAREHOLDING(1) INSTITUTIONS(a) Mutual Funds/UTI - - - - 2,49,75,117 - 2,49,75,117 13.32 13.32(b) Financial Institutions/Banks - - - - 9,07,911 7,350 9,15,261 0.49 0.49(c) Central Government/State
Government(s)- - - - - - - - -
(d) Venture Capital Funds - - - - - - - - -(e) Insurance Companies - - - - 29,36,126 - 29,36,126 1.57 1.57
(f)Foreign Institutional Investors/Foreign Portfolio Investors
- - - - 2,02,33,020 2,36,660 2,04,69,680 10.92 10.92
(g)Foreign Venture Capital Investors
- - - - - - - - -
(i) Others - Foreign Nationals - - - - 3,660 - 3,660 - -Sub-Total B(1): - - - - 4,90,55,834 2,44,010 4,92,99,844 26.29 26.29
(2) NON-INSTITUTIONS(a) Bodies Corporate - - - - 1,17,19,218 4,140 1,17,23,358 6.25 6.25(b) Individuals
(i) Individual Shareholders holding nominal share capital upto `2 lakhs
- - - - 1,98,81,722 12,72,856 2,11,54,578 11.28 11.28
(ii) Individual Shareholders holding nominal share capital in excess of `2 lakhs
- - - - 70,51,623 - 70,51,623 3.76 3.76
(c) OthersCLEARING MEMBERS - - - - 59,837 - 59,837 0.03 0.03NON RESIDENT INDIANS - - - - 10,85,242 57,030 11,42,272 0.61 0.61TRUSTS - - - - 1,07,396 - 1,07,396 0.06 0.06EMPLOYEE BENEFIT TRUST - - - - 7,03,680 - 7,03,680 0.38 0.38
OTHERS - - - - 5,55,551 - 5,55,551 0.30 0.30Sub-Total B(2): - - - - 4,11,64,269 13,34,026 4,24,98,295 22.66 22.66
Total Public Shareholding B=B(1)+B(2):
- - - - 9,02,20,103 15,78,036 9,17,98,139 48.95 48.95
Total (A+B): - 11,00,000 11,00,000 100.00 18,17,27,702 15,78,036 18,33,05,738 97.74 2.26.
(C) Shares held by custodians for GDRs & ADRs
(1) Promoter and Promoter Group
- - - - - - - - -
(2) Public - - - - 4223460 7170 42,30,630 2.26 2.26Sub-Total C: - - -
GRAND TOTAL ( A+B+C): - 11,00,000 11,00,000 100.00 18,59,51,162 15,85,206 18,75,36,368 100.00 -
Note: *Erstwhile Tube Investments of India Ltd (presently, TI Financial Holdings Ltd.) was holding 11,00,000 equity shares in the Company at the beginning of the year. Pursuant to the Scheme of Arrangement for demerger (“Scheme”), the said equity shares were cancelled. The Company allotted equity shares on 1st September, 2017 to the shareholders of the said erstwhile Tube Investments of India Ltd., in terms of the Scheme.

66 Annual Report 2017-18
Tube Investments of India Limited(Formerly known as TI Financial Holdings Limited)
(ii) Shareholding of Promoters
Sl. No Name of the Shareholder
Shareholding at the beginning of the year Shareholding at the end of the year
% change in shareholding
during the year
No .of Shares
% of the shares of the
company
% of the Shares
pledged/encumbered
to total Shares
No .of Shares
% of the shares of the
company
% of the Shares
pledged/encumbered
to total Shares
Messrs.1 Mr. M V Murugappan - - - 8,63,980 0.46 - 0.462 Mr. M V Subbiah - - - 7,44,150 0.40 - 0.403 Mr. S Vellayan - - - 4,30,250 0.23 - 0.234 Mr. A Vellayan - - - 6,31,900 0.34 0.02 0.345 Mr. V Narayanan - - - 2,81,140 0.15 - 0.156 Mr. V Arunachalam - - - 3,38,990 0.18 - 0.187 Mr. A Venkatachalam - - - 7,64,610 0.41 0.02 0.418 Mr. Arun Venkatachalam - - - 1,98,130 0.11 - 0.119 Mr. M M Murugappan - - - 17,30,535 0.92 - 0.9210 Mr. M M Veerappan - - - - - - -11 Mr. M M Muthiah - - - - - - -12 Mr. M M Venkatachalam - - - 11,67,710 0.62 0.002 0.6213 Mr. M V Muthiah - - - - - - -14 Mr. M V Subramanian - - - - - - -15 Mr. M A Alagappan - - - 8,40,660 0.45 0.003 0.4516 Mr. Arun Alagappan - - - 8,33,090 0.44 - 0.4417 Mr. M A M Arunachalam - - - 6,18,820 0.33 - 0.3318 Valli Arunachalam
(Valli Arunachalam holds shares as Kartha of M V Murugappan (HUF)
- - - 5,43,330 0.29 - 0.29
19 E.I.D. Parrry (India) Ltd. - - - - - - -
20Coromandel International Ltd. (Formerly known as Coromandel Fertilizers Ltd.
- - - - - - -
21New Ambadi Estate Private Ltd.
- - - - - - -
22 Ambadi Enterprises Ltd. - - - 10,58,200 0.56 - 0.5623 Ambadi Investments Ltd. - - - 7,00,66,595 37.36 - 37.3624 Carborundum Universal Ltd. - - - 1,000 - - - 25 Murugappa &Sons
(M V Murugappan, M A Alagappan and M M Murugappan hold shares on behalf of the Firm
- - - - - - -
26 TI Financial Holdings Limited (Formerly, Tube Investments of India Limited)
11,00,000* 100.00 - - - - -
Total 11,00,000 100.00 - 8,11,13,090 43.25 0.04 43.25
Note:
1) *Erstwhile Tube Investments of India Ltd (presently, TI Financial Holdings Ltd.) was holding 11,00,000 equity shares in the Company at the beginning of the year. Pursuant to the Scheme of Arrangement for demerger (“Scheme”), the said equity shares were cancelled. The Company allotted equity shares on 1st September, 2017 to the shareholders of the said erstwhile Tube Investments of India Ltd., in terms of the Scheme.
2) The above table does not include the holdings of the Promoter group aggregating 1,03,94,509 shares (5.54%) as at 31st March, 2018.
(iii) Change in Promoters’ Shareholding
*Erstwhile Tube Investments of India Ltd (presently, TI Financial Holdings Ltd.) was holding 11,00,000 equity shares in the Company at the beginning of the year. Pursuant to the Scheme of Arrangement for demerger (“Scheme”), the said equity shares were cancelled. The Company allotted equity shares on 1st September, 2017 to the shareholders, which includes the Promoters of the Company, of the said erstwhile Tube Investments of India Ltd., in terms of the Scheme. Further,
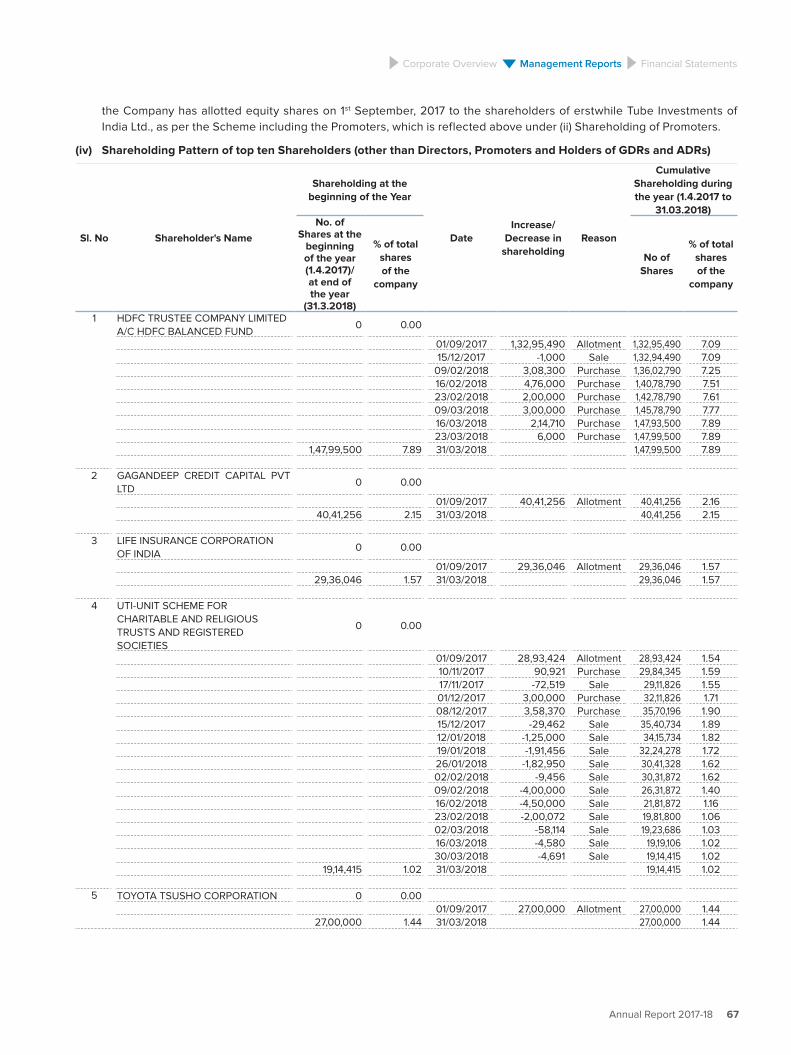
Annual Report 2017-18 67
Corporate Overview Management Reports Financial Statements
the Company has allotted equity shares on 1st September, 2017 to the shareholders of erstwhile Tube Investments of India Ltd., as per the Scheme including the Promoters, which is reflected above under (ii) Shareholding of Promoters.
(iv) Shareholding Pattern of top ten Shareholders (other than Directors, Promoters and Holders of GDRs and ADRs)
Sl. No Shareholder's Name
Shareholding at the beginning of the Year
DateIncrease/
Decrease in shareholding
Reason
Cumulative Shareholding during the year (1.4.2017 to
31.03.2018)No. of
Shares at the beginning of the year (1.4.2017)/at end of the year
(31.3.2018)
% of total shares of the
company
No of Shares
% of total shares of the
company
1 HDFC TRUSTEE COMPANY LIMITED A/C HDFC BALANCED FUND
0 0.00
01/09/2017 1,32,95,490 Allotment 1,32,95,490 7.0915/12/2017 -1,000 Sale 1,32,94,490 7.09
09/02/2018 3,08,300 Purchase 1,36,02,790 7.2516/02/2018 4,76,000 Purchase 1,40,78,790 7.5123/02/2018 2,00,000 Purchase 1,42,78,790 7.6109/03/2018 3,00,000 Purchase 1,45,78,790 7.7716/03/2018 2,14,710 Purchase 1,47,93,500 7.8923/03/2018 6,000 Purchase 1,47,99,500 7.89
1,47,99,500 7.89 31/03/2018 1,47,99,500 7.89
2 GAGANDEEP CREDIT CAPITAL PVT LTD
0 0.00
01/09/2017 40,41,256 Allotment 40,41,256 2.1640,41,256 2.15 31/03/2018 40,41,256 2.15
3 LIFE INSURANCE CORPORATION OF INDIA
0 0.00
01/09/2017 29,36,046 Allotment 29,36,046 1.5729,36,046 1.57 31/03/2018 29,36,046 1.57
4 UTI-UNIT SCHEME FOR CHARITABLE AND RELIGIOUS TRUSTS AND REGISTERED SOCIETIES
0 0.00
01/09/2017 28,93,424 Allotment 28,93,424 1.5410/11/2017 90,921 Purchase 29,84,345 1.5917/11/2017 -72,519 Sale 29,11,826 1.5501/12/2017 3,00,000 Purchase 32,11,826 1.7108/12/2017 3,58,370 Purchase 35,70,196 1.9015/12/2017 -29,462 Sale 35,40,734 1.8912/01/2018 -1,25,000 Sale 34,15,734 1.8219/01/2018 -1,91,456 Sale 32,24,278 1.7226/01/2018 -1,82,950 Sale 30,41,328 1.6202/02/2018 -9,456 Sale 30,31,872 1.6209/02/2018 -4,00,000 Sale 26,31,872 1.4016/02/2018 -4,50,000 Sale 21,81,872 1.1623/02/2018 -2,00,072 Sale 19,81,800 1.0602/03/2018 -58,114 Sale 19,23,686 1.0316/03/2018 -4,580 Sale 19,19,106 1.0230/03/2018 -4,691 Sale 19,14,415 1.02
19,14,415 1.02 31/03/2018 19,14,415 1.02
5 TOYOTA TSUSHO CORPORATION 0 0.0001/09/2017 27,00,000 Allotment 27,00,000 1.44
27,00,000 1.44 31/03/2018 27,00,000 1.44

68 Annual Report 2017-18
Tube Investments of India Limited(Formerly known as TI Financial Holdings Limited)
Sl. No Shareholder's Name
Shareholding at the beginning of the Year
DateIncrease/
Decrease in shareholding
Reason
Cumulative Shareholding during the year (1.4.2017 to
31.03.2018)No. of
Shares at the beginning of the year (1.4.2017)/at end of the year
(31.3.2018)
% of total shares of the
company
No of Shares
% of total shares of the
company
6 RELIANCE CAPITAL TRUSTEE CO LTD A/C-RELIANCE REGULAR SAVINGS FUND EQUITY OPTION
0 0.00
01/09/2017 26,43,846 Allotment 26,43,846 1.4126,43,846 1.41 31/03/2018 26,43,846 1.41
7 SHAMYAK INVESTMENT PRIVATE LIMITED
0 0.0001/09/2017 23,48,880 Allotment 23,48,880 1.25
23,48,880 1.25 31/03/2018 23,48,880 1.25
8 L&T MUTUAL FUND TRUSTEE LIMITED-L&T EMERGING BUSINESSES FUND
0 0.00
01/09/2017 21,03,703 Allotment 21,03,703 1.12
10/11/2017 -2,23,200 Sale 18,80,503 1.0017/11/2017 5,05,743 Purchase 23,86,246 1.2724/11/2017 1,42,957 Purchase 25,29,203 1.3508/12/2017 1,01,237 Purchase 26,30,440 1.4015/12/2017 97,879 Purchase 27,28,319 1.4629/12/2017 4,87,841 Purchase 32,16,160 1.7212/01/2018 31,991 Purchase 32,48,151 1.7319/01/2018 25,000 Purchase 32,73,151 1.75
09/02/2018 70,103 Purchase 33,43,254 1.7816/02/2018 16,892 Purchase 33,60,146 1.7923/02/2018 68,758 Purchase 34,28,904 1.8302/03/2018 73,693 Purchase 35,02,597 1.8709/03/2018 28,054 Purchase 35,30,651 1.8816/03/2018 13,484 Purchase 35,44,135 1.8923/03/2018 25,000 Purchase 35,69,135 1.90
35,69,135 1.90 31/03/2018 35,69,135 1.90
9 TUBE INVESTMENTS OF INDIA LTD. UNCLAIMED SHARE SUSPENSE ACCOUNT
0 0.00
01/09/2017 17,86,406 Allotment 17,86,406 0.95
05/01/2018 -17,86,406 Transfer 0 0.00
0 0.00 31/03/2018 0 0.00
10 AXIS MUTUAL FUND TRUSTEE LIMITED A/C AXIS MUTUAL FUND 0 0.00
01/09/2017 17, 59,101 Allotment 1,75,9101 0.94
12/01/2018 -11,28,210 Sale 6,30,891 0.34
26/01/2018 -57,5891 Sale 55,000 0.03
02/02/2018 -2,757 Sale 52,243 0.03
16/03/2018 -3,238 Sale 49,005 0.03
49,005 0.03 31/03/2018 49,005 0.03
Note:
Pursuant to the Scheme of Arrangement (Demerger), the Company has allotted equity shares on 1st September, 2017 to the shareholders of erstwhile Tube Investments of India Ltd.

Annual Report 2017-18 69
Corporate Overview Management Reports Financial Statements
(v) Shareholding of Directors and Key Managerial Personnel
Sl. No.
Name of the Directors and KMP
Shareholding at the beginning of the year
(1.04.2017)
Cumulative Shareholdingduring the year
(1.04.2017 to 31.03.2018)
No. ofshares
% of total shares of the
Company
No. ofshares
% of total shares of the
CompanyDirectors
1 Mr. M M MurugappanAt the beginning of the year - - - -Date wise Increase in Shareholding during the year (01.09.2017)*
- - 18,90,385 1.008
At the end of the year - - 18,90,385 1.0082 Mr. L Ramkumar
At the beginning of the year 10@ 0.009% - -Date wise Increase in Shareholding during the year (01.09.2017)*
- - 1,25,650 0.067
At the end of the year - - 1,25,650 0.0673 Mr. Vellayan Subbiah
At the beginning of the year - -Date wise Increase in Shareholding during the year (01.09.2017)*
- - 4,30,250 0.2294
At the end of the year - - 4,30,250 0.22944 Mr. Hemant M Nerurkar
At the beginning of the year - - - -Date wise Increase in Shareholding during the year - - - -At the end of the year - - - -
5 Ms. Madhu DubhashiAt the beginning of the year - - - -Date wise Increase in Shareholding during the year - - - -At the end of the year - - - -
6 Mr. Pradeep V BhideAt the beginning of the year - - - -Date wise Increase in Shareholding during the year - - - -At the end of the year - - - -
7 Mr. S SandilyaAt the beginning of the year - - - -Date wise Increase in Shareholding during the year - - - -At the end of the year - - - -
8 Mr. Ramesh K B MenonAt the beginning of the year - - - -Date wise Increase in Shareholding during the year - - - -At the end of the year - - - -Key Managerial Personnel
9 Mr. K Mahendra Kumar - Chief Financial OfficerAt the beginning of the year - - - -Date wise Increase in Shareholding during the year - - - -At the end of the year - - - -
10 Mr. S Suresh - Company SecretaryAt the beginning of the year 10@ 0.009% - -Date wise Increase in Shareholding during the year - - - -At the end of the year - - - -
Note: @ M/s. Tube Investments of India Ltd. (name changed as TI Financial Holdings Ltd.) erstwhile holding Company was the beneficial owner of the shares. These shares were cancelled pursuant to the Scheme of Arrangement (Demerger)[“Scheme”].
*The Shares were allotted pursuant to the Scheme of Arrangement (Demerger).

70 Annual Report 2017-18
Tube Investments of India Limited(Formerly known as TI Financial Holdings Limited)
V. INDEBTEDNESS
Indebtedness of the Company including interest outstanding/accrued but not due for payment ` in Cr.
Particulars Secured Short Term - Unsecured Deposits Total
Indebtedness
Indebtedness at the beginning of the financial year
i) Principal Amount 626.81 150.00 - 776.81
ii) Interest due but not paid - - - -
iii) Interest accrued but not due 17.38 - - 17.38
Total (i+ii+iii) 644.19 150.00 - 794.19
Change in Indebtedness during the financial year
i) Addition 580.00 870.00 - 1,450.00
ii) Reduction 519.34 1,020.00 - 1,539.34
Net Change 60.66 (150.00) - (89.34)
Indebtedness at the end of the financial year
i) Principal Amount 687.47 - - 687.47
ii) Interest due but not paid - - - -
iii) Interest accrued but not due 13.69 - - 13.69
Total (i+ii+iii) 701.16 - - 701.16
VI. Remuneration of Directors and Key Managerial Personnel
A. Remuneration to Managing Director, Whole-time Director and/or Manager: ` in Cr.
Sl.No.
Particulars of RemunerationMr. L Ramkumar
Managing Director
Mr. Vellayan SubbiahManaging Director
(Designate)#Total Amount
1 Gross Salary
(a) Salary as per provisions contained in Section 17(1) of the Income-tax Act, 1961
4.327 2.583 6.910
(b) Value of perquisites under Section 17(2) of Income-tax Act, 1961
0.140 0.996 1.136
(c) Profits in lieu of salary under Section 17(3) of Income tax Act, 1961
- - -
2 Stock Option* - - -
3 Sweat Equity - - -
4Commission - as % of Profit - others, specify
- - -
5 Others, please specify
Total (A) 4.467 3.579 8.046
Ceiling as per the Act 23.12Note : *No Stock Options vested under ESOP 2017 were exercised during the year.
# Appointed as Managing Director (Designate) w.e.f. 19th August, 2017.

Annual Report 2017-18 71
Corporate Overview Management Reports Financial Statements
B. Remuneration to other Directors:
Particulars of remuneration Name of DirectorsTotal
Amount1. Independent Directors Mr. S Sandilya Mr. P V BhideMr. Hemant M
NerurkarMs. Madhu Dubhashi
Fees for attending Board/Committee Meetings 0.015 0.023 0.026 0.012 0.076Commission * 0.075 0.250 0.075 0.075 0.475Others, please specify - - - - -Total (1) 0.09 0.273 0.101 0.087 0.551
2. Other Non-Executive Directors Mr. M M MurugappanMr. Ramesh K B Menon
Total Amount
Fees for attending Board/Committee Meetings 0.018 0.005 0.023
Commission* 1.000 0.028# 1.028
Others, please specify - - -
Total (2) 1.018 0.033 1.051
Total (B) = (1)+(2) 1.602
Total Managerial Remuneration (A)+(B) 9.648
Overall Ceiling as per the Act 25.43
Note: * Commission will be paid after the adoption of accounts for the financial year ended 31st March, 2018 by the shareholders at the
forthcoming Annual General Meeting.
# pro rata payment - Appointed as Director on 16th November, 2017
C. Remuneration to Key Managerial Personnel other than Managing Director/Manager/Whole-time Director.
Sl. No.
Particulars of remunerationKey Managerial Personnel
Total AmountCompany Secretary Chief Financial Officer
1 Gross Salary
(a) Salary as per provisions contained in Section 17(1) of the Income-tax Act, 1961
0.774 1.094 1.868
(b) Value of perquisites under Section 17(2) of Income-tax Act, 1961
0.041 0.046 0.087
(c) Profits in lieu of salary under Section 17(3) of Income-tax Act, 1961
- - -
2 Stock Option - - -
3 Sweat Equity - - -
4 Commission - as % of Profit- others, specify
- - -
5 Others, please specify - - -
Total 0.815 1.140 1.955
VII. Penalties/Punishment/Compounding of Offences:
There were no penalties, punishment or compounding of offences during the year ended 31st March, 2018.

72 Annual Report 2017-18
Tube Investments of India Limited(Formerly known as TI Financial Holdings Limited)
Power & Fuel Consumption
Sl. No.
Particulars 2017-18 2016-17
1 Electricity
(a) Purchased
Units (kWh) 14,28,82,987 13,27,09,085
Total Cost (` Cr.) 105.02 99.15
Rate per unit (`) 7.35 7.47
(b) Own Generation through Diesel Generator
Units (kWh) 31,14,264 27,41,241
Total Cost (` Cr.) 5.48 4.29
Rate per unit (`) 17.58 15.65
(c) Own generation through Solar Plant
Units (kWh) 3,44,216 1,94,604
Total Cost (` Cr.) 0.20 0.11
Rate per unit (`) 5.94 5.90
2 Consumption per unit of production
a. Cycles (kWh per Cycle) 5 4
b. Strips and Tubes (kWh per Ton) 229 244
c. Metal Form (kWh per Ton) 537* 396
d. Chains (kWh per Ton) 1,233 1,264
*increase due to lower activity levels in Uttarakhand plant
Conservation of Energy
The Company is committed to the conservation of energy and pursues various measures in the said regard. Some of the measures taken during 2017-18 are highlighted hereunder:
In the Engineering business, energy efficient pumps were installed at five places in place of old mono bloc pumps. The business also replaced metal halide illumination with LED lighting for around 550 numbers in the factory. Electrical heated air drier was changed to heat exchanger with hot water generated from briquette boilers to economize heat use. A modified lower HP fume exhaust blower with light weight FRP blades was installed in one wet process area on a trial basis. Variable frequency drives for hoist operation have been installed on five cranes. In addition, studies were conducted on harmonics and variable speed drives to understand the potential for energy savings.
In the Bicycles business, the Company has introduced energy efficient transformers, LED lights and an online energy monitoring system over the year.
In the Metal Formed Products business, older generation fluorescent, metal halide, CFL and sodium vapour lighting have been replaced by LED lamps of equivalent luminous intensity and the Company continues to implement this across all factories in a phased manner, leading to savings in consumed power. Automatic process timers and electronic interlocks in manually operated machinery are also being introduced on an on-going basis to eliminate idle running losses. Installation of thryristorised power controls on the seal quench furnace and layout modifications in starter motor casing lines have also resulted in savings on power. A small solar panel has been installed to run the sewage treatment plant.
The Company has also increased natural lighting on the shop floor with polycarbonate translucent sheets to eliminate any usage of lights during day time, besides fixing lower powered solar powered LED lights indoors.
Annexure-I
Conservation of Energy, Technology Absorption and Foreign Exchange Earnings and Outgo

Annual Report 2017-18 73
Corporate Overview Management Reports Financial Statements
Technology Absorption
Efforts made by the Company towards technology absorption and its benefits
a) High strength hydro-formable tubes for twist beams of cars through induction heating technology have been commercialised and are being regularly supplied to an auto OEM.
b) Several machine vision systems have been deployed for inspection of automotive components to ensure high reliability in performance in the Metal Formed Products business. Data is being collected from these systems for on-going process quality improvement.
c) The tube straightening process has been upgraded by commissioning of a series of machines built through in-house design and development. Precision tube process capabilities have been improving across locations in the business units.
d) Indigenously designed and developed Sealed Chain assembly machines in the Metal Formed Products business are expected to meet emerging customer demands for the product, with enhanced productivity levels, while reducing capital spend and dependency on imports.
e) Laboratory equipment has been upgraded in the Technology Centre. Some additions include a new state-of-the-art Universal Testing machine, a new Scanning Electron Microscope and an Endurance Testing Machine to complement materials’ testing and analysis capabilities. This will help partnering with automotive customers in new product development with new age steels.
f) A new, indigenously built Tube Mill capable of making thick walled tubes is being commissioned and is expected to provide significant operational and competitive advantage for the Engineering business, starting from the next financial year.
Future plans on technology
a) The Technology Centre is developing tests for dynamic performance of motorcycle chains for process and product improvement to insure proper product selection and specification for discerning customers, using specially built test equipment.
b) The Technology Centre continues to interact with knowledge bodies of global repute in the steel domain and with premier academic institutes to stay benchmarked with the latest developments on the engineering front in materials development, processing and computational methods.
c) The Technology Centre is focussing on automation to reduce material handling, people fatigue and repetitive tasks.
d) Equipment for residual stress measurement will be added to the Company’s laboratory to understand the impact of processing methodologies on material performance and to decode the structure-property-performance-relationships.
e) The Company is benchmarking with the product quality levels of high end hydraulic tubing to reach export and domestic markets in a greater way.
f) Progressive automation of repetitive manual operations and inspection and upgrading of material handling systems are planned for the improved process reliability and quality control.
Expenditure on R & D ` in Cr.
Particulars 2017-18 2016-17
Capital expenditure 6.12 0.54
Recurring 22.04 18.17
Total 28.16 18.71
Total R&D expenditure as a % of total turnover (Net) 0.65 0.48
Foreign Exchange Earnings and Outgo
Particulars 2017-18 2016-17
Foreign exchange earnings (CIF Value) 354.37 347.76
Foreign exchange outgo 324.26 303.74
On behalf of the BoardChennai M M Murugappan7th May 2018 Chairman

74 Annual Report 2017-18
Tube Investments of India Limited(Formerly known as TI Financial Holdings Limited)
Plant LocationsTI Cycles of IndiaPost Bag No.5 MTH RoadAmbattur, Chennai 600 053Tel : (044) - 42093434Fax: (044) - 42093345
TI Cycles of IndiaVillage Sandharsi, Tehsil Rajpura, Dist Patiala, Punjab 140 417Tel : (01762) - 269000, 269200
Tube Products of IndiaA-16 & 17, Industrial Area,Phase VIMohali (PB) 160 055Tel : (0172) - 4009318Fax: (0172) - 2271375
Tube Products of IndiaShirwal Post, Khandala TalukaSatara District,Maharastra 412 801Tel : (02169) - 244080-85Fax: (02169) - 244086
Tube Products of IndiaTirupati-Chennai HighwayPonpadi Village, Thiruvelangadu Block, Tiruttani TalukTiruvallur 631 213Tel : 09940259940
Tube Products of IndiaP.B.No. 4, Avadi,Chennai 600 054Tel: (044) - 42291999Fax : (044) - 42291990
TI Metal FormingChennai - Tiruvallur High RoadTiruninravur 602 024Tel : (044) 26390194, 26390437Fax : (044) 26390856
TI Metal Forming80/81, SIDCO Industrial EstateKakkalur,Thiruvallur 602 003Tel : (044) - 27667104Fax: (044) - 26390856
TI Metal FormingGat No.312Sablewadi, Bahul PostChakan-Shikrapur RoadKhed TalukPune 410 501Tel: 09272237117/8
TI Metal FormingTata Motors Ltd. Vendors ParkPlot No.C11, Survey No.1, North Kotpura, Sanand, Viroch Nagar PostAhmedabad, Gujarat 382 170Tel: 09228021343/09228021179
TI Metal FormingPlot No.222 & 227 Gangnouli VillageTehsil - Laksar, HaridwarUttarakhand 247 663Tel: 09219401388/9
TI Metal FormingPlot No. 245, Sector 3Growth CentreBawal, Rewari Dist.Haryana 123 501Tel : (01284) - 260707, 264106 09812038561Fax: (01284) - 264426
TIDC IndiaPost Bag No.11 MTH Road, AmbatturChennai 600 053Tel : (040) - 42235555Fax : (044) - 42235406
TIDC IndiaKazipally Village, Plot No.1Jinnaram MandalMedak Dist 502 319Tel : (08458) - 277240Fax: (08458) - 277241
TIDC IndiaGangnouli VillageTehsil - Laksar, HaridwarUttarakhand 247 663Tel : (01332) - 271295
CONTACT ADDRESS
COMPLIANCE OFFICERMr. S SureshCompany SecretaryTube Investments of India Limited‘Dare House’, 234, N S C Bose Road Chennai 600 001e-mail: [email protected] : (044) – 42286711Fax : (044) - 42110404
For all matters relating to investor services:Karvy Computershare Private LimitedKarvy Selenium Tower B, Plot 31-32, GachibowliFinancial District, NanakramgudaHyderabad 500 032e-mail : [email protected] : (040) – 67162222Fax: (040) - 23001153Toll Free: 1800-345-4001

Annual Report 2017-18 75
Corporate Overview Management Reports Financial Statements
Report on the Standalone Ind AS Financial Statements
We have audited the accompanying Standalone Ind AS Financial Statements of Tube Investments of India Limited (“the Company”), which comprise the Balance Sheet as at 31st March 2018, the Statement of Profit and Loss, including the Statement of Other Comprehensive Income, the Cash Flow Statement and the Statement of Changes in Equity for the year then ended, and a summary of significant accounting policies and other explanatory information.
Management’s Responsibility for the Standalone Ind AS Financial Statements
The Company’s Board of Directors is responsible for the matters stated in Section 134(5) of the Companies Act, 2013 (“the Act”) with respect to the preparation of these Standalone Ind AS Financial Statements that give a true and fair view of the financial position, financial performance including Other Comprehensive Income, Cash Flows and Changes in Equity of the Company in accordance with accounting principles generally accepted in India, including the Indian Accounting Standards (Ind AS) specified under Section 133 of the Act., read with the Companies (Indian Accounting Standards) Rules, 2015, as amended. This responsibility also includes maintenance of adequate accounting records in accordance with the provisions of the Act for safeguarding of the assets of the Company and for preventing and detecting frauds and other irregularities; selection and application of appropriate accounting policies; making judgments and estimates that are reasonable and prudent; and the design, implementation and maintenance of adequate internal financial control that were operating effectively for ensuring the accuracy and completeness of the accounting records, relevant to the preparation and presentation of the Standalone Ind AS Financial Statements that give a true and fair view and are free from material misstatement, whether due to fraud or error.
Auditor’s Responsibility
Our responsibility is to express an opinion on these Standalone Ind AS Financial Statements based on our audit. We have taken into account the provisions of the Act, the accounting and auditing standards and matters which are required to be included in the audit report under the provisions of the Act and the Rules made thereunder. We conducted our audit of the Standalone Ind AS Financial Statements in accordance with the Standards on Auditing, issued by the Institute of Chartered Accountants of India, as specified under Section 143(10) of the Act. Those Standards require that we comply with ethical requirements and plan and perform the audit to obtain reasonable assurance about whether the financial statements are free from material misstatement.
An audit involves performing procedures to obtain audit evidence about the amounts and disclosures in the financial statements. The procedures selected depend on the auditor’s judgment, including the assessment of the risks of material misstatement of the Standalone Ind AS Financial Statements, whether due to fraud or error. In making those risk assessments, the auditor considers internal financial control relevant to the Company’s preparation of the Standalone Ind AS Financial Statements that give a true and fair view in order to design audit procedures that are appropriate in the circumstances. An audit also includes evaluating the appropriateness of accounting policies used and the reasonableness of the accounting estimates made by the Company’s Directors, as well as evaluating the overall presentation of the Standalone Ind AS Financial Statements. We believe that the audit evidence we have obtained is sufficient and appropriate to provide a basis for our audit opinion on the Standalone Ind AS Financial Statements.
Opinion
In our opinion and to the best of our information and according to the explanations given to us, the Standalone Ind AS Financial Statements give the information required by the Act in the manner so required and give a true and fair view in conformity with the accounting principles generally accepted in India, of the state of affairs of the Company as at 31st March 2018, its profit including Other Comprehensive Income, its Cash Flows and the Changes in Equity for the year ended on that date.
Report on Other Legal and Regulatory Requirements
1. As required by the Companies (Auditor’s report) Order, 2016 (“the Order”) issued by the Central Government of India in terms of sub-section (11) of section 143 of the Act, we give in the Annexure 1 a statement on the matters specified in paragraphs 3 and 4 of the Order.
2. As required by section 143 (3) of the Act, we report that:
(a) We have sought and obtained all the information and explanations which to the best of our knowledge and belief were necessary for the purpose of our audit;
(b) In our opinion, proper books of account as required by law have been kept by the Company so far as it appears from our examination of those books;
(c) The Balance Sheet, Statement of Profit and Loss including the Statement of Other Comprehensive Income, the Cash Flow Statement and Statement of Changes in Equity dealt with by this Report are in agreement with the books of account;
Independent Auditor’s ReportTo the Members of Tube Investments of India Limited (formerly known as TI Financial Holdings Limited)

76 Annual Report 2017-18
Tube Investments of India Limited(Formerly known as TI Financial Holdings Limited)
(d) In our opinion, the aforesaid Standalone Ind AS Financial Statements comply with the Accounting Standards specified under section 133 of the Act, read with Companies (Indian Accounting Standards) Rules, 2015, as amended;
(e) On the basis of written representations received from the directors as on 31st March 2018, and taken on record by the Board of Directors, none of the directors is disqualified as on 31st March 2018, from being appointed as a director in terms of section 164 (2) of the Act;
(f) With respect to the adequacy of the internal financial controls over financial reporting of the Company and the operating effectiveness of such controls, refer to our separate Report in “Annexure 2” to this report;
(g) With respect to the other matters to be included in the Auditor’s Report in accordance with Rule 11 of the Companies (Audit and Auditors) Rules, 2014, in our opinion and to the best of our information and according to the explanations given to us:
i. The Company has disclosed the impact of pending litigations on its financial position in its Standalone Ind AS Financial Statements – Refer Note 37 to the Standalone Ind AS Financial Statements;
ii. The Company did not have any long-term contracts including derivative contracts for which there were any material foreseeable losses;
iii. There were no amounts which were required to be transferred to the Investor Education and Protection Fund by the Company;
For S.R. Batliboi & Associates LLPChartered Accountants
ICAI Firm Registration Number: 101049W/E300004
per Subramanian SureshPartner
Membership Number: 083673Place of Signature: ChennaiDate: 7th May 2018

Annual Report 2017-18 77
Corporate Overview Management Reports Financial Statements
(i) (a) The Company has maintained proper records showing full particulars, including quantitative details and situation of Property, Plant and Equipment.
(b) All property, plant and equipment have not been physically verified by the management during the year but there is a regular programme of verification which, in our opinion, is reasonable having regard to the size of the Company and the nature of its assets. No material discrepancies were noticed on such verification.
(c) According to the information and explanations given by the management and pursuant to the Scheme of Arrangement as detailed in Note 1.2 to the Standalone Ind AS Financial Statements, the title deeds of immovable properties included in Property, Plant and Equipment are held in the name of the Company.
(ii) The management has conducted physical verification of inventory at reasonable intervals during the year and no material discrepancies were noticed on such physical verification.
(iii) According to the information and explanations given to us, the Company has not granted any loans, secured or unsecured to companies, firms, limited liability partnerships or other parties covered in the register maintained under Section 189 of the Companies Act, 2013. Accordingly, the provisions of clause 3 (iii) (a), (b) and (c) of the Order are not applicable to the Company and hence not commented upon.
(iv) In our opinion and according to the information and explanations given to us, there are no loans, guarantees, and securities granted in respect of which provisions of Section 185 of the Companies Act 2013 are applicable and hence not commented upon. In our opinion and according to the information and explanations given to
us, provisions of Section 186, in respect of investments made have been complied with by the Company.
(v) The Company has not accepted any deposits within the meaning of Sections 73 to 76 of the Act and the Companies (Acceptance of Deposits) Rules, 2014 (as amended). Accordingly, the provisions of clause 3(v) of the Order are not applicable.
(vi) We have broadly reviewed the books of account maintained by the Company pursuant to the rules made by the Central Government for the maintenance of cost records under Section 148(1) of the Companies Act, 2013 relating to certain products of the Company to which such rules apply, and are of the opinion that prima facie, the specified accounts and records have been made and maintained. We have not, however, made a detailed examination of the same.
(vii) (a) The Company is regular in depositing with appropriate authorities undisputed statutory dues including provident fund, employees’ state insurance, income-tax, sales-tax, service tax, duty of custom, duty of excise, value added tax, goods and service tax, cess and other statutory dues applicable to it.
(b) According to the information and explanations given to us, no undisputed amounts payable in respect of provident fund, employees’ state insurance, income-tax, service tax, sales-tax, duty of custom, duty of excise, value added tax, goods and service tax, cess and other statutory dues were outstanding, at the year end, for a period of more than six months from the date they became payable.
(c) According to the records of the Company, the dues outstanding of income-tax, sales-tax, wealth-tax, service tax, customs duty, excise duty, value added tax and cess on account of any dispute, are as follows:
Name of the Statute Nature of the DuesForum where
dispute is pendingPeriod to which
the amount relatesAmount
` in Crores *
Central Excise Act, 1944Excise Duty / Interest / Penalty
CCE (Appeals) / CESTAT / HC
1995-96, 2002-03 to 2006-07 and 2013-14
0.20
Value Added Tax Act, 2005
VATJoint Commissioner, Pune, Maharashtra
2010-11 0.13
Central Sales Tax Act, 1956
CSTJoint Commissioner / AO / Tribunal
2011-12, 2013-14 and 2015-16 to 2017-18
1.21
Income Tax Act, 1961 Income Tax CIT (Appeals)2005-06, 2006-07, 2009-10 and 2011-12
7.15
* Net of amounts paid under protest of `73.88 Crores.
ANNEXURE 1 REFERRED TO IN OUR REPORT OF EVEN DATE
Re: Tube Investments of India Limited (formerly known as TI Financial Holdings Limited) (‘the Company’)

78 Annual Report 2017-18
Tube Investments of India Limited(Formerly known as TI Financial Holdings Limited)
(viii) In our opinion and according to the information and explanations given by the management, Company has not defaulted in repayment of dues to banks or debenture holders. The Company did not have any dues to in respect of loans and borrowings payable to financial institutions or government.
(ix) According to the information and explanations given by the management, the Company has not raised any money by way of initial public offer / further public offer / debt instruments) and term loans hence, reporting under clause (ix) is not applicable to the Company and hence not commented upon.
(x) Based upon the audit procedures performed for the purpose of reporting the true and fair view of the financial statements and according to the information and explanations given by the management, we report that no fraud by the Company or no fraud on the Company by the officers and employees of the Company has been noticed or reported during the year.
(xi) According to the information and explanations given by the management, the managerial remuneration has been paid / provided in accordance with the requisite approvals mandated by the provisions of Section 197 read with Schedule V to the Companies Act, 2013.
(xii) In our opinion, the Company is not a nidhi company. Therefore, the provisions of clause 3(xii) of the order are not applicable to the Company and hence not commented upon.
(xiii) According to the information and explanations given by the management, transactions with the related parties are
in compliance with Sections 177 and 188 of Companies Act, 2013 where applicable and the details have been disclosed in the notes to the financial statements, as required by the applicable accounting standards.
(xiv) According to the information and explanations given to us and on an overall examination of the Balance Sheet, the Company has not made any preferential allotment or private placement of shares or fully or partly convertible debentures during the year under review. Therefore the reporting requirements under clause 3(xiv) are not applicable to the Company and hence not commented upon.
(xv) According to the information and explanations given by the management, the Company has not entered into any non-cash transactions involving directors as referred to in Section 192 of Companies Act, 2013.
(xvi) According to the information and explanations given to us, the provisions of Section 45-IA of the Reserve Bank of India Act, 1934 are not applicable to the Company.
For S.R. Batliboi & Associates LLPChartered Accountants
ICAI Firm Registration Number: 101049W/E300004
per Subramanian SureshPartner
Membership Number: 083673Place of Signature: ChennaiDate: 7th May 2018

Annual Report 2017-18 79
Corporate Overview Management Reports Financial Statements
To the Members of Tube Investments of India Limited (formerly known as TI Financial Holdings Limited)
We have audited the internal financial controls over financial reporting of Tube Investments of India Limited (“the Company”) as of March 31, 2018 in conjunction with our audit of the Standalone Ind AS Financial Statements of the Company for the year ended on that date.
Management’s Responsibility for Internal Financial ControlsThe Company’s Management is responsible for establishing and maintaining internal financial controls based on the internal control over financial reporting criteria established by the Company considering the essential components of internal control stated in the Guidance Note on Audit of Internal Financial Controls Over Financial Reporting issued by the Institute of Chartered Accountants of India. These responsibilities include the design, implementation and maintenance of adequate internal financial controls that were operating effectively for ensuring the orderly and efficient conduct of its business, including adherence to the Company’s policies, the safeguarding of its assets, the prevention and detection of frauds and errors, the accuracy and completeness of the accounting records, and the timely preparation of reliable financial information, as required under the Companies Act, 2013.
Auditor’s ResponsibilityOur responsibility is to express an opinion on the Company's internal financial controls over financial reporting based on our audit. We conducted our audit in accordance with the Guidance Note on Audit of Internal Financial Controls Over Financial Reporting (the “Guidance Note”) and the Standards on Auditing as specified under section 143(10) of the Companies Act, 2013, to the extent applicable to an audit of internal financial controls, both applicable to an audit of Internal Financial Controls and, both issued by the Institute of Chartered Accountants of India. Those Standards and the Guidance Note require that we comply with ethical requirements and plan and perform the audit to obtain reasonable assurance about whether adequate internal financial controls over financial reporting was established and maintained and if such controls operated effectively in all material respects.
An audit involves performing procedures to obtain audit evidence about the adequacy of the internal financial controls system over financial reporting and their operating effectiveness. Our audit of internal financial controls over financial reporting included obtaining an understanding of internal financial controls over financial reporting, assessing the risk that a material weakness exists, and testing and evaluating the design and operating effectiveness of internal control based on the assessed risk. The procedures selected depend on the auditor’s judgement, including the assessment of the risks of material misstatement of the Financial Statements, whether due to fraud or error.
We believe that the audit evidence we have obtained is sufficient and appropriate to provide a basis for our audit
opinion on the internal financial controls system over financial reporting.
Meaning of Internal Financial Controls Over Financial Reporting
A Company's internal financial control over financial reporting is a process designed to provide reasonable assurance regarding the reliability of financial reporting and the preparation of financial statements for external purposes in accordance with generally accepted accounting principles. A company's internal financial control over financial reporting includes those policies and procedures that (1) pertain to the maintenance of records that, in reasonable detail, accurately and fairly reflect the transactions and dispositions of the assets of the company; (2) provide reasonable assurance that transactions are recorded as necessary to permit preparation of financial statements in accordance with generally accepted accounting principles, and that receipts and expenditures of the company are being made only in accordance with authorisations of management and directors of the company; and (3) provide reasonable assurance regarding prevention or timely detection of unauthorised acquisition, use, or disposition of the company's assets that could have a material effect on the financial statements.
Inherent Limitations of Internal Financial Controls Over Financial Reporting
Because of the inherent limitations of internal financial controls over financial reporting, including the possibility of collusion or improper management override of controls, material misstatements due to error or fraud may occur and not be detected. Also, projections of any evaluation of the internal financial controls over financial reporting to future periods are subject to the risk that the internal financial control over financial reporting may become inadequate because of changes in conditions, or that the degree of compliance with the policies or procedures may deteriorate.
Opinion
In our opinion, the Company has maintained, in all material respects, an adequate internal financial controls system over financial reporting and such internal financial controls over financial reporting were operating effectively as at March 31, 2018, based on the internal control over financial reporting criteria established by the Company considering the essential components of internal control stated in the Guidance Note on Audit of Internal Financial Controls Over Financial Reporting issued by the Institute of Chartered Accountants of India.
For S.R. Batliboi & Associates LLPChartered Accountants
ICAI Firm Registration Number: 101049W/E300004
per Subramanian SureshPlace of Signature: Chennai PartnerDate: 7th May 2018 Membership Number: 083673
ANNEXURE 2 TO THE INDEPENDENT AUDITOR’S REPORT OF EVEN DATE ON THE STANDALONE IND AS FINANCIAL STATEMENTS OF TUBE INVESTMENTS OF INDIA LIMTED (FORMERLY KNOWN AS TI FINANCIAL HOLDINGS LIMITED)
Report on the Internal Financial Controls under Clause (i) of Sub-section 3 of Section 143 of the Companies Act, 2013 (“the Act”)

80 Annual Report 2017-18
Tube Investments of India Limited(Formerly known as TI Financial Holdings Limited)
Balance Sheet` in Crores
Particulars NotesAs at
31-Mar-2018As at
31-Mar-2017ASSETSNon-Current AssetsProperty, Plant and Equipment 5 913.10 881.34Capital Work-in-Progress 89.60 33.10Investment Property 6 5.01 5.09Financial Assets (a) Investments - Investment in Subsidiaries and Joint ventures 7a 560.70 554.75 - Other Investments 7b 11.12 12.19 (b) Other Financial Assets 7c 17.58 17.99Deferred Tax Assets 15 31.50 38.11Non-Current Tax Assets 13.45 4.44Other Non-Current Assets 8 30.72 27.98
1,672.78 1,574.99Current AssetsInventories 9 607.23 580.72Financial Assets (a) Loans 10a 1.45 1.37 (b) Trade Receivables 10b 575.44 528.22 (c) Investments 10c - 102.08 (d) Cash and Cash Equivalents 10d 19.25 18.76 (e) Other Financial Assets 10e 23.55 13.04Other Current Assets 11 65.33 55.26
1,292.25 1,299.45Total Assets 2,965.03 2,874.44EQUITY AND LIABILITIESEquityEquity Share Capital 12 18.75 18.74Other Equity 13 1,194.39 1,123.27Total Equity 1,213.14 1,142.01Non-Current LiabilitiesFinancial Liabilities (a) Long Term Borrowings 14 200.00 350.00Deferred Tax Liabilities 15 59.71 64.38
259.71 414.38Current LiabilitiesFinancial Liabilities (a) Short Term Borrowings 16a 237.47 300.97 (b) Trade Payables 16b 876.80 717.00 (c) Derivative Instruments 16c 0.31 0.15 (d) Other Financial Liabilities 16d 296.23 227.27Government Grants 19c 1.08 1.38Short Term Provisions 17 58.99 49.72Other Current Liabilities 18 21.30 21.56
1,492.18 1,318.05Total Liabilities 1,751.89 1,732.43Total Equity and Liabilities 2,965.03 2,874.44Summary of Significant Accounting Policies 4
The accompanying notes are an integral part of the financial statementsAs per our report of even dateFor S.R. Batliboi & Associates LLPChartered AccountantsICAI Firm Regn. No : 101049W / E300004
On behalf of the BoardFor Tube Investments of India Limited
per Subramanian SureshPartnerMembership No : 083673
M M MurugappanChairman
Chennai7th May 2018
S SureshCompany Secretary
K Mahendra KumarChief Financial Officer
L RamkumarManaging Director

Annual Report 2017-18 81
Corporate Overview Management Reports Financial Statements
Statement of Profit and Loss` in Crores
Particulars NotesYear Ended 31-Mar-2018
Year Ended 31-Mar-2017
Revenue from Operations 20Sale of Products 4,409.98 4,207.77Other Operating Revenues 271.61 208.12
4,681.59 4,415.89Other Income 21 28.04 31.06Total Income 4,709.63 4,446.95ExpensesCost of Materials Consumed 22 2,698.32 2,473.84Purchase of Stock-in-Trade - Cycles / Components and Metal Formed Products 139.55 133.47Changes in Inventories of Finished Goods, Work-in-Progress and Stock-in-Trade 23 0.05 (107.94)Excise Duty on Sale of Goods and Scraps 20 83.38 307.32Employee Benefits Expense 24 432.91 398.63Depreciation and Amortisation Expense 25 128.30 121.25Finance Costs 26 56.38 72.05Other Expenses 27 952.80 846.83Total Expenses 4,491.69 4,245.45Profit Before Tax and Exceptional Items 217.94 201.50Less : Exceptional Items 28 25.25 -Profit Before Tax after Exceptional Items 192.69 201.50Income Tax Expense 29 - Current Tax 74.16 58.25 - Current Tax - earlier years (7.68) (16.94) - Deferred Tax (Net) (Refer Note 15) (10.25) 1.24
56.23 42.55Profit for the year (I) 136.46 158.95Other Comprehensive Income: 31Other Comprehensive Income to be reclassified to Statement of Profit and Loss in subsequent periods:Movement on Cash Flow Hedges 0.19 0.51Income Tax Effect (0.07) (0.18)
0.12 0.33Other Comprehensive Income not to be reclassified to Statement of Profit and Loss in subsequent periods:Re-measurement Gain / (Loss) on Defined Benefit Obligations (Net) 1.46 (4.13)Income Tax Effect (0.51) 1.43
0.95 (2.70)(Loss)/Gain on FVTOCI Equity Securities (Net) (1.07) 0.71Income Tax Effect 0.43 (0.01)
(0.64) 0.70Other Comprehensive Income / (Loss) for the Year, Net of Tax (II) 0.43 (1.67)Total Comprehensive Income for the Year, Net of Tax (I + II) 136.89 157.28Earnings Per Equity Share of `1 each (Previous year - `1 each) 32 Basic 7.28 8.48 Diluted 7.27 8.48
The accompanying notes are an integral part of the financial statementsAs per our report of even dateFor S.R. Batliboi & Associates LLPChartered AccountantsICAI Firm Regn. No : 101049W / E300004
On behalf of the BoardFor Tube Investments of India Limited
per Subramanian SureshPartnerMembership No : 083673
M M MurugappanChairman
Chennai7th May 2018
S SureshCompany Secretary
K Mahendra KumarChief Financial Officer
L RamkumarManaging Director

82 Annual Report 2017-18
Tube Investments of India Limited(Formerly known as TI Financial Holdings Limited)
Stat
emen
t of
Cha
nges
in E
quit
ya.
E
quit
y S
hare
Cap
ital
:
Par
ticul
ars
No.
of s
hare
s`
in C
rore
sA
s at
31st
Mar
ch 2
016
Equi
ty S
hare
s of
`1
each
issu
ed, s
ubsc
ribed
and
fully
pai
d 1
,10,0
00
0.11
Can
cella
tion
of S
hare
Cap
ital p
ursu
ant t
o th
e Sc
hem
e of
Arr
ange
men
t (Re
fer N
ote
2) (1
,10,0
00
) (0
.11)
Equi
ty S
hare
s of
`1
each
issu
ed p
ursu
ant t
o th
e Sc
hem
e of
Arr
ange
men
t (Re
fer N
ote
2) 1
8,74
,47,
871
18.
74A
s at
31st
Mar
ch 2
017
Equi
ty S
hare
s of
`1
each
issu
ed, s
ubsc
ribed
and
fully
pai
d 1
8,7
4,47
,871
18
.74
Issu
e of
sha
re c
apita
l (Re
fer N
ote
12)
88,
497
0.0
1A
s at
31st
Mar
ch 2
018
18
,75
,36
,36
8 1
8.7
5
b.
Oth
er E
quit
y
For
the
year
end
ed 3
1st M
arch
20
18
` in
Cro
res
Par
ticul
ars
Res
erve
s an
d S
urpl
usIt
ems
of O
CI
Tota
l O
ther
Eq
uity
Sec
uriti
es
Pre
miu
m
Res
erve
(Not
e 13
)
Sha
re
optio
n ou
tsta
ndin
g ac
coun
t(N
ote
13)
Ret
aine
d Ea
rnin
gs(N
ote
13)
Deb
entu
re
Red
empt
ion
Res
erve
(D
RR
)(N
ote
13)
Cap
ital
Res
erve
(Not
e 13
)
Gen
eral
R
eser
ve(N
ote
13)
Cas
h flo
w
Hed
ge
Res
erve
(Not
e 13
)
FVTO
CI
Res
erve
(Not
e 13
)
As
at 1
st A
pril
20
17 -
- 6
63.
17 1
18.7
5 0
.11 3
34.6
3 (0
.24)
6.8
5 1
,123.
27
Profi
t for
the
Year
- -
136
.46
- -
- -
- 1
36.4
6O
ther
com
preh
ensi
ve i
ncom
e fo
r th
e Ye
ar (N
ote
31)
- -
- -
- -
0.12
0.3
10.
43
Re-m
easu
rem
ent
Gai
n /
(Los
s)
on
Defi
ned
Ben
efit
Obl
igat
ions
(N
et)
tran
sfer
red
to R
etai
ned
Earn
ings
- -
0.9
5 -
- -
- (0
.95
) -
Exer
cise
of s
hare
opt
ions
0.10
- -
- -
- -
- 0
.10Sh
are-
base
d pa
ymen
ts -
5.4
3 -
- -
- -
- 5
.43
Deb
entu
res
Rede
mpt
ion
Rese
rve
(DR
R)
tran
sfer
red
to R
etai
ned
Earn
ings
(Net
) -
- 6
.25
(6.2
5)
- -
- -
-
Div
iden
ds -
- (6
0.9
4) -
- -
- -
(60.
94)
Div
iden
d D
istr
ibut
ion
Tax
on D
ivid
end
- -
(10.
36)
- -
- -
- (1
0.36
)A
s at
31st
Mar
ch 2
018
0.10
5.4
3 7
35.5
3 1
12.5
0 0
.11 3
34.6
3 (0
.12)
6.2
1 1
,194.
39

Annual Report 2017-18 83
Corporate Overview Management Reports Financial Statements
Stat
emen
t of
Cha
nges
in E
quit
y
For
the
year
end
ed 3
1st M
arch
20
17
` in
Cro
res
Par
ticul
ars
Res
erve
s an
d S
urpl
usIt
ems
of O
CI
Tota
l O
ther
Eq
uity
Sec
uriti
es
Pre
miu
m
Res
erve
(Not
e 13
)
Sha
re
optio
n ou
tsta
ndin
g ac
coun
t(N
ote
13)
Ret
aine
d Ea
rnin
gs(N
ote
13)
Deb
entu
re
Red
empt
ion
Res
erve
(D
RR
)(N
ote
13)
Cap
ital
Res
erve
(Not
e 13
)
Gen
eral
R
eser
ve(N
ote
13)
Cas
h flo
w
Hed
ge
Res
erve
(Not
e 13
)
FVTO
CI
Res
erve
(Not
e 13
)
As
at 1
st A
pril
20
16 -
- (0
.06
) -
- -
- -
(0.0
6)
Adj
ustm
ent
purs
uant
to
Sc
hem
e of
A
rran
gem
ent (
Refe
r Not
e 2)
- -
40
6.0
5 2
20.8
3 0
.11 3
34.6
3 (0
.87)
- 9
60.
75
Adj
ustm
ent
purs
uant
to
tr
ansi
tion
to
Ind
AS
- -
0.2
3 -
- -
0.3
0 4
.77
5.3
0
Rev
ised
as
at 1
st A
pril
20
16 -
- 4
06
.22
22
0.8
3 0
.11 3
34.6
3 (0
.57)
4.7
7 9
65
.99
Profi
t for
the
Year
- -
15
8.9
5 -
- -
- -
15
8.9
5
Oth
er C
ompr
ehen
sive
Inc
ome
for
the
Year
(Not
e 31
) -
- -
- -
- 0
.33
(2.0
0)
(1.6
7)
Re-m
easu
rem
ent
Gai
n /
(Los
s)
on
Defi
ned
Ben
efit
Obl
igat
ions
(N
et)
tran
sfer
red
to R
etai
ned
Earn
ings
- -
(4.0
8) -
- -
-4.
08
-
DR
R t
rans
ferr
ed t
o Re
tain
ed E
arni
ngs
(Net
) -
- 1
02.
08
(10
2.0
8) -
- -
- -
As
at 3
1st M
arch
20
17 -
- 6
63.
17 1
18.7
5 0
.11 3
34.6
3 (0
.24)
6.8
511
23.
27
The
acco
mpa
nyin
g no
tes
are
an in
tegr
al p
art o
f the
fina
ncia
l sta
tem
ents
As
per o
ur re
port
of e
ven
date
For S
.R. B
atlib
oi &
Ass
ocia
tes
LLP
Cha
rter
ed A
ccou
ntan
tsIC
AI F
irm R
egn.
No
: 10
1049
W /
E30
00
04
On
beha
lf of
the
Boa
rdFo
r Tub
e In
vest
men
ts o
f Ind
ia L
imite
d
per S
ubra
man
ian
Sur
esh
Part
ner
Mem
bers
hip
No
: 083
673
M M
Mur
ugap
pan
Cha
irman
Che
nnai
7th M
ay 2
018
S S
ures
hC
ompa
ny S
ecre
tary
K M
ahen
dra
Kum
arC
hief
Fin
anci
al O
ffice
rL
Ram
kum
arM
anag
ing
Dire
ctor

84 Annual Report 2017-18
Tube Investments of India Limited(Formerly known as TI Financial Holdings Limited)
Cash Flow Statement` in Crores
ParticularsYear Ended 31-Mar-2018
Year Ended 31-Mar-2017
A. Cash Flow from Operating Activities: Profit Before Tax after Exceptional Items 192.69 201.50 Adjustments to reconcile Profit Before Tax to Net Cash Flows: Depreciation on Property, Plant and Equipment 128.22 121.17 Depreciation on Investment Properties 0.08 0.08 Share based payment expenses 5.29 - Loss / (Profit) on Property Plant and Equipment sold/discarded (Net) 3.12 (1.08) Profit on Sale of Investments carried at FVTPL (2.03) (10.61) Provision / (Reversal of Provision) for Trade Receivables (Net) 1.08 (5.01) Net Foreign Exchange differences 0.24 (1.13) Finance Income (including Fair Value changes in Financial Instruments) (0.15) (5.43) Finance Costs 56.38 72.05 Liabilities / Provisions no longer payable written back (1.47) (1.22) Provision for Impairment of Investments 25.25 - Dividend Income (11.38) (0.52) Operating Profit before Working Capital / Other Changes 397.32 369.80 Adjustments for : Increase in Provisions and Government Grants 10.43 9.17 Increase in Trade and Other Payables 158.81 116.07 (Decrease) / Increase in Other Financial Liabilities (55.77) 57.78 Decrease in Other Current Liabilities (0.26) (2.65) Increase in Other Non-Current Assets (6.56) (1.17) (Increase) / Decrease in Other Financial and Current Assets (20.66) 0.68 Increase in Trade and Other Receivables (45.94) (36.01) Increase in Inventories (26.51) (122.41) Cash Generated From Operations 410.86 391.26 Income Tax paid (63.45) (35.90) Net Cash Flow from Operating Activities 347.41 355.36B. Cash Flow from Investing Activities: Capital Expenditure (Including Capital Work In Progress and Capital Advances) (215.97) (152.24) Proceeds from Sale of Property plant and equipment 3.52 8.06 Sale / (Purchase) of Current Investments (Net) (Refer Note 10c) 104.11 (91.39) Purchase of Non Current Investments (31.20) (10.00) Interest Income received 0.50 4.17 Dividend Received 11.38 0.52 Net Cash Used in Investing Activities (127.66) (240.88)C. Cash Flow from Financing Activities: Proceeds from Issue of Shares 0.11 0.01 Proceeds from Long Term Borrowings 100.00 100.00 Repayment of Long Term Borrowings (124.99) (732.90) (Repayment) / Proceeds from Short Term Borrowings (Net) (142.86) 56.49 Finance Costs Paid (60.07) (106.41) Dividends Paid (Including Net Dividend Distribution Tax) (71.30) - Net Cash Used in Financing Activities (299.11) (682.81) Net Decrease in Cash and Cash Equivalents [A+B+C] (79.36) (568.33) Cash and Cash Equivalents at the Beginning of the Year 9.57 0.05 Transferred to the Company pursuant to Scheme of Arrangement (Refer Note 2) - 577.85 Cash and Cash Equivalents as at End of the Year (Refer Note 10d) (69.79) 9.57
The accompanying notes are an integral part of the financial statementsAs per our report of even dateFor S.R. Batliboi & Associates LLPChartered AccountantsICAI Firm Regn. No : 101049W / E300004
On behalf of the BoardFor Tube Investments of India Limited
per Subramanian SureshPartnerMembership No : 083673
M M MurugappanChairman
Chennai7th May 2018
S SureshCompany Secretary
K Mahendra KumarChief Financial Officer
L RamkumarManaging Director

Annual Report 2017-18 85
Corporate Overview Management Reports Financial Statements
1. General Information of the Company
Corporate Information
Tube Investments of India Limited (“the Company”) with CIN No: L35100TN2008PLC069496, was formerly known as TI Financial Holdings Limited and is a Public Limited Company domiciled in India. The Company is listed on BSE and National Stock Exchange. The Registered Office of the Company is located at 234, NSC Bose Road, Chennai, Tamilnadu. The Company was originally incorporated as TI Financial Holdings Limited on 6th October 2008 under the Companies Act, 1956, as a wholly-owned subsidiary of erstwhile Tube Investments of India Limited (“Demerged Company”).
Pursuant to the Scheme of Arrangement (“the Scheme”) the details relating to which are more elaborately provided under Note 2 below, the Manufacturing Business Undertaking of the Demerged Company was vested in / transferred to the Company and the Name of the Company was changed to “Tube Investments of India Limited”.
The Company has manufacturing locations across the Country and has three product segments namely, Cycles and Accessories, Engineering and Metal Formed Products. The Company also has Subsidiaries and Joint Venture Companies, Viz., Shanthi Gears Limited, Financiere C10 SAS, Sedis SAS, Sedis Gmbh, SEDIS Co Limited, Great Cycles (Private) Limited, Creative Cycles (Private) Limited, TI Tsubamex Private Limited and TI Absolute Concepts Private Limited.
The standalone financial statements were authorised for issue in accordance with a resolution of the directors on 7th May 2018.
2. Scheme of Arrangement
The Scheme of Arrangement (“the Scheme”) between the Company (“Resulting Company”) and TI Financial Holdings Limited, formerly known as Tube Investments of India Limited (“Demerged Company”) and their Shareholders under Sections 230 to 232 and other applicable provisions of the Companies Act, 2013, was approved by the Board of Directors of both the Companies on 3rd November 2016.
The Demerged Company, interalia, was engaged in manufacturing of tubes, strips, tubular components, bicycles and fitness products, chains for automobile sector and industrial applications, roll-formed sections, other metal formed products, industrial gears, designing and manufacturing of dies (“Manufacturing
Business Undertaking”). The Manufacturing Business is also carried out through subsidiaries and Joint Venture Companies (Shanthi Gears Limited, Financiere C10 SAS, Sedis SAS, Sedis Gmbh, SEDIS Co Limited, TI Tsubamex Private Limited and TI Absolute Concepts Private Limited).
The Scheme provided for the demerger of the Manufacturing Business Undertaking of the Demerged Company into this Company, on a going concern basis, with effect from the appointed date of 1st April 2016.
The salient features of the Scheme of Arrangement are as under:
a. The Demerged Company and the Company has made applications and/or petitions under Section 230 read with Section 232 of the Companies Act, 2013 and other applicable provisions of the Companies Act, 2013 to the National Company Law Tribunal, Chennai (“Tribunal” or “NCLT”) for sanction of this Scheme and all matters ancillary or incidental thereto.
b. The whole of the undertaking and assets and properties of the Manufacturing Business Undertaking of the Demerged Company, shall stand transferred to and vested in the Company with all the rights, title and interest pertaining to the Manufacturing Business Undertaking.
c. The Scheme of Arrangement has become effective from the Appointed Date i.e. 1st April 2016 but operative from the Effective Date i.e. 1st August 2017 being the date of filing of a certified copy of the Order of NCLT by the Company and the Demerged Company with the Registrar of Companies, Tamil Nadu, Chennai.
d. Equity Share Capital of the Company
i. Equity Share Capital of `0.11 Cr. Of the Company as on the Appointed Date stands cancelled and credited to Capital Reserve.
ii. The Company has issued and alloted 1 (One) fully paid up Equity Share of `1 (Rupee One Only) each for every 1 (One) fully paid up Equity Share of `2 (Rupees Two) each held in the Demerged Company.
3. Basis of Preparation
The standalone financial statements of the Company have been prepared in accordance with Indian Accounting Standards (Ind AS) notified under the
Notes to Financial Statements

86 Annual Report 2017-18
Tube Investments of India Limited(Formerly known as TI Financial Holdings Limited)
Companies (Indian Accounting Standards) Rules, 2015, as amended.
The standalone financial statements have been prepared on a historical cost basis, except for the following assets and liabilities which have been measured at fair value:
- Derivative financial instruments
- Certain financial assets and financial liabilities measured at fair value (refer accounting policy regarding financial instruments)
The standalone financial statements are presented in INR and all values are rounded to the nearest crore, except when otherwise indicated.
4. Summary of Significant Accounting Policies
4.1. Presentation and Disclosure of Financial Statements
An asset has been classified as current when it satisfies any of the following criteria;
a) It is expected to be realized in, or is intended for sale or consumption in, the Company’s normal operating cycle;
b) It is held primarily for the purpose of being traded;
c) It is expected to be realized within twelve months after the reporting period; or
d) It is cash or cash equivalent unless it is restricted from being exchanged or used to settle a liability for at least twelve months after the reporting period.
A liability has been classified as current when it satisfies any of the following criteria;
a) It is expected to be settled in the Company’s normal operating cycle;
b) It is held primarily for the purpose of being traded;
c) It is due to be settled within twelve months after the reporting period; or
d) The Company does not have an unconditional right to defer settlements of the liability for at least twelve months after the reporting period. Terms of a liability that could, at the option of the counterparty, result in its settlement by the issue of equity instruments do not affect its classification.
All other assets and liabilities have been classified as non-current.
Deferred tax assets and liabilities are classified as non-current assets and liabilities.
Based on the nature of products / activities, the Company has determined its operating cycle as twelve months for the above purpose of classification as current and non-current.
4.2. Fair Value Measurement
The Company measures financial instruments, such as, derivatives at fair value at each Balance Sheet date.
Fair value is the price that would be received to sell an asset or paid to transfer a liability in an orderly transaction between market participants at the measurement date. The fair value measurement is based on the presumption that the transaction to sell the asset or transfer the liability takes place either:
a) In the principal market for the asset or liability, or
b) In the absence of a principal market, in the most advantageous market for the asset or liability
The fair value of an asset or a liability is measured using the assumptions that market participants would use when pricing the asset or liability, assuming that market participants act in their best economic interest.
A fair value measurement of a non-financial asset takes into account a market participant’s ability to generate economic benefits by using the asset in its highest and best use or by selling it to another market participant that would use the asset in its highest and best use.
The Company uses valuation techniques that are appropriate in the circumstances and for which sufficient data are available to measure fair value, maximising the use of relevant observable inputs and minimising the use of unobservable inputs.
All assets and liabilities for which fair value is measured or disclosed in the financial statements are categorised within the fair value hierarchy, described as follows, based on the lowest level input that is significant to the fair value measurement as a whole:
a) Level 1 - Quoted (unadjusted) market prices in active markets for identical assets or liabilities.
b) Level 2 - Valuation techniques for which the lowest level input that is significant to the fair value measurement is directly or indirectly observable.
c) Level 3 - Valuation techniques for which the lowest level input that is significant to the fair value measurement is unobservable.
Notes to Financial Statements

Annual Report 2017-18 87
Corporate Overview Management Reports Financial Statements
For assets and liabilities that are recognised in the financial statements on a recurring basis, the Company determines whether transfers have occurred between levels in the hierarchy by re-assessing categorisation (based on the lowest level input that is significant to the fair value measurement as a whole) at the end of each reporting period.
The Company determines the policies and procedures for both recurring fair value measurement, such as derivative instruments and unquoted financial assets measured at fair value, and for non-recurring measurement.
External valuers are involved for valuation of assets such as investment properties. Involvement of external valuers is decided upon annually by the Company. At each reporting date, the Company analyses the movements in the values of assets and liabilities which are required to be remeasured or re-assessed as per the accounting policies. For this analysis, the Company verifies the major inputs applied in the latest valuation by agreeing the information in the valuation computation to contracts and other relevant documents. Other fair value related disclosures are given in the relevant notes (Refer Note 42).
For the purpose of fair value disclosures, the Company has determined classes of assets and liabilities on the basis of the nature, characteristics and risks of the asset or liability and the level of the fair value hierarchy as explained above (Refer Note 42).
4.3. Use of Estimates
The preparation of Standalone Financial Statements in conformity with Ind AS requires the management to make judgments, estimates and assumptions that affect the reported amounts of revenues, expenses, assets and liabilities and the disclosure of contingent liabilities, like provision for employee benefits, provision for doubtful trade receivables / advances / contingencies, provision for warranties, allowance for slow / non-moving inventories, useful life of Property, Plant and Equipment, provision for retrospective price revisions, provision for taxation, etc., during and at the end of the reporting period. Although these estimates are based on the management’s best knowledge of current events and actions, uncertainty about these assumptions and estimates could result in the outcomes requiring a material adjustment to the carrying amounts of assets or liabilities in future periods.
4.4. Cash and Cash Equivalents
Cash comprises cash on hand and demand deposits with banks. Cash equivalents are short-term (with an original maturity of three months or less from the date of acquisition), highly liquid investments that are readily convertible into known amounts of cash and which are subject to insignificant risk of change in value.
4.5. Cash Flow Statement
Cash flows are reported using the indirect method, whereby profit / (loss) before tax is adjusted for the effects of transactions of non-cash nature and any deferrals or accruals of past or future cash receipts or payments.
For the purpose of the Statement of Cash Flows, cash and cash equivalents as defined above, net of outstanding bank overdrafts as they are considered an integral part of the cash management of the Company.
4.6. Property, Plant and Equipment
Property, Plant and Equipment are stated at historical cost less accumulated depreciation and impairment losses, if any. Freehold land is measured at cost and not depreciated. Cost includes related taxes, duties, freight, insurance, etc. attributable to the acquisition, installation of the Property, Plant and Equipment and borrowing cost if capitalisation criteria are met but excludes duties and taxes that are recoverable from tax authorities.
Machinery Spares including spare parts, stand-by and servicing equipment are capitalised as Property, Plant and Equipment if they meet the definition of Property, Plant and Equipment i.e. if the company intends to use these for more than a period of 12 months. These spare parts capitalized are depreciated as per Ind AS 16.
Subsequent expenditure relating to Property, Plant and Equipments is capitalised only if it is probable that future economic benefits associated with the item will flow to the Company and the cost of the item can be measured reliably.
Material replacement cost is capitalized provided it is probable that future economic benefits associated with the item will flow to the Company and the cost of the item can be measured reliably. When replacement cost is eligible for capitalization, the carrying amount of those parts that are replaced in derecognized. When significant parts of plant and equipment are required to be replaced at intervals, the Company depreciates them separately based on their specific useful life.
Notes to Financial Statements

88 Annual Report 2017-18
Tube Investments of India Limited(Formerly known as TI Financial Holdings Limited)
The Company identifies and determines cost of each component / part of the asset separately, if the component / part has a cost which is significant to the total cost of the asset and has useful life that is materially different from that of the remaining asset.
An item of property, plant and equipment and any significant part initially recognised is derecognised upon disposal or when no future economic benefits are expected from its use or disposal. Any gain or loss arising on derecognition of the asset (calculated as the difference between the net disposal proceeds and the carrying amount of the asset) is included in the Statement of Profit and Loss when the asset is derecognised.
The residual values, useful lives and methods of depreciation of Property, Plant and Equipment are reviewed at each financial year end and adjusted prospectively, if appropriate.
Capital Work-in-Progress: Projects under which assets are not ready for their intended use and other capital work-in-progress are carried at cost, comprising direct cost and attributable interest. Once it has become available for use, their cost is re-classified to appropriate caption and subjected to depreciation.
4.7. Investment Properties
Investment property represents property held to earn rentals or for capital appreciation or both.
Investment properties are measured initially at cost, including transaction costs. Subsequent to initial recognition, investment properties are stated at cost less accumulated depreciation and accumulated impairment loss, if any.
The cost includes the cost of replacing parts and borrowing costs for long-term construction projects if the recognition Criteria are met. When significant parts of the investment property are required to be replaced at intervals, the Company depreciates them separately based on their specific useful lives. All other repair and maintenance costs are recognised in the Statement of Profit and Loss as incurred.
Depreciation on building classified as Investment Property has been provided on the straight-line method over a period of 60 years as prescribed in Schedule II to the Companies Act, 2013. These are based on the Company’s estimate of their useful lives taking into consideration technical factors.
Though the Company measures Investment Property using cost based measurement, the fair value of investment property is disclosed in the notes. Fair values are determined based on an annual evaluation performed by an external independent valuer applying valuation models.
Investment properties are derecognised either when they have been disposed of or when they are permanently withdrawn from use and no future economic benefit is expected from their disposal. The difference between the net disposal proceeds and the carrying amount of the asset is recognised in the Statement of Profit and Loss in the period of derecognition.
4.8. Impairment of Non-Financial Assets
The Company assesses at each reporting date whether there is an indication that an asset may be impaired. If any indication exists, the Company estimates the asset’s recoverable amount. An asset’s recoverable amount is the higher of an asset’s or cash-generating unit’s (CGU) net selling price and its value in use. The recoverable amount is determined for an individual asset, unless the asset does not generate cash inflows that are largely independent of those from other assets or groups of assets. Where the carrying amount of an asset or CGU exceeds its recoverable amount, the asset is considered impaired and is written down to its recoverable amount. In assessing value in use, the estimated future cash flows are discounted to their present value using a pre-tax discount rate that reflects current market assessments of the time value of money and the risks specific to the asset. In determining fair value less costs of disposal, recent market transactions are taken into account, if available. If no such transactions can be identified, an appropriate valuation model is used.
The Company bases its impairment calculation on detailed budgets and forecast calculations which are prepared separately for each of the Company’s cash-generating units to which the individual assets are allocated. These budgets and forecast calculations are generally covering a period of three years. For longer periods, a long term growth rate is calculated and applied to project future cash flows after the third year. To estimate cash flow projections beyond periods covered by the most recent budgets / forecasts, the Company extrapolates cash flow projections in the budget using a steady or declining growth rate for subsequent years, unless an increasing rate can be justified. In any case, this growth rate does not exceed the long-term average growth rate for the products,
Notes to Financial Statements

Annual Report 2017-18 89
Corporate Overview Management Reports Financial Statements
industries, or country or countries in which the entity operates, or for the market in which the asset is used.
Impairment including impairment on inventories, are recognized in the Statement of Profit and Loss.
An assessment is made at each reporting date as to whether there is any indication that previously recognized impairment losses may no longer exist or may have decreased. If such indication exists, the Company estimates the asset’s or cash-generating unit’s recoverable amount. A previously recognized impairment loss is reversed only if there has been a change in the assumptions used to determine the asset’s recoverable amount since the last impairment loss was recognized. The reversal is limited so that the carrying amount of the asset does not exceed its recoverable amount, nor exceed the carrying amount that would have been determined, net of depreciation, had no impairment loss been recognized for the asset in prior years.
After impairment, depreciation is provided on the revised carrying amount of the asset over its remaining useful life.
4.9. Inventories
Raw materials, stores and spare parts and stock-in-trade are valued at lower of weighted average cost and estimated net realisable value. Cost includes freight, taxes and duties and is net of Credit under VAT, CENVAT and GST scheme, where applicable.
Work-in-progress and finished goods are valued at lower of weighted average cost and estimated net realisable value. Cost includes all direct costs and appropriate proportion of overheads to bring the goods to the present location and condition based on the normal operating capacity, but excluding borrowing costs. Cost of finished goods includes Excise Duty.
Materials and other items held for use in the production of inventories are not written down below cost if the finished products in which they will be used are expected to be sold at or above cost.
Net realizable value is the estimated selling price in the ordinary course of business, less estimated costs of completion and estimated costs necessary to make the sale.
4.10. Revenue and Other Income
Revenue is recognized to the extent that it is probable that the economic benefits will flow to the Company
and the revenue can be reliably measured, regardless of when the payment is being made. Revenue is measured at the fair value of the consideration received or receivable, taking into account contractually defined terms of payment. The Company is the principal in all of its revenue arrangements since it is the primary obligor in all the revenue arrangements as it has pricing latitude and is also exposed to inventory and credit risks.
The Company has assumed that recovery of excise duty flows to the Company on its own account. This is for the reason that it is a liability of the manufacturer which forms part of the cost of production, irrespective of whether the goods are sold or not. Since the recovery of excise duty flows to the Company on its own account, revenue includes excise duty.
However, sales tax / value added tax (VAT) and Goods and Services tax (GST) are not received by the Company on its own account. Rather, it is tax collected on value added to the commodity by the seller on behalf of the government. Accordingly, it is excluded from revenue.
The specific recognition Criteria described below must also be met before revenue is recognised.
Sale of Goods:
Revenue from sale of goods is recognised on transfer of significant risk and rewards of ownership to the buyer which generally coincides with shipment. Revenue from the sale of goods is measured at the fair value of the consideration received or receivable, net of returns and allowances, trade discounts and volume rebates.
Rendering of Services:
Revenue from rendering of services is recognised with reference to the stage of completion determined based on estimate of work performed, and when the outcome of the transaction can be estimated reliably.
Dividends:
Dividend income is accounted for when the right to receive it is established.
Interest Income:
For all debt instruments measured at amortised cost, interest income is recognised on time proportion basis, taking into account the amount outstanding and effective interest rate.
Rental Income:
Rental income arising from operating leases is accounted for on a straight-line basis over the lease
Notes to Financial Statements

90 Annual Report 2017-18
Tube Investments of India Limited(Formerly known as TI Financial Holdings Limited)
terms and is included in revenue in the Statement of Profit and Loss due to its operating nature.
4.11. Government Grants, Subsidies and Export Benefits
Government grants and subsidies are recognised when there is reasonable assurance that the Company will comply with the conditions attached to them and the grants / subsidy will be received.
When the grant or subsidy from the Government relates to an expense item, it is recognised as income on a systematic basis in the Statement of Profit and Loss over the period necessary to match them with the related costs, which they are intended to compensate. When the grant relates to an asset, it is recognised as income in equal amounts over the expected useful life of the related asset.
When the Company receives grants of non-monetary assets, the asset and the grant are recorded at fair value amounts and released to profit or loss over the expected useful life in a pattern of consumption of the benefit of the underlying asset, i.e. by equal annual instalments. When loans or similar assistance are provided by governments or related institutions, with an interest rate below the current applicable market rate, the effect of this favourable interest is regarded as a government grant. The loan or assistance is initially recognised and measured at fair value of the proceeds received. The loan is subsequently measured as per the accounting policy applicable to financial liabilities.
Export benefits are accounted for in the year of exports based on eligibility and when there is no uncertainty in receiving the same.
4.12. Employee Benefits
I. Defined Contribution Plan
a. Superannuation
The Company contributes a sum equivalent to 15% of the eligible employees salary to a Superannuation Fund administered by trustees and managed by Life Insurance Corporation of India (LIC). The Company has no liability for future Superannuation Fund benefits other than its annual contribution and recognizes such contributions as an expense in the year in which the services are rendered.
b. Provident Fund
Contributions in respect of Employees who are not covered by Company’s Employees Provident Fund Trust are made to the Regional
Provident Fund. These Contributions are recognised as expense in the year in which the services are rendered. The Company has no obligation other than the contribution payable to the Regional Provident fund.
c. Employee State Insurance
Contributions to Employees State Insurance Scheme are recognised as expense in the year in which the services are rendered.
II. Defined Benefit Plan
a. Gratuity
The Company makes annual contribution to a Gratuity Fund administered by trustees and the Contributions are invested in a Scheme with Life Insurance Corporation of India, as permitted by Indian Law. The Company accounts its liability for future gratuity benefits based on actuarial valuation, as at the Balance Sheet date, determined every year using the Projected Unit Credit method.
Re-measurements, comprising of actuarial gains / losses, the effect of the asset ceiling, excluding amounts included in net interest on the net defined benefit liability and the return on plan assets (excluding amounts included in net interest on the net defined benefit liability), are immediately recognised in the Balance Sheet with a corresponding debit or Credit in to retained earnings through Other Comprehensive Income in the period in which they occur. Re-measurements are not re-classified to profit or loss in subsequent periods.
Past service cost is recognised in profit or loss on the earlier of the date of the plan amendment or curtailment, and the date that the Company recognises related restructuring costs.
Net interest is calculated by applying the discount rate to the net defined benefit liability or asset. The Company recognises the following changes in the net defined benefit obligation as an expense in the Statement of Profit and Loss:
- Service costs comprising current service costs, past-service costs and
- Net interest expense or income.
Notes to Financial Statements

Annual Report 2017-18 91
Corporate Overview Management Reports Financial Statements
b. Provident Fund
In respect of the employees not covered under Point I b above, contributions to the Company’s Employees Provident Fund Trust are made in accordance with the fund rules. The interest rate payable to the beneficiaries every year is being notified by the Government.
In the case of contribution to the Trust, the Company has an obligation to make good the shortfall, if any, between the return from the investments of the Trust and the notified interest rate and recognizes such obligation, if any, determined based on an actuarial valuation as at the Balance Sheet date, as an expense.
III. Long Term Compensated Absences
The Company treats accumulated leave expected to be carried forward beyond twelve months, as long-term employee benefit for measurement purposes. Such long-term compensated absences are provided for based on the actuarial valuation using the projected unit Credit method at the year-end. Remeasurements as a result of experience adjustments and changes in actuarial assumptions are recognised in Statement of Profit and Loss. The Company presents the leave as a current liability in the Balance Sheet, to the extent it does not have an unconditional right to defer its settlement for 12 months after the reporting date. Where Company has the unconditional legal and contractual right to defer the settlement for a period beyond 12 months, the same is presented as non-current liability.
IV. Short Term Employee Benefits
Short term employee benefits includes short term compensated absences which is recognized based on the eligible leave at Credit on the Balance Sheet date, and the estimated cost is based on the terms of the employment contract.
V. Voluntary Retirement Scheme
Compensation to employees under Voluntary Retirement Schemes is expensed in the period in which the liability arises. The Company recognizes termination benefit as a liability and an expense when the Company has a present obligation as a result of past event, it is probable that an outflow
of resources embodying economic benefits will be required to settle the obligation and a reliable estimate can be made of the amount of the obligation.
4.13. Leases
The determination of whether an arrangement is or contains a lease is based on the substance of the arrangement at the inception of the lease. The arrangement is, or contains, a lease if fulfilment of the arrangement is dependent on the use of a specific asset or assets and the arrangement conveys a right to use the asset or assets, even if that right is not explicitly specified in an arrangement.
Operating Lease
Leases where the lessor effectively retains substantially all the risks and benefits of ownership of the leased assets are classified as operating leases. Operating lease payments are recognised as an expense in the Statement of Profit and Loss on a straight line basis over the lease term.
4.14. Foreign Currency Transactions
Initial recognition
Transactions in foreign currencies entered into by the Company are accounted at the exchange rates prevailing on the date of the transaction or at the average rates that closely approximate the rate at the date of the transaction.
Measurement as at Balance Sheet date
Foreign currency monetary items of the Company outstanding at the Balance Sheet date are restated at year end exchange rates.
Non-monetary items carried at historical cost are translated using the exchange rates at the dates of initial transactions.
Treatment of Exchange Differences
Exchange differences arising on settlement /restatement of foreign currency monetary assets and liabilities of the Company are recognised as income or expense in the Statement of Profit and Loss.
4.15. Derivative Instruments and Hedge Accounting
The Company uses Cash flow hedges (forward contracts and currency swaps) to hedge its risks associated with foreign currency fluctuations relating to firm commitment or highly probable forecast
Notes to Financial Statements

92 Annual Report 2017-18
Tube Investments of India Limited(Formerly known as TI Financial Holdings Limited)
transactions. At the inception of a hedge relationship, the Company formally designates and documents the hedge relationship to which the Company wishes to apply hedge accounting and the risk management objective and strategy for undertaking the hedge by applying the hedge accounting principles set out in Ind AS 109 – “Financial Instruments”.
The use of Derivative Contracts is governed by the Company’s policies on the use of such financial derivatives consistent with the Company’s risk management strategy. The Company does not use derivative financial instruments for speculative purposes.
Derivative Contracts are measured at fair value. Derivatives are carried as financial assets when the fair value is positive and as financial liabilities when the fair value is negative. Changes in the fair value of these Derivative Contracts that are designated and effective as hedges of future cash flows are recognised directly in “Other Comprehensive Income” and the ineffective portion is recognized immediately in the Statement of Profit and Loss.
Changes in the fair value of Derivative Contracts that do not qualify for hedge accounting are recognized in the Statement of Profit and Loss as they arise.
The amounts recognised in the Other Comprehensive Income are transferred to the Statement of Profit and Loss when the hedged transactions crystalizes.
If the forecast transaction is no longer expected to occur, the cumulative gain or loss previously recognised in Other Comprehensive Income is transferred to Statement of Profit and Loss.
Hedge accounting is discontinued when the hedging instrument expires or is sold, terminated, or exercised. If any of these events occur or if a hedged transaction is no longer expected to occur, the net cumulative gain or loss recognised under Other Comprehensive Income is transferred to the Statement of Profit and Loss for the year.
At the inception of a hedge relationship, the Company formally designates and documents the hedge relationship to which the Company wishes to apply hedge accounting and the risk management objective and strategy for undertaking the hedge. The documentation includes the Company’s risk management objective and strategy for undertaking hedge, the hedging / economic relationship, the hedged
item or transaction, the nature of the risk being hedged, hedge ratio and how the Company will assess the effectiveness of changes in the hedging instrument’s fair value in offsetting the exposure to changes in the hedged item’s fair value or cash flows attributable to the hedged risk. Such hedges are expected to be highly effective in achieving offsetting changes in fair value or cash flows and are assessed on an ongoing basis to determine that they actually have been highly effective throughout the financial reporting periods for which they were designated.
4.16. Depreciation and Amortisation
The Company depreciates Property, Plant and Equipment over their estimated useful lives using the Straight-line method, as per Schedule II of Companies Act, 2013. The estimated useful lives are as follows:
Description of Assets Useful life
Plant and Machinery 7.50 - 15 Years
Electrical Appliances 5 - 10 Years
Furniture and Fixtures 10 Years
Factory Buildings 30 Years
Other Buildings 60 Years
Vehicles 4 Years
The following category of Property, Plant and Equipment are not depreciated as per Schedule II of Companies Act, 2013. These category of Property, Plant and Equipment are depreciated based on the Company’s estimate of their useful lives taking into consideration, technical advise:
Description of Assets Useful life
Buildings - Roof structure on certain factory areas, where useful life is less
10 Years
Plant and Machinery - Special tools and special purpose machines used in door frame products
4 Years
Plant and Machinery - Electrical Appliances such as Air Conditioner, Fridge, Water Cooler, Camera, TV, Grinder etc.,
5 Years
Office Equipment - Data Processing Equipment
3 Years
Vehicles - Motor Vehicles 4 Years
Finance lease assets are depreciated over the primary lease period of 35 years - 95 years, as the right to use these assets ceases on expiry of the lease period.
Depreciation is provided pro-rata from the month of Capitalisation.
Notes to Financial Statements

Annual Report 2017-18 93
Corporate Overview Management Reports Financial Statements
Certain Property, Plant and Equipment are treated as Continuous Process Plants based on technical evaluation done by the Management and are depreciated on the straight-line method based on the useful life as prescribed in Schedule II to the Companies Act, 2013.
4.17. Research and Development
Revenue expenditure on research and development is expensed when incurred. Capital Expenditure on Research and Development is capitalised under Property, Plant and Equipment and depreciated in accordance with Note 4.16 above.
4.18. Taxes on Income
Income tax expense comprises current and deferred taxes. Income tax expense is recognized in the Statement of Profit and Loss except to the extent it relates to items recognized directly in Equity, in which case it is recognized in Equity.
Current tax is the amount of tax payable on the taxable income for the year and is determined in accordance with the provisions of the Income Tax Act, 1961.
Current tax relating to items recognised outside profit or loss is recognised outside profit or loss (either in Other Comprehensive Income or in Equity). Current tax items are recognised in correlation to the underlying transaction either in OCI or directly in Equity.
Minimum Alternate Tax (MAT) paid in a year is charged to the Statement of Profit and Loss as current tax for the year. The company recognizes MAT credit only to the extent that it is probable that the company will pay normal income tax during the specified period, i.e., the period for which MAT credit is allowed to be carried forward. In the year in which the company recognizes MAT credit as an asset, it is created by way of credit to the Statement of Profit and Loss and shown as Deferred Tax Asset. The company reviews the “MAT credit entitlement” asset at each reporting date and writes down the asset to the extent that it is probable that it will pay normal tax during the specified period.
Deferred Tax is provided using the liability method on temporary differences between the tax bases of assets and liabilities and their carrying amounts for financial reporting purposes at the reporting date.
Deferred Tax Liabilities are recognised for all taxable temporary differences, except when the Deferred Tax Liability arises from the initial recognition of goodwill or an asset or liability in a transaction that is not a business
combination and, at the time of the transaction, affects neither the accounting profit nor taxable profit or loss.
Deferred Tax Assets are recognised for all deductible temporary differences, the carry forward of unused tax credits and any unused tax losses. Deferred Tax Assets are recognised to the extent that it is probable that taxable profit will be available against which the deductible temporary differences, and the carry forward of unused tax credits and unused tax losses can be utilised, except when the deferred tax asset relating to the deductible temporary difference arises from the initial recognition of an asset or liability in a transaction that is not a business combination and, at the time of the transaction, affects neither the accounting profit nor taxable profit or loss.
The carrying amount of Deferred Tax Assets is reviewed at each reporting date and reduced to the extent that it is no longer probable that sufficient taxable profit will be available to allow all or part of the Deferred Tax asset to be utilised. Unrecognised Deferred Tax assets are re-assessed at each reporting date and are recognised to the extent that it has become probable that future taxable profits will allow the Deferred Tax Asset to be recovered.
Deferred Tax Assets and liabilities are measured at the tax rates that are expected to apply in the year when the asset is realised or the liability is settled, based on tax rates (and tax laws) that have been enacted or substantively enacted at the reporting date.
Deferred Tax relating to items recognised outside the Statement of Profit and Loss is recognised outside Statement of Profit and Loss (either in Other Comprehensive Income or in Equity). Deferred Tax items are recognised in correlation to the underlying transaction either in OCI or directly in Equity.
Deferred Tax Assets and Deferred Tax Liabilities are offset if a legally enforceable right exists to set off current tax assets against current tax liabilities and the deferred taxes relate to the same taxable Company and the same taxation authority.
In the situations where the Company is entitled to a tax holiday under the Income-Tax Act, 1961, no deferred tax (asset or liability) is recognized in respect of timing differences which reverse during the tax holiday period, to the extent the Company’s gross total income is subject to the deduction during the tax holiday period. Deferred tax in respect of timing differences which reverse after the tax holiday period is recognized in the year in which the timing differences originate.
Notes to Financial Statements

94 Annual Report 2017-18
Tube Investments of India Limited(Formerly known as TI Financial Holdings Limited)
4.19. Provisions and Contingencies
A provision is recognized when a Company has a present obligation (legal or constructive) as a result of past event; it is probable that an outflow of resources will be required to settle the obligation, in respect of which a reliable estimate can be made. Provisions are determined based on best estimate required to settle the obligation at the Balance Sheet date. These are reviewed at each Balance Sheet date and adjusted to reflect the current best estimates.
If the effect of the time value of money is material, provisions are discounted using a current pre-tax rate that reflects, when appropriate, the risks specific to the liability. When discounting is used, the increase in the provision due to the passage of time is recognised as a finance cost.
Provisions for warranty-related costs are recognized when the product is sold or service provided. Provision is estimated based on historical experience and technical estimates. The estimate of such warranty-related costs is reviewed annually.
A contingent liability is a possible obligation that arises from past events whose existence will be confirmed by the occurrence or non-occurrence of one or more uncertain future events beyond the control of the Company or a present obligation that is not recognized because it is not probable that an outflow of resources will be required to settle the obligation. The Company does not recognize a contingent liability but discloses its existence in the Standalone Financial Statements.
4.20. Borrowing Costs
Borrowing costs consist of interest and other costs that an entity incurs in connection with the borrowing of funds. Borrowing cost also includes exchange differences to the extent regarded as an adjustment to the borrowing costs. Borrowing costs directly attributable to the acquisition, construction or production of an asset that necessarily takes a substantial period of time to get ready for its intended use or sale are capitalised as part of the cost of the asset. Capitalisation of Borrowing Costs is suspended and charged to the Statement of Profit and Loss during extended periods when active development activity on the qualifying assets is interrupted. All other borrowing costs are expensed in the period they occur.
4.21. Earnings Per Share
Basic Earnings Per Share is calculated by dividing the net profit or loss for the period attributable to Equity
Shareholders by the weighted average number of Equity Shares outstanding during the period.
The weighted average number of Equity Shares outstanding during the period and for all periods presented is adjusted for events, such as bonus shares, other than the conversion of potential Equity Shares, that have changed the number of Equity Shares outstanding, without a corresponding change in resources. For the purpose of calculating diluted earnings per share, the net profit or loss for the period attributable to Equity Shareholders and the weighted average number of shares outstanding during the period is adjusted for the effects of all dilutive potential Equity Shares.
4.22. Share Based Payments (Employees Stock Option Scheme)
Stock options are granted to the employees under the stock option scheme. The costs of stock options granted to the employees (equity-settled awards) of the company are measured at the fair value of the equity instruments granted. For each stock option, the measurement of fair value is performed on the grant date. The grant date is the date on which the Company and the employees agree to the stock option scheme. The fair value so determined is revised only if the stock option scheme is modified in a manner that is beneficial to the employees.
This cost is recognised, together with a corresponding increase in share-based payment (SBP) reserves / stock options outstanding account in Equity, over the period in which the performance and / or service conditions are fulfilled in employee benefits expense. The cumulative expense recognised for equity-settled transactions at each reporting date until the vesting date reflects the extent to which the vesting period has expired and the Company’s best estimate of the number of equity instruments that will ultimately vest. The Statement of Profit and Loss expense or Credit for a period represents the movement in cumulative expense recognised as at the beginning and end of that period and is recognised in employee benefits expense.
The dilutive effect of outstanding options is reflected as additional share dilution in the computation of diluted earnings per share.
If the options vests in instalments (i.e. the options vest pro rata over the service period), then each instalment is treated as a separate share option grant because each instalment has a different vesting period.
Notes to Financial Statements

Annual Report 2017-18 95
Corporate Overview Management Reports Financial Statements
4.23. Financial Instruments
A financial instrument is any contract that gives rise to a financial asset of one Company and a financial liability or equity instrument of another company.
A. Financial Assets
i. Initial Recognition and Measurement
All financial assets are recognised initially at fair value plus, in the case of financial assets not recorded at fair value through profit or loss, transaction costs that are attributable to the acquisition of the financial asset.
ii. Subsequent Measurement
For purposes of subsequent measurement, financial assets are classified in three categories:
a. Debt instruments at amortised cost
b. Debt instruments, derivatives and equity instruments at fair value through profit or loss (FVTPL)
c. Equity instruments measured at fair value through Other Comprehensive Income (FVTOCI)
Debt instruments At Amortised Cost
A ‘debt instrument’ is measured at the amortised cost if both the following conditions are met:
• The asset is held within a business model whose objective is to hold assets for collecting contractual cash flows, and
• Contractual terms of the asset give rise on specified dates to cash flows that are solely payments of principal and interest (SPPI) on the principal amount outstanding.
After initial measurement, such financial assets are subsequently measured at amortised cost using the effective interest rate (EIR) method. Amortised cost is calculated by taking into account any discount or premium on acquisition and fees or costs that are an integral part of the EIR. The EIR amortisation is included in finance income in the profit or loss. The losses arising from impairment
are recognised in the profit or loss. This category generally applies to trade and other receivables.
Debt Instruments at FVTPL
FVTPL is a residual category for debt instruments. Any debt instrument, which does not meet the Criteria for categorization as at amortized cost or as FVTOCI, is classified as at FVTPL.
Debt instruments included within the FVTPL category are measured at fair value with all changes recognized in the P&L.
Equity Investments
All equity investments in scope of Ind-AS 109 are measured at fair value. Equity instruments which are held for trading are classified as at FVTPL. For all other equity instruments, the Company decides to classify the same either as at FVTOCI or FVTPL. The Company makes such election on an instrument-by-instrument basis. The classification is made on initial recognition and is irrevocable.
If the Company decides to classify an equity instrument as at FVTOCI, then all fair value changes on the instrument, excluding dividends, are recognized in the OCI. There is no recycling of the amounts from OCI to P&L, even on sale of investment. However, the Company may transfer the cumulative gain or loss within Equity.
iii. De-recognition
A financial asset (or, where applicable, a part of a financial asset or part of a Company of similar financial assets) is primarily when:
• The rights to receive cash flows from the asset have expired, or
• the Company has transferred substantially all the risks and rewards of the asset or has transferred control of the asset.
iv. Impairment of Financial Assets
In accordance with Ind-AS 109, the Company applies Expected Credit Loss (ECL) model for measurement and recognition of impairment loss on the following financial assets and Credit risk exposure:
Notes to Financial Statements

96 Annual Report 2017-18
Tube Investments of India Limited(Formerly known as TI Financial Holdings Limited)
• Financial assets that are debt instruments, and are measured at amortised cost e.g., loans, debt securities, deposits, trade receivables and bank balance.
The Company follows ‘simplified approach’ for recognition of impairment loss allowance on Trade receivables.
The application of simplified approach does not require the Company to track changes in Credit risk. Rather, it recognises impairment loss allowance based on lifetime ECLs at each reporting date, right from its initial recognition. For recognition of impairment loss on other financial assets, the Company determines that whether there has been a significant increase in the Credit risk since initial recognition. If Credit risk has not increased significantly, 12-month ECL is used to provide for impairment loss. However, if Credit risk has increased significantly, lifetime ECL is used. If, in a subsequent period, Credit quality of the instrument improves such that there is no longer a significant increase in Credit risk since initial recognition, then the entity reverts to recognising impairment loss allowance based on 12-month ECL.
Lifetime ECL are the expected Credit losses resulting from all possible default events over the expected life of a financial instrument. ECL is the difference between all contractual cash flows that are due to the Company in accordance with the contract and all the cash flows that the Company expects to receive, discounted at the original EIR. When estimating the cash flows, the Company is required to consider:
• All contractual terms of the financial instrument (including prepayment, extension, call and similar options) over the expected life of the financial instrument. However, in rare cases when the expected life of the financial instrument cannot be estimated reliably, then the Company is required to use the remaining contractual term of the financial instrument
• Cash flows from the sale of collateral held or other Credit enhancements that are integral to the contractual terms
As a practical expedient, the Company uses a provision matrix to determine impairment loss allowance on portfolio of its trade receivables. The provision matrix is based on its historically observed default rates over the expected life of the trade receivables and is adjusted for forward-looking estimates. At every reporting date, the historical observed default rates are updated and changes in the forward-looking estimates are analysed.
ECL impairment loss allowance (or reversal) recognized during the period is recognized as income / expense in the Statement of Profit and Loss (P&L). This amount is reflected under the head ‘other expenses’ in the P&L. The Balance Sheet presentation for various financial instruments is described below:
• Financial assets measured as at amortised cost: ECL is presented as an allowance, i.e., as an integral part of the measurement of those assets in the Balance Sheet. The allowance reduces the net carrying amount. Until the asset meets write-off Criteria, the Company does not reduce impairment allowance from the gross carrying amount.
For assessing increase in Credit risk and impairment loss, the Company combines financial instruments on the basis of shared Credit risk characteristics with the objective of facilitating an analysis that is designed to enable significant increases in Credit risk to be identified on a timely basis.
B. Financial Liabilities
i. Initial Recognition and Measurement
All financial liabilities are recognised initially at fair value and, in the case of loans and borrowings and payables, net of directly attributable transaction costs.
The Company’s financial liabilities include trade and other payables, loans and borrowings including bank overdrafts and derivative financial instruments.
ii. Subsequent Measurement
The measurement of financial liabilities depends on their classification, as described below:
Notes to Financial Statements

Annual Report 2017-18 97
Corporate Overview Management Reports Financial Statements
Financial Liabilities At Fair Value Through Profit and Loss
Financial liabilities at fair value through profit or loss include derivatives. Financial liabilities are classified as held for trading if they are incurred for the purpose of repurchasing in the near term. This category also includes derivative financial instruments entered into by the Company that are not designated as hedging instruments in hedge relationships as defined by Ind AS 109. Separated embedded derivatives are also classified as held for trading unless they are designated as effective hedging instruments.
Gains or losses on liabilities held for trading are recognised in the profit or loss.
Financial liabilities designated upon initial recognition at fair value through profit or loss are designated as such at the initial date of recognition, and only if the Criteria in Ind AS 109 are satisfied. For liabilities designated as FVTPL, fair value gains / losses attributable to changes in own Credit risks are recognized in OCI. These gains / loss are not subsequently transferred to P&L. However, the Company may transfer the cumulative gain or loss within Equity. All other changes in fair value of such liability are recognised in the Statement of Profit and Loss.
Loans and Borrowings
After initial recognition, interest-bearing loans and borrowings are subsequently measured at amortised cost using the EIR method. Gains and
losses are recognised in profit or loss when the liabilities are derecognised as well as through the EIR amortisation process.
Amortised cost is calculated by taking into account any discount or premium on acquisition and fees or costs that are an integral part of the EIR. The EIR amortisation is included as finance costs in the Statement of Profit and Loss.
De-recognition
A financial liability is derecognised when the obligation under the liability is discharged or cancelled or expires. When an existing financial liability is replaced by another from the same lender on substantially different terms, or the terms of an existing liability are substantially modified, such an exchange or modification is treated as the de-recognition of the original liability and the recognition of a new liability. The difference in the respective carrying amounts is recognised in the Statement of Profit and Loss.
Offsetting of Financial Instruments
Financial assets and financial liabilities are offset and the net amount is reported in the Balance Sheet if there is a currently enforceable legal right to offset the recognised amounts and there is an intention to settle on a net basis, to realise the assets and settle the liabilities simultaneously
4.24. Equity Investment in Subsidiaries and Joint Ventures
Investment in Subsidiaries and Joint Ventures are carried at Cost in the Separate Financial Statements as permitted under Ind AS 27.
Notes to Financial Statements

98 Annual Report 2017-18
Tube Investments of India Limited(Formerly known as TI Financial Holdings Limited)
Not
e 5
. Pro
pert
y P
lant
and
Equ
ipm
ent
` in
Cro
res
Part
icul
ars
Gro
ss B
lock
at C
ost
Dep
reci
atio
n / A
mor
tisat
ion
Net
Blo
ck
As
at31
-Mar
-201
7
Adj
ustm
ent p
ursu
ant t
o Sc
hem
e of
Arr
ange
men
t(R
efer
Not
e 2)
Add
ition
sD
elet
ions
As
at31
-Mar
-201
8A
s at
31-M
ar-2
017
For t
he
Year
On
Del
etio
nsA
s at
31-M
ar-2
018
As
at31
-Mar
-201
8A
s at
31-M
ar-2
017
Land
(Fre
ehol
d) 1
20.2
4(-)
1.3
8(-)
121
.62
(-)(-)
(-)(-)
121
.62
120
.24
(-) (1
21.0
4)(-)
(0.8
0) (1
20.2
4)(-)
(-)(-)
(-) (1
20.2
4)(-)
Land
(Lea
seho
ld)
0.6
1(-)
(-)(-)
0.6
1 0
.01
(-)(-)
0.0
1 0
.60
0.6
0(-)
(0.6
1)(-)
(-) (0
.61)
(-) (0
.01)
(-) (0
.01)
(0.6
0)(-)
Build
ings
230
.39
(-) 4
5.70
1.6
2 2
74.4
7 1
0.12
11.
48 0
.20
21.
40 2
53.0
7 2
20.2
7(-)
(179
.66)
(50.
80)
(0.0
7) (2
30.3
9)(-)
(10.
12)
(-) (1
0.12
) (2
20.2
7)(-)
Plan
t and
Mac
hine
ry 6
19.8
5(-)
110
.45
8.5
9 7
21.7
1 9
9.94
108
.72
4.2
1 2
04.4
5 5
17.2
6 5
19.9
1(-)
(510
.83)
(118
.66)
(9.6
4) (6
19.8
5)(-)
(104
.08)
(4.14
) (9
9.94
) (5
19.9
1)(-)
Railw
ay S
idin
g 0
.01
(-)(-)
(-) 0
.01
(-)(-)
(-)(-)
0.0
1 0
.01
(-) (0
.01)
(-)(-)
(0.0
1)(-)
(-)(-)
(-) (0
.01)
(-)
Offi
ce E
quip
men
t 9
.08
(-) 3
.53
0.10
12.
51 3
.29
3.7
5 0
.06
6.9
8 5
.53
5.7
9(-)
(4.5
6) (4
.54)
(0.0
2) (9
.08)
(-) (3
.29)
(-) (3
.29)
(5.7
9)(-)
Furn
iture
and
Fix
ture
s 8
.57
(-) 1
.86
0.12
10.
31 1
.27
1.2
8 0
.11 2
.44
7.8
7 7
.30
(-) (4
.00)
(4.5
7)(-)
(8.5
7)(-)
(1.2
7)(-)
(1.2
7) (7
.30)
(-)
Vehi
cles
9.3
9(-)
3.7
0 1
.06
12.
03 2
.17 2
.99
0.2
7 4
.89
7.14
7.2
2(-)
(5.7
2) (4
.49)
(0.8
2) (9
.39)
(-) (2
.40)
(0.2
3) (2
.17)
(7.2
2)(-)
Tota
l 9
98.14
(-) 1
66.6
2 1
1.49
1,15
3.27
116
.80
128
.22
4.8
5 2
40.17
913
.10 8
81.3
4(-)
(826
.43)
(183
.06)
(11.3
5) (9
98.14
)(-)
(121
.17)
(4.3
7) (1
16.8
0) (8
81.3
4)(-)
Not
es:
a.
All
the
abov
e as
sets
are
ow
ned
by th
e C
ompa
ny u
nles
s ot
herw
ise
stat
ed a
s le
ased
ass
et.
b.
Pre
viou
s Ye
ar F
igur
es a
re g
iven
in b
rack
ets.
c.
Non
Con
vert
ible
Deb
entu
res
are
secu
red
by fi
rst p
ari-p
assu
cha
rge
on c
erta
in L
and
and
Bui
ldin
g.
Notes to Financial Statements
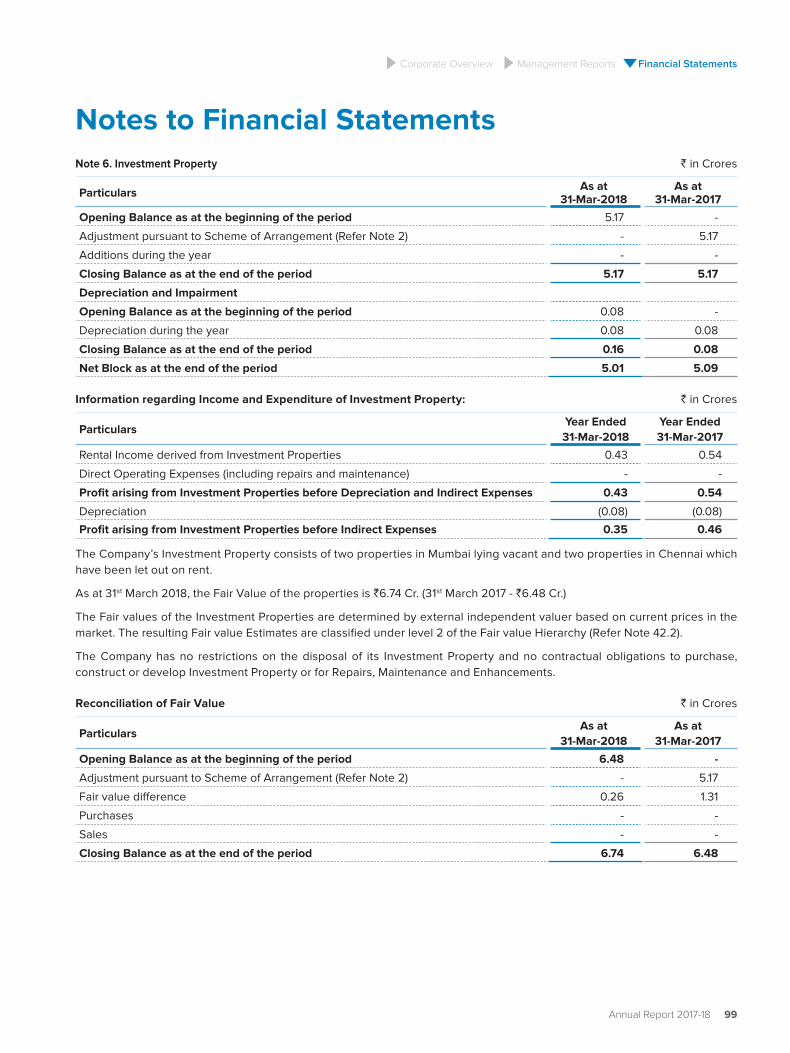
Annual Report 2017-18 99
Corporate Overview Management Reports Financial Statements
Note 6. Investment Property ` in Crores
Particulars As at31-Mar-2018
As at31-Mar-2017
Opening Balance as at the beginning of the period 5.17 -
Adjustment pursuant to Scheme of Arrangement (Refer Note 2) - 5.17
Additions during the year - -
Closing Balance as at the end of the period 5.17 5.17
Depreciation and Impairment
Opening Balance as at the beginning of the period 0.08 -
Depreciation during the year 0.08 0.08
Closing Balance as at the end of the period 0.16 0.08
Net Block as at the end of the period 5.01 5.09
Information regarding Income and Expenditure of Investment Property: ` in Crores
ParticularsYear Ended 31-Mar-2018
Year Ended 31-Mar-2017
Rental Income derived from Investment Properties 0.43 0.54
Direct Operating Expenses (including repairs and maintenance) - -
Profit arising from Investment Properties before Depreciation and Indirect Expenses 0.43 0.54
Depreciation (0.08) (0.08)
Profit arising from Investment Properties before Indirect Expenses 0.35 0.46
The Company’s Investment Property consists of two properties in Mumbai lying vacant and two properties in Chennai which have been let out on rent.
As at 31st March 2018, the Fair Value of the properties is `6.74 Cr. (31st March 2017 - `6.48 Cr.)
The Fair values of the Investment Properties are determined by external independent valuer based on current prices in the market. The resulting Fair value Estimates are classified under level 2 of the Fair value Hierarchy (Refer Note 42.2).
The Company has no restrictions on the disposal of its Investment Property and no contractual obligations to purchase, construct or develop Investment Property or for Repairs, Maintenance and Enhancements.
Reconciliation of Fair Value ` in Crores
ParticularsAs at
31-Mar-2018As at
31-Mar-2017
Opening Balance as at the beginning of the period 6.48 -
Adjustment pursuant to Scheme of Arrangement (Refer Note 2) - 5.17
Fair value difference 0.26 1.31
Purchases - -
Sales - -
Closing Balance as at the end of the period 6.74 6.48
Notes to Financial Statements

100 Annual Report 2017-18
Tube Investments of India Limited(Formerly known as TI Financial Holdings Limited)
Note 7a. Investments in Subsidiaries and Joint Ventures
Particulars
Number of shares ` in CroresNominal
Value` per unit
As at31-Mar-2018
As at31-Mar-2017
As at31-Mar-2018
As at31-Mar-2017
Investments at Cost:
Equity Shares (Fully Paid) - Quoted
Investment in Subsidiaries
Shanthi Gears Limited 1 5,72,96,413 5,72,96,413 464.10 464.10
Equity Shares (Fully Paid) - Unquoted
Investment in Subsidiaries
Financiere C10 SAS Euro 15 2,23,920 2,23,920 61.15 61.15
Great Cycles (Private) Limited (Refer Note a below) LKR 10 40,00,000 - 16.98 -
Creative Cycles (Private) Limited (Refer Note b below) LKR 10 40,00,000 - 6.47 -
Investment in Joint Ventures
TI Tsubamex Private Limited (Refer Note c below) 10 2,35,00,000 1,95,00,000 23.50 19.50
TI Absolute Concepts Private Limited (Refer Note d below)
10 1,37,50,000 1,00,00,000 13.75 10.00
Total 585.95 554.75
Less : Provision for Impairment of Investments (25.25) -
Total 560.70 554.75
` in Crores
Particulars As at31-Mar-2018
As at31-Mar-2017
Quoted
Cost 464.10 464.10
Market value 740.84 637.42
Unquoted
Cost 121.85 90.65
Aggregate amount of impairment in the value of investments in Joint Venture 25.25 -
Notes:
a. During the year, the Company acquired 80% stake in Great Cycles (Private) Limited, Srilanka and has become a Subsidiary Company. The Company has purchased 40,00,000 Equity Shares of face value of LKR 10 each of at `10 per share amounting to `16.98 Cr.
b. During the year, the Company acquired 80% stake in Creative Cycles (Private) Limited, Srilanka and has become a Subsidiary Company. The Company has purchased 40,00,000 Equity Shares of face value of LKR 10 each of at `10 per share amounting to `6.47 Cr.
c. During the year, the Company subscribed to 40,00,000 Equity Shares of face value of `10 each of TI Tsubamex Private Limited (TTPL), a Joint Venture Company at `10 per share amounting to `4.00 Cr.
d. During the year, the Company subscribed to 37,50,000 Equity Shares of face value of `10 each of TI Absolute Concepts Private Limited (TIACPL), a Joint Venture Company at `10 per share amounting to `3.75 Cr.
Notes to Financial Statements

Annual Report 2017-18 101
Corporate Overview Management Reports Financial Statements
Note 7b. Other Investments
Particulars
Number of shares ` in Crores
Nominal Value
` per unit
As at31-Mar-2018
As at31-Mar-2017
As at31-Mar-2018
As at31-Mar-2017
Investments at Fair Value Through Other Comprehensive Income (FVTOCI):
Equity Shares (Fully Paid) - Quoted
LG Balakrishnan & Bros. Limited 10 5,192 5,192 0.55 0.32
LGB Forge Limited 1 25,960 25,960 0.01 0.02
GIC Housing Finance Limited 10 48,700 48,700 1.81 1.79
Equity Shares (Fully Paid) - Unquoted
Bombay Mercantile Co-operative Limited(Fair value `5,000 only)
10 500 500 - -
Southern Energy Development Corporation Limited
10 70,000 70,000 6.34 7.65
TI Cycles of India Co-operative Canteen Limited(Fair value - `250 only)
5 50 50 - -
TI Diamond-Miller Co-operative Canteen Limited(Fair value - `100 only)
5 20 20 - -
Cauvery Power Generation Chennai Private Limited
10 24,00,000 24,00,000 2.41 2.41
Total 11.12 12.19
` in Crores
Particulars As at31-Mar-2018
As at31-Mar-2017
Quoted
Cost 0.24 0.24
Market value 2.37 2.13
Unquoted
Cost 2.48 2.48
Investments at fair value through OCI reflect investment in quoted and unquoted equity investments. Refer Note 42.1 for determination of their fair value.
Notes to Financial Statements

102 Annual Report 2017-18
Tube Investments of India Limited(Formerly known as TI Financial Holdings Limited)
Note 7c. Other Financial assets ` in Crores (At Amortised Cost)
Particulars As at31-Mar-2018
As at31-Mar-2017
Electricity and Other Deposits 17.58 15.47
Others - 2.52
Total 17.58 17.99
Note 8. Other non-current assets(Considered Good, Unsecured unless stated otherwise) ` in Crores
Particulars As at31-Mar-2018
As at31-Mar-2017
Capital Advances
- Secured 3.16 8.35
- Unsecured 9.30 8.34
Deposits with Government, Public Bodies and Others
- Balance with Customs, Excise and Sales Tax Authorities 18.26 11.29
Total 30.72 27.98
Note 9. Inventories ` in Crores(Lower of Cost and estimated Net Realisable Value)
Particulars As at31-Mar-2018
As at31-Mar-2017
Raw Materials 203.52 174.76
Work-in-Progress 127.91 82.38
Finished Goods 194.33 238.54
Stock-in-Trade 46.02 45.60
Stores and Spare Parts 7.02 7.51
Goods-in-Transit
- Raw Materials 20.33 22.04
- Stock-in-Trade 8.10 9.89
Total 607.23 580.72
During the year ended 31st March 2018, `9.61 Cr. was recognised as an expense to bring the inventories to record them that Net Realisable Value. (31st March 2017 - `7.04 Cr.)
Note 10a. Loans(Considered Good, Unsecured unless stated otherwise) ` in Crores
Particulars As at31-Mar-2018
As at31-Mar-2017
Loan to employees 1.45 1.37
Total 1.45 1.37
Loans to employees are Non-Derivative Financial Assets which generate a fixed or variable interest income for the Company.
Notes to Financial Statements

Annual Report 2017-18 103
Corporate Overview Management Reports Financial Statements
Note 10b. Trade Receivables(Unsecured) ` in Crores
Particulars As at31-Mar-2018
As at31-Mar-2017
Outstanding for a period exceeding six months from the date they are due for payment
Considered Good 13.47 3.08
Doubtful 6.89 6.12
20.36 9.20
Provision for Doubtful Receivables (6.89) (6.12)
13.47 3.08
Other Receivables
Considered Good * 563.28 526.14
Doubtful - -
563.28 526.14
Provision for Impairment on Receivables (1.31) (1.00)
561.97 525.14
Total Trade Receivables
Considered Good 576.75 529.22
Doubtful 6.89 6.12
583.64 535.34
Provision for Doubtful / Impairment on Receivables (8.20) (7.12)
Total 575.44 528.22
* Includes dues from Related parties
Sedis SAS 6.72 5.24
Shanthi Gears Limited 0.03 0.10
TI Tsubamex Private Limited 0.82 0.57
TI Absolute Concepts Private Limited 0.84 0.13
Creative Cycles (Private) Limited 0.23 -
Trade Receivables are non-interest bearing and are generally have Credit period to a maximum of 120 days. For terms and conditions relating to Related Party receivables, refer Note 38.
Reconciliation of Provision / Impairment for Receivables ` in Crores
Particulars As at31-Mar-2018
As at31-Mar-2017
Opening Balance as at beginning of the year 7.12 -
Adjustment pursuant to scheme of arrangement (Note 2) - 12.13
Created / (Reversed) during the year 1.08 (5.01)
Closing Balance as at end of the year 8.20 7.12
Notes to Financial Statements

104 Annual Report 2017-18
Tube Investments of India Limited(Formerly known as TI Financial Holdings Limited)
Note 10c. Investments ` in Crores
Particulars As at31-Mar-2018
As at31-Mar-2017
Quoted Investments - FVTPL
Investments in Mutual Funds - 102.08
Total - 102.08
During the year, the Company has invested an aggregate amount of `1198.10 Cr. (Previous Year - `1799.96 Cr.) in the units of various Cash Management Schemes of Mutual funds, for the purpose of deployment of temporary cash surplus and has Nil (Previous Year - `102.08 Cr.) in various schemes of mutual funds. The total consideration received on the sale of units during the year was `1302.21 Cr. (Previous Year - `1708.57 Cr.)
Note 10d. Cash and Cash Equivalents ` in Crores
Particulars As at31-Mar-2018
As at31-Mar-2017
Balances with Banks in Current Accounts 18.70 18.69
Cash on hand 0.06 0.07
Other Bank balances
- Unpaid Dividend Accounts 0.49 -
Cash and Cash Equivalents as per Balance Sheet 19.25 18.76
Cash Credit facility (Secured) (88.55) (9.19)
Balances in Unpaid Dividend Accounts (0.49) -
Cash and Cash Equivalents as per Statement of Cash Flows (69.79) 9.57
As at 31st March 2018, the Company had undrawn committed borrowing facilities of `287.53 Cr. (31st March 2017 - `224.03 Cr.).
Pursuant to the Scheme of Arrangement (Refer Note 2), the Cash and Cash Equivalents taken over as at 1st April 2016 is `607.54 Cr. For the purpose of Cash Flow Statement under Ind AS, the Bank Overdraft / Cash Credit balances of `29.69 Cr. as at 1st April 2016 has been reduced from Cash and Cash equivalents.
Note 10e. Other Financial Assets(At Amortised Cost) ` in Crores
Particulars As at31-Mar-2018
As at31-Mar-2017
Claims Recoverable
- Goods and Services 4.05 1.62
- Employee Related 0.44 0.18
Other deposits 3.58 4.23
Government Grants 15.48 7.01
Total 23.55 13.04
Notes to Financial Statements

Annual Report 2017-18 105
Corporate Overview Management Reports Financial Statements
Note 11. Other Current Assets(Considered Good, Unsecured unless stated otherwise) ` in Crores
Particulars As at31-Mar-2018
As at31-Mar-2017
Advances and Claims Recoverable
- Goods and Services 17.62 16.55
- Employee Related 0.57 0.54
- Prepaid Expenses 2.78 2.66
- Gratuity Fund (Net of Provision) 0.86 0.09
21.83 19.84
Balances with Customs, Excise, Sales Tax and GST Authorities 43.50 35.42
Total 65.33 55.26
Note - 12. Equity Share Capital ` in Crores
Particulars As at31-Mar-2018
As at31-Mar-2017
Authorised Capital
25,00,00,000 Equity Shares of `1 each(31-Mar-2017: 25,00,00,000 Equity Shares of `1 each)
25.00 25.00
Issued, Subscribed and Paid-up Capital
18,75,36,368 Equity Shares of `1 each fully paid up(31-Mar-2017: 18,74,47,871 Equity Shares of `1 each fully paid up)
18.75 18.74
Total 18.75 18.74
Note – Pursuant to the Scheme of Arrangement (Refer Note 2), during the year, the Company issued One fully paid up Equity Share of `1 each for every one fully paid up Equity Share held in Demerged Company, accumulating to 18,74,90,591 shares as at the record date i.e 28th August 2017.
a) The Reconciliation of shares capital is given below `in Crores
Particulars As at 31-Mar-2018 As at 31-Mar-2017
No. of Shares
` in CroresNo. of Shares
` in Crores
At the beginning of the year 18,74,47,871 18.74 1,10,000 0.11
Cancellation of existing Equity Share Capital pursuant to Scheme of Arrangement (Note 2)
- - (1,10,000) (0.11)
Equity Shares of `1 each to be issued pursuant to Scheme of Arrangement (Note 2)
- - 18,74,47,871 18.74
Issue of share capital * 88,497 0.01 - -
At the end of the year 18,75,36,368 18.75 18,74,47,871 18.74
*The Breakup of shares issued during the year was as follows:
Particulars (Refer Note 35) No of Shares
Shares issued upon exercise of Employee Stock Options of the Demerged Company prior to the record date
42,720
Shares issued upon exercise of Employee Stock Options of the Resulting Company 45,777
Total 88,497
Notes to Financial Statements

106 Annual Report 2017-18
Tube Investments of India Limited(Formerly known as TI Financial Holdings Limited)
b) Terms / Rights attached to class of shares
The Company has only one class of shares referred to as Equity Shares having a par value of `1 each. The holders of Equity Shares are entitled to one vote per share. Dividend proposed by the Board of Directors, if any, is subject to the approval of the shareholders in the ensuing Annual General Meeting, except in case of interim dividend. Repayment of capital will be in proportion to the number of Equity Shares held by the shareholders.
c) Details of Shareholder(s) holding more than 5 percent of Equity Shares in the Company
Particulars
As at 31-Mar-2018 As at 31-Mar-2017
No. of Shares% against total
number of shares
No. of Shares% against total
number of shares
Ambadi Investments Limited (Face Value `1 each) 7,00,66,595 37.36% 6,40,54,680 34.17%
Pursuant to the Scheme of Amalgamation of Murugappa Holdings Limited and Pressmet Private Limited with Ambadi Investments Private Limited, Murugappa Holdings Limited and Pressmet Private Limited has been merged with Ambadi Investments Limited. Subsequent to this Amalagamation, Ambadi Investments Private Limited has become a public limited company.
d) Status on Global Depository Receipts (GDRs):
Pursuant to the Scheme of Arrangement (Refer Note 2), during the year, the Company issued shares in the ratio of GDRs held by them in the Demerged Company, to a appointed depository. The appointed depository shall hold such shares on behalf of the holders of the Demerged Company GDRs. Consequently, the aggregate number of GDRs deemed to be outstanding as at 31st March 2018 is 42,30,630 (As at 31st March 2017 – 42,30,630) each representing one Equity Share of `1 face value. GDR % against total number of shares is 2.26%. The GDRs carry the same terms / rights attached to Equity Shares of the Company.
Note 13. Other Equity ` in Crores
Particulars As at31-Mar-2018
As at31-Mar-2017
General Reserve 334.63 334.63Securities Premium Reserve 0.10 -Retained Earnings 735.53 663.17Other Reserves
Share Options Outstanding Account 5.43 -Cash Flow Hedge Reserve (0.12) (0.24)FVTOCI Reserve 6.21 6.85Capital Reserve 0.11 0.11Debenture Redemption Reserve 112.50 118.75
Total Other Equity 1,194.39 1,123.27
a. General Reserve - The general reserves is a free reserve, retained from company’s profits to meet future obligations.` in Crores
Particulars As at31-Mar-2018
As at31-Mar-2017
Balance at the beginning of the year 334.63 -Adjustment pursuant to Scheme of arrangement (Refer Note 2) - 334.63Balance at the end of the year 334.63 334.63
Notes to Financial Statements

Annual Report 2017-18 107
Corporate Overview Management Reports Financial Statements
b. Securities Premium Reserve - The Securities premium received during the year represents the premium received towards allotment of 45,777 shares. This balance will be utilised in accordance with the provisions of Section 52 of the Companies Act towards issuance of fully paid bonus shares, write-off of preliminary expenses, commission / discount expenses on issue of shares / debentures, premium payable on redemption of redeemable preference shares / debentures and buy back of its own shares / securities under Section 68 of the Companies Act.
` in Crores
Particulars As at31-Mar-2018
As at31-Mar-2017
Securities PremiumBalance at the beginning of the year - -Adjustment pursuant to Scheme of arrangement (Refer Note 2) - -Additions during the year 0.10 -Balance at the end of the year 0.10 -
c. Retained Earnings - The amount that can be distributed by the Company as dividends to its Equity Shareholders is determined based on the financial statements of the Company and also considering the requirements of the Companies Act, 2013. Thus, the amounts reported above are not distributable in entirety.
` in Crores
Particulars As at31-Mar-2018
As at31-Mar-2017
Balance at the beginning of the year 663.17 (0.06)Adjustment pursuant to Scheme of arrangement (Refer Note 2) - 406.05Adjustment pursuant to transition to Ind AS - 0.23Profit for the Year 136.46 158.95Dividend Paid during the year (60.94) -Dividend Distribution tax paid during the year (10.36) -Re-measurement Gain / (Loss) on Defined Benefit Obligations (Net) transferred to Retained Earnings
0.95 (4.08)
Transferred from DRR (Net) 6.25 102.08Balance at the end of the year 735.53 663.17
d. Share Option Outstanding Account - Under Ind AS 102, fair value of the options granted is to be expensed out over the life of the vesting period as employee compensation costs reflecting period of receipt of service. Stock options granted but not vested as on the transition date were valued for expired period, calculated from the grant date till date of transition, aggregating to `5.43 Cr. and were credited to Share options outstanding account. ` in Crores
Particulars As at31-Mar-2018
As at31-Mar-2017
Balance at the beginning of the year - -Additions during the year 5.43 -Deductions during the year - -Balance at the end of the year 5.43 -
e. Cash Flow Hedge Reserve - The cash flow hedging reserve represents the cumulative effective portion of gains or losses arising on changes in fair value of designated portion of hedging instruments entered into for cash flow hedges. The cumulative gain or loss arising on changes in fair value of the designated portion of the hedging instruments that are recognised and accumulated under the heading of cash flow hedging reserve will be reclassified to profit or loss only when the hedged transaction affects the profit or loss, or included as a basis adjustment to the non-financial hedged item. ` in Crores
Particulars As at31-Mar-2018
As at31-Mar-2017
Balance at the beginning of the year (0.24) -Adjustment pursuant to Scheme of arrangement (Refer Note 2) - (0.87)Adjustment pursuant to transition to Ind AS - 0.30Additions / (Deductions) during the year (Net) 0.12 0.33Balance at the end of the year (0.12) (0.24)
Notes to Financial Statements

108 Annual Report 2017-18
Tube Investments of India Limited(Formerly known as TI Financial Holdings Limited)
f. FVTOCI Reserve - This reserve represents the cumulative gains and losses arising on the revaluation of equity instruments measured at fair value through Other Comprehensive Income.
` in Crores
Particulars As at31-Mar-2018
As at31-Mar-2017
Balance at the beginning of the year 6.85 -
Adjustment pursuant to transition to Ind AS - 4.77
Additions during the year 0.31 (2.00)
Deductions during the year (0.95) 4.08
Balance at the end of the year 6.21 6.85
g. Capital Reserve - The Share Capital of `0.11 Cr. of the Company as at 31st March 2016, has been cancelled pursuant to the Scheme of Arrangement (Refer Note 2) and the same has been credited to the Capital Reserve in 2016-17.
` in Crores
Particulars As at31-Mar-2018
As at31-Mar-2017
Balance at the beginning of the year 0.11 -
Adjustment pursuant to Scheme of arrangement (Refer Note 2) - 0.11
Balance at the end of the year 0.11 0.11
h. Debenture Redemption Reserve (DRR) - The Companies (Share capital and Debentures) Rules, 2014 (as amended), require the company to create DRR out of profits of the company available for payment of dividend. DRR is required to be created for an amount which is equal to 25% of the value of debentures outstanding. Accordingly, the Company has created DRR equal to 25% of the outstanding debentures.
` in Crores
Particulars As at31-Mar-2018
As at31-Mar-2017
Balance at the beginning of the year 118.75 -
Adjustment pursuant to Scheme of arrangement (Refer Note 2) - 220.83
Additions during the year 25.00 72.92
Deductions during the year (31.25) (175.00)
Balance at the end of the year 112.50 118.75
Note 14. Long term Borrowings ` in Crores
Particulars As at31-Mar-2018
As at31-Mar-2017
Secured, Listed and Rated Non-Convertible Debentures (NCD)
7.56% Privately Placed NCD 100.00 -
7.55% Privately Placed NCD 100.00 100.00
8.79% Privately Placed NCD - 150.00
8.90% Privately Placed NCD - 100.00
Total 200.00 350.00
Notes to Financial Statements

Annual Report 2017-18 109
Corporate Overview Management Reports Financial Statements
Repayment Schedule:Secured, Listed and Rated Non-Convertible Debentures (NCD)
Coupon Rate Effective Interest Rate Oustanding Amount in ` Cr. Maturity date and Redemption particulars
7.56% 7.55% 100 28-Dec-20
7.55% 7.55% 100 20-Feb-20
* 8.79% 8.78% 150 26-Oct-18
* 8.90% 8.89% 100 25-Sep-18* Classified as "Other Financial Liabilities" (Refer Note 16d)
Nature of Security - All NCDs are secured by a pari passu first charge on certain immovable properties of the Company (Refer note 5c)
Note 15. Deferred Tax Assets and Liabilities ` in Crores
Particulars Balance Sheet Statement of Profit and LossNature - (Liability) / Asset 31-Mar-18 31-Mar-17 31-Mar-18 31-Mar-17Deferred Tax LiabilitiesDifference between depreciation as per books of accounts and the Income Tax Act, 1961
(59.71) (64.38) (4.67) (0.36)
Total (A) (59.71) (64.38) (4.67) (0.36)Deferred Tax AssetsProvision for Doubtful Trade Receivables 2.86 2.46 (0.40) 1.73Provision for Employee Benefits 3.63 4.80 1.17 1.90On expenditure charged to the Statement of Profit and Loss in the current year but allowed for tax purposes on payment basis
20.67 14.55 (6.12) (2.02)
Effect of Cash flow hedge and fair value of equity investments through Other Comprehensive Income
(2.14) (2.50) (0.36) 0.19
MAT Credit Entitlement 6.25 18.80 12.55 3.74Others 0.23 - (0.23) (0.01)Total (B) 31.50 38.11 6.61 5.53Deferred Tax Expenses / (Income) (A+B) 1.94 5.17Net Deferred Tax (Liabilities) / Assets (A+B) (28.21) (26.27)
Reconciliation of Deferred Tax Liabilities(Net) ` in Crores
Particulars 31-Mar-17 31-Mar-17Opening balance (26.27) -Adjustment pursuant to Scheme of Arrangement (Refer Note 2) - (19.41)Adjustment pursuant to transition to Ind AS - (1.69)Tax Income / (Expense) during the period recognised in Profit and Loss 10.25 (1.24)MAT Credit Utilised (12.55) (3.74)Tax Income / (Expense) during the period recognised in OCI 0.36 (0.19)Closing balance (28.21) (26.27)
Notes to Financial Statements

110 Annual Report 2017-18
Tube Investments of India Limited(Formerly known as TI Financial Holdings Limited)
Note 16a. Short Term Borrowings ` in Crores
Particulars As at31-Mar-2018
As at31-Mar-2017
Secured Borrowings(Secured by pari passu first charge on Inventories and Trade Receivables)From Banks
Packing Credit Rupee Loans 148.92 142.62Cash Credit 88.55 9.19
237.47 151.81Unsecured BorrowingsCommercial Papers - 149.16
- 149.16Total 237.47 300.97
Note - Short term Borrowings have a maturity of up to 6 months with an interest rate range of 7%-10%
During the current year, the company has borrowed fresh short term loans amounting to `1350.00 Cr. and repaid loans to the
tune of `1492.86 Cr. relating to Packing Credit, Commercial Paper and other Short Term Working Capital Loans.
Note 16b. Trade Payables ` in Crores
Particulars As at31-Mar-2018
As at31-Mar-2017
Trade Payables
- Dues to Micro, Small and Medium Enterprises (See Note below) 0.40 1.36
- Others * 876.40 715.64
Total 876.80 717.00
* Includes Dues to
Key Managerial Personnel 2.29 1.12
Related Parties
- Sedis SAS 0.02 -
- Parry Enterprises India Limited 0.16 0.13
- Shanthi Gears Ltd 0.04 -
` in Crores
Particulars As at31-Mar-2018
As at31-Mar-2017
Principal amount due to suppliers under MSMED Act 0.37 1.34
Interest accrued and due to suppliers under MSMED Act, on the above amount - -
Payment made to suppliers (other than interest) beyond the appointed day, during the year 6.90 6.66
Interest paid to suppliers under MSMED Act (Section 16) 0.02 0.01
Interest due and payable to suppliers under MSMED Act, for payments already made 0.03 0.02
Interest accrued and remaining unpaid at the end of the year to suppliers under MSMED Act 0.03 0.02
Trade payables are non-interest bearing and are normally settled within a period of 90 to 180 days. For terms and conditions relating to Related Party receivables, Refer Note 38
Notes to Financial Statements

Annual Report 2017-18 111
Corporate Overview Management Reports Financial Statements
Note 16c. Derivative Instruments ` in Crores
Particulars As at31-Mar-2018
As at31-Mar-2017
Derivative Instruments at FVTOCI (Refer Note 41)Cash Flow Hedges - Foreign Exchange Forward Contracts 0.31 0.15Total 0.31 0.15
Note 16d. Other Financial Liabilities(At Amortised Cost) ` in Crores
Particulars As at31-Mar-2018
As at31-Mar-2017
Current Maturities of Long Term BorrowingsSecured, Listed and Rated Non-Convertible Debentures (NCD)
- 8.79% Privately Placed NCD * 150.00 -- 8.90% Privately Placed NCD * 100.00 -- 9.81% Privately Placed NCD - 75.00- 9.99% Privately Placed NCD - 49.99
Payable to TIFHL (Demerged Company) - 55.00Interest Accrued But Not Due 13.69 17.38Unpaid dividends 0.49 -Advances and Deposits from Customers / Others 8.69 9.31Dues to Directors 1.35 -Other Liabilities - Recoveries from Employees 3.54 3.24 - Capital Creditors 18.00 15.08 - Others 0.47 2.27Total 296.23 227.27
* Refer Note 14 for Nature of Securities and Repayment Particulars
Note 17. Short Term Provisions ` in Crores
Particulars As at31-Mar-2018
As at31-Mar-2017
Provision for Compensated Absences (Refer Note a below) 18.85 16.86Provision for Warranties (Refer Note b below) 1.57 1.62Provision for Contingency / Others (Refer Note c below) 38.57 31.24Total 58.99 49.72
(a) Provision for Compensated Absences
This refers to the Company’s liability for accumulated Earned Leave and Sick Leave, which can be encashed at the time of resignation/retirement of employee. The assumptions used to compute the provision are provided in Note 36c.
(b) Provision for Warranties ` in Crores
Particulars As at31-Mar-2018
As at31-Mar-2017
At the Beginning of the Year 1.62 -Adjustment pursuant to Scheme of Arrangement (Refer Note 2) - 1.64Created during the Year 1.11 1.36Utilized during the Year (1.16) (1.38)At the end of the Year 1.57 1.62
Notes to Financial Statements

112 Annual Report 2017-18
Tube Investments of India Limited(Formerly known as TI Financial Holdings Limited)
A provision is recognised for expected warranty claims on products sold during the last one year (2 years in respect of certain components), based on past experience of the level of returns. It is expected that most of these costs will be incurred within one year after the reporting date. Assumptions used to calculate the provision for warranties were based on current sales levels and current information available about returns based on the applicable warranty period for all products sold.
(c) Provision for Contingencies / Others ` in Crores
Particulars As at31-Mar-2018
As at31-Mar-2017
At the beginning of the Year 31.24 -
Adjustment pursuant to scheme of arrangement (Refer Note 2) - 23.02
Created / (Utilised) during the year 7.33 8.22
At the end of the year 38.57 31.24
The above Provision represents expected future outflows relating to various tax related matters, timing of which cannot be ascertained. The assumptions used to calculate the provisions are based on past experience of similar matters and professional consultations.
Note 18. Other Current Liabilities ` in Crores
Particulars As at31-Mar-2018
As at31-Mar-2017
Statutory Liabilities 10.49 14.20
Advances from Customers 10.81 7.36
Total 21.30 21.56
Note 19a. Financial Assets ` in Crores
Particulars As at31-Mar-2018
As at31-Mar-2017
Financial Assets - Non Current
At Fair Value
Investments at FVTOCI 11.12 12.19
At Amortised Cost
Other Financial Assets 17.58 17.99
Total Non Current Financial Assets (A) 28.70 30.18
Financial Assets - Current
At Fair Value
Investments at FVTPL - 102.08
At Amortised Cost
(a) Loans 1.45 1.37
(b) Trade Receivables 575.44 528.22
(c) Cash and Cash Equivalents 19.25 18.76
(d) Other Financial Assets 23.55 13.04
Total Current Financial Assets (B) 619.69 663.47
Total Financial Assets (A + B) 648.39 693.65
Notes to Financial Statements

Annual Report 2017-18 113
Corporate Overview Management Reports Financial Statements
Note 19b. Financial Liabilities ` in Crores
Particulars As at31-Mar-2018
As at31-Mar-2017
Financial Liabilities - Non Current
At Amortised Cost
Borrowings 200.00 350.00
Total Non Current Financial Liabilities (A) 200.00 350.00
Financial Liabilities - Current
At Fair Value
Derivative Instruments 0.31 0.15
At Amortised Cost
(a) Short Term Borrowings 237.47 300.97
(b) Trade Payables 876.80 717.00
(c) Other Financial Liabilities 296.23 227.27
Total Current Financial Liabilities (B) 1410.81 1245.39
Total Financial Liabilities (A + B) 1610.81 1595.39
Note 19c. Government Grants ` in Crores
Particulars As at31-Mar-2018
As at31-Mar-2017
Balance at the Beginning of the Year 1.38 -
Received during the Year 4.41 6.65
Released to the Statement of Profit and Loss (4.71) (5.27)
Balance at the End of the Year 1.08 1.38
Current 1.08 1.38
Non current - -
1.08 1.38
Government Grants are Interest Subvention given by RBI on Packing Credit Rupee Export Loan towards Exports of Certain Products.
Note 19d. Proposed Dividend ` in Crores
Particulars As at31-Mar-2018
As at31-Mar-2017
Proposed Dividends on Equity Shares:
Dividend for FY 2017-18- `0.50 per share (Dividend for FY 2016-17 - `2 per share) 9.38 37.49
Dividend Distribution Tax (DDT) on Proposed Dividend 1.93 7.63
11.31 45.12
Proposed Dividend on Equity Shares are subject to approval at the Annual General Meeting and are not recognised as a Liability (including DDT thereon) as at 31st March.
Notes to Financial Statements
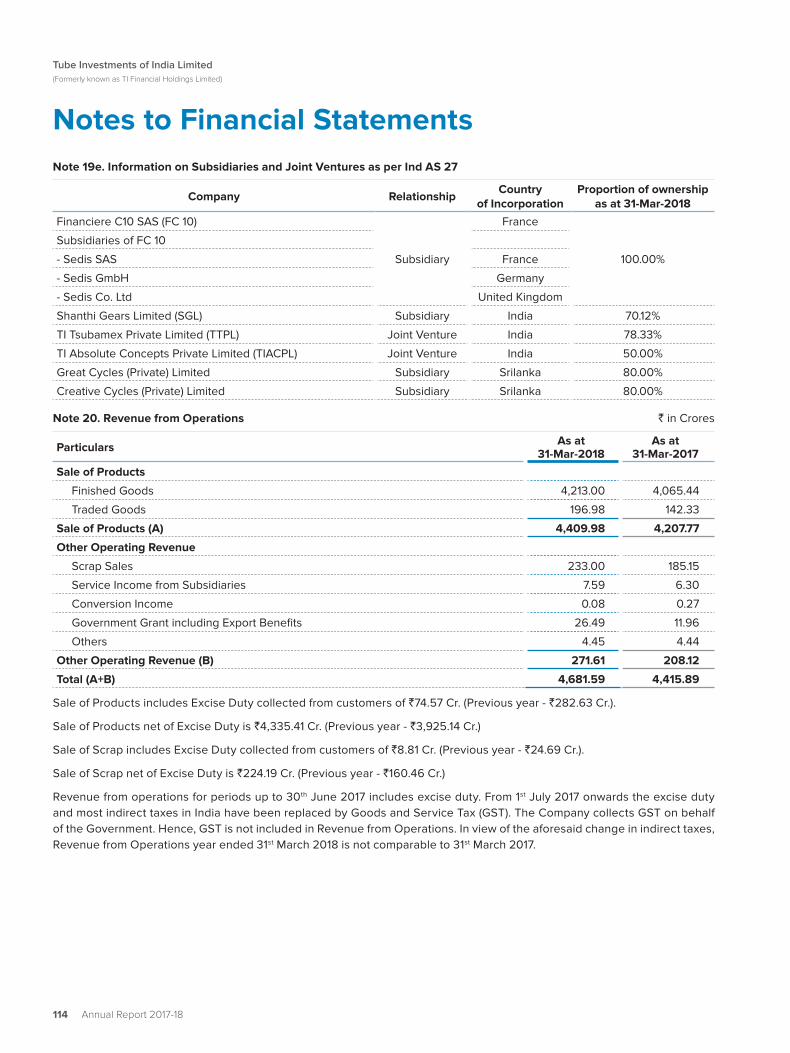
114 Annual Report 2017-18
Tube Investments of India Limited(Formerly known as TI Financial Holdings Limited)
Note 19e. Information on Subsidiaries and Joint Ventures as per Ind AS 27
Company RelationshipCountry
of IncorporationProportion of ownership
as at 31-Mar-2018
Financiere C10 SAS (FC 10)
Subsidiary
France
100.00%
Subsidiaries of FC 10
- Sedis SAS France
- Sedis GmbH Germany
- Sedis Co. Ltd United Kingdom
Shanthi Gears Limited (SGL) Subsidiary India 70.12%
TI Tsubamex Private Limited (TTPL) Joint Venture India 78.33%
TI Absolute Concepts Private Limited (TIACPL) Joint Venture India 50.00%
Great Cycles (Private) Limited Subsidiary Srilanka 80.00%
Creative Cycles (Private) Limited Subsidiary Srilanka 80.00%
Note 20. Revenue from Operations ` in Crores
Particulars As at31-Mar-2018
As at31-Mar-2017
Sale of Products
Finished Goods 4,213.00 4,065.44
Traded Goods 196.98 142.33
Sale of Products (A) 4,409.98 4,207.77
Other Operating Revenue
Scrap Sales 233.00 185.15
Service Income from Subsidiaries 7.59 6.30
Conversion Income 0.08 0.27
Government Grant including Export Benefits 26.49 11.96
Others 4.45 4.44
Other Operating Revenue (B) 271.61 208.12
Total (A+B) 4,681.59 4,415.89
Sale of Products includes Excise Duty collected from customers of `74.57 Cr. (Previous year - `282.63 Cr.).
Sale of Products net of Excise Duty is `4,335.41 Cr. (Previous year - `3,925.14 Cr.)
Sale of Scrap includes Excise Duty collected from customers of `8.81 Cr. (Previous year - `24.69 Cr.).
Sale of Scrap net of Excise Duty is `224.19 Cr. (Previous year - `160.46 Cr.)
Revenue from operations for periods up to 30th June 2017 includes excise duty. From 1st July 2017 onwards the excise duty and most indirect taxes in India have been replaced by Goods and Service Tax (GST). The Company collects GST on behalf of the Government. Hence, GST is not included in Revenue from Operations. In view of the aforesaid change in indirect taxes, Revenue from Operations year ended 31st March 2018 is not comparable to 31st March 2017.
Notes to Financial Statements

Annual Report 2017-18 115
Corporate Overview Management Reports Financial Statements
Note 21. Other Income ` in Crores
ParticularsYear Ended31-Mar-2018
Year Ended31-Mar-2017
Dividend income from Investments in Subsidiary carried at Cost 10.03 -
Dividend Income from Investments at FVTOCI 1.35 0.52
Rental Income 0.60 0.65
Royalty Income 0.23 0.24
Gain on Exchange Fluctuation (Net) 5.59 2.85
Profit on Property, Plant and Equipment sold/discarded (Net) - 1.08
Profit on Sale of Investments at FVTPL 2.03 10.61
Fair value gain on Financial Assets at FVTPL - 0.08
Liabilities no longer payable written back 1.47 0.32
Claims recovered 6.24 8.57
Bad debts recovery - 0.15
Interest Income from Financial Assets
Fixed Deposits with Banks 0.20 1.56
Others 0.30 2.61
Provision no longer required written back - 0.90
Others - 0.92
Total 28.04 31.06
Note 22. Cost of Material Consumed ` in Crores
ParticularsYear Ended31-Mar-2018
Year Ended31-Mar-2017
Opening Raw Materials 196.80 -
Adjustment pursuant to Scheme of Arrangement(Refer Note 2)
- 183.32
Purchases 2,725.37 2,487.32
Closing Raw Materials (223.85) (196.80)
2,698.32 2,473.84
Note 23. Changes in Inventories of Finished Goods, Work-in-Progress and Stock-in-Trade
` in Crores
ParticularsYear Ended31-Mar-2018
Year Ended31-Mar-2017
Closing stock
Work-in-Progress 127.91 82.38
Finished Goods 194.33 238.54
Stock-in-Trade 54.12 55.49
376.36 376.41
Opening stock
Work-in-Progress 82.38 -
Finished Goods 238.54 -
Stock-in-Trade 55.49 -
376.41 -
Notes to Financial Statements

116 Annual Report 2017-18
Tube Investments of India Limited(Formerly known as TI Financial Holdings Limited)
` in Crores
ParticularsYear Ended31-Mar-2018
Year Ended31-Mar-2017
Adjustment pursuant to Scheme of Arrangement (Refer Note 2)
Work-in-Progress - 75.25
Finished Goods - 156.83
Stock-in-Trade - 36.39
- 268.47
Changes in Inventories
Work-in-Progress (45.53) (7.13)
Finished Goods 44.21 (81.71)
Stock-in-Trade 1.37 (19.10)
Changes in inventories of Work-In-Progress, Finished Goods and Stock-in-Trade * 0.05 (107.94)
* Includes Decrease / (Increase) in Excise Duty on Finished Goods 2.79 (0.50)
Note 24. Employee Benefit Expense ` in Crores
ParticularsYear Ended31-Mar-2018
Year Ended31-Mar-2017
Salaries, Wages and Bonus (Refer Note 35) 355.22 329.73
Gratuity Expenses (Refer Note 36a) 3.14 3.54
Contribution to Provident and Other Funds 19.89 17.78
Staff Welfare Expenses 54.66 47.58
Total 432.91 398.63
Note 25.Depreciation and Amortization Expense ` in Crores
ParticularsYear Ended31-Mar-2018
Year Ended31-Mar-2017
Depreciation on Property, Plant and Equipment (Refer Note 5) 128.22 121.17
Depreciation on Investment Properties (Refer Note 6) 0.08 0.08
Total 128.30 121.25
Note 26. Finance Costs ` in Crores
ParticularsYear Ended31-Mar-2018
Year Ended31-Mar-2017
Interest Expense on Borrowings 56.31 71.75
Exchange Differences on Foreign Currency Loans - 0.18
Other Borrowing Costs 0.07 0.12
Total 56.38 72.05
Note – The Interest Expense on Borrowings includes the interest subvention received, amounting to `4.71 Cr. (Previous year - `5.27 Cr.) on Packing Credit loans
Notes to Financial Statements

Annual Report 2017-18 117
Corporate Overview Management Reports Financial Statements
Note 27. Other Expense ` in Crores
ParticularsYear Ended31-Mar-2018
Year Ended31-Mar-2017
Consumption of Stores and Spares 208.42 200.89
Conversion Charges 111.85 91.43
Power and Fuel * 164.76 147.36
Rent (Net of Recoveries) 18.30 21.37
Repairs and Maintenance - Building 0.39 0.85
Repairs and Maintenance - Machinery 78.44 86.47
Insurance 4.14 3.16
Rates and Taxes 5.60 19.62
Travelling and Conveyance 23.96 23.35
Printing, Stationery and Communication 5.70 6.12
Freight, Delivery and Shipping Charges 203.17 140.38
Discounts / Incentives on Sales 9.21 9.97
Advertisement and Publicity 37.75 29.27
Allowance for Doubtful debts and advances (Net) 1.08 -
Loss on Tangible Assets Sold / Discarded (Net) 3.12 -
Auditor's Remuneration (Refer Note a below) 0.67 0.52
Commission to Non Whole Time Directors(Refer Note b below)
1.50 1.62
Directors' Sitting Fees 0.10 -
Bank Charges 2.20 2.22
Information Technology Expenses 9.51 8.18
Donations to Charitable and other institutions 0.47 -
Expenditure on Corporate Social Responsibility (Refer Note c below) 1.35 -
Other Expenses 61.11 54.05
Total 952.80 846.83
* Includes Stores Consumed 58.46 47.64
(a) Auditor's Remuneration ` in Crores
ParticularsYear Ended31-Mar-2018
Year Ended31-Mar-2017
As Auditor:
Audit Fee 0.43 0.38
Tax Audit Fee 0.04 0.04
Audit of Consolidated Financial Statements 0.04 0.04
In other capacity:
Certification Engagements 0.06 0.06
Others 0.10 -
Total 0.67 0.52
Notes to Financial Statements

118 Annual Report 2017-18
Tube Investments of India Limited(Formerly known as TI Financial Holdings Limited)
(b) Commission and Sitting Fees to Non Whole Time Directors
Pursuant to the Scheme of Arrangement (Refer Note 2), in the previous year, the Commission and sitting fees aggregating to `1.62 Cr. has been transferred from the Demerged Company.
(c) Corporate Social Responsibility: ` in Crores
ParticularsYear Ended31-Mar-2018
Year Ended31-Mar-2017
Gross amount required to be spent by the Company during the year 1.26 -
Amount spent during the year:
(i) Education 1.35 -
Total 1.35 -
Note 28. Exceptional Items
ParticularsYear Ended31-Mar-2018
Year Ended31-Mar-2017
Provision for Impairment of Investment in Joint Ventures 25.25 -
25.25 -
During the current year, considering the market factors, changes in future project potential and accumulated losses, the company has recognised an impairment loss of `25.25 Crores in the Statement of Profit and Loss (Previous Year – Nil), in respect of investment made in Joint Ventures, carried at cost.
Note 29. Income Tax Expense
The major components of income tax expense for the years ended 31st March 2018 and 31st March 2017 are:
Statement of Profit and Loss ` in Crores
ParticularsYear Ended31-Mar-2018
Year Ended31-Mar-2017
Current Tax:
Current income tax charge 74.16 58.25
Adjustments in respect of current income tax of previous years (7.68) (16.94)
Deferred Tax:
Relating to the origination and reversal of temporary differences (10.25) 1.24
Income Tax expense reported in the Statement of Profit and Loss 56.23 42.55
Other Comprehensive Income(OCI) ` in Crores
ParticularsYear Ended31-Mar-2018
Year Ended31-Mar-2017
Tax effect on
(Loss) / Gain on FVTOCI Equity Investments (0.43) 0.01
Re-measurement Gain / (Loss) on Defined Benefit Obligations 0.51 (1.43)
Movement on cash flow hedges 0.07 0.18
Income Tax charged to OCI 0.15 (1.24)
Notes to Financial Statements

Annual Report 2017-18 119
Corporate Overview Management Reports Financial Statements
Reconciliation of Tax Expense and the Accounting Profit multiplied by Corporate Income Tax Rate applicable for 31st March 2017 and 31st March 2018
The tax on the Company's Profit Before Tax differs from the theoretical amount that would arise on using the standard rate of corporation tax in India (34.608%) as follows: ` in Crores
ParticularsYear Ended31-Mar-2018
Year Ended31-Mar-2017
Accounting Profit before Income Tax 192.69 201.50
Profit before Income Tax multiplied by Standard Rate of Corporate Tax in India of 34.608% (Previous year: 34.608%)
66.69 69.74
Effects of:
Benefit u/s 35(2AB) of Income Tax Act, 1961 (6.79) (6.30)
Dividend Income - Exempt from tax (3.94) (0.18)
Benefit u/s 80IC of Income Tax Act, 1961 (1.97) (1.73)
Capital Allowance u/s 32AC of Income Tax Act, 1961 - (5.78)
Other Disallowances 0.85 3.74
Reversal of provision with respect to prior years (7.68) (16.94)
Provision for Impairment of Investments 8.74 -
Effect of enacted Tax rate on Deferred tax 0.33 -
Net Effective Income Tax 56.23 42.55
From 1st April 2018, there is an increase in effective income tax rate from 34.608% to 34.944%. As a result, Deferred tax balances have been re-measured accordingly using the future rate.
Note 30. Research and Development expenses
Revenue Expenditure* ` in Crores
ParticularsYear Ended31-Mar-2018
Year Ended31-Mar-2017
Employee Benefits Expense 9.53 9.97
Consumption of Stores and Spares 2.08 2.34
Power and Fuel 0.26 0.30
Repairs to Machinery 0.84 0.63
Other Expenses 8.82 4.93
21.53 18.17
Capital Expenditure ` in Crores
ParticularsYear Ended
31-Mar-2018Year Ended
31-Mar-2017Building 0.03 -
Plant and Machinery 5.63 0.28
Office Equipment 0.36 0.25
Furniture and Fixtures 0.06 0.01
6.08 0.54
* Recognized in Employee Benefit Expenses and Other Expenses respectively.
Notes to Financial Statements

120 Annual Report 2017-18
Tube Investments of India Limited(Formerly known as TI Financial Holdings Limited)
Note 31. Components of Other Comprehensive Income (OCI)The disaggregation of changes to OCI by each type of reserve in Equity is shown below:
During the year ended 31-Mar-2018 ` in Crores
Cash flow hedge reserve
FVTOCI reserveRetained Earnings
Total
Foreign Exchange Forward Contracts 0.12 - - 0.12
Loss on FVTOCI Financial Assets - (0.64) - (0.64)
Re-measurement gains on Defined Benefit Plans - - 0.95 0.95
Total 0.12 (0.64) 0.95 0.43
During the year ended 31-Mar-2017 ` in Crores
Cash flow hedge reserve
FVTOCI reserveRetained Earnings
Total
Foreign Exchange Forward Contracts 0.33 - - 0.33
Gain on FVTOCI Financial Assets - 0.70 - 0.70
Re-measurement losses on Defined Benefit Plans - - (2.70) (2.70)
0.33 0.70 (2.70) (1.67)
Note 32. Earnings Per Share
The following reflects the Profit and Share data used in the basic and diluted EPS computations:
ParticularsYear Ended31-Mar-2018
Year Ended31-Mar-2017
Profit After Tax (` in Crores) 136.46 158.95
Weighted average number of Shares
- Basic 18,74,91,054 18,74,47,871
- Diluted 18,76,29,895 18,74,47,871
Earning Per Share of `1 each
- Basic 7.28 8.48
- Diluted 7.27 8.48
Weighted average number of Equity Shares in calculating Basic Earnings Per Share 18,74,91,054 18,74,47,871
Dilution - Stock Options granted under ESOP (Refer Note 35) 1,38,841 -
Weighted average number of Equity Shares in calculating Diluted EPS 18,76,29,895 18,74,47,871
Note 33. Significant Accounting Judgements, Estimates and Assumptions
The preparation of the Company’s Standalone Financial Statements requires management to make judgements, estimates and assumptions that affect the reported amounts of revenues, expenses, assets and liabilities, and the accompanying disclosures, and the disclosure of contingent liabilities. Uncertainty about these assumptions and estimates could result in outcomes that require a material adjustment to the carrying amount of assets or liabilities affected in future periods.
a. Judgements
In the process of applying the Company’s accounting policies, management has not made any judgements, which have significant effect on the amounts recognised in the Standalone Financial Statements.
Notes to Financial Statements

Annual Report 2017-18 121
Corporate Overview Management Reports Financial Statements
b. Estimates and Assumptions
The key assumptions concerning the future and other key sources of estimation uncertainty at the reporting date, that have a significant risk of causing a material adjustment to the carrying amounts of assets and liabilities within the next financial year, are described below. The Company based its assumptions and estimates on parameters available when the Standalone Financial Statements were prepared. Existing circumstances and assumptions about future developments, however, may change due to market changes or circumstances arising that are beyond the control of the Company. Such changes are reflected in the assumptions when they occur.
i. Impairment of Non-Financial Assets
Impairment exists when the carrying value of an asset or cash generating unit exceeds its recoverable amount, which is the higher of its fair value less costs of disposal and its value in use. The fair value less costs of disposal calculation is based on available data from binding sales transactions, conducted at arm’s length, for similar assets or observable market prices less incremental costs for disposing of the asset. The value in use calculation is based on a DCF model.
ii. Taxes
Deferred tax assets are recognised for unused tax losses to the extent that it is probable that taxable profit will be available against which the losses can be utilised. Significant management judgement is required to determine the amount of deferred tax assets that can be recognised, based upon the likely timing and the level of future taxable profits together with future tax planning strategies.
iii. Employee Benefits
The cost of the defined benefit gratuity plan and other post-employment leave encashment benefit and the present value of the gratuity obligation are determined using actuarial valuations. An actuarial valuation involves making various assumptions that may differ from actual developments in the future. These include the determination of the discount rate, future salary increases and mortality rates. Due to the complexities involved in the valuation and its long-term nature, a defined benefit obligation is highly sensitive to changes in these assumptions. All assumptions are reviewed at each reporting date. Further details about defined benefit obligations are given in Note 36.
iv. Fair Value Measurement of Financial Instruments
When the fair values of financial assets and financial liabilities recorded in the Balance Sheet cannot be measured based on quoted prices in active markets, their fair value is measured using valuation techniques including the DCF model. The inputs to these models are taken from observable markets where possible, but where this is not feasible, a degree of judgement is required in establishing fair values. Judgements include considerations of inputs such as liquidity risk, Credit risk and volatility. Changes in assumptions about these factors could affect the reported fair value of financial instruments. See Note 42 for further disclosures.
Note 34. Standards issued but not yet effective
The amendments to standards that are issued, but not yet effective, up to the date of issuance of the Company’s financial statements are disclosed below. The Company intends to adopt these standards, if applicable, when they become effective.
The Ministry of Corporate Affairs (MCA) has the Companies (Indian Accounting Standards) Amendment Rules, 2017 and Companies (Indian Accounting Standards) Amendment Rules, 2018 amending the following standard:
Ind AS 115 Revenue from Contracts with Customers
Ind AS 115 was notified on 28th March 2018 and establishes a five-step model to account for revenue arising from contracts with customers. Under Ind AS 115, revenue is recognised at an amount that reflects the consideration to which an entity expects to be entitled in exchange for transferring goods or services to a customer.
The new revenue standard will supersede all current revenue recognition requirements under Ind AS. This new standard requires revenue to be recognized when promised goods or services are transferred to customers in amounts that reflect the
Notes to Financial Statements

122 Annual Report 2017-18
Tube Investments of India Limited(Formerly known as TI Financial Holdings Limited)
consideration to which the Company expects to be entitled in exchange for those goods or services. Adoption of the new rules could affect the timing of revenue recognition for certain transactions of the Company. Ind AS 115 is effective for the Company in the first quarter of fiscal 2019 using either one of two methods: (i) retrospectively to each prior reporting period presented in accordance with Ind AS 8 Accounting Policies, Changes in Accounting Estimates and Errors, with the option to elect certain practical expedients as defined within Ind AS 115 (the full retrospective method); or (ii) retrospectively with the cumulative effect of initially applying Ind AS 115 recognized at the date of initial application (1st April 2018) and providing certain additional disclosures as defined in Ind AS 115 (the modified retrospective method).
The Company continues to evaluate the available transition methods and its contractual arrangements. The ultimate impact on revenue resulting from the application of Ind AS 115 will be subject to assessments that are dependent on many variables, including, but not limited to, the terms of the contractual arrangements and the mix of business. The Company's considerations also include, but are not limited to, the comparability of its financial statements and the comparability within its industry from application of the new standard to its contractual arrangements. The Company has established an implementation team to implement Ind AS 115 related to the recognition of revenue from contracts with customers and it continues to evaluate the changes to accounting system and processes, and additional disclosure requirements that may be necessary. A reliable estimate of the quantitative impact of Ind AS 115 on the financial statements will only be possible once the implementation project has been completed.
Amendments to Ind AS 112 Disclosure of Interests in Other Entities: Clarification of the scope of disclosure requirements in Ind AS 112
The amendments clarify that the disclosure requirements in Ind AS 112, other than those in paragraphs B10–B16, apply to an entity’s interest in a subsidiary, a joint venture or an associate (or a portion of its interest in a joint venture or an associate) that is classified (or included in a disposal group that is classified) as held for sale.
Amendments to Ind AS 12 Recognition of Deferred Tax Assets for Unrealised Losses
The amendments clarify that an entity needs to consider whether tax law restricts the sources of taxable profits against which it may make deductions on the reversal of that deductible temporary difference. Furthermore, the amendments provide guidance on how an entity should determine future taxable profits and explain the circumstances in which taxable profit may include the recovery of some assets for more than their carrying amount.
Entities are required to apply the amendments retrospectively. However, on initial application of the amendments, the change in the opening Equity of the earliest comparative period may be recognised in opening retained earnings (or in another component of Equity, as appropriate), without allocating the change between opening retained earnings and other components of Equity. Entities applying this relief must disclose that fact.
These amendments are effective for annual periods beginning on or after 1st April 2018. These amendments are not expected to have any impact on the Company as the Company has no deductible temporary differences or assets that are in the scope of the amendments.
Transfers of Investment Property - Amendments to Ind AS 40
The amendments clarify when an entity should transfer property, including property under construction or development into, or out of investment property. The amendments state that a change in use occurs when the property meets, or ceases to meet, the definition of investment property and there is evidence of the change in use. A mere change in management’s intentions for the use of a property does not provide evidence of a change in use.
Entities should apply the amendments prospectively to changes in use that occur on or after the beginning of the annual reporting period in which the entity first applies the amendments. An entity should reassess the classification of property held at that date and, if applicable, reclassify property to reflect the conditions that exist at that date. Retrospective application in accordance with Ind AS 8 is only permitted if it is possible without the use of hindsight.
The amendments are effective for annual periods beginning on or after 1st April 2018. The Company will apply amendments when they become effective. However, since Company’s current practice is in line with the clarifications issued, the Company does not expect any effect on its Standalone Financial Statements.
Notes to Financial Statements

Annual Report 2017-18 123
Corporate Overview Management Reports Financial Statements
Ind AS 28 Investments in Associates and Joint Ventures – Clarification that measuring investees at fair value through profit or loss is an investment-by-investment choice
The amendments clarify that:
• An entity that is a venture capital organisation, or other qualifying entity, may elect, at initial recognition on an investment-by-investment basis, to measure its investments in associates and joint ventures at fair value through profit or loss.
• If an entity, that is not itself an investment entity, has an interest in an associate or joint venture that is an investment entity, the entity may, when applying the equity method, elect to retain the fair value measurement applied by that investment entity associate or joint venture to the investment entity associate’s or joint venture’s interests in subsidiaries. This election is made separately for each investment entity associate or joint venture, at the later of the date on which: (a) the investment entity associate or joint venture is initially recognised; (b) the associate or joint venture becomes an investment entity; and (c) the investment entity associate or joint venture first becomes a parent.
The amendments should be applied retrospectively and are effective from 1st April 2018. These amendments are not applicable to the Company.
Appendix B to Ind AS 21 Foreign Currency Transactions and Advance Consideration
The Appendix clarifies that, in determining the date of transaction for the purpose of determining the exchange rate to use on initial recognition of the related asset, expense or income (or part of it) is the date on which an entity initially recognizes a non-monetary asset or non-monetary liability relating to advance consideration. If there are multiple payments or receipts in advance, then the entity must determine the transaction date for each payment or receipt of advance consideration.
Entities may apply the Appendix requirements on a fully retrospective basis. Alternatively, an entity may apply these requirements prospectively to all assets, expenses and income in its scope that are initially recognised on or after:
• The beginning of the reporting period in which the entity first applies the Appendix, or
• The beginning of a prior reporting period presented as comparative information in the financial statements of the reporting period in which the entity first applies the Appendix.
The Appendix is effective for annual periods beginning on or after 1st April 2018. A reliable estimate of the quantitative impact of Ind AS 21 on the financial statements will only be possible once the implementation project has been completed.
Note 35. Stock Options pursuant to Scheme of Arrangement (Refer Note 2)
Pursuant to the Scheme of Arrangement (Refer Note 2), during the year, 3,63,763 stock options were granted to eligible employees at the rate of one stock option of the Company for every stock option held and outstanding in the Demerged Company on the date of the Nomination and Remuneration Committee Resolution dated 21st November 2017.
Further, during the year, the Nomination and Remuneration Committee of the Board of Directors of the Company, at its meeting held on 12th February 2018, approved the grant of 10,86,480 Stock Options and 2,62,200 Stock Options to eligible employees of the Company.
In this regard, the Company has recognised expense amounting to `5.29 Cr for employees services received during the year, shown under Salaries, Wages and Bonus (Refer Note 24).
Notes to Financial Statements

124 Annual Report 2017-18
Tube Investments of India Limited(Formerly known as TI Financial Holdings Limited)
The movement in Stock Options are given below:
Particulars Date of Grant Options Outstanding
as at01-Apr-2017
During the Year 2017-18 Options Outstanding
as at31-Mar-2018
Options vested but
not exercised as at
31-Mar-2018
Options Granted
Options Cancelled /
lapsed
Options Exercised
and allotted
Grant 1 21-Nov-17 - 51,516 - 4,672 46,844 46,844
Grant 2 21-Nov-17 - 34,241 - 34,241 - -
Grant 3 21-Nov-17 - 21,280 - 4,864 16,416 16,416
Grant 4 21-Nov-17 - 15,112 - - 15,112 15,112
Grant 5 21-Nov-17 - 9,344 - 2,000 7,344 7,344
Grant 6 21-Nov-17 - 2,32,270 9,660 - 2,22,610 2,22,610
Grant 7 12-Feb-18 - 10,86,480 - - 10,86,480 -
Grant 8 12-Feb-18 - 2,62,200 - - 2,62,200 -
Total - 17,12,443 9,660 45,777 16,57,006 3,08,326
The details of Stock Options granted to certain employees are given below:
ParticularsDate of Grant
Weighted Average Exercise Price (`)
Options Granted
Options Cancelled / lapsed
Options Exercised
and allotted
Options vested and
Outstanding at the End of the Year
Options unvested
and Outstanding at the End of
the Year
Vested Date
Weighted Average
Remaining Contractual
Life(In Years)
Grant 1 21-Nov-17 44.36 51,516 - 4,672 46,844 - 21-Nov-17 2.72
Grant 2 21-Nov-17 17.61 34,241 - 34,241 - - 21-Nov-17 -
Grant 3 21-Nov-17 43.42 21,280 - 4,864 16,416 - 21-Nov-17 1.96
Grant 4 21-Nov-17 43.42 15,112 - - 15,112 - 21-Nov-17 1.33
Grant 5 21-Nov-17 13.78 9,344 - 2,000 7,344 - 21-Nov-17 0.33
Grant 6 21-Nov-17 187.29 2,32,270 9,660 - 2,22,610 - 15-Mar-18 4.96
Grant 7 12-Feb-18 270.20 10,86,480 - - - 10,86,480 - 5.87
Grant 8 12-Feb-18 270.20 2,62,200 - - - 2,62,200 - 6.88
17,12,443 9,660 45,777 3,08,326 13,48,680
The following tables list the inputs to the Black Scholes model used for the plans for the year ended 31st March 2018:
Particulars Vesting Date
Risk-free Interest
Rate
Expected Life
Expected Volatility of Share Price
Dividend Yield
Price of the Underlying Share
in the market at the time of Option grant
Fair Value of the Option
% (p.a) (Years) (%) (%) (`.) (`.)
Grant 1 21-Nov-17 8.23 4.64 43.70 1.86 44.36 21.30
Grant 2 21-Nov-17 8.23 2.18 33.90 1.86 17.61 6.51
Grant 3 21-Nov-17 8.22 3.93 42.84 1.86 43.42 21.93
Grant 4 21-Nov-17 8.23 2.88 39.83 1.86 43.42 20.71
Grant 5 21-Nov-17 6.58 2.04 28.69 1.86 13.78 5.18
Grant 6 21-Nov-17 6.75 3.50 31.49 0.25 187.29 60.27
Grant 7 12-Feb-18 7.33 4.63 38.19 0.00 270.20 117.98
Grant 8 12-Feb-18 7.41 5.21 38.19 0.00 270.20 125.66
Notes to Financial Statements

Annual Report 2017-18 125
Corporate Overview Management Reports Financial Statements
Note 36. Employee Benefits Obligation
Defined Benefit Plan
a. Gratuity
Under the Gratuity plan operated by the Company, every employee who has completed at least five years of service gets a Gratuity on departure at 15 days on last drawn salary for each completed year of service as per Payment of Gratuity Act, 1972. The scheme is funded with an Insurance Company in the form of qualifying insurance policy. The following table summarizes the components of net benefit expense recognised in the Statement of Profit and Loss and the funded status and amounts recognised in the Balance Sheet.
` in Crores
Particulars 31-Mar-2018 31-Mar-2017
A. Change in defined benefit obligation
1. Defined benefit obligation at beginning of period 51.32 -
Defined benefit obligation transferred pursuant to scheme of arrangement (Note 2) - 42.25
2. Service cost
a. Current service cost 3.15 3.99
3. Interest expenses 3.72 3.30
4. Cash flows
a. Benefit payments from plan (3.55) (1.91)
5. Remeasurements
a. Effect of changes in financial assumptions (3.21) 2.88
b. Effect of experience adjustments 1.75 0.81
6. Defined benefit obligation at end of period 53.18 51.32
` in Crores
B. Change in fair value of plan assets 31-Mar-2018 31-Mar-2017
1. Fair value of plan assets at beginning of period 51.41 -
Fair value of plan assets transferred pursuant to scheme of arrangement (Note 2) - 42.41
2. Interest income 3.72 3.75
3. Cash flows
a. Total employer contributions 1.64 7.60
b. Benefit payments from plan assets (2.73) (1.91)
4. Remeasurements
a. Return on plan assets (excluding interest income) - (0.44)
5. Fair value of plan assets at end of period 54.04 51.41
` in Crores
C. Amounts recognized in the Balance Sheet 31-Mar-2018 31-Mar-2017
1. Defined benefit obligation 53.18 51.32
2. Fair value of plan assets (54.04) (51.41)
3. Funded status (0.86) (0.09)
4. Net defined benefit liability (asset) (0.86) (0.09)
Notes to Financial Statements
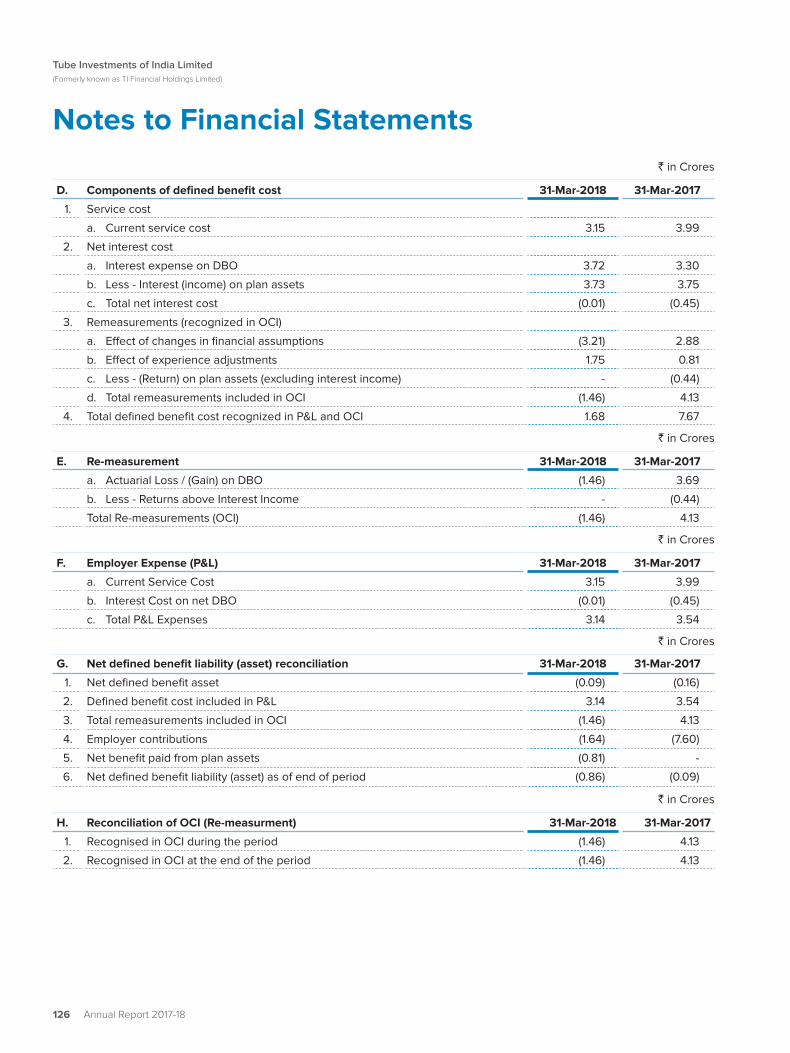
126 Annual Report 2017-18
Tube Investments of India Limited(Formerly known as TI Financial Holdings Limited)
` in Crores
D. Components of defined benefit cost 31-Mar-2018 31-Mar-2017
1. Service cost
a. Current service cost 3.15 3.99
2. Net interest cost
a. Interest expense on DBO 3.72 3.30
b. Less - Interest (income) on plan assets 3.73 3.75
c. Total net interest cost (0.01) (0.45)
3. Remeasurements (recognized in OCI)
a. Effect of changes in financial assumptions (3.21) 2.88
b. Effect of experience adjustments 1.75 0.81
c. Less - (Return) on plan assets (excluding interest income) - (0.44)
d. Total remeasurements included in OCI (1.46) 4.13
4. Total defined benefit cost recognized in P&L and OCI 1.68 7.67
` in Crores
E. Re-measurement 31-Mar-2018 31-Mar-2017
a. Actuarial Loss / (Gain) on DBO (1.46) 3.69
b. Less - Returns above Interest Income - (0.44)
Total Re-measurements (OCI) (1.46) 4.13
` in Crores
F. Employer Expense (P&L) 31-Mar-2018 31-Mar-2017
a. Current Service Cost 3.15 3.99
b. Interest Cost on net DBO (0.01) (0.45)
c. Total P&L Expenses 3.14 3.54
` in Crores
G. Net defined benefit liability (asset) reconciliation 31-Mar-2018 31-Mar-2017
1. Net defined benefit asset (0.09) (0.16)
2. Defined benefit cost included in P&L 3.14 3.54
3. Total remeasurements included in OCI (1.46) 4.13
4. Employer contributions (1.64) (7.60)
5. Net benefit paid from plan assets (0.81) -
6. Net defined benefit liability (asset) as of end of period (0.86) (0.09)
` in Crores
H. Reconciliation of OCI (Re-measurment) 31-Mar-2018 31-Mar-2017
1. Recognised in OCI during the period (1.46) 4.13
2. Recognised in OCI at the end of the period (1.46) 4.13
Notes to Financial Statements

Annual Report 2017-18 127
Corporate Overview Management Reports Financial Statements
` in Crores
I. Sensitivity analysis - DBO end of Period 31-Mar-2018 31-Mar-2017
1. Discount rate +1% 49.29 47.52
2. Discount rate - 1% 57.56 55.63
3. Salary Increase Rate +1% 57.47 55.33
4. Salary Increase Rate -1% 49.28 47.71
5. Attrition Rate +1% 53.94 51.98
6. Attrition Rate -1% 52.32 50.59
` in Crores
J. Significant actuarial assumptions 31-Mar-2018 31-Mar-2017
1. Discount rate Current Year 8.00% 7.25%
2. Discount rate Previous Year 7.25% 8.00%
3. Salary increase rate Uniform 5.0% Uniform 5.0%
4. Attrition Rate 3.0% [AGE 0TO30]1.0% [AGE 31TO40]2.0% [AGE DEFAULT]
3.0% [AGE 0TO30]1.0% [AGE 31TO40]2.0% [AGE DEFAULT]
5. Retirement Age 58 58
6. Pre-retirement mortality Indian Assured Lives Mortality
(2006-08) Ultimate
Indian Assured Lives Mortality
(2006-08) Ultimate
7. Disability Nil Nil
K. Data 31-Mar-2018 31-Mar-2017
1. No. 3,368 3,474
2. Avg. Age (years) 39 39
3. Avg. Past Service (years) 14 12
4. Avg. Sal. Monthly (`) 23,286 21,131
5. Future Service (years) 19 19
6. Weighted average duration of DBO 15 15
` in Crores
L. Expected cash flows for following year 31-Mar-2018 31-Mar-2017
1. Expected employer contributions / Additional. Provision Next Year 2.14 4.45
2. Expected total benefit payments
Year 1 4.76 4.19
Year 2 to Year 5 20.24 14.90
Next 5 years 29.48 21.34
` in Crores
M. Defined benefit obligation at end of period 31-Mar-2018 31-Mar-2017
Current Obligation 4.76 4.19
Non-Current Obligation 48.42 47.13
Total 53.18 51.32
Notes to Financial Statements

128 Annual Report 2017-18
Tube Investments of India Limited(Formerly known as TI Financial Holdings Limited)
SUMMARY ` in Crores
Assets / Liabilities 31-Mar-2018 31-Mar-2017
1. Defined benefit obligation at end of period 53.18 51.32
2. Fair value of plan assets at end of period 54.04 51.41
3. Net defined benefit liability (asset) (0.86) (0.09)
4. Defined benefit cost included in P&L 3.14 3.54
5. Total remeasurements included in OCI (1.46) 4.13
6. Total defined benefit cost recognized in P&L and OCI 1.68 7.67
Notes:
i. The entire Plan Assets are invested in insurer managed funds with Life Insurance Corporation of India (LIC).
ii. The expected/actual return on Plan Assets is as furnished by LIC.
iii. The estimate of future salary increase takes into account inflation, likely increments, promotions and other relevant factors.
b. Provident Fund
The Company's Provident Fund is exempted under Section 17 of the The Employees' Provident Funds and Miscellaneous Provisions Act, 1952. Conditions for the grant of exemption stipulate that the employer shall make good the deficiency, if any, in the interest rate declared by the Trust over the statutory limit. The Actuary has provided a valuation for Provident Fund liabilities on the basis of guidance issued by Actuarial Society of India and based on the assumptions provided below and the Company does not have additional obligation as at 31st March 2018.
The details of fund and plan assets are given below: ` in Crores
Particulars As at31-Mar-2018
As at31-Mar-2017
Fair value of plan assets at end of period 140.58 137.44
Defined benefit obligation at end of period 136.56 109.63
The principal assumptions used in determining the present value obligation of interest guarantee under the deterministic approach are as follows:
Assumptions 31-Mar-2018 31-Mar-2017
Discount Rate 8.00% 7.25%
Weighted Average Duration of DBO in years 15 15
Expected Investment Return 7.25% 8.67%
Average Interest Rate expected to be declared 8.55% 8.62%
During the year, the Company contributed `6.95 Cr. (Previous year - `5.88 Cr.) under Defined Benefit Plans and the same has been recognised in the Statement of Profit and Loss under Employee Benefits Expense.
c. Long Term Compensated Absences ` in Crores
The assumption used for computing the long term accumulated compensated absences on actuarial basis are as follows:
Assumptions 31-Mar-2018 31-Mar-2017
Discount Rate 8.00% 7.25%
Future Salary Increase (%) 5.00% 5.00%
Attrition Rate 1 to 3% 1 to 3%
Notes to Financial Statements

Annual Report 2017-18 129
Corporate Overview Management Reports Financial Statements
d) Contributions to Defined Contribution Plans
During the year, the Company recognised ̀ 5.19 Cr. (Previous Year - ̀ 5.52 Cr.) to Provident Fund under Defined Contribution Plan, `6.34 Cr. (Previous Year - `5.22 Cr.) for Contributions to Superannuation Fund and `1.47 Cr. (Previous Year - `1.10 Cr.) for Contributions to Employee State Insurance Scheme in the Statement of Profit and Loss.
Note 37. Commitment and Contingencies ` in Crores
ParticularsAs at
31-Mar-2018As at
31-Mar-2017
I. Contingent Liabilities
a) Disputed Income-Tax demands under appeal / remand pending before various appellate/ assessing authorities against the Demerged Company (Refer Note d below).
39.40 39.36
b) Disputed Service Tax, Excise and Customs duty demand amounting to `0.11 Cr. (Previous Year - `0.11 Cr.) pertaining to financial years 2001-02 to 2002-03 under appeal pending before the Appellate Tribunal. The Management is of the opinion that the above demands are arbitrary and are not sustainable
0.11 0.11
c) Claims against the Company not acknowledged as debts 1.02 0.83
II. Commitments
a) Estimated amount of contracts remaining to be executed on capital expenditure and not provided for
58.69 77.44
b) Export obligation under EPCG / Advance License Scheme to be fulfilled. The Company is confident of meeting its obligations under the Schemes within the Stipulated Period.
7.95 10.22
a. Draft Assessment Orders received from Income Tax Authorities and Show Cause Notices received from various other Government Authorities, pending adjudication, have not been considered as Contingent Liabilities.
b. The uncertainties and possible reimbursement in respect of the above mentioned contingent liabilities are dependent on the outcome of various legal proceedings and therefore, cannot be predicted accurately.
c. The Company considers the Cash flow in each of the cases to be uncertain and hence considered as Contingent liabilities.
d. As per the Scheme of Arrangement (Refer Note 2), all taxes, duties, cess payable by the Demerged Company relating to the Manufacturing Business Undertaking including all advance tax payments, tax deducted at source or any refunds / credit / claims relating thereto shall, for all purposes, be treated as advance tax payments, tax deducted at source or refunds / credit / claims, as the case may be, of the Company, provided however that any direct and indirect taxes that cannot specifically be earmarked as the liability or refunds / credit / claims relating to the Manufacturing Business Undertaking shall continue to be borne by the Demerged Company. The Scheme further provides that if the Demerged Company or their successor(s) receives any refunds / credit / claims or incurs any liability in respect of the Manufacturing Business Undertaking, the same shall be on behalf of and as a trustee of the Company and the same shall be refunded to / paid by the Company.
Notes to Financial Statements

130 Annual Report 2017-18
Tube Investments of India Limited(Formerly known as TI Financial Holdings Limited)
Note 38. Disclosure in respect of Related Parties pursuant to Ind AS 24
a) List of Related Parties
I. Subsidiary Companies
a. Shanthi Gears Limited
b. Financiere C10 SAS and its Subsidiaries namely:
i. Sedis SAS
ii. Sedis Company Limited
iii. Sedis Gmbh
c. Great Cycles (Private) Limited (with effect from 9th March 2018)
d. Creative Cycles (Private) Limited (with effect from 9th March 2018)
II. Joint Venture Company
a. TI Tsubamex Private Limited
b. TI Absolute Concepts Private Limited
III. Company having Significant Influence
a. Ambadi Investments Limited (Refer Note 12c)
b. Parry Agro Industries Limited
c. Parry Enterprises India Limited
IV. Key Management Personnel (KMP)
a. Mr. L. Ramkumar – Managing Director
b. Mr. Vellayan Subbiah – Managing Director Designate (with effect from 19th August 2017)
c. Mr. S. Suresh – Company Secretary
d. Mr. K Mahendra Kumar – Chief Financial Officer
V. Non executive Directors
a. Mr. M M Murugappan, Chairman
b. Mr. Hemant M Nerurkar
c. Mr. Pradeep V Bhide
d. Mr. S Sandilya
e. Ms. Madhu Dubhashi
f. Mr. Ramesh K B Menon (with effect from 16th November 2017)
Notes to Financial Statements

Annual Report 2017-18 131
Corporate Overview Management Reports Financial Statements
During the year the following transactions were carried out with the related parties in the ordinary course of business:
` in Crores
Transaction Related PartyYear Ended31-Mar-2018
Year Ended31-Mar-2017
Services Received Parry Enterprises India Limited 9.93 11.82Dividend Paid Ambadi Investments Limited 22.77 -
Mr. L. Ramkumar 0.04 -Mr. Vellayan Subbaiah 0.14 -
Dividend Received Shanthi Gears Limited 10.03 -Subscription to Equity Shares Great Cycles (Private) Limited 16.98 -
Creative Cycles (Private) Limited 6.47 -TI Tsubamex Private Limited 4.00 -TI Absolute Concepts Private Limited 3.75 10.00
Sales and Services rendered Shanthi Gears Limited 2.25 2.01Financiere C10 SAS 5.34 4.29Sedis SAS 20.43 17.93TI Absolute Concepts Private Limited 1.34 0.58
Purchases and Services received Shanthi Gears Limited 4.74 0.89Sedis SAS 0.36 0.03Great Cycles (Private) Limited 0.19 -Creative Cycles (Private) Limited 2.80 -
Remuneration (Refer note b below) Key Management Personnel 10.00 4.84Fair value Cost of Stock options granted Key Management Personnel 1.70 -Sitting Fees and Commission Non executive directors 1.60 1.62Reimbursement of Expenses - Received Shanthi Gears Limited 1.23 1.32
TI Tsubamex Private Limited 0.74 0.78Sale of Property, Plant and Equipment TI Tsubamex Private Limited - 0.01
` in Crores
Transaction Related PartyAs at
31-Mar-2018As at
31-Mar-2017Rental Deposit Payable Shanthi Gears Limited 0.04 0.04Payable Parry Enterprises India Limited 0.16 0.13
Shanthi Gears Limited 0.04 -Sedis SAS 0.02 -Key Managerial Personnel 2.29 1.12
Receivable Shanthi Gears Limited 0.03 0.10TI Tsubamex Private Limited 0.82 0.57TI Absolute Concepts Private Limited 0.84 0.13Creative Cycles (Private) Limited 0.23 -Sedis SAS 6.72 5.24
Advances Paid Creative Cycles (Private) Limited 3.31 -Final Dividend - Proposed Mr. L. Ramkumar 0.01 -
Mr. Vellayan Subbaiah 0.02 -
Terms and Conditions of transaction with Related Parties
The sale to and purchases from Related Parties are made on terms equivalent to those that prevail in arm’s length transactions. Outstanding balances at the year-end are unsecured and interest free and settlement occurs in Cash. For the year ended 31st March 2018, the Company has not recorded any impairment of receivables relating to amounts owed by Related Parties (Refer Note 10b and Note 16b for Trade Receivables and Trade Payables respectively).
Notes to Financial Statements
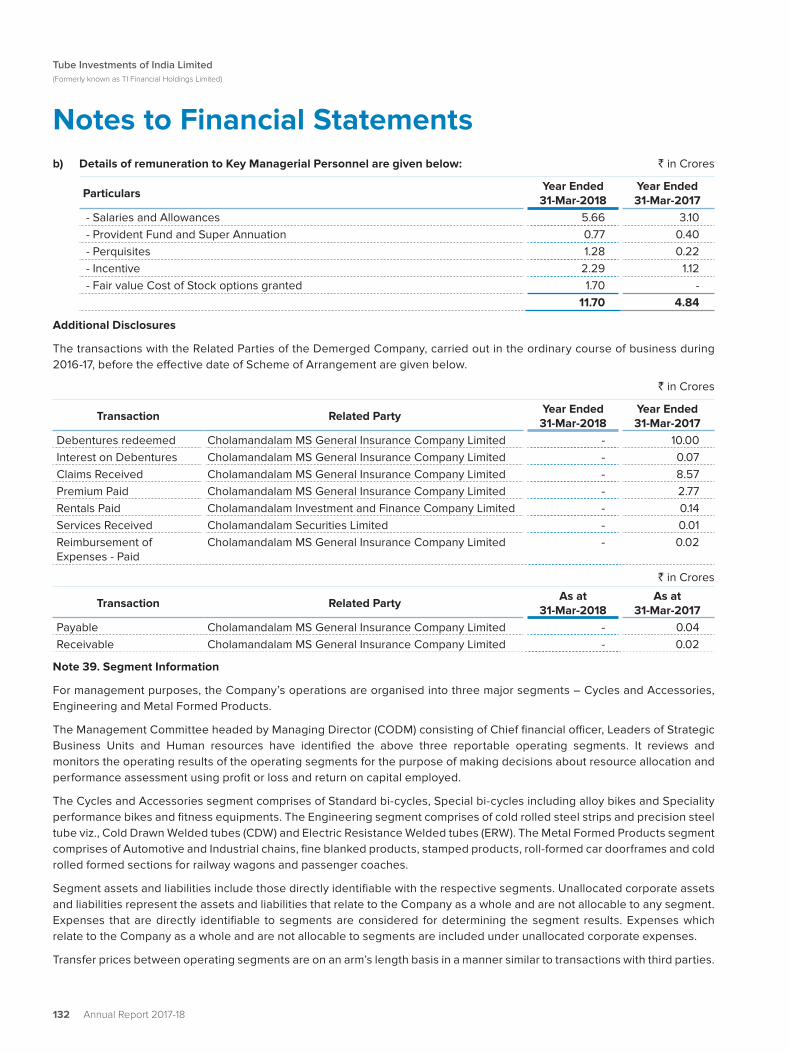
132 Annual Report 2017-18
Tube Investments of India Limited(Formerly known as TI Financial Holdings Limited)
b) Details of remuneration to Key Managerial Personnel are given below: ` in Crores
ParticularsYear Ended31-Mar-2018
Year Ended31-Mar-2017
- Salaries and Allowances 5.66 3.10 - Provident Fund and Super Annuation 0.77 0.40 - Perquisites 1.28 0.22 - Incentive 2.29 1.12 - Fair value Cost of Stock options granted 1.70 -
11.70 4.84
Additional Disclosures
The transactions with the Related Parties of the Demerged Company, carried out in the ordinary course of business during 2016-17, before the effective date of Scheme of Arrangement are given below.
` in Crores
Transaction Related PartyYear Ended31-Mar-2018
Year Ended31-Mar-2017
Debentures redeemed Cholamandalam MS General Insurance Company Limited - 10.00Interest on Debentures Cholamandalam MS General Insurance Company Limited - 0.07Claims Received Cholamandalam MS General Insurance Company Limited - 8.57Premium Paid Cholamandalam MS General Insurance Company Limited - 2.77Rentals Paid Cholamandalam Investment and Finance Company Limited - 0.14Services Received Cholamandalam Securities Limited - 0.01Reimbursement of Expenses - Paid
Cholamandalam MS General Insurance Company Limited - 0.02
` in Crores
Transaction Related PartyAs at
31-Mar-2018As at
31-Mar-2017Payable Cholamandalam MS General Insurance Company Limited - 0.04Receivable Cholamandalam MS General Insurance Company Limited - 0.02
Note 39. Segment Information
For management purposes, the Company’s operations are organised into three major segments – Cycles and Accessories, Engineering and Metal Formed Products.
The Management Committee headed by Managing Director (CODM) consisting of Chief financial officer, Leaders of Strategic Business Units and Human resources have identified the above three reportable operating segments. It reviews and monitors the operating results of the operating segments for the purpose of making decisions about resource allocation and performance assessment using profit or loss and return on capital employed.
The Cycles and Accessories segment comprises of Standard bi-cycles, Special bi-cycles including alloy bikes and Speciality performance bikes and fitness equipments. The Engineering segment comprises of cold rolled steel strips and precision steel tube viz., Cold Drawn Welded tubes (CDW) and Electric Resistance Welded tubes (ERW). The Metal Formed Products segment comprises of Automotive and Industrial chains, fine blanked products, stamped products, roll-formed car doorframes and cold rolled formed sections for railway wagons and passenger coaches.
Segment assets and liabilities include those directly identifiable with the respective segments. Unallocated corporate assets and liabilities represent the assets and liabilities that relate to the Company as a whole and are not allocable to any segment. Expenses that are directly identifiable to segments are considered for determining the segment results. Expenses which relate to the Company as a whole and are not allocable to segments are included under unallocated corporate expenses.
Transfer prices between operating segments are on an arm’s length basis in a manner similar to transactions with third parties.
Notes to Financial Statements

Annual Report 2017-18 133
Corporate Overview Management Reports Financial Statements
`
in C
rore
s
PAR
TIC
ULA
RS
CY
CLE
S A
ND
A
CC
ESS
OR
IES
ENG
INEE
RIN
GM
ETA
L FO
RM
ED
PR
OD
UC
TSEL
IMIN
ATI
ON
STO
TAL
20
17-1
82
016
-17
20
17-1
82
016
-17
20
17-1
82
016
-17
20
17-1
82
016
-17
20
17-1
82
016
-17
REV
ENU
EEx
tern
al S
ales
1,2
98.
83 1
,347
.52
1,9
93.
16 1
,770
.14 1
,117.
99
1,0
90.
11 -
- 4
,40
9.9
8 4
,20
7.77
Inte
r-Se
gmen
t Sal
es -
- 1
89.8
5 1
62.
25 1
.15 0
.98
(19
1.00
) (1
63.
23)
- -
Oth
er O
pera
ting
Reve
nue
8.4
9 1
1.17
19
2.84
144
.54
62.
69
46
.10 -
- 2
64.
02
20
1.81
Una
lloca
ted
Cor
pora
te In
com
e 7
.59
6.3
1To
tal R
even
ue 1
,30
7.32
1,3
58
.69
2,3
75.8
5 2
,076
.93
1,18
1.8
3 1
,137.
19 (1
91.
00
) (1
63.
23)
4,6
81.
59
4,4
15.8
9U
nallo
cate
d C
orpo
rate
Exp
ense
s ne
t of
Inco
me
(16
.79
) (7
.13)
RES
ULT
SO
pera
ting
Profi
t (0
.14)
36
.03
178
.15 1
44.8
5 1
02.
55
87.
56
- -
26
3.77
26
1.31
Profi
t / (L
oss)
on
Sale
of P
rope
rty,
Pl
ant a
nd E
quip
men
t 0
.47
(0.3
0)
(3.2
3) 0
.93
(0.10
) 0
.40
- -
(2.8
6)
1.0
3
Net
Ope
ratin
g P
rofit
0.3
3 3
5.7
3 1
74.9
2 1
45.7
8 1
02
.45
87.
96
26
0.9
1 2
62
.34
Div
iden
d In
com
e -
- -
- -
- -
- 1
1.38
0.5
2Fi
nanc
e C
osts
- -
- -
- -
- -
(56
.38)
(72.
05
)Ta
x Ex
pens
e -
- -
- -
- -
- (5
6.2
3) (4
2.5
5)
Exce
ptio
nal I
tem
s- P
rovi
sion
for I
mpa
irmen
t of
Inve
stm
ent i
n Jo
int V
entu
res
- -
- -
- -
- (2
5.2
5)
-
Profi
t on
Sale
of C
urre
nt In
vest
men
ts
(Net
) -
- -
- -
- -
- 2
.03
10.
69
Net
Pro
fit 0
.33
35
.73
174
.92
145
.78
10
2.4
5 8
7.9
6 -
- 1
36.4
6 1
58
.95
AS
SET
SSe
gmen
t Ass
ets
55
4.0
7 6
21.9
3 1
,165
.81
946
.96
59
4.45
55
8.0
4 (3
9.20
) (2
9.85
) 2
,275
.13 2
,09
7.0
8U
nallo
cate
d C
orpo
rate
Ass
ets
65
8.40
739
.25
Tota
l Ass
ets
55
4.0
7 6
21.
93
1,16
5.8
1 9
46.9
6 5
94.
45 5
58
.04
(39.
20
) (2
9.8
5)
2,9
33.5
3 2
,836
.33
LIA
BIL
ITIE
SSe
gmen
t Lia
bilit
ies
320
.70
332
.00
49
4.0
1 3
17.7
0 2
02.
70 1
87.3
5 (3
9.20
) (2
9.85
) 9
78.2
1 8
07.
20U
nallo
cate
d C
orpo
rate
Lia
bilit
ies
26
.50
84.
89To
tal L
iabi
litie
s 3
20
.70
332
.00
49
4.0
1 3
17.7
0 2
02
.70
18
7.35
(39.
20
) (2
9.8
5)
1,0
04.
71 8
92
.09
OTH
ER IN
FOR
MA
TIO
NC
apita
l Exp
endi
ture
7.3
8 5
4.27
140
.56
48.
56
56
.38
45
.61
- -
20
4.32
148
.44
Una
lloca
ted
Cor
pora
te C
apita
l Ex
pend
iture
11.6
5 3
.80
Dep
reci
atio
n an
d A
mor
tisat
ion
Expe
nse
15
.83
15
.80
65
.66
63.
18 4
3.31
39.
38 -
- 1
24.8
0 1
18.3
6
Una
lloca
ted
Cor
pora
te D
epre
ciat
ion
3.5
0 2
.89
Inve
stm
ent i
n Jo
int V
entu
res
(Net
of
Impa
irmen
t) -
- -
- -
- -
- 1
2.0
0 2
9.5
0
Notes to Financial Statements

134 Annual Report 2017-18
Tube Investments of India Limited(Formerly known as TI Financial Holdings Limited)
Revenue from External Customers ` in Crores
ParticularsYear Ended31-Mar-2018
Year Ended31-Mar-2017
India 4,327.23 4,068.13
Outside India 354.36 347.76
Total Revenue per Statement of Profit or Loss 4,681.59 4,415.89
There are no sales to external customers more than 10% of Total Revenue.
Non-current operating assets ` in Crores
ParticularsAs at
31-Mar-2018As at
31-Mar-2017India 1,641.28 1,536.88
Outside India - -
Total 1,641.28 1,536.88
Reconciliation of Segment Assets and Liabilities to amounts reflected in the Standalone Financial Statements ` in Crores
ParticularsAs at
31-Mar-2018As at
31-Mar-2017
Segment Assets 2,933.53 2,836.33
Add: Deferred Tax Assets (Note 15) 31.50 38.11
Total Assets 2,965.03 2,874.44
` in Crores
ParticularsAs at
31-Mar-2018As at
31-Mar-2017Segment Liabilities 1,004.71 892.09
Add: Deferred Tax Liabilities (Note 15) 59.71 64.38
Add: Long term and Short term Borrowings (Note 14 and Note 16a) 437.47 650.97
Add: Current maturities of Long term Borrowings (Note 16d) 250.00 124.99
Total Liabilities 1,751.89 1,732.43
Note 40. Operating Leases
The Company has operating lease agreements for certain office space and residential accommodation which are generally cancellable in nature. As per the lease terms, an amount of `18.30 Cr. (Previous Year - `21.37 Cr.) has been recognised in the Statement of Profit and Loss.
Note 41. Hedging activities and derivatives
Cash Flow Hedges
Foreign Exchange Forward Contracts measured at Fair Value through OCI are designated as Hedging Instruments in cash flow hedges of forecast sales in EUR and USD, and also for forecast purchases in USD, EUR and JPY. Currency Swaps measured at Fair Value through Profit and Loss are designated as Hedging Instruments in cash flow hedges of floating rate long term borrowings in USD.
` in Crores
ParticularsAs at 31-Mar-2018 As at 31-Mar-2017
Assets Liabilities Assets Liabilities
Fair Value of Foreign Exchange Forward Contracts - 0.31 - 0.15
Notes to Financial Statements

Annual Report 2017-18 135
Corporate Overview Management Reports Financial Statements
Disclosure of effects of Hedge accounting
As at 31-Mar-2018
Foreign Exchange
Risk on Cash Flow
Hedge
Nominal Value of Hedging Instruments
(No. of Contracts)
Carrying Value of Hedging Instruments ` in Crores
Maturity DateHedge Ratio
Weighted Average Rate
Changes in Fair value
of Hedging Instrument ` in Crores
Changes in the value
of Hedged Item used as
a basis for recognising
hedge effectiveness
` in CroresForeign
Currency Forward
Contracts
Asset Liability Asset Liability05-Apr-2018 to 29-Mar-2019
1:1
1 USD - `65.74
(0.17) 0.1716 18 10.18 21.25
1 EUR - `82.82
1 JPY - `0.63
` in Crores
Cash Flow Hedge
Change in the value of Hedging Instrument recognised in Other
Comprehensive Income
Hedge Inffectiveness recognised in Profit or
Loss
Amount reclassified from Cash Flow Hedge
Reserve to Profit or Loss
Line item affected in Statement of Profit
and Loss because of the Reclassification
Foreign Exchange Risk 1.15 - 0.96 Other Income
As at 31-Mar-2017
Foreign Exchange Risk on Cash Flow
Hedge
Nominal Value of Hedging Instruments
(No. of Contracts)
Carrying Value of Hedging Instruments` in Crores
Maturity DateHedge Ratio
Weighted Average Rate
Changes in Fair
value of Hedging
Instrument
` in Crores
Changes in the value
of Hedged Item used as
a basis for recognising
hedge effectiveness
` in CroresForeign
Currency Forward
Contracts
Asset Liability Asset Liability05-Apr-2017 to 29-Mar-2018
1:1
1 USD - `65.32
(0.36) 0.3639 9 25.75 6.53 1 EUR - `72.39
` in Crores
Cash Flow Hedge
Change in the value of Hedging Instrument recognised in Other
Comprehensive Income
Hedge Inffectiveness recognised in Profit or
Loss
Amount reclassified from Cash Flow Hedge
Reserve to Profit or Loss
Line item affected in Statement of Profit
and Loss because of the Reclassification
Foreign Exchange Risk (0.03) - (0.54) Other Income
Notes to Financial Statements

136 Annual Report 2017-18
Tube Investments of India Limited(Formerly known as TI Financial Holdings Limited)
Note 42.1 Fair Values
The following table presents the carrying amounts and fair value of each category of financial assets and liabilities.
` in Crores
ParticularsCarrying value Fair value
31-Mar-2018 31-Mar-2017 31-Mar-2018 31-Mar-2017
Financial assets
FVTOCI Equity Investments 11.12 12.19 11.12 12.19
Other Financial Assets - Non Current 17.58 17.99 17.58 17.99
Loans 1.45 1.37 1.45 1.37
Trade Receivables 575.44 528.22 575.44 528.22
Current Investments - 102.08 - 102.08
Cash and Cash Equivalents 19.25 18.76 19.25 18.76
Other Financial Assets - Current 23.55 13.04 23.55 13.04
Total 648.39 693.65 648.39 693.65
Financial liabilities
Non-Current Borrowings 200.00 350.00 207.01 361.86
Current Borrowings 237.47 300.97 237.47 300.97
Trade Payables 876.80 717.00 876.80 717.00
Derivative Instruments 0.31 0.15 0.31 0.15
Other Financial Liabilities - Current 296.23 227.27 296.23 227.27
Total 1,610.81 1,595.39 1,617.82 1,607.25
The management assessed that cash and cash equivalents, trade receivables, loans, current investments, other current financial assets, short term borrowings, trade payables and other current financial liabilities approximate their carrying amounts largely due to the short-term maturities of these instruments.
The fair value of the financial assets and liabilities is included at the amount at which the instrument could be exchanged in a current transaction between willing parties, other than in a forced or liquidation sale. The following methods and assumptions were used to estimate the fair values:
i. The fair values of quoted equity investments are derived from quoted market prices in active markets.
ii. The fair values of certain unquoted equity investments have been estimated using Discounted Cash-flow Model (DCF). The valuation is based on certain assumptions like forecast cash-flows, discount rate, etc.
iii. The fair value of borrowings is estimated by discounting expected future cash flows using a discount rate equivalent to the risk-free rate of return, adjusted for the Credit spread considered by the lenders for instruments of the similar maturity.
iv. Derivatives are fair valued using market observable rates and published prices.
Notes to Financial Statements

Annual Report 2017-18 137
Corporate Overview Management Reports Financial Statements
Note 42.2 Fair Values Hierarchy
The following table provides the fair value measurement hierarchy of the Company's assets and liabilities:
Quantitative disclosures fair value measurement heirachy for assets as at 31st March 2018:
Particulars
Fair Value Measurement using
Total
Quoted Price in active markets(Level 1)
Significant observable
inputs(Level 2)
Significant unobservable
inputs(Level 3)
Asset measured at fair value:FVTOCI Equity Investments 11.12 2.37 - 8.75Assets for which fair values are disclosed:Investment Properties * 6.74 - 6.74 -
There have been no transfers between the level 1 and level 2 during the period.* Fair value of investment property is calculated based on valuation given by external independent valuer.
Quantitative disclosures fair value measurement heirachy for liabilties as at 31st March 2018:
Particulars
Fair Value Measurement using
Total
Quoted Price in active markets(Level 1)
Significant observable
inputs(Level 2)
Significant unobservable
inputs(Level 3)
Liabilities measured at fair value:Foreign Exchange forward Contracts 0.31 - 0.31 - Liabilities for which fair values are disclosed:Borrowings:Long term Borrowings 207.01 - 207.01 -
There have been no transfers between the level 1 and level 2 during the period.Quantitative disclosures fair value measurement heirachy for assets as at 31st March 2017:
Particulars
Fair Value Measurement using
Total
Quoted Price in active markets(Level 1)
Significant observable
inputs(Level 2)
Significant unobservable
inputs(Level 3)
Asset measured at fair value:FVTOCI Equity Investments 12.19 2.13 - 10.06 FVTPL Investments 102.08 102.08 - - Assets for which fair values are disclosed:Investment Properties * 6.48 - 6.48 -
There have been no transfers between the level 1 and level 2 during the period* Fair value of investment property is calculated based on valuation given by external independent valuer.
Quantitative disclosures fair value measurement heirachy for liabilties as at 31st March 2017:
Particulars
Fair Value Measurement using
Total
Quoted Price in active markets(Level 1)
Significant observable
inputs(Level 2)
Significant unobservable
inputs(Level 3)
Liabilities measured at fair value:Foreign Exchange forward Contracts 0.15 - 0.15 - Liabilities for which fair values are disclosed:Borrowings:Long term Borrowings 361.86 - 361.86 -
There have been no transfers between the level 1 and level 2 during the period.
Notes to Financial Statements

138 Annual Report 2017-18
Tube Investments of India Limited(Formerly known as TI Financial Holdings Limited)
The significant unobservable inputs used in the fair value measurement categorised within Level 3 of the fair value hierarchy together with a quantitative sensitivity analysis as at 31st March 2018 and 31st March 2017 are given below:
ParticularsValuation technique
Significant unobservable
inputs
Range (Weighted average)
Sensitivity of the input to fair value
Unquoted FVTOCI equity investmentsAs at 31-Mar-2018
DCF Model Discount Rate 15%
5% sensitivity2017-18-
Discount Rate-20%, `(1.71) Cr.Discount Rate-10%, `3.45Cr.
Unquoted FVTOCI equity investmentsAs at 31-Mar-2017
DCF Model Discount Rate 15%
5% sensitivity2016-17-
Discount Rate-20%, `(2.00) Cr.Discount Rate-10%, `4.09 Cr.
Reconciliation of Fair Value Measurement of Unquoted FVTOCI Equity Investments. ` in Crores
Unquoted FVTOCI equity investmentsAs at
31-Mar-2018As at
31-Mar-2017
As at the beginning of the period 10.06 -
Adjustment pursuant to scheme of arrangement (Note 2) - 2.48
Adjustment pursuant to transition to Ind AS - 7.55
Re-measurement recognised in OCI (1.31) 0.03
Purchases - -
Sales - -
As at the end of the period 8.75 10.06
Note 43. Financial Risk Management Objectives and Policies
The Company's principal financial liabilities, other than derivatives, comprise of borrowings and trade payables. The main purpose of these financial liabilities is to raise finance for the Company's operations. The Company has various financial assets such as trade receivables, cash and short-term deposits, which arise directly from its operations. The Company also holds FVTOCI investments and enters into derivative transactions.
The Company is exposed to market risk, credit risk and liquidity risk. The Company’s senior management oversees the management of these risks. The Company’s senior management is supported by a Risk Management Committee that advises on financial risks and the appropriate financial risk governance framework for the Company. The Risk Management Committee provides assurance to the Company’s senior management that the Company’s financial risk activities are governed by appropriate policies and procedures and that the financial risks are identified, measured and managed in accordance with the Company’s policies and risk objectives. All derivative activities for risk management purposes are carried out by specialist teams that have the appropriate skills, experience and supervision. It is the Company’s policy that no trading in derivatives for speculative purposes may be undertaken.
A. Market Risk
Market risk is the risk of any loss in future earnings, in realizable fair values or in future cash flows that may result from a change in the price of a financial instrument. The value of a financial instrument may change as a result of changes in the interest rates, foreign currency exchange rates, equity price fluctuations, liquidity and other market changes. Future specific market movements cannot be normally predicted with reasonable accuracy.
i. Foreign Currency Exchange Rate Risk
The fluctuation in foreign currency exchange rates may have potential impact on the Income Statement and Equity, where any transaction references more than one currency or where assets / liabilities are denominated in a currency other than the functional currency of the respective consolidated entities.
Notes to Financial Statements

Annual Report 2017-18 139
Corporate Overview Management Reports Financial Statements
The Company, as per its forex policy, uses foreign exchange and other derivative instruments primarily to hedge foreign exchange and interest rate exposure.
The Company evaluates the impact of foreign exchange rate fluctuations by assessing its exposure to exchange rate risks. It hedges a part of these risks by using derivative financial instruments in accordance with its forex policy.
The foreign exchange rate sensitivity is calculated for each currency by aggregation of the net foreign exchange rate exposure of a currency and a simultaneous parallel foreign exchange rates shift in the foreign exchange rates of each currency by 5%.
Foreign Currency Sensitivity
The following tables demonstrate the sensitivity to 5% appreciation in USD and EURO exchange rates on foreign currency exposures as at the year end, with all other variables held constant. The impact on the Company’s Profit Before Tax is due to changes in the fair value of monetary assets and liabilities. The Company’s exposure to foreign currency changes for all other currencies is not material.
` in Crores
As at NatureIncrease/
(Decrease) in PBT for change in USD rates
Increase/(Decrease) in PBT for change
in EURO rates
31-Mar-2018Receivables 1.18 1.29
Payables (2.40) (0.48)
31-Mar-2017Receivables 2.58 0.53
Payables (2.00) (0.27)
Derivative Contracts ` in Crores
As at Nature
Increase/(Decrease) in PBT for change inUSD rates
Increase/(Decrease) in PBT for change in
EURO rates
Increase/(Decrease) in OCI for change inUSD rates
Increase/(Decrease) in OCI for change in
EURO rates
Increase/(Decrease) in OCI for change inJPY rates
31-Mar-18Derivative
(0.54) (0.79) (0.04) (0.66) 0.18Contracts
31-Mar-17Derivative
(0.43) (0.17) 0.59 0.34 -Contracts
Conversely, 5% depreciation in the USD and Euro rates against the significant foreign currencies as at 31st March 2018 and 31st March 2017 would have had the same but opposite effect, again holding all other variables constant.
ii. Equity Price Risk
Equity Price Risk is related to the change in market reference price of the investments in equity securities.
The majority of the Company's investments are in the shares of group companies, which are carried at cost. The Company has investments in other equity investments, routed through FVTOCI of only `11.12 Cr. as at 31st March 2018. (As at 31st March 2017 - `12.19 Cr.)
B. Credit Risk
Credit risk is the risk of financial loss arising from counterparty failure to repay or service debt according to the contractual terms or obligations. Credit risk encompasses both the direct risk of default and the risk of deterioration of creditworthiness as well as concentration risks.
Financial instruments that are subject to concentrations of credit risk principally consist of trade receivables, loans and advances and derivative financial instruments. None of the financial instruments of the Company result in material concentrations of credit risks.
Notes to Financial Statements

140 Annual Report 2017-18
Tube Investments of India Limited(Formerly known as TI Financial Holdings Limited)
Exposure to Credit risk - The carrying amount of financial assets represents the maximum Credit exposure. The maximum exposure to Credit risk was `637.27 Cr. as at 31st March 2018 and `579.38 Cr. as at 31st March 2017, being the total of the carrying amount of balances with banks, short term deposits with banks, trade receivables and other financial assets excluding equity investments.
At 31st March 2018, the company had 116 customers (as at 31st March 2017 - 108 customers) that owed the Company more than `1 Crore each and accounted for approximately 86% of the total trade receivables outstanding. There were 12 customers (as at 31st March 2017 - 8 Customers) with balances greater than `10 Crores accounting for around 32% of the trade receivables (Previous year - 25%).
Credit risk from balances with banks and investment of surplus funds in mutual funds is managed by the Company’s treasury department. The objective is to minimise the concentration of risks and therefore mitigate financial loss.
Of the above, `48.91 Cr. (Previous year – `65.55 Cr.) is backed by Export Credit Guarantee Cover / Letter of Credit as at 31st March 2018.
C. Liquidity Risk
Liquidity risk refers to the risk that the Company cannot meet its financial obligations. The objective of liquidity risk management is to maintain sufficient liquidity and ensure that funds are available for use as per requirements.
The Company has obtained fund and non-fund based working capital lines from various banks. Furthermore, the Company has access to funds from debt markets through commercial paper, non-convertible debentures, and other debt instruments. The Company invests its surplus funds in bank fixed deposit and liquid and liquid plus schemes of mutual funds, which carry no / low mark to market risks. The Company has also invested 15% of the non-convertible debentures (taken by the Company) falling due for repayment in the next 12 months in bank deposits, to meet the regulatory norms of liquidity requirements.
The Company also constantly monitors funding options available in the debt and capital markets with a view to maintaining financial flexibility.
As at 31st March 2018, the Company has undrawn committed lines of `287.53 Cr. (As at 31st March 2017 - `224.03 Cr.)
The table below provides details regarding the contractual maturities of financial liabilities based on Contractual undiscounted payments:
` in Crores
On demand
Less than 3 months
3 to 12 months
> 1 year Total
Year ended 31-Mar-2018
Borrowings 88.55 0.66 438.94 219.95 748.10
Other financial liabilities 0.49 32.05 - - 32.54
Trade and other payables 145.25 721.09 10.46 - 876.80
Derivatives - 0.31 - - 0.31
234.29 754.11 449.40 219.95 1,657.75
Year ended 31-Mar-2017
Borrowings 9.19 205.59 221.39 416.86 853.03
Other financial liabilities 55.00 29.90 - - 84.90
Trade and other payables 69.95 638.19 8.86 - 717.00
Derivatives - 0.15 - - 0.15
134.14 873.83 230.25 416.86 1,655.08
Notes to Financial Statements

Annual Report 2017-18 141
Corporate Overview Management Reports Financial Statements
Note 44. Capital Management
The Company’s capital management is intended to create value for shareholders by facilitating the meeting of long-term and short-term goals of the Company.
The Company determines the amount of capital required on the basis of annual operating plans and long-term product and other strategic investment plans. The funding requirements are met through internal accruals, nonconvertible debentures, external commercial borrowings and other long-term/short-term borrowings. The Company’s policy is aimed at combination of short-term and long-term borrowings.
The Company monitors capital employed using a Debt Equity ratio, which is total debt divided by total equity and maturity profile of the overall debt portfolio of the Company.
The following table summarizes the capital of the Company: ` in Crores
As at31-Mar-2018
As at31-Mar-2017
Borrowings
- Long term 200.00 350.00
- Short term 237.47 300.97
- Other Current liabilities (Current maturities of Long term Borrowing) 250.00 124.99
Total Debt 687.47 775.96
Equity Share Capital 18.75 18.74
Other Equity 1,194.39 1,123.27
Equity 1,213.14 1,142.01
Debt Equity ratio 0.57 0.68
Note 45. Previous Year’s figures
The Company has reclassified / regrouped previous year figures to conform to this year’s classification.
Notes to Financial Statements
Signatures to Notes to Financial StatementsAs per our report of even dateFor S.R. Batliboi & Associates LLPChartered AccountantsICAI Firm Regn. No : 101049W / E300004
On behalf of the BoardFor Tube Investments of India Limited
per Subramanian SureshPartnerMembership No : 083673
M M MurugappanChairman
Chennai7th May 2018
S SureshCompany Secretary
K Mahendra KumarChief Financial Officer
L RamkumarManaging Director

142 Annual Report 2017-18
Tube Investments of India Limited(Formerly known as TI Financial Holdings Limited)
Independent Auditor’s ReportTo the Members of Tube Investments of India Limited (formerly known as TI Financial Holdings Limited)
Report on the Consolidated Ind AS Financial Statements
We have audited the accompanying Consolidated Ind AS Financial Statements of Tube Investments of India Limited (hereinafter referred to as “the Holding Company”), its subsidiaries (the Holding Company and its subsidiaries together referred to as “the Group”) and joint ventures, comprising of the Consolidated Balance Sheet as at 31st March 2018, the Consolidated Statement of Profit and Loss including Other Comprehensive Income, the Consolidated Cash Flow Statement, the Consolidated Statement of Changes in Equity for the year then ended, and a summary of significant accounting policies and other explanatory information (hereinafter referred to as “the Consolidated Ind AS Financial Statements”).
Management’s Responsibility for the Consolidated Financial Statements
The Holding Company’s Board of Directors is responsible for the preparation of these Consolidated Ind AS Financial Statements in terms of the requirement of the Companies Act, 2013 (“the Act”) that give a true and fair view of the consolidated financial position, consolidated financial performance including Other Comprehensive Income, Consolidated Cash Flows and Consolidated Statement of Changes in Equity of the Group including its Joint Ventures in accordance with accounting principles generally accepted in India, including the Accounting Standards specified under Section 133 of the Act, read with the Companies (Indian Accounting Standard) Rules, 2015, as amended. The respective Board of Directors of the companies included in the Group and of its joint ventures are responsible for maintenance of adequate accounting records in accordance with the provisions of the Act for safeguarding of the assets of the Group and of its joint ventures and for preventing and detecting frauds and other irregularities; the selection and application of appropriate accounting policies; making judgments and estimates that are reasonable and prudent; and the design, implementation and maintenance of adequate internal financial controls, that were operating effectively for ensuring the accuracy and completeness of the accounting records, relevant to the preparation and presentation of the financial statements that give a true and fair view and are free from material misstatement, whether due to fraud or error, which have been used for the purpose of preparation of the Consolidated Ind AS Financial Statements by the Directors of the Holding Company, as aforesaid.
Auditor’s Responsibility
Our responsibility is to express an opinion on these Consolidated Ind AS Financial Statements based on our audit. While conducting the audit, we have taken into account the
provisions of the Act, the accounting and auditing standards and matters which are required to be included in the audit report under the provisions of the Act and the Rules made thereunder. We conducted our audit in accordance with the Standards on Auditing, issued by the Institute of Chartered Accountants of India, as specified under Section 143(10) of the Act. Those Standards require that we comply with ethical requirements and plan and perform the audit to obtain reasonable assurance about whether the financial statements are free from material misstatement.
An audit involves performing procedures to obtain audit evidence about the amounts and disclosures in the Consolidated Ind AS Financial Statements. The procedures selected depend on the auditor’s judgment, including the assessment of the risks of material misstatement of the Consolidated Ind AS Financial Statements, whether due to fraud or error. In making those risk assessments, the auditor considers internal financial control relevant to the Holding Company’s preparation of the Consolidated Ind AS Financial Statements that give a true and fair view in order to design audit procedures that are appropriate in the circumstances. An audit also includes evaluating the appropriateness of accounting policies used and the reasonableness of the accounting estimates made by the Holding Company’s Board of Directors, as well as evaluating the overall presentation of the Consolidated Ind AS Financial Statements. We believe that the audit evidence obtained by us and the audit evidence obtained by the other auditors in terms of their reports referred to in Other Matters paragraph below, is sufficient and appropriate to provide a basis for our audit opinion on the Consolidated Ind AS Financial Statements.
Opinion
In our opinion and to the best of our information and according to the explanations given to us and based on the consideration of reports of other auditors on separate financial statements and on the other financial information of the subsidiaries and joint ventures, the aforesaid Consolidated Ind AS Financial Statements give the information required by the Act in the manner so required and give a true and fair view in conformity with the accounting principles generally accepted in India of the consolidated state of affairs of the Group, its joint ventures as at 31st March 2018, their consolidated profit including Other Comprehensive Income, their Consolidated Cash Flows and Consolidated Statement of Changes in Equity for the year ended on that date.
Report on Other Legal and Regulatory Requirements
As required by section 143 (3) of the Act, based on our audit and on the consideration of report of the other auditors on separate financial statements and the other financial

Annual Report 2017-18 143
Corporate Overview Management Reports Financial Statements
information of subsidiaries and joint ventures, as noted in the ‘other matter’ paragraph we report, to the extent applicable, that:
(a) We / the other auditors whose reports we have relied upon have sought and obtained all the information and explanations which to the best of our knowledge and belief were necessary for the purpose of our audit of the aforesaid Consolidated Ind AS Financial Statements;
(b) In our opinion proper books of account as required by law relating to preparation of the aforesaid consolidation of the financial statements have been kept so far as it appears from our examination of those books and reports of the other auditors;
(c) The Consolidated Balance Sheet, Consolidated Statement of Profit and Loss including the Statement of Other Comprehensive Income, the Consolidated Cash Flow Statement and Consolidated Statement of Changes in Equity dealt with by this Report are in agreement with the books of account maintained for the purpose of preparation of the Consolidated Ind AS Financial Statements;
(d) In our opinion, the aforesaid Consolidated Ind AS Financial Statements comply with the Accounting Standards specified under Section 133 of the Act, read with Companies (Indian Accounting Standard) Rules, 2015, as amended;
(e) On the basis of the written representations received from the directors of the Holding Company as on 31st March 2018 taken on record by the Board of Directors of the Holding Company and the reports of the statutory auditors who are appointed under Section 139 of the Act, of its subsidiary companies and joint ventures incorporated in India, none of the directors of the Group’s companies, its joint ventures incorporated in India is disqualified as on 31st March 2018 from being appointed as a director in terms of Section 164 (2) of the Act.
(f) With respect to the adequacy and the operating effectiveness of the internal financial controls over financial reporting of the Holding Company, its subsidiary company and joint ventures incorporated in India (other than TI Tsubamex Private Limited and TI Absolute Concepts Private Limited which are exempted from reporting on internal control over financial reporting vide MCA notification no. G.S.R 583 (E) dated June 13, 2017, read with corrigendum dated July 13, 2017), refer to our separate report in “Annexure 1” to this report.
(g) With respect to the other matters to be included in the Auditor’s Report in accordance with Rule 11 of the Companies (Audit and Auditors) Rules, 2014, in our opinion and to the best of our information and
according to the explanations given to us and based on the consideration of the report of the other auditors on separate financial statements as also the other financial information of the subsidiaries and joint ventures, as noted in the ‘Other matter’ paragraph:
i. The Consolidated Ind AS Financial Statements disclose the impact of pending litigations on its consolidated financial position of the Group, and its joint ventures - Refer Note 35 to the Consolidated Ind AS Financial Statements;
ii. The Group and joint ventures did not have any material foreseeable losses in long-term contracts including derivative contracts during the year ended 31st March 2018;
iii. There were no amounts which were required to be transferred to the Investor Education and Protection Fund by the Holding Company and its joint ventures incorporated in India during the year ended 31st March 2018. There has been no delay in transferring amounts, required to be transferred to the Investor Education and Protection Fund by the Subsidiary incorporated in India.
Other Matter
1. We did not audit the financial statements and other financial information, in respect of 4 subsidiaries, and 2 jointly controlled entities, whose Ind AS Financial Statements include total assets of `642.85 Crores and net assets of `412.22 Crores as at 31st March 2018, and total revenues of `487.40 Crores and net cash outflows of `2.05 Crores for the year ended on that date. These financial statements and other financial information have been audited by other auditors, which financial statements, other financial information and auditor’s reports have been furnished to us by the management. The Consolidated Ind AS Financial Statements also include the Group’s share of net loss of `13.08 Crores for the year ended 31st March 2018, as considered in the Consolidated Ind AS Financial Statements, in respect of 2 joint ventures, whose financial statements, other financial information have been audited by other auditors and whose reports have been furnished to us by the Management. Our opinion on the Consolidated Ind AS Financial Statements, in so far as it relates to the amounts and disclosures included in respect of these subsidiaries and joint ventures, and our report in terms of sub-sections (3) of Section 143 of the Act, in so far as it relates to the aforesaid subsidiaries and joint ventures, is based solely on the reports of such other auditors.
2. In respect of two subsidiaries located outside India, whose financial statements and other financial information have been prepared in accordance with accounting principles generally accepted in that

144 Annual Report 2017-18
Tube Investments of India Limited(Formerly known as TI Financial Holdings Limited)
country, have been audited by other auditors under generally accepted auditing standards applicable in their country. The Company’s management has converted the financial statements of these subsidiaries from accounting principles generally accepted in their country to accounting principles generally accepted in India. We have audited these conversion adjustments made by the Company’s management. Our opinion in so far as it relates to the balances and affairs of these two subsidiaries are based on the report of other auditors and the conversion adjustments prepared by the management of the Company and audited by us.
3. Our opinion above on the Consolidated Ind AS Financial Statements, and our report on Other Legal
and Regulatory Requirements above, is not modified in respect of the above matters with respect to our reliance on the work done and the reports of the other auditors and the financial statements and other financial information certified by the Management.
For S.R. Batliboi & Associates LLPChartered Accountants
ICAI Firm Registration Number: 101049W/E300004
per Subramanian SureshPlace of Signature: Chennai PartnerDate: 7th May 2018 Membership Number: 083673
To the Members of Tube Investments of India Limited (formerly known as TI Financial Holdings Limited)
In conjunction with our audit of the Consolidated Ind AS Financial Statements of Tube Investments of India Limited as of and for the year ended 31st March 2018, we have audited the internal financial controls over financial reporting of Tube Investments of India Limited (hereinafter referred to as the “Holding Company”) and its subsidiary company incorporated in India, as of that date.
Management’s Responsibility for Internal Financial Controls
The respective Board of Directors of the Holding Company, its subsidiary company which are companies incorporated in India, are responsible for establishing and maintaining internal financial controls based on the internal control over financial reporting criteria established by the Holding Company considering the essential components of internal control stated in the Guidance Note on Audit of Internal Financial Controls Over Financial Reporting issued by the Institute of Chartered Accountants of India. These responsibilities include the design, implementation and maintenance of adequate internal financial controls that were operating effectively for ensuring the orderly and efficient conduct of its business, including adherence to the respective company’s policies, the safeguarding of its assets, the prevention and detection of frauds and errors, the accuracy and completeness of the accounting records, and the timely preparation of reliable financial information, as required under the Act.
Annexure to the Independent Auditor’s Report of even date on the Consolidated Ind AS Financial Statements of Tube Investments of India Limited (formerly known as TI Financial Holdings Limited)
Report on the Internal Financial Controls under Clause (i) of Sub-section 3 of Section 143 of the Companies Act, 2013 (“the Act”)
Auditor’s Responsibility
Our responsibility is to express an opinion on the Company's internal financial controls over financial reporting based on our audit. We conducted our audit in accordance with the Guidance Note on Audit of Internal Financial Controls Over Financial Reporting (the “Guidance Note”) and the Standards on Auditing, both, issued by Institute of Chartered Accountants of India, and deemed to be prescribed under section 143(10) of the Act, to the extent applicable to an audit of internal financial controls. Those Standards and the Guidance Note require that we comply with ethical requirements and plan and perform the audit to obtain reasonable assurance about whether adequate internal financial controls over financial reporting was established and maintained and if such controls operated effectively in all material respects.
Our audit involves performing procedures to obtain audit evidence about the adequacy of the internal financial controls system over financial reporting and their operating effectiveness. Our audit of internal financial controls over financial reporting included obtaining an understanding of internal financial controls over financial reporting, assessing the risk that a material weakness exists, and testing and evaluating the design and operating effectiveness of internal control based on the assessed risk. The procedures selected depend on the auditor’s judgement, including the assessment of the risks of material misstatement of the financial statements, whether due to fraud or error.

Annual Report 2017-18 145
Corporate Overview Management Reports Financial Statements
We believe that the audit evidence we have obtained and the audit evidence obtained by the other auditors in terms of their reports referred to in the Other Matters paragraph below, is sufficient and appropriate to provide a basis for our audit opinion on the internal financial controls system over financial reporting.
Meaning of Internal Financial Controls Over Financial Reporting
A Company's internal financial control over financial reporting is a process designed to provide reasonable assurance regarding the reliability of financial reporting and the preparation of financial statements for external purposes in accordance with generally accepted accounting principles. A company's internal financial control over financial reporting includes those policies and procedures that (1) pertain to the maintenance of records that, in reasonable detail, accurately and fairly reflect the transactions and dispositions of the assets of the company; (2) provide reasonable assurance that transactions are recorded as necessary to permit preparation of financial statements in accordance with generally accepted accounting principles, and that receipts and expenditures of the company are being made only in accordance with authorisations of management and directors of the company; and (3) provide reasonable assurance regarding prevention or timely detection of unauthorised acquisition, use, or disposition of the company's assets that could have a material effect on the financial statements.
Inherent Limitations of Internal Financial Controls Over Financial Reporting
Because of the inherent limitations of internal financial controls over financial reporting, including the possibility of collusion or improper management override of controls, material misstatements due to error or fraud may occur and not be detected. Also, projections of any evaluation
of the internal financial controls over financial reporting to future periods are subject to the risk that the internal financial control over financial reporting may become inadequate because of changes in conditions, or that the degree of compliance with the policies or procedures may deteriorate.
Opinion
In our opinion, the Holding Company and its subsidiary company which are companies incorporated in India, have, maintained in all material respects, an adequate internal financial controls system over financial reporting and such internal financial controls over financial reporting were operating effectively as at 31st March 2018, based on the internal control over financial reporting criteria established by the Holding Company considering the essential components of internal control stated in the Guidance Note on Audit of Internal Financial Controls Over Financial Reporting issued by the Institute of Chartered Accountants of India.
Other Matters
Our report under Section 143(3)(i) of the Act on the adequacy and operating effectiveness of the internal financial controls over financial reporting of the Holding Company, insofar as it relates to subsidiary company incorporated in India, and audited by other auditors, is based on the corresponding report of the auditor of such subsidiary company incorporated in India.
For S.R. Batliboi & Associates LLPChartered Accountants
ICAI Firm Registration Number: 101049W/E300004
per Subramanian SureshPlace of Signature: Chennai PartnerDate: 7th May 2018 Membership Number: 083673
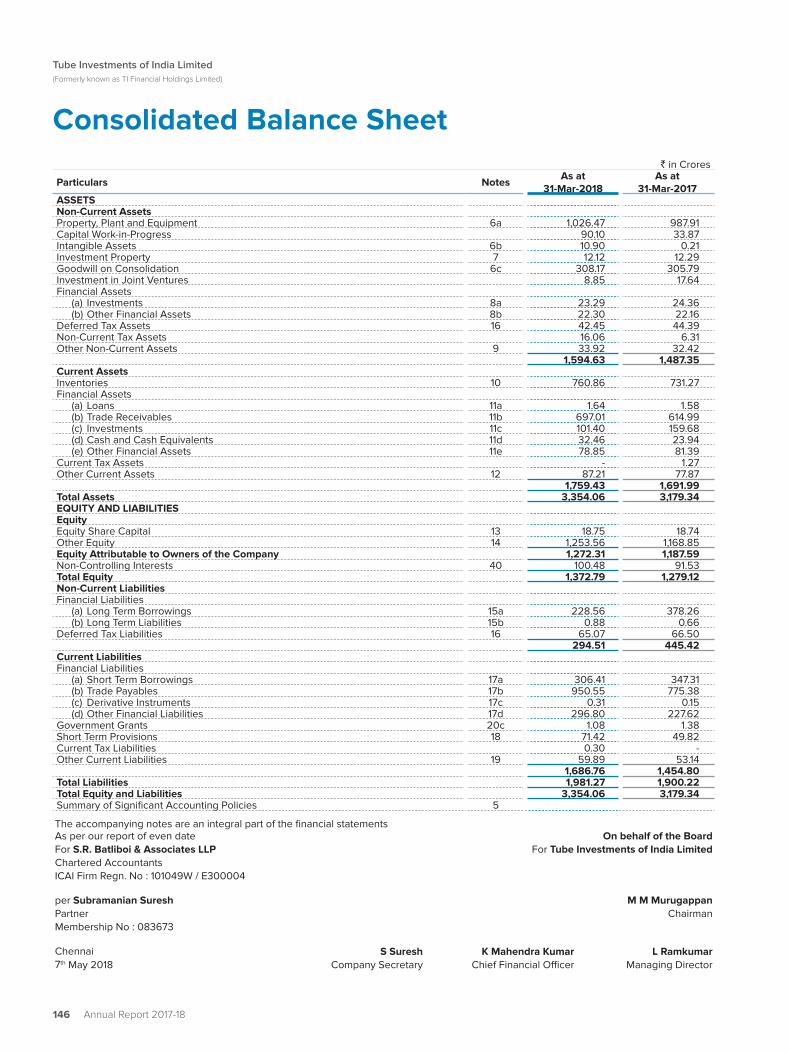
146 Annual Report 2017-18
Tube Investments of India Limited(Formerly known as TI Financial Holdings Limited)
Consolidated Balance Sheet` in Crores
Particulars NotesAs at
31-Mar-2018As at
31-Mar-2017ASSETSNon-Current AssetsProperty, Plant and Equipment 6a 1,026.47 987.91Capital Work-in-Progress 90.10 33.87Intangible Assets 6b 10.90 0.21Investment Property 7 12.12 12.29Goodwill on Consolidation 6c 308.17 305.79Investment in Joint Ventures 8.85 17.64Financial Assets (a) Investments 8a 23.29 24.36 (b) Other Financial Assets 8b 22.30 22.16Deferred Tax Assets 16 42.45 44.39Non-Current Tax Assets 16.06 6.31Other Non-Current Assets 9 33.92 32.42
1,594.63 1,487.35Current AssetsInventories 10 760.86 731.27Financial Assets (a) Loans 11a 1.64 1.58 (b) Trade Receivables 11b 697.01 614.99 (c) Investments 11c 101.40 159.68 (d) Cash and Cash Equivalents 11d 32.46 23.94 (e) Other Financial Assets 11e 78.85 81.39Current Tax Assets - 1.27Other Current Assets 12 87.21 77.87
1,759.43 1,691.99Total Assets 3,354.06 3,179.34EQUITY AND LIABILITIESEquityEquity Share Capital 13 18.75 18.74Other Equity 14 1,253.56 1,168.85Equity Attributable to Owners of the Company 1,272.31 1,187.59Non-Controlling Interests 40 100.48 91.53Total Equity 1,372.79 1,279.12Non-Current LiabilitiesFinancial Liabilities (a) Long Term Borrowings 15a 228.56 378.26 (b) Long Term Liabilities 15b 0.88 0.66Deferred Tax Liabilities 16 65.07 66.50
294.51 445.42Current LiabilitiesFinancial Liabilities (a) Short Term Borrowings 17a 306.41 347.31 (b) Trade Payables 17b 950.55 775.38 (c) Derivative Instruments 17c 0.31 0.15 (d) Other Financial Liabilities 17d 296.80 227.62Government Grants 20c 1.08 1.38Short Term Provisions 18 71.42 49.82Current Tax Liabilities 0.30 -Other Current Liabilities 19 59.89 53.14
1,686.76 1,454.80Total Liabilities 1,981.27 1,900.22Total Equity and Liabilities 3,354.06 3,179.34Summary of Significant Accounting Policies 5
The accompanying notes are an integral part of the financial statementsAs per our report of even dateFor S.R. Batliboi & Associates LLPChartered AccountantsICAI Firm Regn. No : 101049W / E300004
On behalf of the BoardFor Tube Investments of India Limited
per Subramanian SureshPartnerMembership No : 083673
M M MurugappanChairman
Chennai7th May 2018
S SureshCompany Secretary
K Mahendra KumarChief Financial Officer
L RamkumarManaging Director

Annual Report 2017-18 147
Corporate Overview Management Reports Financial Statements
Consolidated Statement of Profit and Loss` in Crores
Particulars NotesYear Ended31-Mar-2018
Year Ended31-Mar-2017
Revenue from Operations 21Sale of Products 4,840.29 4,604.64Other Operating Revenues 275.99 215.56
5,116.28 4,820.20Other Income 22 34.62 48.41Total Income 5,150.90 4,868.61ExpensesCost of Materials Consumed 23a 2,806.79 2,563.06Purchase of Stock-in-Trade - Cycles / Components and Metal Formed Products 190.51 186.93Changes in Inventories of Finished Goods, Work-in-Progress andStock-in-Trade
23b 0.89 (115.44)
Excise Duty on Sale of Goods and Scraps 88.81 327.19Employee Benefits Expense 24 562.68 512.98Depreciation and Amortisation Expense 25 153.54 148.90Finance Costs 26 58.49 73.99Other Expenses 27a 1,059.02 942.45Total Expenses 4,920.73 4,640.06Profit Before Share of Loss from Joint Ventures and Tax 230.17 228.55Share of Loss from Joint Ventures (net of tax) (Refer Note 41) (13.08) (7.45)Profit Before Exceptional Items and Tax 217.09 221.10Exceptional Items 27b (3.26) -Profit Before Tax 213.83 221.10Income Tax Expense 28
- Current Year 82.84 64.82- Current Tax - Earlier Years (10.56) (16.94)- Deferred Tax (Net) (Refer Note 16) (13.96) (1.13)
58.32 46.75Profit for the year (I) 155.51 174.35Other Comprehensive Income: 29Other Comprehensive Income to be reclassified to Statement of Profit and Loss in subsequent periods:Movement on Cash Flow Hedges 0.19 0.51Income Tax Effect (0.07) (0.18)
0.12 0.33Exchange Difference on Translation of Foreign Subsidiaries 6.54 (0.76)Income Tax Effect (2.29) -
4.25 (0.76)Other Comprehensive Income not to be reclassified to Statement of Profit and Loss in subsequent periods:Re-measurement Gains / (Losses) on Defined Benefit Obligations (Net) 1.63 (4.25)Income Tax Effect (0.57) 1.47
1.06 (2.78)Net (Loss) / Gain on FVTOCI Equity Securities (1.07) 0.71Income Tax Effect 0.43 (0.01)
(0.64) 0.70

148 Annual Report 2017-18
Tube Investments of India Limited(Formerly known as TI Financial Holdings Limited)
` in Crores
Particulars NotesYear Ended31-Mar-2018
Year Ended31-Mar-2017
Capital Reserve on acquistion of Subsidiaries 0.38 -Income Tax Effect - -
0.38 -Other Comprehensive Income / (Loss) for the Year, Net of Tax (II) 5.17 (2.51)Total Comprehensive Income for the Year, Net of Tax (I + II) 160.68 171.84Profit for the year attributable to :
- Owners of the Company 147.39 167.62- Non-Controlling Interest 8.12 6.73
Other Comprehensive Income for the year attributable to :- Owners of the Company 5.14 (2.49)- Non-Controlling Interest 0.03 (0.02)
Total Comprehensive Income for the year attributable to :- Owners of the Company 152.53 165.13- Non-Controlling Interest 8.15 6.71
Earnings Per Equity Share of `1 each 30Basic 7.86 8.94Diluted 7.86 8.94
Consolidated Statement of Profit and Loss
The accompanying notes are an integral part of the financial statementsAs per our report of even dateFor S.R. Batliboi & Associates LLPChartered AccountantsICAI Firm Regn. No : 101049W / E300004
On behalf of the BoardFor Tube Investments of India Limited
per Subramanian SureshPartnerMembership No : 083673
M M MurugappanChairman
Chennai7th May 2018
S SureshCompany Secretary
K Mahendra KumarChief Financial Officer
L RamkumarManaging Director

Annual Report 2017-18 149
Corporate Overview Management Reports Financial Statements
Sta
tem
ent
of C
hang
es in
Equ
ity
a.
Equi
ty S
hare
Cap
ital:
No.
of s
hare
s`
in C
rore
sA
s at
31st
Mar
ch 2
016
Equi
ty S
hare
s of
`1
each
issu
ed, s
ubsc
ribed
and
fully
pai
d 1
,10,0
00
0.11
Can
cella
tion
of S
hare
Cap
ital p
ursu
ant t
o th
e Sc
hem
e of
Arr
ange
men
t (Re
fer N
ote
1.2)
(1,10
,00
0)
(0.11
)Eq
uity
Sha
res
of `
1 ea
ch is
sued
pur
suan
t to
the
Sche
me
of A
rran
gem
ent (
Refe
r Not
e 1.2
) 1
8,74
,47,
871
18.
74A
s at
31st
Mar
ch 2
017
Equi
ty S
hare
s of
`1
each
issu
ed, s
ubsc
ribed
and
fully
pai
d 1
8,7
4,47
,871
18
.74
Issu
e of
Sha
re C
apita
l (Re
fer N
ote
13)
88,
497
0.0
1A
s at
31st
Mar
ch 2
018
18
,75
,36
,36
8 1
8.7
5
b.
Oth
er E
quity
For
the
year
end
ed 3
1st M
arch
20
18Pa
rtic
ular
sRe
serv
es a
nd S
urpl
usIte
ms
of O
CI
Tota
l O
ther
Eq
uity
Non
-C
ontr
ollin
g In
tere
st
(NC
I) (N
ote
39)
Tota
l O
ther
Eq
uity
an
d N
CI
Secu
ritie
s Pr
emiu
m
Rese
rve
(Not
e 14
)
Shar
e op
tion
outs
tand
ing
acco
unt
(Not
e 14
)
Reta
ined
Ea
rnin
gs(N
ote
14)
Deb
entu
re
Rede
mpt
ion
Rese
rve
(DR
R)
(Not
e 14
)
Cap
ital
Rede
mpt
ion
Rese
rve
(Not
e 14
)
Cap
ital
Rese
rve
(Not
e 14
)
Gen
eral
Re
serv
e(N
ote
14)
Cas
h flo
w
Hed
ge
Rese
rve
(Not
e 14
)
Fore
ign
Cur
renc
y Tr
ansl
atio
n Re
serv
e (N
ote
14)
FVTO
CI
Rese
rve
(Not
e 14
)
As
at 1
st A
pril
2017
- -
687
.62
118.
75 0
.01
0.11
355
.46
(0.2
4) (0
.06)
7.2
01,1
68.8
5 9
1.53
1,260
.38
Profi
t for
the
Year
- -
147.
39 -
- -
- -
- -
147.
39 8
.12 15
5.51
Oth
er c
ompr
ehen
sive
inco
me
for t
he Y
ear (
Not
e 29
) -
- -
- -
- -
0.12
-0.
770.
890.
030.
92
Gai
n on
bar
gain
pur
chas
e of
su
bsid
iarie
s th
roug
h B
usin
ess
Com
bina
tion
(Ref
er N
ote
39)
- -
- -
- 0
.38
- -
- (0
.38)
- 5
.93
5.9
3
Exer
cise
of s
hare
opt
ions
0.10
- -
- -
- -
- -
- 0
.10 -
0.10
Shar
e-ba
sed
paym
ents
- 5
.43
- -
- -
- -
- -
5.4
3 -
5.4
3D
RR tr
ansf
erre
d to
Ret
aine
d Ea
rnin
gs (N
et)
- -
6.2
5(6
.25)
- -
- -
- -
- -
-
Div
iden
d pa
id d
urin
g th
e ye
ar -
- (6
0.94
) -
- -
- -
- -
(60.
94)
-(6
0.94
)D
ivid
end
Dis
trib
utio
n ta
x pa
id
durin
g th
e ye
ar -
- (1
0.36
) -
- -
- -
- -
(10.
36)
-(10
.36)
Div
iden
d an
d D
ivid
end
Dis
trib
utio
n Ta
x pa
id b
y Su
bsid
iary
- -
(2.0
5) -
- -
- -
- -
(2.0
5) -
(2.0
5)
Tran
sfer
to G
ener
al R
eser
ve -
- (6
.31)
- -
- 6
.31
- -
- -
- -
Fore
ign
Cur
renc
y Tr
ansl
atio
n Re
serv
e (F
CTR
) -
- -
- -
- -
-4.
25 -
4.25
-4.
25
Re-m
easu
rem
ent G
ain
/ (Lo
ss)
on D
efine
d B
enefi
t Obl
igat
ions
(N
et) t
rans
ferr
ed to
Ret
aine
d Ea
rnin
gs
- -
0.95
- -
- -
- -
(0.9
5) -
- -
Div
iden
d pa
id to
NC
I and
its
rele
vant
tax
- -
- -
- -
- -
- -
- (5
.13)
(5.13
)
As
at 3
1st M
arch
201
8 0
.10 5
.43
762
.55
112.
50 0
.01
0.4
9 3
61.7
7(0
.12)
4.19
6.6
41,2
53.5
6 10
0.48
1,354
.04

150 Annual Report 2017-18
Tube Investments of India Limited(Formerly known as TI Financial Holdings Limited)
For
the
year
end
ed 3
1st M
arch
20
17P
artic
ular
sR
eser
ves
and
Sur
plus
Item
s of
OC
ITo
tal
Oth
er
Equi
ty
Non
-C
ontr
ollin
g In
tere
st
(NC
I) (N
ote
39)
Tota
l O
ther
Eq
uity
an
d N
CI
Sec
uriti
es
Pre
miu
m
Res
erve
(Not
e 14
)
Sha
re
optio
n ou
tsta
ndin
g ac
coun
t(N
ote
14)
Ret
aine
d Ea
rnin
gs(N
ote
14)
Deb
entu
re
Red
empt
ion
Res
erve
(Not
e 14
)
Cap
ital
Red
empt
ion
Res
erve
(Not
e 14
)
Cap
ital
Res
erve
(Not
e 14
)
Gen
eral
R
eser
ve(N
ote
14)
Cas
h flo
w
Hed
ge
Res
erve
(Not
e 14
)
Fore
ign
Cur
renc
y Tr
ansl
atio
n R
eser
ve
(Not
e 14
)
FVTO
CI
Res
erve
(Not
e 14
)
As
at 1
st A
pril
20
16 -
- (0
.06
) -
- -
- -
- -
(0.0
6)
- (0
.06
)A
djus
tmen
t pur
suan
t to
Sche
me
of A
rran
gem
ent
(Ref
er N
ote
1.2)
- -
426
.27
220
.83
0.0
1 0
.11 3
51.2
5 (0
.57)
0.7
0 5
.181,0
03.
78 8
4.82
1,088
.60
Profi
t for
the
Year
- -
16
7.6
2 -
- -
- -
- -
16
7.6
2 6
.73
174
.35
Oth
er c
ompr
ehen
sive
in
com
e (N
ote
29)
- -
- -
- -
- 0
.33
- (2
.06
) (1
.73)
(0.0
2) (1
.75
)
DR
R tr
ansf
erre
d to
Ret
aine
d Ea
rnin
gs -
- 1
02.
08
(10
2.0
8) -
- -
- -
- -
- -
Tran
sfer
to G
ener
al R
eser
ve -
- (4
.21)
- -
- 4
.21
- -
- -
- -
Fore
ign
Cur
renc
y Tr
ansl
atio
n Re
serv
e -
- -
- -
- -
- (0
.76
) -
(0.7
6)
- (0
.76
)
Re-m
easu
rem
ent G
ain/
(Los
s) o
n D
efine
d B
enefi
t O
blig
atio
ns (N
et) t
rans
ferr
ed
to R
etai
ned
Earn
ings
- -
(4.0
8) -
- -
- -
- 4
.08
- -
-
As
at 3
1st M
arch
20
17 -
- 6
87.6
2 1
18.7
5 0
.01
0.11
35
5.4
6(0
.24)
(0.0
6)
7.2
01,1
68.
85 9
1.53
1,26
0.38
Sta
tem
ent
of C
hang
es in
Equ
ity
The
acco
mpa
nyin
g no
tes
are
an in
tegr
al p
art o
f the
fina
ncia
l sta
tem
ents
As
per o
ur re
port
of e
ven
date
For S
.R. B
atlib
oi &
Ass
ocia
tes
LLP
Cha
rter
ed A
ccou
ntan
tsIC
AI F
irm R
egn.
No
: 10
1049
W /
E30
00
04
On
beha
lf of
the
Boa
rdFo
r Tub
e In
vest
men
ts o
f Ind
ia L
imite
d
per S
ubra
man
ian
Sur
esh
Part
ner
Mem
bers
hip
No
: 083
673
M M
Mur
ugap
pan
Cha
irman
Che
nnai
7th M
ay 2
018
S S
ures
hC
ompa
ny S
ecre
tary
K M
ahen
dra
Kum
arC
hief
Fin
anci
al O
ffice
rL
Ram
kum
arM
anag
ing
Dire
ctor

Annual Report 2017-18 151
Corporate Overview Management Reports Financial Statements
` in Crores
ParticularsYear Ended31-Mar-2018
Year Ended31-Mar-2017
A. Cash Flow from Operating Activities:
Profit Before Tax 226.91 228.55
Adjustments to reconcile Profit Before Tax to Net Cash Flows:
Depreciation on Property, Plant and Equipment 153.37 150.51
Depreciation on Investment Properties 0.17 0.15
Share based payment expenses 5.43 -
Profit on Property, Plant and Equipment sold /discarded (Net) (1.35) (1.19)
Profit on Sale of Investments carried at FVTPL (2.84) (11.55)
Provision / (Reversal of Provision) for Trade Receivables (Net) 1.60 (4.52)
Bad debts written off 0.88 -
Net Foreign Exchange differences 0.30 (0.54)
Finance Income (including Fair Value changes in Financial Instruments) (6.44) (11.85)
Finance Costs 58.49 73.99
Liabilities / Provisions no longer payable written back (1.47) (1.22)
Provision for Impairment of Investments 3.26 -
Impact of Foreign Currency Translation 0.68 (0.36)
Dividend Income (5.17) (3.55)
Operating Profit before Working Capital / Other Changes 433.82 418.42
Adjustments for :
Increase in Provisions and Government Grants 23.42 8.16
Increase in Trade and Other Payables 155.22 117.93
(Decrease) / Increase in Other Financial Liabilities (55.71) 57.79
Increase / (Decrease) in Other Current Liabilities (0.04) (1.41)
Increase in Other Non-Current Assets (5.88) (2.23)
Increase in Other Financial and Current Assets (3.95) (9.98)
Increase in Trade and Other Receivables (62.56) (33.34)
Increase in Inventories (18.61) (133.29)
Cash Generated From Operations 465.71 422.05
Income Tax paid (69.19) (39.17)
Net Cash Flow from Operating Activities 396.52 382.88
B. Cash Flow from Investing Activities:
Capital Expenditure (Including Capital Work In Progress and Capital Advances) (230.70) (164.52)
Proceeds from Sale of Property, Plant and Equipment 7.90 8.17
Sale / (Purchase) of Current Investments (Net) 56.50 (102.40)
Purchase of Non Current Investments (31.20) (16.17)
Interest Income received 5.87 8.02
Dividend received 5.17 3.55
Net Cash Used in Investing Activities (186.46) (263.35)
Consolidated Cash Flow Statement

152 Annual Report 2017-18
Tube Investments of India Limited(Formerly known as TI Financial Holdings Limited)
` in Crores
ParticularsYear Ended31-Mar-2018
Year Ended31-Mar-2017
C. Cash Flow from Financing Activities:
Proceeds from issue of shares 0.11 0.01
Proceeds from Long Term Borrowings 100.00 100.00
Repayment of Long Term Borrowings (126.71) (734.47)
Proceeds from Short Term Borrowings (Net) (123.55) 58.24
Finance Costs Paid (62.18) (108.35)
Dividends Paid (Including Net Dividend Distribution Tax) (78.48) -
Net Cash Used in Financing Activities (290.81) (684.57)
Net Decrease in Cash and Cash Equivalents [A+B+C] (80.75) (565.04)
Cash and Cash Equivalents at the Beginning of the Year 14.36 0.05
Additions on acquisition of Subsidiaries 9.31 -
Transferred to the Company pursuant to Scheme of Arrangement (Refer Note 1.2) - 579.35
Cash and Cash Equivalents as at End of the Year (Refer Note 11d) (57.08) 14.36
Consolidated Cash Flow Statement
The accompanying notes are an integral part of the financial statementsAs per our report of even dateFor S.R. Batliboi & Associates LLPChartered AccountantsICAI Firm Regn. No : 101049W / E300004
On behalf of the BoardFor Tube Investments of India Limited
per Subramanian SureshPartnerMembership No : 083673
M M MurugappanChairman
Chennai7th May 2018
S SureshCompany Secretary
K Mahendra KumarChief Financial Officer
L RamkumarManaging Director

Annual Report 2017-18 153
Corporate Overview Management Reports Financial Statements
Notes to Consolidated Financial Statements1. Corporate Information
1.1 General Information
Tube Investments of India Limited (“the Company”) with CIN No: L35100TN2008PLC069496, was formerly known as TI Financial Holdings Limited and is a Public Limited Company domiciled in India. The Company is listed on BSE and National Stock Exchange. The Registered Office of the Company is located at 234, NSC Bose Road, Chennai, Tamilnadu. The Company was originally incorporated as TI Financial Holdings Limited on 6th October 2008 under the Companies Act, 1956, as a wholly-owned subsidiary of erstwhile Tube Investments of India Limited (“Demerged Company”).
Pursuant to the Scheme of Arrangement (“the Scheme”) the details relating to which are more elaborately provided under Note 1.2 below, the Manufacturing Business Undertaking of the Demerged Company was vested in / transferred to the Company and the Name of the Company was changed to “Tube Investments of India Limited”.
The Group has manufacturing locations across the Country and has three product segments namely, Cycles and Accessories, Engineering and Metal Formed Products. The Company also has Subsidiaries and Joint Venture Companies, Viz., Shanthi Gears Limited, Financiere C10 SAS, Sedis SAS, Sedis Gmbh, Sedis Co Limited, TI Tsubamex Private Limited and TI Absolute Concepts Private Limited. During the current year, the Company has acquired two Subsidiaries, namely Great Cycles (Private) Limited, Creative Cycles (Private) Limited. (Refer Note 39)
The Consolidated Financial Statements were authorised for issue in accordance with a resolution of the directors on 7th May 2018.
1.2 Scheme of Arrangement
The Scheme of Arrangement (“the Scheme”) between the Company (“Resulting Company”) and TI Financial Holdings Limited, formerly known as Tube Investments of India Limited (“Demerged Company”) and their Shareholders under Sections 230 to 232 and other applicable provisions of the Companies Act, 2013, was approved by the Board of Directors of both the Companies on 3rd November 2016.
The Demerged Company, interalia, was engaged in manufacturing of tubes, strips, tubular components, bicycles and fitness products, chains for automobile sector and industrial applications, roll-formed sections,
other metal formed products, industrial gears, designing and manufacturing of dies (“Manufacturing Business Undertaking”). The Manufacturing Business is also carried out through Subsidiaries and Joint Venture Companies (Shanthi Gears Limited, Financiere C10 SAS, Sedis SAS, Sedis Gmbh, SEDIS Co Limited, TI Tsubamex Private Limited and TI Absolute Concepts Private Limited).
The Scheme provided for the demerger of the Manufacturing Business Undertaking of the Demerged Company into this Company, on a going concern basis, with effect from the appointed date of 1st April 2016.
The salient features of the Demerger are as under:
a. The Demerged Company and the Company has made applications and / or petitions under Section 230 read with Section 232 of the Companies Act, 2013 and other applicable provisions of the Companies Act, 2013 to the National Company Law Tribunal, Chennai (“Tribunal” or “NCLT”) for sanction of this Scheme and all matters ancillary or incidental thereto.
b. The whole of the undertaking and assets and properties of the Manufacturing Business Undertaking of the Demerged Company, shall stand transferred to and vested in the Company with all the rights, title and interest pertaining to the Manufacturing Business Undertaking.
c. The Scheme of Arrangement has become effective from the Appointed Date i.e. 1st April 2016 but operative from the Effective Date i.e. 1st August 2017 being the date of filing of a certified copy of the Order of NCLT by the Company and the Demerged Company with the Registrar of Companies, Tamil Nadu, Chennai.
d. Equity Share Capital of the Company
i. Equity Share Capital of `0.11 Cr. of the Company as on the Appointed Date stands cancelled and credited to Capital Reserve.
ii. The Company has issued and alloted 1 (One) fully paid up Equity Share of `1 (Rupee One Only) each for every 1 (One) fully paid up Equity Share of `2 (Rupees Two) each held in the Demerged Company.
2. Principles of Consolidation
The Consolidated Financial Statements (CFS) relates to Tube Investments of India Limited (the Company), its Subsidiary Companies (together, ‘the Group’).
The Financial Statements of the Subsidiaries and Joint Ventures used in the Consolidation are drawn

154 Annual Report 2017-18
Tube Investments of India Limited(Formerly known as TI Financial Holdings Limited)
Notes to Consolidated Financial Statementsup to the same reporting date as that of the Company i.e. 31st March except for certain foreign subsidiaries indicated in Paragraph 3 below for which the financial statements as on the reporting date are not available and hence, the same have been consolidated based on the latest available audited financial statements as at 31st December. No significant transactions or events have occurred between this date and the date of consolidation.
For the purpose of impairment testing, goodwill acquired in a business combination is, from the acquisition date, allocated to each of the Group’s cash-generating units that are expected to benefit from the combination, irrespective of whether other assets or liabilities of the acquiree are assigned to those units.
Cash generating unit to which goodwill has been allocated is tested for impairment annually, or more frequently when there is an indication that the unit may be impaired. If the recoverable amount of the cash generating unit is less than its carrying amount, the impairment loss is allocated first to reduce the carrying amount of any goodwill allocated to the unit and then to the other assets of the unit pro rata based on the carrying amount of each asset in the unit. Any impairment loss for goodwill is recognised in profit or loss. An impairment loss recognised for goodwill is not reversed in subsequent periods.
Where goodwill has been allocated to a cash-generating unit and part of the operation within that unit is disposed of, the goodwill associated with the disposed operation is included in the carrying amount of the operation when determining the gain or loss on disposal. Goodwill disposed in these circumstances is measured based on the relative values of the disposed operation and the portion of the cash-generating unit retained.
Group controls an investee if and only if the Group has:
a. Power over the investee (i.e. existing rights that give it the current ability to direct the relevant activities of the investee)
b. Exposure, or rights, to variable returns from its involvement with the investee, and
c. The ability to use its power over the investee to affect its returns
Generally, there is a presumption that a majority of voting rights result in control. To support this presumption and when the Group has less than a majority of the voting
or similar rights of an investee, the Group considers all relevant facts and circumstances in assessing whether it has power over an investee, including:
a. The contractual arrangement with the other vote holders of the investee
b. Rights arising from other contractual arrangements
c. The Group’s voting rights and potential voting rights
d. The size of the group’s holding of voting rights relative to the size and dispersion of the holdings of the other voting rights holders
The Group re-assesses whether or not it controls an investee if facts and circumstances indicate that there are changes to one or more of the three elements of control. Consolidation of a Subsidiary begins when the Group obtains control over the Subsidiary and ceases when the Group loses control of the Subsidiary. Assets, liabilities, income and expenses of a Subsidiary acquired or disposed of during the year are included in the Consolidated Financial Statements from the date the Group gains control until the date the Group ceases to control the Subsidiary.
Consolidated Financial Statements are prepared using uniform accounting policies for like transactions and other events in similar circumstances. If a member of the group uses accounting policies other than those adopted in the Consolidated Financial Statements for like transactions and events in similar circumstances, appropriate adjustments are made to that group member’s financial statements in preparing the Consolidated Financial Statements to ensure conformity with the group’s accounting policies.
Consolidation procedures:
a) Combine like items of assets, liabilities, equity, income, expenses and cash flows of the parent with those of its Subsidiaries. For this purpose, income and expenses of the Subsidiary are based on the amounts of the assets and liabilities recognised in the Consolidated Financial Statements at the acquisition date.
b) Offset (eliminate) the carrying amount of the parent’s investment in each subsidiary and the parent’s portion of Equity of each subsidiary.
c) Eliminate in full intra-group assets and liabilities, equity, income, expenses and cash flows relating to transactions between entities of the group

Annual Report 2017-18 155
Corporate Overview Management Reports Financial Statements
Notes to Consolidated Financial Statements(profits or losses resulting from intra-group transactions that are recognised in assets, such as inventory and Property, Plant and Equipment, are eliminated in full). Intra-group losses may indicate an impairment that requires recognition in the consolidated financial statements. Ind AS 12 Income Taxes applies to temporary differences that arise from the elimination of profits and losses resulting from intra-group transactions.
d) The carrying value of Goodwill arising on consolidation is tested for impairment, if there are any indicators for impairment and also tested at the end of each reporting period.
Profit or loss and each component of Other Comprehensive Income (OCI) are attributed to the equity holders of the parent of the Group and to the non-controlling interests, even if this results in the non-controlling interests having a deficit balance.
a) Subsidiary
The Financial Statements of the Company and its Subsidiary Companies have been combined on a line-by-line basis by adding together the amounts of like items of assets, liabilities, income and expenses, after fully eliminating material intra-group balances, intra-group transactions and the resulting unrealised profits or losses, unless cost cannot be recovered, as per Indian Accounting Standard 110 - Consolidated Financial Statements (Ind AS 110).
Non-Controlling Interest in the Net Assets of the Consolidated Subsidiaries consists of:
i. The amount of Equity attributable to holders of non-controlling interest at the date on which the investment in the Subsidiary is made; and
ii. The Non-Controlling Interests’ share of movements in Equity since the date the Parent Subsidiary relationship came into existence.
Non-Controlling Interest (NCI) share in the Net Profit / (Loss) for the year of the Consolidated Subsidiaries is identified and adjusted against the Profit After Tax of the Group even if this results in the NCI having a deficit balance.
b) Joint Venture
A Joint Venture is a type of joint arrangement whereby the parties that have joint control of the arrangement have rights to the net assets of the Joint Venture. Joint control is the contractually agreed sharing of control
of an arrangement, which exists only when decisions about the relevant activities require unanimous consent of the parties sharing control.
The considerations made in determining whether joint control are similar to those necessary to determine control over the Subsidiaries.
The Group’s investments in its Joint Venture are accounted for using the equity method. Under the equity method, the investment in a Joint Venture is initially recognised at cost. The carrying amount of the investment is adjusted to recognise changes in the Group’s share of net assets of the Joint Venture since the acquisition date. Goodwill relating to the Joint Venture is included in the carrying amount of the investment and is not tested for impairment individually.
The Statement of Profit and Loss reflects the Group’s share of the results of operations of the Joint Venture. Any change in OCI of those investees is presented as part of the Group’s OCI. In addition, when there has been a change recognised directly in the Equity of the joint venture, the Group recognises its share of any changes, when applicable, in the Statement of Changes in Equity. Unrealised gains and losses resulting from transactions between the Group and the Joint Venture are eliminated to the extent of the interest in the Joint Venture.
If an entity’s share of losses of a Joint Venture equals or exceeds its interest in the Joint Venture (which includes any long term interest that, in substance, form part of the Group’s net investment in the Joint Venture), the entity discontinues recognising its share of further losses. Additional losses are recognised only to the extent that the Group has incurred legal or constructive obligations or made payments on behalf of the joint venture. If the joint venture subsequently reports profits, the entity resumes recognising its share of those profits only after its share of the profits equals the share of losses not recognised.
The aggregate of the Group’s share of profit or loss of a Joint Venture is shown on the face of the Statement of Profit and Loss.
The Financial Statements of the Joint Venture are prepared for the same reporting period as the Group. When necessary, adjustments are made to bring the accounting policies in line with those of the Group.
After application of the equity method, the Group determines whether it is necessary to recognise an impairment loss on its investment in its Joint Venture.
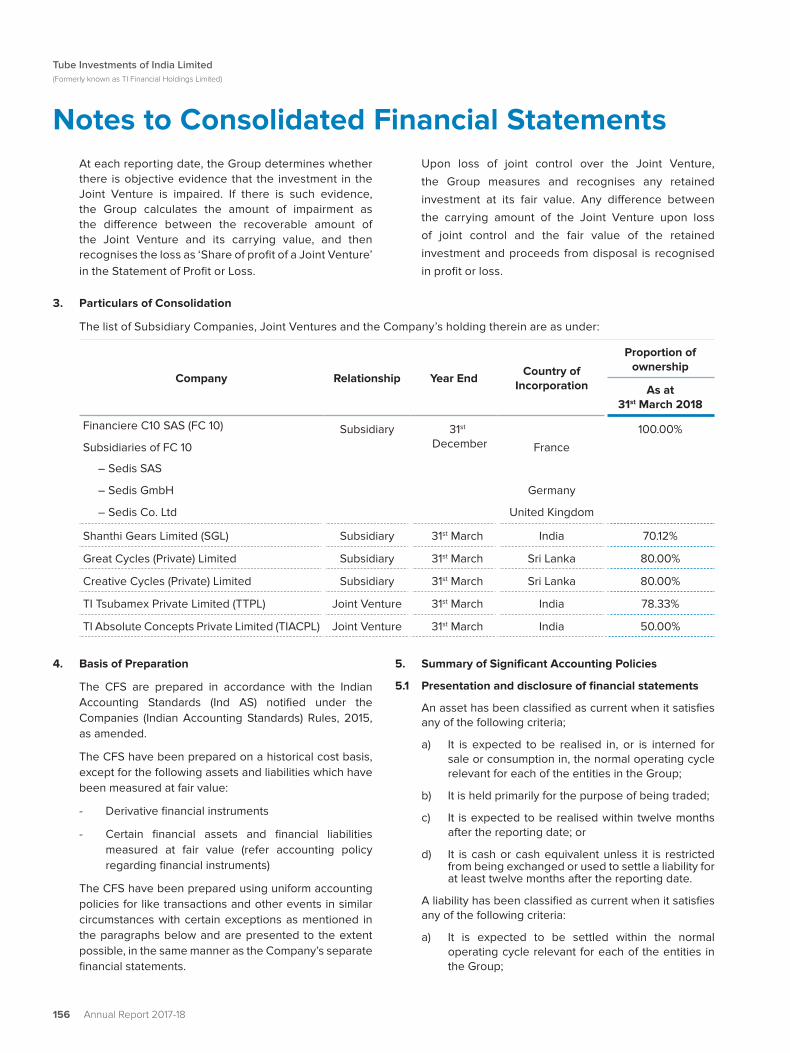
156 Annual Report 2017-18
Tube Investments of India Limited(Formerly known as TI Financial Holdings Limited)
At each reporting date, the Group determines whether there is objective evidence that the investment in the Joint Venture is impaired. If there is such evidence, the Group calculates the amount of impairment as the difference between the recoverable amount of the Joint Venture and its carrying value, and then recognises the loss as ‘Share of profit of a Joint Venture’ in the Statement of Profit or Loss.
Upon loss of joint control over the Joint Venture,
the Group measures and recognises any retained
investment at its fair value. Any difference between
the carrying amount of the Joint Venture upon loss
of joint control and the fair value of the retained
investment and proceeds from disposal is recognised
in profit or loss.
3. Particulars of Consolidation
The list of Subsidiary Companies, Joint Ventures and the Company’s holding therein are as under:
Company Relationship Year EndCountry of
Incorporation
Proportion of ownership
As at 31st March 2018
Financiere C10 SAS (FC 10)
Subsidiaries of FC 10
Subsidiary 31st December France
100.00%
– Sedis SAS
– Sedis GmbH
– Sedis Co. Ltd
Germany
United Kingdom
Shanthi Gears Limited (SGL) Subsidiary 31st March India 70.12%
Great Cycles (Private) Limited Subsidiary 31st March Sri Lanka 80.00%
Creative Cycles (Private) Limited Subsidiary 31st March Sri Lanka 80.00%
TI Tsubamex Private Limited (TTPL) Joint Venture 31st March India 78.33%
TI Absolute Concepts Private Limited (TIACPL) Joint Venture 31st March India 50.00%
4. Basis of Preparation
The CFS are prepared in accordance with the Indian Accounting Standards (Ind AS) notified under the Companies (Indian Accounting Standards) Rules, 2015, as amended.
The CFS have been prepared on a historical cost basis, except for the following assets and liabilities which have been measured at fair value:
- Derivative financial instruments
- Certain financial assets and financial liabilities measured at fair value (refer accounting policy regarding financial instruments)
The CFS have been prepared using uniform accounting policies for like transactions and other events in similar circumstances with certain exceptions as mentioned in the paragraphs below and are presented to the extent possible, in the same manner as the Company’s separate financial statements.
5. Summary of Significant Accounting Policies
5.1 Presentation and disclosure of financial statements
An asset has been classified as current when it satisfies any of the following criteria;
a) It is expected to be realised in, or is interned for sale or consumption in, the normal operating cycle relevant for each of the entities in the Group;
b) It is held primarily for the purpose of being traded;
c) It is expected to be realised within twelve months after the reporting date; or
d) It is cash or cash equivalent unless it is restricted from being exchanged or used to settle a liability for at least twelve months after the reporting date.
A liability has been classified as current when it satisfies any of the following criteria:
a) It is expected to be settled within the normal operating cycle relevant for each of the entities in the Group;
Notes to Consolidated Financial Statements

Annual Report 2017-18 157
Corporate Overview Management Reports Financial Statements
b) It is held primarily for the purpose of being traded;
c) It is due to be settled within twelve months after the reporting date; or
d) The entities in the Group do not have an unconditional right to defer settlements of the liability for at least twelve months after the reporting date. Terms of a liability that could, at the option of the counterparty, result in its settlement by the issue of equity instruments do not affect its classification.
All other assets and liabilities have been classified as non-current.
5.2 Business Combination and Goodwill
Business combinations are accounted for using the acquisition method. The cost of an acquisition is measured as the aggregate of the consideration transferred measured at acquisition date fair value and the amount of any non-controlling interests in the acquiree. For each business combination, the Group elects whether to measure the non-controlling interests in the acquiree at fair value or at the proportionate share of the acquiree’s identifiable net assets. Acquisition-related costs are expensed as incurred.
At the acquisition date, the identifiable assets acquired and the liabilities assumed are recognised at their acquisition date fair values. For this purpose, the liabilities assumed include contingent liabilities representing present obligation and they are measured at their acquisition fair values irrespective of the fact that outflow of resources embodying economic benefits is not probable.
When the Group acquires a business, it assesses the financial assets and liabilities assumed for appropriate classification and designation in accordance with the contractual terms, economic circumstances and pertinent conditions as at the acquisition date.
If the business combination is achieved in stages, any previously held equity interest is re-measured at its acquisition date fair value and any resulting gain or loss is recognised in profit or loss or OCI, as appropriate.
Any contingent consideration to be transferred by the acquirer is recognised at fair value at the acquisition date. Contingent consideration classified as an asset or liability that is a financial instrument and within the scope of Ind AS 109 Financial Instruments, is measured at fair value with changes in fair value recognised in profit or loss. If the contingent consideration is not within the scope of Ind AS 109, it is measured in accordance with the appropriate Ind AS. Contingent consideration that is classified as equity is not re-measured at subsequent reporting dates and subsequent its settlement is accounted for within Equity.
Goodwill is initially measured at cost, being the excess of the aggregate of the consideration transferred and the amount recognised for non-controlling interests, and any previous interest held, over the net identifiable assets acquired and liabilities assumed.
If the fair value of the net assets acquired is in excess of the aggregate consideration transferred, the Group re-assesses whether it has correctly identified all of the assets acquired and all of the liabilities assumed and reviews the procedures used to measure the amounts to be recognised at the acquisition date. If the reassessment still results in an excess of the fair value of net assets acquired over the aggregate consideration transferred, then the gain is recognised in OCI and accumulated in Equity as Capital Reserve. However, if there is no clear evidence of bargain purchase, the entity recognises the gain directly in Equity as Capital Reserve, without routing the same through OCI.
After initial recognition, goodwill is measured at cost less any accumulated impairment losses. For the purpose of impairment testing, goodwill acquired in a business combination is, from the acquisition date, allocated to each of the Group’s cash-generating units that are expected to benefit from the combination, irrespective of whether other assets or liabilities of the acquiree are assigned to those units.
A cash generating unit to which goodwill has been allocated is tested for impairment annually, or more frequently when there is an indication that the unit may be impaired. If the recoverable amount of the cash generating unit is less than its carrying amount, the impairment loss is allocated first to reduce the carrying amount of any goodwill allocated to the unit and then to the other assets of the unit pro rata based on the carrying amount of each asset in the unit. Any impairment loss for goodwill is recognised in profit or loss. An impairment loss recognised for goodwill is not reversed in subsequent periods.
Where goodwill has been allocated to a cash-generating unit and part of the operation within that unit is disposed of, the goodwill associated with the disposed operation is included in the carrying amount of the operation when determining the gain or loss on disposal. Goodwill disposed in these circumstances is measured based on the relative values of the disposed operation and the portion of the cash-generating unit retained.
If the initial accounting for a business combination is incomplete by the end of the reporting period in which the combination occurs, the Group reports provisional amounts for the items for which the accounting is incomplete. Those provisional amounts are adjusted through goodwill during the measurement period, or additional assets or liabilities are recognised, to reflect new information obtained about facts and circumstances
Notes to Consolidated Financial Statements

158 Annual Report 2017-18
Tube Investments of India Limited(Formerly known as TI Financial Holdings Limited)
that existed at the acquisition date that, if known, would have affected the amounts recognized at that date. These adjustments are called as measurement period adjustments. The measurement period does not exceed one year from the acquisition date.
5.3 Fair Value Measurement
The financial instruments, such as, derivatives are measured at fair value at each Balance Sheet date
Fair value is the price that would be received to sell an asset or paid to transfer a liability in an orderly transaction between market participants at the measurement date. The fair value measurement is based on the presumption that the transaction to sell the asset or transfer the liability takes place either:
a) In the principal market for the asset or liability, or
b) In the absence of a principal market, in the most advantageous market for the asset or liability
The fair value of an asset or a liability is measured using the assumptions that market participants would use when pricing the asset or liability, assuming that market participants act in their best economic interest.
A fair value measurement of a non-financial asset takes into account a market participant’s ability to generate economic benefits by using the asset in its highest and best use or by selling it to another market participant that would use the asset in its highest and best use.
The valuation techniques that are appropriate in the circumstances and for which sufficient data are available to measure fair value, maximising the use of relevant observable inputs and minimising the use of unobservable inputs are used.
All assets and liabilities for which fair value is measured or disclosed in the financial statements are categorised within the fair value hierarchy, described as follows, based on the lowest level input that is significant to the fair value measurement as a whole:
a) Level 1 - Quoted (unadjusted) market prices in active markets for identical assets or liabilities
b) Level 2 - Valuation techniques for which the lowest level input that is significant to the fair value measurement is directly or indirectly observable
c) Level 3 - Valuation techniques for which the lowest level input that is significant to the fair value measurement is unobservable
For assets and liabilities that are recognised in the financial statements on a recurring basis, the Group determines whether transfers have occurred between levels in the hierarchy by re-assessing categorisation (based on the lowest level input that is significant to the fair value measurement as a whole) at the end of each reporting period.
The Group determines the policies and procedures for both recurring fair value measurement, such as derivative instruments and unquoted financial assets measured at fair value, and for non-recurring measurement.
External valuers are involved for valuation of assets such as investment properties. Involvement of external valuers is decided upon annually by the Group. At each reporting date, the Group analyses the movements in the values of assets and liabilities which are required to be remeasured or re-assessed as per the accounting policies. For this analysis, the Group verifies the major inputs applied in the latest valuation by agreeing the information in the valuation computation to contracts and other relevant documents. Other fair value related disclosures are given in the relevant notes.
For the purpose of fair value disclosures, the Group has determined classes of assets and liabilities on the basis of the nature, characteristics and risks of the asset or liability and the level of the fair value hierarchy as explained above.
5.4 Use of Estimates
The preparation of Financial Statements in conformity with Ind AS requires the management to make judgments, estimates and assumptions that affect the reported amounts of revenues, expenses, assets and liabilities and the disclosure of contingent liabilities, like provision for employee benefits, provision for doubtful trade receivables / advances / contingencies, provision for warranties, allowance for slow / non-moving inventories, useful life of Property, Plant and Equipment, provision for retrospective price revisions, provision for taxation, etc., during and at the end of the reporting period. Although these estimates are based on the management’s best knowledge of current events and actions, uncertainty about these assumptions and estimates could result in the outcomes requiring a material adjustment to the carrying amounts of assets or liabilities in future periods.
5.5 Cash and Cash Equivalents
Cash comprises cash on hand and demand deposits with banks. Cash equivalents are short-term (with an original maturity of three months or less from the date of acquisition), highly liquid investments that are readily convertible into known amounts of cash and which are subject to insignificant risk of change in value.
5.6 Cash Flow Statement
Cash flows are reported using the indirect method, whereby profit / (loss) before tax is adjusted for the effects of transactions of non-cash nature and any deferrals or accruals of past or future cash receipts or payments.
For the purpose of the Consolidated Statement of Cash Flows, cash and cash equivalents as defined above, net of outstanding bank overdrafts as they are considered an integral part of the cash management of the Group.
Notes to Consolidated Financial Statements

Annual Report 2017-18 159
Corporate Overview Management Reports Financial Statements
5.7 Property, Plant and Equipment
Property, Plant and Equipment are stated at historical cost less accumulated depreciation and impairment losses, if any. Freehold land is measured at cost and not depreciated. Cost includes related taxes, duties, freight, insurance, etc. attributable to the acquisition and installation of the Property, Plant and Equipment but excludes duties and taxes that are recoverable from tax authorities. When significant parts of plant and equipment are required to be replaced at intervals, it is depreciated separately based on their specific useful life.
Machinery Spares including spare parts, stand-by and servicing equipment are capitalised as property, plant and equipment if they meet the definition of Property, Plant and Equipment i.e. if the intention is to use these for more than a period of 12 months. These spare parts capitalized are depreciated as per Ind AS 16.
Subsequent expenditure relating to Property, Plant and Equipment is capitalised only if it is probable that future economic benefits associated with the item will flow and the cost of the item can be measured reliably.
Material replacement cost is capitalized provided it is probable that future economic benefits associated with the item will flow and the cost of the item can be measured reliably. When replacement cost is eligible for capitalization, the carrying amount of those parts that are replaced in derecognized. When significant parts of plant and equipment are required to be replaced at intervals, it is depreciated separately based on their specific useful life.
The Group identifies and determines cost of each component / part of the asset separately, if the component / part has a cost which is significant to the total cost of the asset and has useful life that is materially different from that of the remaining asset.
An item of property, plant and equipment and any significant part initially recognised is derecognised upon disposal or when no future economic benefits are expected from its use or disposal. Any gain or loss arising on derecognition of the asset (calculated as the difference between the net disposal proceeds and the carrying amount of the asset) is included in the Statement of Profit and Loss when the asset is derecognised.
The residual values, useful lives and methods of depreciation of Property, Plant and Equipment are reviewed at each financial year end and adjusted prospectively, if appropriate.
Capital Work-in-Progress:
Projects under which assets are not ready for their intended use and other Capital Work-In-Progress are carried at cost, comprising direct cost and attributable
interest. Once it has becomes available for use, their cost is re-classified to appropriate caption and subjected to depreciation.
5.8 Intangible Assets
Intangible assets with finite useful lives that are acquired separately are carried at cost less accumulated amortisation and accumulated impairment losses. Amortisation is recognised on a straight-line basis over their estimated useful life as given below.
Description of Intangible Assets Useful life
Software 3 Years - 5 Years
Lease hold rights 19 Years - 71 Years
The estimated useful life and amortisation method are reviewed at the end of each reporting period, with the effect of any changes in estimate being accounted for on a prospective basis.
5.9 Investment Properties
Investment property represents property held to earn rentals or for capital appreciation or both.
Investment properties are measured initially at cost, including transaction costs. Subsequent to initial recognition, investment properties are stated at cost less accumulated depreciation and accumulated impairment loss, if any.
The cost includes the cost of replacing parts and borrowing costs for long-term construction projects if the recognition criteria are met. When significant parts of the investment property are required to be replaced at intervals, it is depreciated separately based on their specific useful lives. All other repair and maintenance costs are recognised in the Statement of Profit and Loss as incurred.
Depreciation on building classified as investment property has been provided on the straight-line method over a period of 60 years as prescribed in Schedule II to the Companies Act, 2013. These are based on the estimate of their useful lives taking into consideration technical factors.
Though the investment property is measured using cost based measurement, the fair value of investment property is disclosed in the notes. Fair values are determined based on an annual evaluation performed by an external independent valuer applying valuation models.
Investment properties are derecognised either when they have been disposed of or when they are permanently withdrawn from use and no future economic benefit is expected from their disposal. The difference between the net disposal proceeds and the carrying amount of the asset is recognised in the Statement of Profit and Loss in the period of derecognition.
Notes to Consolidated Financial Statements

160 Annual Report 2017-18
Tube Investments of India Limited(Formerly known as TI Financial Holdings Limited)
5.10 Impairment of Non-Financial Assets
The Group assesses at each reporting date whether there is an indication that an asset may be impaired. If any indication exists, the asset’s recoverable amount is estimated. An asset’s recoverable amount is the higher of an asset’s or Cash-Generating Unit’s (CGU) net selling price and its value in use. The recoverable amount is determined for an individual asset, unless the asset does not generate cash inflows that are largely independent of those from other assets or groups of assets. Where the carrying amount of an asset or CGU exceeds its recoverable amount, the asset is considered impaired and is written down to its recoverable amount. In assessing value in use, the estimated future cash flows are discounted to their present value using a pre-tax discount rate that reflects current market assessments of the time value of money and the risks specific to the asset. In determining fair value less costs of disposal, recent market transactions are taken into account, if available. If no such transactions can be identified, an appropriate valuation model is used.
The impairment calculation are based on detailed budgets and forecast calculations which are prepared separately for each of the cash-generating units to which the individual assets are allocated. These budgets and forecast calculations are generally covering a period of three years. For longer periods, a long term growth rate is calculated and applied to project future cash flows after the third year. To estimate cash flow projections beyond periods covered by the most recent budgets / forecasts cash flow projections in the budget are extrapolated using a steady or declining growth rate for subsequent years, unless an increasing rate can be justified. In any case, this growth rate does not exceed the long-term average growth rate for the products, industries, or country or countries in which the entity operates, or for the market in which the asset is used.
Impairment including impairment on inventories, are recognized in the Statement of Profit and Loss.
An assessment is made at each reporting date as to whether there is any indication that previously recognized impairment losses may no longer exist or may have decreased. If such indication exists, the asset’s or cash-generating unit’s recoverable amount is estimated. A previously recognized impairment loss is reversed only if there has been a change in the assumptions used to determine the asset’s recoverable amount since the last impairment loss was recognized. The reversal is limited so that the carrying amount of the asset does not exceed its recoverable amount, nor exceed the carrying amount that would have been determined, net of depreciation, had no impairment loss been recognized for the asset in prior years.
After impairment, depreciation is provided on the revised carrying amount of the asset over its remaining useful life.
5.11 Inventories
Raw materials, stores and spare parts and stock-in-trade are valued at lower of weighted average cost and estimated net realisable value. Cost includes freight, taxes and duties and is net of Credit under VAT, CENVAT and GST scheme, where applicable.
Work-In-Progress and finished goods are valued at lower of weighted average cost and estimated net realisable value. Cost includes all direct costs and appropriate proportion of overheads to bring the goods to the present location and condition based on the normal operating capacity, but excluding borrowing costs. Cost of finished goods includes Excise Duty.
Food and Beverage inventory purchased are valued at cost on first in and first out basis.
Materials and other items held for use in the production of inventories are not written down below cost if the finished products in which they will be used are expected to be sold at or above cost.
Net realizable value is the estimated selling price in the ordinary course of business, less estimated costs of completion and estimated costs necessary to make the sale.
5.12 Revenue and Other Income
Revenue is recognized to the extent that it is probable that the economic benefits will flow and the revenue can be reliably measured, regardless of when the payment is being made. Revenue is measured at the fair value of the consideration received or receivable, taking into account contractually defined terms of payment. The Group is the principal in all of its revenue arrangements since it is the primary obligor in all the revenue arrangements as it has pricing latitude and is also exposed to inventory and credit risks.
It is assumed that recovery of Excise Duty flows on its own account. This is for the reason that it is a liability of the manufacturer which forms part of the cost of production, irrespective of whether the goods are sold or not. Since the recovery of Excise Duty flows on its own account, revenue includes Excise Duty.
However, sales tax / value added tax (VAT) and Goods and Services tax (GST) is not received on its own account. Rather, it is tax collected on value added to the commodity by the seller on behalf of the government. Accordingly, it is excluded from revenue.
The specific recognition Criteria described below must also be met before revenue is recognised.
Notes to Consolidated Financial Statements

Annual Report 2017-18 161
Corporate Overview Management Reports Financial Statements
Sale of Goods:
Revenue from sale of goods is recognised on transfer of significant risk and rewards of ownership to the buyer which generally coincides with shipment. Revenue from the sale of goods is measured at the fair value of the consideration received or receivable, net of returns and allowances, trade discounts and volume rebates.
Rendering of Services:
Revenue from rendering of services is recognised with reference to the stage of completion determined based on estimate of work performed, and when the outcome of the transaction can be estimated reliably.
Dividends:
Dividend income is accounted for when the right to receive it is established.
Interest Income:
For all debt instruments measured at amortised cost, interest income is recognised on time proportion basis, taking into account the amount outstanding and effective interest rate.
Rental Income:
Rental income arising from operating leases is accounted for on a straight-line basis over the lease terms and is included in revenue in the Statement of Profit and Loss due to its operating nature.
5.13 Government Grants, Subsidies and Export Incentives
Government grants and subsidies are recognised when there is reasonable assurance that the conditions attached to them are complied with and the grants/subsidy will be received.
When the grant or subsidy from the Government relates to an expense item, it is recognised as income on a systematic basis in the Statement of Profit and Loss over the period necessary to match them with the related costs, which they are intended to compensate. When the grant relates to an asset, it is recognised as income in equal amounts over the expected useful life of the related asset.
On receipt of grants of non-monetary assets, the asset and the grant are recorded at fair value amounts and released to profit or loss over the expected useful life in a pattern of consumption of the benefit of the underlying asset, i.e. by equal annual instalments. When loans or similar assistance are provided by governments or related institutions, with an interest rate below the current applicable market rate, the effect of this favourable interest is regarded as a government grant. The loan or assistance is initially recognised and measured at fair value of the proceeds received. The loan is subsequently measured as per the accounting policy applicable to financial liabilities.
Export benefits are accounted for in the year of exports based on eligibility and when there is no uncertainty in receiving the same.
5.14 Employee Benefits
I. Defined Contribution Plan
a. Superannuation
Contributions at a sum equivalent to 15% of eligible employees salary are made to Superannuation Funds administered by trustees and managed by Life Insurance Corporation of India (LIC). There is no liability for future Superannuation Fund benefits other than the annual contribution and such contributions are recognised as an expense in the year in which the services are rendered.
b. Provident Fund
Contributions towards Employees Provident Fund made to the Regional / Employee Provident Fund are recognised as expense in the year in which in which the services are rendered.
c. Employee State Insurance
Contributions to Employees State Insurance Scheme are recognised as expense in the year in which the services are rendered.
II. Defined Benefit Plan
a. Gratuity
Annual contributions are made to Gratuity Funds administered by trustees and the Contributions are invested in a Scheme with Life Insurance Corporation of India, as permitted by Indian Law. The liability for future gratuity benefits is accounted for based on actuarial valuation, as at the Balance Sheet date, determined every year using the Projected Unit Credit method.
Re-measurements comprising of Actuarial gains / losses the effect of the asset ceiling, excluding amounts included in net interest on the net defined benefit liability and the return on plan assets (excluding amounts included in net interest on the net defined benefit liability), are immediately recognised in the Balance Sheet with a corresponding debit or Credit in to retained earnings through Other Comprehensive Income in the period in which they occur. Re-measurements are not re-classified to profit or loss in subsequent periods.
Notes to Consolidated Financial Statements

162 Annual Report 2017-18
Tube Investments of India Limited(Formerly known as TI Financial Holdings Limited)
Past service cost is recognised in profit or loss on the earlier of the date of the plan amendment or curtailment, and the date recognised for related restructuring costs.
Net interest is calculated by applying the discount rate to the net defined benefit liability or asset. The following changes are recognised in the net defined benefit obligation as an expense in the Statement of Profit and Loss:
- Service costs comprising current service costs, past-service costs and
- Net interest expense or income.
b. Provident Fund
In respect of employees not covered under Point Ib above, contributions to the Group’s Employees Provident Fund Trust are made in accordance with the fund rules. The interest rate payable to the beneficiaries every year is being notified by the Government.
In the case of contribution to the Trust, the Group has an obligation to make good the shortfall, if any, between the return from the investments of the Trust and the notified interest rate and recognizes such obligation, determined based on an actuarial valuation, as an expense.
III. Long Term Compensated Absences
The accumulated leave expected to be carried forward beyond twelve months, as long-term employee benefit for measurement purposes. Such long-term compensated absences are provided for based on the actuarial valuation using the projected unit credit method at the year-end. Actuarial gains / losses are immediately taken to the Statement of Profit and Loss and are not deferred. The Group presents the leave as a current liability in the Balance Sheet, to the extent it does not have an unconditional right to defer its settlement for 12 months after the reporting date. Where Group has the unconditional legal and contractual right to defer the settlement for a period beyond 12 months, the same is presented as non-current liability.
IV. Short Term Employee Benefits
Short term employee benefits include short term compensated absences which is recognized based on the eligible leave at credit on the Balance
Sheet date, and the estimated cost is based on the terms of the employment contract.
V. Voluntary Retirement Scheme
Compensation to employees under Voluntary Retirement Schemes is expensed in the period in which the liability arises. The Group recognizes termination benefit as a liability and an expense when the Group has a present obligation as a result of past event, it is probable that an outflow of resources embodying economic benefits will be required to settle the obligation and a reliable estimate can be made of the amount of the obligation.
Employee benefits relating to employees of overseas subsidiaries are covered based on the labour laws prevailing in the country of incorporation of the subsidiaries.
5.15 Leases
The determination of whether an arrangement is, or contains, a lease is based on the substance of the arrangement at the inception of the lease. The arrangement is, or contains, a lease if fulfilment of the arrangement is dependent on the use of a specific asset or assets and the arrangement conveys a right to use the asset or assets, even if that right is not explicitly specified in an arrangement.
Operating Lease
Leases where the lessor effectively retains substantially all the risks and benefits of ownership of the leased assets are classified as operating leases. Operating lease payments are recognised as an expense in the Statement of Profit and Loss on a straight line basis over the lease term.
5.16 Foreign Currency Transactions
Initial recognition
Transactions in foreign currencies entered are accounted at the exchange rates prevailing on the date of the transaction or at the average rates that closely approximate the rate at the date of the transaction.
Measurement as at Balance Sheet Date
Foreign currency monetary items that are outstanding at the Balance Sheet date are restated at year end exchange rates.
Non-monetary items carried at historical cost are translated using the exchange rates at the dates of initial transactions.
Notes to Consolidated Financial Statements

Annual Report 2017-18 163
Corporate Overview Management Reports Financial Statements
Treatment of exchange differences
Exchange differences arising on settlement / restatement of foreign currency monetary assets and liabilities are recognised as income or expense in the Statement of Profit and Loss.
Consolidation of Subsidiaries situated in foreign countries
On consolidation, the assets and liabilities of foreign operations are translated into INR at the rate of exchange prevailing at the reporting date and their Statements of Profit or Loss are translated at exchange rates prevailing at the dates of the transactions. For practical reasons, the group uses an average rate to translate income and expense items, if the average rate approximates the exchange rates at the dates of the transactions. The exchange differences arising on translation for consolidation are recognised in OCI. On disposal of a foreign operation, the component of OCI relating to that particular foreign operation is recognised in profit or loss.
Any goodwill arising in the acquisition / business combination of a foreign operation and any fair value adjustments to the carrying amounts of assets and liabilities arising on the acquisition are treated as assets and liabilities of the foreign operation and translated at the spot rate of exchange at the reporting date.
5.17 Derivative Instruments and Hedge Accounting
The Group uses cash flow hedges (forward contracts and currency swaps) to hedge its risks associated with foreign currency fluctuations relating to firm commitment or highly probable forecast transactions. At the inception of a hedge relationship, the Group formally designates and documents the hedge relationship to which the Group wishes to apply hedge accounting and the risk management objective and strategy for undertaking the hedge by applying the hedge accounting principles set out in Ind AS 109 – “Financial Instruments”.
The use of Derivative Contracts is governed by the Group’s policies on the use of such financial derivatives consistent with the Group’s risk management strategy. The Group does not use derivative financial instruments for speculative purposes.
Derivative Contracts are measured at fair value. Derivatives are carried as financial assets when the fair value is positive and as financial liabilities when the fair value is negative. Changes in the fair value of these Derivative Contracts that are designated and effective as hedges of future cash flows are recognised directly in “Other Comprehensive Income” and the ineffective portion is recognized immediately in the Statement of Profit and Loss.
Changes in the fair value of Derivative Contracts that do not qualify for hedge accounting are recognized in the Statement of Profit and Loss as they arise.
The amounts recognised in the Other Comprehensive Income are transferred to the Statement of Profit and Loss when the hedged transactions crystalizes.
If the forecast transaction is no longer expected to occur, the cumulative gain or loss previously recognised in Other Comprehensive Income is transferred to Statement of Profit and Loss.
Hedge accounting is discontinued when the hedging instrument expires or is sold, terminated, or exercised. If any of these events occur or if a hedged transaction is no longer expected to occur, the net cumulative gain or loss recognised under Other Comprehensive Income is transferred to the Statement of Profit and Loss for the year.
At the inception of a hedge relationship, the Group formally designates and documents the hedge relationship to which the Group wishes to apply hedge accounting and the risk management objective and strategy for undertaking the hedge. The documentation includes the Group’s risk management objective and strategy for undertaking hedge, the hedging / economic relationship, the hedged item or transaction, the nature of the risk being hedged, hedge ratio and how the Group will assess the effectiveness of changes in the hedging instrument’s fair value in offsetting the exposure to changes in the hedged item’s fair value or cash flows attributable to the hedged risk. Such hedges are expected to be highly effective in achieving offsetting changes in fair value or cash flows and are assessed on an ongoing basis to determine that they actually have been highly effective throughout the financial reporting periods for which they were designated.
5.18 Depreciation and Amortisation
The Group depreciates Property, Plant and Equipment over their estimated useful lives using the Straight-line method, as per Schedule II of Companies Act, 2013. The estimated useful lives are as follows:
Description of Assets Useful life
Plant and Machinery 7.5 Years - 15 Years
Electrical Appliances 5 Years - 10 Years
Furniture and Fixtures 10 Years
Factory Buildings 30 Years
Other Buildings 60 Years
Vehicles 4 Years
Notes to Consolidated Financial Statements

164 Annual Report 2017-18
Tube Investments of India Limited(Formerly known as TI Financial Holdings Limited)
The following category of Property, Plant and Equipment are not depreciated as per Schedule II of Companies Act, 2013. These category of Property, Plant and Equipment are depreciated based on the Group’s estimate of their useful lives taking into consideration technical advise
Description of Assets Useful life
Buildings - Roof structure on certain factory areas, where useful life is less 10 Years - 15 Years
Plant and Machinery - Special tools and special purpose machines used in door frame products 4 Years
Plant and Machinery - Electrical Appliances such as Air Conditioner, Fridge, Water Cooler, Camera, TV, Grinder etc.,
5 Years
Plant and Machinery - used in die making process 10 Years
Plant and Machinery - used in cycle production 1 Year - 15 Years
Office Equipment - Data Processing Equipment 3 Years
Vehicles - Motor Vehicles 2 Years - 4 Years
Furniture and Fixtures 1 Year - 5 Years
Finance lease assets are depreciated over the primary lease period of 35 years - 95 years, as the right to use these assets ceases on expiry of the lease period.
Depreciation is provided pro-rata from the month of Capitalisation.
Certain Property, Plant and Equipment are treated as Continuous Process Plants based on technical evaluation done by the Management and are depreciated on the straight-line method based on the useful life as prescribed in Schedule II to the Companies Act, 2013.
5.19 Research and Development
Revenue expenditure on research and development is expensed when incurred. Capital expenditure on research and development is capitalised under Property, Plant and Equipment and depreciated in accordance with Note 5.18 above.
5.20 Taxes on Income
Income tax expense comprises current and deferred taxes. Income tax expense is recognized in the Statement of Profit and Loss except to the extent it relates to items recognized directly in Equity, in which case it is recognized in Equity.
Current tax is the amount of tax payable on the taxable income for the year and is determined in accordance with the provisions of the Income Tax Act, 1961.
Current income tax relating to items recognised outside profit or loss is recognised outside profit or loss (either in Other Comprehensive Income or in Equity). Current tax items are recognised in correlation to the underlying transaction either in OCI or directly in Equity.
Minimum alternate tax (MAT) paid in a year is charged to the Statement of Profit and Loss as current tax for the year. The group recognizes MAT credit only to the extent that it is probable that the group will pay normal income tax during the specified period, i.e., the period for which MAT credit is allowed to be carried forward. In the year in which the group recognizes MAT credit as an asset, it is created by way of credit to the Statement of Profit and Loss and shown as deferred tax asset. The group reviews the “MAT credit entitlement” asset at each reporting date and writes down the asset to the extent that it is probable that it will pay normal tax during the specified period.
Deferred tax is provided using the liability method on temporary differences between the tax bases of assets and liabilities and their carrying amounts for financial reporting purposes at the reporting date. Deferred Tax Liability is not recognised in respect of taxable temporary differences associated with investments in Subsidiaries and investments in Joint Ventures, when the timing of the reversal of the temporary differences can be controlled and it is probable that the temporary differences will not be reversed in the foreseeable future.
Deferred Tax Liabilities are recognised for all taxable temporary differences, except:
i. When the Deferred Tax Liability arises from the initial recognition of goodwill or an asset or liability in a transaction that is not a business combination and, at the time of the transaction, affects neither the accounting profit nor taxable profit or loss
ii. In respect of taxable temporary differences associated with investments in Subsidiaries, and interests in Joint Ventures, when the timing
Notes to Consolidated Financial Statements

Annual Report 2017-18 165
Corporate Overview Management Reports Financial Statements
of the reversal of the temporary differences can be controlled and it is probable that the temporary differences will not reverse in the foreseeable future.
Deferred Tax Assets are recognised for all deductible temporary differences, the carry forward of unused tax Credits and any unused tax losses. Deferred Tax Assets are recognised to the extent that it is probable that taxable profit will be available against which the deductible temporary differences, and the carry forward of unused tax Credits and unused tax losses can be utilised except
i. When the Deferred Tax Asset relating to the deductible temporary difference arises from the initial recognition of an asset or liability in a transaction that is not a business combination and, at the time of the transaction, affects neither the accounting profit nor taxable profit or loss.
ii. In respect of deductible temporary differences associated with investments in Subsidiaries, associates and interests in Joint Ventures, Deferred Tax Assets are recognised only to the extent that it is probable that the temporary differences will reverse in the foreseeable future and taxable profit will be available against which the temporary differences can be utilised.
The carrying amount of Deferred Tax Assets is reviewed at each reporting date and reduced to the extent that it is no longer probable that sufficient taxable profit will be available to allow all or part of the deferred tax asset to be utilised. Unrecognised Deferred Tax Assets are re-assessed at each reporting date and are recognised to the extent that it has become probable that future taxable profits will allow the Deferred Tax Asset to be recovered.
Deferred Tax Assets and Liabilities are measured at the tax rates that are expected to apply in the year when the asset is realised or the liability is settled, based on tax rates (and tax laws) that have been enacted or substantively enacted at the reporting date.
Deferred tax relating to items recognised outside the Statement of Profit and Loss is recognised outside Statement of Profit and Loss (either in Other Comprehensive Income or in Equity). Deferred Tax items are recognised in correlation to the underlying transaction either in OCI or directly in Equity.
Deferred Tax Assets and Deferred Tax Liabilities are offset if a legally enforceable right exists to set off current tax assets against current tax liabilities and the deferred taxes relate to the same taxable entity and the same taxation authority.
In the situations where there is an entitlement to a tax holiday under the Income-tax Act, 1961, no Deferred Tax (asset or liability) is recognized in respect of timing differences which reverse during the tax holiday period, to the extent the gross total income is subject to the deduction during the tax holiday period. Deferred tax in respect of timing differences which reverse after the tax holiday period is recognized in the year in which the timing differences originate.
In respect of overseas Subsidiaries, income tax is provided for based on income tax laws prevailing in the country of incorporation of the respective Subsidiaries.
5.21 Provisions and Contingencies
A provision is recognized when there is a present obligation (legal or constructive) as a result of past event; it is probable that an outflow of resources will be required to settle the obligation, in respect of which a reliable estimate can be made. Provisions are determined based on best estimate required to settle the obligation at the Balance Sheet date. These are reviewed at each Balance Sheet date and adjusted to reflect the current best estimates.
If the effect of the time value of money is material, provisions are discounted using a current pre-tax rate that reflects, when appropriate, the risks specific to the liability. When discounting is used, the increase in the provision due to the passage of time is recognised as a finance cost.
Provisions for warranty-related costs are recognized when the product is sold or service provided. Provision is estimated based on historical experience and technical estimates. The estimate of such warranty-related costs is reviewed annually.
A contingent liability is a possible obligation that arises from past events whose existence will be confirmed by the occurrence or non-occurrence of one or more uncertain future events beyond the control or a present obligation that is not recognized because it is not probable that an outflow of resources will be required to settle the obligation. The contingent liability is not recognised but its existence is disclosed in the Financial Statements.
Notes to Consolidated Financial Statements

166 Annual Report 2017-18
Tube Investments of India Limited(Formerly known as TI Financial Holdings Limited)
5.22 Borrowing Costs
Borrowing costs consist of interest and other costs that an entity incurs in connection with the borrowing of funds. Borrowing cost also includes exchange differences to the extent regarded as an adjustment to the borrowing costs. Borrowing costs directly attributable to the acquisition, construction or production of an asset that necessarily takes a substantial period of time to get ready for its intended use or sale are capitalised as part of the cost of the asset. Capitalisation of Borrowing Costs is suspended and charged to the Statement of Profit and Loss during extended periods when active development activity on the qualifying assets is interrupted. All other borrowing costs are expensed in the period they occur.
5.23 Earnings Per Share
Basic Earnings Per Share is calculated by dividing the net profit or loss for the period attributable to Equity Shareholders by the weighted average number of Equity Shares outstanding during the period.
The weighted average number of Equity Shares outstanding during the period and for all periods presented is adjusted for events, such as bonus shares, other than the conversion of potential Equity Shares, that have changed the number of Equity Shares outstanding, without a corresponding change in resources. For the purpose of calculating diluted earnings per share, the net profit or loss for the period attributable to Equity Shareholders and the weighted average number of shares outstanding during the period is adjusted for the effects of all dilutive potential Equity Shares.
5.24 Share Based Payments (Employees Stock Option Scheme)
Stock options are granted to the employees under the stock option scheme. The costs of stock options granted to the employees (equity-settled awards) of the group are measured at the fair value of the equity instruments granted. For each stock option, the measurement of fair value is performed on the grant date. The grant date is the date on which the group and the employees agree to the stock option scheme. The fair value so determined is revised only if the stock option scheme is modified in a manner that is beneficial to the employees.
This cost is recognised, together with a corresponding increase in Share-Based Payment (SBP) reserves / stock options outstanding account in Equity, over the period in which the performance and / or service conditions are fulfilled in employee benefits expense. The cumulative expense recognised for equity-settled
transactions at each reporting date until the vesting date reflects the extent to which the vesting period has expired and the group’s best estimate of the number of equity instruments that will ultimately vest. The Statement of Profit and Loss expense or Credit for a period represents the movement in cumulative expense recognised as at the beginning and end of that period and is recognised in employee benefits expense.
The dilutive effect of outstanding options is reflected as additional share dilution in the computation of diluted earnings per share.
If the options vests in instalments (i.e. the options vest pro rata over the service period), then each instalment is treated as a separate share option grant because each instalment has a different vesting period.
5.25 Financial Instruments
A financial instrument is any contract that gives rise to a financial asset of one entity and a financial liability or equity instrument of another entity.
A. Financial Assets
i. Initial Recognition and Measurement
All financial assets are recognised initially at fair value plus, in the case of financial assets not recorded at fair value through profit or loss, transaction costs that are attributable to the acquisition of the financial asset.
ii. Subsequent Measurement
For purposes of subsequent measurement, financial assets are classified in three categories:
a. Debt instruments at amortised cost
b. Debt instruments, derivatives and equity instruments at Fair Value Through Profit or Loss (FVTPL)
c. Equity instruments measured at Fair Value Through Other Comprehensive Income (FVTOCI)
Debt Instruments at Amortised Cost
A ‘debt instrument’ is measured at the amortised cost if both the following conditions are met:
a. The asset is held within a business model whose objective is to hold assets for collecting contractual cash flows, and
b. Contractual terms of the asset give rise on specified dates to cash flows that are solely payments of principal and interest (SPPI) on the principal amount outstanding.
Notes to Consolidated Financial Statements

Annual Report 2017-18 167
Corporate Overview Management Reports Financial Statements
This category is the most relevant to the Group. After initial measurement, such financial assets are subsequently measured at amortised cost using the effective interest rate (EIR) method. Amortised cost is calculated by taking into account any discount or premium on acquisition and fees or costs that are an integral part of the EIR. The EIR amortisation is included in finance income in the profit or loss. The losses arising from impairment are recognised in the profit or loss. This category generally applies to trade and other receivables.
Debt Instrument at FVTOCI
A ‘debt instrument’ is classified as at the FVTOCI if both of the following criteria are met:
a. The objective of the business model is achieved both by collecting contractual cash flows and selling the financial assets, and
b. The asset’s contractual cash flows represent SPPI.
Debt instruments included within the FVTOCI category are measured initially as well as at each reporting date at fair value. Fair value movements are recognized in the Other Comprehensive income (OCI). However, the Group recognizes interest income, impairment losses and reversals and foreign exchange gain or loss in the P&L. On derecognition of the asset, cumulative gain or loss previously recognised in OCI is reclassified from the Equity to P&L. Interest earned whilst holding FVTOCI debt instrument is reported as interest income using the EIR method.
Debt Instrument at FVTPL
FVTPL is a residual category for debt instruments. Any debt instrument, which does not meet the criteria for categorization as at amortized cost or as FVTOCI, is classified as at FVTPL.
In addition, the Group may elect to designate a debt instrument, which otherwise meets amortized cost or FVTOCI criteria, as at FVTPL. However, such election is allowed only if doing so reduces or eliminates a measurement or recognition inconsistency (referred to as ‘accounting mismatch’).
Debt instruments included within the FVTPL category are measured at fair value with all changes recognized in the P&L.
Equity Investments
All equity investments in scope of Ind-AS 109 are measured at fair value. Equity instruments which are held for trading are classified as at FVTPL. For all other equity instruments, the Group decides to classify the same either as at FVTOCI or FVTPL. The Group makes such election on an instrument-by-instrument basis. The classification is made on initial recognition and is irrevocable.
If the Group decides to classify an equity instrument as at FVTOCI, then all fair value changes on the instrument, excluding dividends, are recognized in the OCI. There is no recycling of the amounts from OCI to P&L, even on sale of investment. However, the Group may transfer the cumulative gain or loss within Equity.
iii. De-recognition
A financial asset (or, where applicable, a part of a financial asset or part of a group of similar financial assets) is primarily when:
a. The rights to receive cash flows from the asset have expired, or
b. The group has transferred substantially all the risks and rewards of the asset or has transferred control of the asset.
iv. Impairment of Financial Assets
In accordance with Ind-AS 109, the Group applies Expected Credit loss (ECL) model for measurement and recognition of impairment loss on the following financial assets and Credit risk exposure:
a. Financial assets that are debt instruments, and are measured at amortised cost e.g., loans, debt securities, deposits, trade receivables and bank balance
The Group follows ‘simplified approach’ for recognition of impairment loss allowance on Trade receivables.
The application of simplified approach does not require the Group to track changes in Credit risk. Rather, it recognises impairment loss allowance based on lifetime ECLs at each reporting date, right from its initial recognition. For recognition of impairment loss on other financial assets, the Group determines that whether there has been a significant increase in the credit risk since initial recognition.
Notes to Consolidated Financial Statements

168 Annual Report 2017-18
Tube Investments of India Limited(Formerly known as TI Financial Holdings Limited)
If Credit risk has not increased significantly, 12-month ECL is used to provide for impairment loss. However, if Credit risk has increased significantly, lifetime ECL is used. If, in a subsequent period, Credit quality of the instrument improves such that there is no longer a significant increase in Credit risk since initial recognition, then the entity reverts to recognising impairment loss allowance based on 12-month ECL.
Lifetime ECL are the expected Credit losses resulting from all possible default events over the expected life of a financial instrument. ECL is the difference between all contractual cash flows that are due to the group in accordance with the contract and all the cash flows that the group expects to receive, discounted at the original EIR. When estimating the cash flows, the Group is required to consider:
a. All contractual terms of the financial instrument (including prepayment, extension, call and similar options) over the expected life of the financial instrument. However, in rare cases when the expected life of the financial instrument cannot be estimated reliably, then the Group is required to use the remaining contractual term of the financial instrument
b. Cash flows from the sale of collateral held or other Credit enhancements that are integral to the contractual terms
As a practical expedient, the Group uses a provision matrix to determine impairment loss allowance on portfolio of its trade receivables. The provision matrix is based on its historically observed default rates over the expected life of the trade receivables and is adjusted for forward-looking estimates. At every reporting date, the historical observed default rates are updated and changes in the forward-looking estimates are analysed.
ECL impairment loss allowance (or reversal) recognized during the period is recognized as income/ expense in the Statement of Profit and Loss (P&L). This amount is reflected under the head ‘other expenses’ in the P&L. The Balance Sheet presentation for various financial instruments is described below:
Financial assets measured as at amortised cost: ECL is presented as an allowance, i.e., as an integral part of the measurement of those assets in the Balance Sheet. The allowance reduces the net carrying
amount. Until the asset meets write-off Criteria, the group does not reduce impairment allowance from the gross carrying amount.
For assessing increase in Credit risk and impairment loss, the group combines financial instruments on the basis of shared Credit risk characteristics with the objective of facilitating an analysis that is designed to enable significant increases in Credit risk to be identified on a timely basis.
B. Financial Liabilities
i. Initial Recognition and Measurement
All financial liabilities are recognised initially at fair value and, in the case of loans and borrowings and payables, net of directly attributable transaction costs.
The Group’s financial liabilities include trade and other payables, loans and borrowings including bank overdrafts and derivative financial instruments.
ii. Subsequent measurement
The measurement of financial liabilities depends on their classification, as described below:
Financial Liabilities at Fair Value Through Profit or Loss
Financial liabilities at fair value through profit or loss include derivatives. Financial liabilities are classified as held for trading if they are incurred for the purpose of repurchasing in the near term. This category also includes derivative financial instruments entered into by the group that are not designated as hedging instruments in hedge relationships as defined by Ind AS 109. Separated embedded derivatives are also classified as held for trading unless they are designated as effective hedging instruments.
Gains or losses on liabilities held for trading are recognised in the profit or loss.
Financial liabilities designated upon initial recognition at fair value through profit or loss are designated as such at the initial date of recognition, and only if the Criteria in Ind AS 109 are satisfied. For liabilities designated as FVTPL, fair value gains / losses
Notes to Consolidated Financial Statements

Annual Report 2017-18 169
Corporate Overview Management Reports Financial Statements
attributable to changes in own Credit risks are recognized in OCI. These gains / loss are not subsequently transferred to P&L. However, the group may transfer the cumulative gain or loss within Equity. All other changes in fair value of such liability are recognised in the Statement of Profit and Loss.
Loans and Borrowings
After initial recognition, interest-bearing loans and borrowings are subsequently measured at amortised cost using the EIR method. Gains and losses are recognised in profit or loss when the liabilities are derecognised as well as through the EIR amortisation process.
Amortised cost is calculated by taking into account any discount or premium on acquisition and fees or costs that are an integral part of the EIR. The EIR amortisation is included as finance costs in the Statement of Profit and Loss.
De-recognition
A financial liability is derecognised when the obligation under the liability is discharged or cancelled or expires. When an existing financial liability is replaced by another from the same lender on substantially different terms, or the terms of an existing liability are substantially modified, such an exchange or modification is treated as the de-recognition of the original liability and the recognition of a new liability. The difference in the respective carrying amounts is recognised in the Statement of Profit and Loss.
Offsetting of Financial Instruments
Financial assets and financial liabilities are offset and the net amount is reported in the Balance Sheet if there is a currently enforceable legal right to offset the recognised amounts and there is an intention to settle on a net basis, to realise the assets and settle the liabilities simultaneously.
Notes to Consolidated Financial Statements

170 Annual Report 2017-18
Tube Investments of India Limited(Formerly known as TI Financial Holdings Limited)
Not
e 6
a. P
rope
rty,
Pla
nt a
nd E
quip
men
t `
in C
rore
sPa
rtic
ular
sG
ross
Blo
ck a
t Cos
tD
epre
ciat
ion
Net
Blo
ck
As
at31
-Mar
-20
17
Acq
uisi
tion
thro
ugh
Busi
ness
C
ombi
natio
n (R
efer
Not
e 39
)
Adj
ustm
ent
purs
uant
to
Sche
me
of
Arr
ange
men
t (R
efer
Not
e 1.
2)
Exch
ange
Fl
uctu
atio
n pe
rtai
ning
to
For
eign
Su
bsid
iarie
s
Add
ition
sD
elet
ions
As
at31
-Mar
-20
18
As
at31
-Mar
-20
17
Adj
ustm
ent
purs
uant
to
Sche
me
of
Arr
ange
men
t (R
efer
Not
e 1.
2)
Exch
ange
Fl
uctu
atio
n pe
rtai
ning
to
For
eign
Su
bsid
iarie
s
For t
he
Year
On
Del
etio
nsA
s at
31-M
ar-
2018
As
at31
-Mar
-20
18
As
at31
-Mar
-20
17
Land
(Fre
ehol
d)12
7.47
- -
0.31
1.38
-12
9.16
- -
- -
- -
129.
1612
7.47
- -
(128.
28)
(0.0
1) -
(0.8
0)(12
7.47)
- -
- -
- -
(127.4
7) -
Land
(Lea
seho
ld)
12.9
2 -
-0.
881.1
4 -
14.9
49.
49 -
0.75
1.71
-11
.95
2.99
3.43
- -
(12.4
3)(0
.03)
(0.5
2) -
(12.9
2) -
(6.8
0)(0
.12)
(2.8
1) -
(9.4
9)(3
.43)
-
Build
ings
281.
406.
21-
1.98
46.4
41.6
233
4.41
38.7
0-
1.90
12.7
10.
2053
.1128
1.30
242.
70
- -
(230
.73)
(0.0
6)(5
0.80
)(0
.07)
(281
.40)
-(2
7.44)
(0.0
6)(11
.32)
-(3
8.70
)(2
42.7
0) -
Plan
t and
M
achi
nery
826.
013.
24 -
10.4
012
6.48
14.7
795
1.36
236.
66 -
8.16
128.
8110
.39
363.
2458
8.12
589.
35
- -
(701
.42)
(0.3
2)(13
7.97)
(13.0
6)(8
26.0
1) -
(119.
19)
(0.5
0)(12
5.53
)(7
.56)
(236
.66)
(589
.35)
-
Railw
ay S
idin
g0.
01 -
- -
- -
0.01
- -
- -
- -
0.01
0.01
- -
(0.0
1) -
- -
(0.0
1) -
- -
- -
-(0
.01)
-
Offi
ce E
quip
men
t17
.75
0.03
-0.
504.
150.
1922
.24
8.66
-0.
365.
060.
1513
.93
8.31
9.09
- -
(12.3
7)(0
.01)
(5.8
4)(0
.45)
(17.7
5) -
(4.5
8)(0
.01)
(4.5
2)(0
.43)
(8.6
6)(9
.09)
-Fu
rnitu
re a
nd
Fixt
ures
10.0
80.
03 -
-1.
930.
1211
.92
2.05
- -
1.65
0.11
3.59
8.33
8.03
- -
(5.3
7) -
(4.7
6)(0
.05)
(10.0
8) -
(0.4
1) -
(1.69
)(0
.05)
(2.0
5)(8
.03)
-
Vehi
cles
10.3
3 -
- -
4.53
1.59
13.2
72.
50 -
-3.
260.
745.
028.
257.
83
- -
(6.4
5) -
(4.7
3)(0
.85)
(10.3
3) -
(0.15
) -
(2.6
1)(0
.26)
(2.5
0)(7
.83)
-
Tota
l1,
285.
97 9
.51
- 1
4.07
186
.05
18.
29 1
,477
.31
298
.06
- 1
1.17
153
.20
11.
59 4
50.8
41,0
26.4
7 9
87.9
1
- -
(1,09
7.06)
(0.4
3)(2
04.6
2)(15
.28)
(1,28
5.97
) -
(158.
57)
(0.6
9)(14
8.48
)(8
.30)
(298
.06)
(987
.91)
-
Not
es:
a.
All
the
abov
e as
sets
are
ow
ned
unle
ss o
ther
wis
e st
ated
as
leas
ed a
sset
.
b.
Non
Con
verti
ble
Deb
entu
res
of th
e gr
oup
are
secu
red
by fi
rst p
ari-p
assu
cha
rge
on c
erta
in L
and
and
Build
ings
.
c.
Prev
ious
Yea
r Fig
ures
are
giv
en in
bra
cket
s.
Not
e 6
b. In
tang
ible
Ass
ets
` in
Cro
res
Par
ticul
ars
Gro
ss B
lock
at C
ost
Dep
reci
atio
nN
et B
lock
As
at31
-Mar
-2
017
Acq
uisi
tion
thro
ugh
Bus
ines
s C
ombi
natio
n (R
efer
Not
e 39
)
Adj
ustm
ent
purs
uant
to
Sche
me
of
Arr
ange
men
t (R
efer
N
ote
1.2)
Exch
ange
Fl
uctu
atio
n on
Ope
ning
B
lock
of
Fore
ign
Sub
sidi
arie
s
Add
ition
sD
elet
ions
As
at31
-Mar
-2
018
As
at31
-Mar
-2
017
Adj
ustm
ent
purs
uant
to
Sch
eme
of
Arr
ange
men
t (R
efer
Not
e 1.
2)
Exch
ange
Fl
uctu
atio
n on
For
eign
S
ubsi
diar
ies
For
the
Year
On
Del
etio
nsA
s at
31-M
ar-
20
18
As
at31
-Mar
-2
018
As
at31
-Mar
-2
017
Sof
twar
e1.1
0 -
- -
0.18
-1.
28
0.8
9 -
-0
.13 -
1.0
20
.26
0.2
1
- -
(0.9
8) -
(0.12
) -
(1.10
) -
(0.6
2) -
(0.2
7) -
(0.8
9)
(0.2
1) -
Leas
e H
old
Rig
ht -
10.7
1 -
(0.0
3) -
-10
.68
- -
-0
.04
-0
.04
10.6
4 -
- -
- -
- -
- -
- -
- -
- -
-
Tota
l1.1
010
.71
-(0
.03)
0.18
-11
.96
0.8
9 -
-0
.17 -
1.0
610
.90
0.2
1
- -
(0.9
8) -
(0.12
) -
(1.10
) -
(0.6
2) -
(0.2
7) -
(0.8
9)
(0.2
1) -
Not
es t
o C
onso
lidat
ed F
inan
cial
Sta
tem
ents

Annual Report 2017-18 171
Corporate Overview Management Reports Financial Statements
Note 6c. Goodwill on Consolidation ` in Crores
Particulars As at
31-Mar-2018 As at
31-Mar-2017
Opening Balance as at beginning of the period 305.79 -
Adjustment pursuant to Scheme of Arrangement (Refer Note 1.2) - 305.81
Effect of Foreign Currency Translation 2.38 (0.02)
Closing Balance as at end of the period 308.17 305.79
Impairment
Opening Balance as at beginning of the period - -
Adjustment pursuant to Scheme of Arrangement (Refer Note 1.2) - -
Impairment during the year - -
Closing Balance as at end of the period - -
Goodwill as at end of the period 308.17 305.79
Goodwill recognised at the time of acquisition of Shanthi Gears Limited (SGL)
The Goodwill recognised at the time of acquisition of the SGL represents the significant portion of the total Goodwill carried by the Group. The quoted market value of shares of SGL as on 31st March 2018 is higher than the acquisition price and hence there are no indicators of impairment of such Goodwill.
Goodwill recognised at the time of acquisition of other entities
This represents the goodwill recognised on the acquisition of other Subsidiaries viz., Financiere C10 SAS. The aggregate values of the same are not significant. The Group believes that the carrying amount of the Goodwill is recoverable.
Note 7. Investment Property ` in Crores
Particulars As at
31-Mar-2018 As at
31-Mar-2017
Gross Block
Opening Balance as at beginning of the period 12.54 -
Adjustment pursuant to Scheme of Arrangement (Refer Note 1.2) - 12.54
Additions during the year - -
Closing Balance as at end of the period 12.54 12.54
Depreciation
Opening Balance as at beginning of the period 0.25 -
Adjustment pursuant to Scheme of Arrangement (Refer Note 1.2) - 0.10
Depreciation during the year 0.17 0.15
Closing Balance as at end of the period 0.42 0.25
Net Block as at the end of the period 12.12 12.29
Notes to Consolidated Financial Statements

172 Annual Report 2017-18
Tube Investments of India Limited(Formerly known as TI Financial Holdings Limited)
Information regarding Income and Expenditure of Investment property: ` in Crores
ParticularsYear Ended31-Mar-2018
Year Ended31-Mar-2017
Rental Income derived from Investment Properties 0.79 0.89
Direct Operating Expenses (including repairs and maintenance) - -
Profit arising from Investment Properties before Depreciation and Indirect Expenses 0.79 0.89
Depreciation (0.17) (0.15)
Profit arising from Investment Properties before Indirect Expenses 0.62 0.74
The Group’s Investment Property consists of properties in Chennai, Mumbai and Coimbatore.
As at 31st March 2018, the Fair Value of the Properties is `14.91 Cr. (31st March 2017 - `14.61 Cr.)
The Fair Value of the Investment Properties is determined by professional valuer based on current prices in the market. The resulting Fair Value Estimates are classified under level 2 of the Fair Value Hierarchy. (Refer Note 43.2)
The Group has no restrictions on the disposal of its Investment Property and no contractual obligations to purchase, construct or develop Investment Property or for repairs, maintenance and enhancements.
` in Crores
Particulars As at
31-Mar-2018 As at
31-Mar-2017
Opening Balance as at beginning of the period 14.61 -
Adjustment pursuant to Scheme of Arrangement (Refer Note 1.2) - 12.44
Fair value difference 0.30 2.17
Closing Balance as at end of the period 14.91 14.61
Notes to Consolidated Financial Statements

Annual Report 2017-18 173
Corporate Overview Management Reports Financial Statements
Not
e 8
a. F
inan
cial
ass
ets
- Inv
estm
ents
Nom
inal
Val
ue
` pe
r un
it
Num
ber
of s
hare
s`
in C
rore
s
As
at31
-Mar
-20
18A
s at
31-M
ar-2
017
As
at31
-Mar
-20
18A
s at
31-M
ar-2
017
Inve
stm
ents
Inve
stm
ents
at F
air
Val
ue T
hrou
gh O
ther
C
ompr
ehen
sive
Inco
me
(FV
TOC
I):
Inve
stm
ent i
n no
n-gr
oup
com
pani
es
Equi
ty S
hare
s (F
ully
Pai
d) -
Quo
ted
LG
Bal
akris
hnan
& B
ros.
Lim
ited
10
5,19
2 5
,192
0.5
5 0
.32
LG
B F
orge
Lim
ited
1 2
5,9
60
25
,96
0 0
.01
0.0
2
G
IC H
ousi
ng F
inan
ce L
imite
d 1
0 4
8,70
0 4
8,70
0 1
.81
1.7
9
Equi
ty S
hare
s (F
ully
Pai
d) -
Unq
uote
d
Bo
mba
y M
erca
ntile
Co-
op. L
imite
d (F
air v
alue
`5
,00
0 o
nly)
10
50
0 5
00
- -
So
uthe
rn E
nerg
y D
evel
opm
ent C
orpo
ratio
n Li
mite
d 1
0 7
0,0
00
70,
00
0 6
.34
7.6
5
TI
Cyc
les
of In
dia
Co-
oper
ativ
e C
ante
en L
imite
d (F
air v
alue
- `2
50
onl
y) 5
50
50
- -
TI
Dia
mon
d-M
iller
Co-
oper
ativ
e C
ante
en L
imite
d (F
air v
alue
- `1
00
onl
y) 5
20
20
- -
Ca
uver
y Po
wer
Gen
erat
ion
Che
nnai
Priv
ate
Lim
ited
10
24,
00,
00
0 2
4,0
0,0
00
2.4
1 2
.41
11.1
2 1
2.19
Inve
stm
ents
at F
VTO
CI (
fully
pai
d) re
flect
inve
stm
ent i
n qu
oted
and
unq
uote
d eq
uity
inve
stm
ents
. Ref
er N
ote
43.1
for d
eter
min
atio
n of
this
fair
valu
e.
Not
es t
o C
onso
lidat
ed F
inan
cial
Sta
tem
ents

174 Annual Report 2017-18
Tube Investments of India Limited(Formerly known as TI Financial Holdings Limited)
` in
Cro
res
As
at31
-Mar
-20
18A
s at
31-M
ar-2
017
Quo
ted
Cos
t 0
.24
0.2
4
Mar
ket v
alue
2.3
7 2
.13
Unq
uote
d
Cos
t 2
.48
2.4
8
Nom
inal
Val
ue`
per
unit
Num
ber
of s
hare
s`
in C
rore
s
As
at31
-Mar
-20
18 A
s at
31-M
ar-2
017
As
at31
-Mar
-20
18 A
s at
31-M
ar-2
017
Inve
stm
ents
at A
mor
tised
Cos
t:
Inve
stm
ents
in T
ax F
ree
Bon
ds -
Quo
ted
PFC
Tax
Fre
e B
onds
1,0
00
2,5
67
2,5
67
0.2
6 0
.26
IRFC
Tax
Fre
e B
onds
1,0
00
26
,783
26
,783
2.7
5 2
.75
NH
AI T
ax F
ree
Bon
ds 1
,00
0 1
1,428
11,4
28 1
.14 1
.14
IRED
A T
ax F
ree
Bon
ds 1
,00
0 2
3,6
24 2
3,6
24 2
.41
2.4
1
HU
DC
O T
ax F
ree
Bon
ds 1
,00
0 2
1,442
21,4
42 2
.19 2
.19
NA
BA
RD
Tax
Fre
e B
onds
1,0
00
4,0
08
4,0
08
0.4
0 0
.40
REC
L Ta
x Fr
ee B
onds
1,0
00
8,0
00
8,0
00
0.9
4 0
.94
NTP
C T
ax F
ree
Bon
ds 1
,00
0 1
7,735
17,7
35 1
.99
1.9
9
NH
PC L
imite
d Ta
x Fr
ee B
onds
1,0
00
80
0 8
00
0.0
9 0
.09
12
.17 1
2.17
Tota
l 2
3.2
9 2
4.36
Inve
stm
ents
at F
VTP
L re
flect
inve
stm
ents
in q
uote
d ta
x fr
ee b
onds
. Ref
er N
ote
43.1
for d
eter
min
atio
n of
thei
r fai
r val
ue.
Not
es t
o C
onso
lidat
ed F
inan
cial
Sta
tem
ents

Annual Report 2017-18 175
Corporate Overview Management Reports Financial Statements
Note 8b. Other Financial Assets
(At Amortised Cost) ` in Crores
ParticularsAs at
31-Mar-2018As at
31-Mar-2017
Electricity and Other deposits 17.73 19.64
Others 4.57 2.52
Total 22.30 22.16
Note 9. Other Non-Current Assets
(Considered Good, Unsecured unless stated otherwise) ` in Crores
ParticularsAs at
31-Mar-2018As at
31-Mar-2017
Capital Advances
- Secured 3.83 9.54
- Unsecured
Considered Good 9.30 8.34
Considered Doubtful 0.18 0.18
13.31 18.06
Less: Provision for Doubtful Advance (0.18) (0.18)
13.13 17.88
Balance with Customs, Excise and Sales Tax Authorities 18.26 11.29
Security Deposits 2.31 3.07
Rental Advance 0.22 0.18
Total 33.92 32.42
Note 10. Inventories
(Lower of Cost and Net Realisable Value) ` in Crores
ParticularsAs at
31-Mar-2018As at
31-Mar-2017
Raw Materials 252.90 221.65
Work-in-Progress 191.34 151.75
Finished Goods 216.91 257.44
Stock-in-Trade 62.00 58.42
Stores and Spare Parts 7.04 7.51
Goods-in-Transit
- Raw Materials 21.74 24.61
- Stock-in-Trade 8.93 9.89
Total 760.86 731.27
During the year ended 31st March 2018, `12.56 Cr. was recognised as an expense to bring the inventories to record them at Net Realisable Value. (31st March 2017 - `8.08 Cr.)
Notes to Consolidated Financial Statements

176 Annual Report 2017-18
Tube Investments of India Limited(Formerly known as TI Financial Holdings Limited)
Note 11a. Loans
(Considered Good, Unsecured unless stated otherwise) ` in Crores
Particulars As at
31-Mar-2018 As at
31-Mar-2017
Loan to Employees 1.64 1.58
Total 1.64 1.58
Loans to employees are Non-Derivative Financial Assets which generate a fixed or variable interest income for the Group.
Note 11b. Trade Receivables
(Unsecured) ` in Crores
ParticularsAs at
31-Mar-2018As at
31-Mar-2017
Outstanding for a period exceeding six months from the date they are due for payment
Considered Good 18.07 5.03
Doubtful 8.82 8.08
26.89 13.11
Provision for Doubtful Receivables (8.82) (8.08)
18.07 5.03
Other receivables
Considered Good 681.92 612.14
Doubtful - -
681.92 612.14
Provision for Impairment on Receivables (2.98) (2.18)
678.94 609.96
Total Trade receivables
Considered Good 699.99 617.17
Doubtful 8.82 8.08
708.81 625.25
Provision for Doubtful / Impairment on Receivables (11.80) (10.26)
Total 697.01 614.99
Trade Receivables are non-interest bearing and generally have credit period to a maximum of 120 days. For terms and conditions relating to Related Party receivables, refer Note 36.
Provision for Doubtful debts / Impairment ` in Crores
ParticularsAs at
31-Mar-2018As at
31-Mar-2017
Opening Balance as at beginning of the period 10.26 -
Adjustment pursuant to Scheme of Arrangement (Note 1.2) - 14.97
Created / (Reversed) during the year 1.54 (4.71)
Closing Balance as at end of the period 11.80 10.26
Notes to Consolidated Financial Statements

Annual Report 2017-18 177
Corporate Overview Management Reports Financial Statements
Note 11c. Investments ` in Crores
ParticularsAs at
31-Mar-2018As at
31-Mar-2017
Quoted Investments - FVTPL
Investments in Mutual Funds 101.40 159.68
Total 101.40 159.68
Note 11d. Cash and Cash Equivalents ` in Crores
Particulars As at
31-Mar-2018 As at
31-Mar-2017
Balances with Banks in Current Account 25.37 20.78
Fixed Deposits 3.23 -
Cash on Hand 2.87 2.77
31.47 23.55
Other bank balances:
- Unpaid Dividend accounts 0.99 0.39
32.46 23.94
Cash Credit facility (Secured) (88.55) (9.19)
Balances in Unpaid Dividend Accounts (0.99) (0.39)
Total Cash and Cash Equivalents as per Statement of Cash Flow (57.08) 14.36
As at 31st March 2018, the Group has undrawn committed lines of `287.53 Cr. (As at 31st March 2017 - `224.03 Cr.).
Pursuant to the Scheme of Arrangement (Refer Note 1.2), in the previous year, the Cash and Cash Equivalents taken over as at 1st April 2016, is `609.65 Cr. For the purpose of Cash Flow Statement under Ind AS, the Bank Overdraft / Cash Credit balances of `30.30 Cr. as at 1st April 2016 has been reduced from Cash and Cash equivalents.
Note 11e. Other Financial Assets
(At Amortised Cost) ` in Crores
Particulars As at
31-Mar-2018 As at
31-Mar-2017
Interest Accrued 5.24 4.39
Claims Recoverable
- Goods and Services 4.01 1.58
- Employee Related 0.44 0.18
Balance in Fixed Deposit Accounts 47.61 61.66
Other Deposits 3.58 4.23
Government Grants 15.48 7.01
Others 2.49 2.34
Total 78.85 81.39
Notes to Consolidated Financial Statements

178 Annual Report 2017-18
Tube Investments of India Limited(Formerly known as TI Financial Holdings Limited)
Note 12. Other Current Assets
(Considered Good, Unsecured unless stated otherwise) ` in Crores
ParticularsAs at
31-Mar-2018As at
31-Mar-2017
Advances and Claims Recoverable
- Goods and Services 15.36 17.02
- Employee Related 15.71 14.11
- Prepaid Expenses 7.54 4.44
- Gratuity Fund (Net of Provision) 1.30 0.58
- Others 0.02 -
39.93 36.15
Balances with Customs, Excise, Sales Tax and GST Authorities 47.28 41.72
Total 87.21 77.87
Note 13. Equity Share Capital ` in Crores
ParticularsAs at
31-Mar-2018As at
31-Mar-2017
Authorised Capital
25,00,00,000 Equity Shares of `1 each 25.00 25.00
Issued, Subscribed and Paid-up Capital
18,75,36,368 Equity Shares of `1 each fully paid up(31-Mar-2017: 18,74,47,871 Equity Shares of `1 each fully paid up)
18.75 18.74
18.75 18.74
Note - Pursuant to the Scheme of Arrangement (Refer Note 1.2), during the year, the Company issued One fully paid up Equity Share of `1 each for every one fully paid up Equity Share held in Demerged Company, accumulating to 18,74,90,591 shares as at the record date i.e 28th August 2017.
a) The Reconciliation of shares capital is given below:
ParticularsAs at 31-Mar-2018 As at 31-Mar-2017
No. of Shares ` in Crores No. of Shares ` in Crores
At the beginning of the year 18,74,47,871 18.74 1,10,000 0.11
Cancellation of existing Equity Share Capital pursuant to Scheme of Arrangement (Note 1.2)
- - (1,10,000) (0.11)
Equity Shares of `1 each to be issued pursuant to Scheme of Arrangement (Note 1.2)
- - 18,74,47,871 18.74
Issue of Share Capital * 88,497 0.01 - -
At the end of the year 18,75,36,368 18.75 18,74,47,871 18.74
*The Breakup of shares issued during the year was as follows:
Particulars (Refer Note 33) No of Shares
Shares issued upon exercise of Employee Stock Options of the Demerged Company prior to the record date
42,720
Shares issued upon exercise of Employee Stock Options of the Resulting Company 45,777
Total 88,497
Notes to Consolidated Financial Statements

Annual Report 2017-18 179
Corporate Overview Management Reports Financial Statements
b) Terms / Rights attached to class of shares
The Company has only one class of shares referred to as Equity Shares having a par value of `1 each. The holders of Equity Shares are entitled to one vote per share. Dividend proposed by the Board of Directors, if any, is subject to the approval of the shareholders in the ensuing Annual General Meeting, except in case of interim dividend. Repayment of capital will be in proportion to the number of Equity Shares held by the shareholders.
c) Details of Shareholder(s) holding more than 5 percent of Equity Shares in the Company
Particulars As at 31-Mar-2018 As at 31-Mar-2017
No. of Shares
% against total number of shares
No. of Shares
% against total number of shares
Ambadi Investments Limited (Face Value `1 each)
7,00,66,595 37.36% 6,40,54,680 34.17%
Pursuant to the Scheme of Amalgamation of Murugappa Holdings Limited and Pressmet Private Limited with Ambadi Investments Private Limited, Murugappa Holdings Limited and Pressmet Private Limited have been merged with Ambadi Investments Limited. Subsequent to this Amalagamation, Ambadi Investments Private Limited has become a public limited company.
d) Status on Global Depository Receipts (GDRs)
Pursuant to the Scheme of Arrangement (Refer Note 1.2), during the year, the Company issued shares in the ratio of GDRs held by them in the Demerged Company, to a appointed depository. The appointed depository shall hold such shares on behalf of the holders of the Demerged Company GDRs. Consequently, the aggregate number of GDRs deemed to be outstanding as at 31st March 2018 is 42,30,630 (As at 31st March 2017 - 42,30,630) each representing one Equity Share of `1 face value. GDR % against total number of shares is 2.26%. The GDRs carry the same terms/rights attached to Equity Shares of the Company.
Note 14. Other Equity ` in Crores
ParticularsAs at
31-Mar-2018As at
31-Mar-2017
General Reserve 361.77 355.46
Securities Premium Reserve 0.10 -
Retained Earnings 762.55 687.62
Other Reserves
Share Options Outstanding Account 5.43 -
Cash Flow Hedge Reserve (0.12) (0.24)
Foreign Currency Translation Reserve 4.19 (0.06)
FVTOCI Reserve 6.64 7.20
Capital Reserve 0.49 0.11
Capital Redemption Reserve 0.01 0.01
Debenture Redemption Reserve 112.50 118.75
Total 1,253.56 1,168.85
Notes to Consolidated Financial Statements

180 Annual Report 2017-18
Tube Investments of India Limited(Formerly known as TI Financial Holdings Limited)
a. General Reserve - The general reserve is a free reserve, retained from Group’s profits to meet future obligations.
` in Crores
ParticularsAs at
31-Mar-2018As at
31-Mar-2017
Balance at the beginning of the year 355.46 -
Adjustment pursuant to Scheme of Arrangement (Refer Note 1.2) - 351.25
Transfer to General Reserve from Retained earnings 6.31 4.21
Balance at the end of the year 361.77 355.46
b. Securities Premium Reserve - The Securities premium received during the year represents the premium received towards allotment of shares. This balance will be utilised in accordance with the provisions of Section 52 of the Companies Act towards issuance of fully paid bonus shares, write-off of preliminary expenses, commission / discount expenses on issue of shares / debentures, premium payable on redemption of redeemable preference shares / debentures and buy back of its own shares / securities under Section 68 of the Companies Act, 2013.
` in Crores
ParticularsAs at
31-Mar-2018As at
31-Mar-2017
Balance at the beginning of the year - -
Adjustment pursuant to Scheme of Arrangement (Refer Note 1.2) - -
Additions during the year 0.10 -
Balance at the end of the year 0.10 -
c. Retained Earnings - The amount that can be distributed by the Group as dividends to its Equity Shareholders is determined based on the financial statements of the Group and also considering the requirements of the Companies Act, 2013. Thus, the amounts reported below are not distributable in entirety.
` in Crores
ParticularsAs at
31-Mar-2018As at
31-Mar-2017
Balance at the beginning of the year 687.62 (0.06)
Adjustment pursuant to Scheme of Arrangement (Refer Note 1.2) - 426.27
Profit for the Year 147.39 167.62
DRR transferred to Retained Earnings 6.25 102.08
Transfer to General Reserve (6.31) (4.21)
Dividend paid during the year (60.94) -
Dividend Distribution tax paid during the year (10.36) -
Dividend and Dividend Distribution Tax paid by Subsidiary (2.05) -
Re-measurement Gain / (Loss) on Defined Benefit Obligations (Net) transferred to Retained Earnings
0.95 (4.08)
Balance at the end of the year 762.55 687.62
Notes to Consolidated Financial Statements

Annual Report 2017-18 181
Corporate Overview Management Reports Financial Statements
d. Share Option Outstanding Account - Under Ind AS 102, fair value of the options granted is to be expensed out over the life of the vesting period as employee compensation costs reflecting period of receipt of service. Stock options granted but not vested as on the transition date were valued for expired period, calculated from the grant date till date of transition were credited to Share options outstanding account.
` in Crores
ParticularsAs at
31-Mar-2018As at
31-Mar-2017
Balance at the beginning of the year - -
Adjustment pursuant to Scheme of Arrangement (Refer Note 1.2) - -
Additions during the year 5.43 -
Balance at the end of the year 5.43 -
e. Cash Flow Hedge Reserve - The cash flow hedging reserve represents the cumulative effective portion of gains or losses arising on changes in fair value of designated portion of hedging instruments entered into for cash flow hedges. The cumulative gain or loss arising on changes in fair value of the designated portion of the hedging instruments that are recognised and accumulated under the heading of cash flow hedging reserve will be reclassified to profit or loss only when the hedged transaction affects the profit or loss, or included as a basis adjustment to the non-financial hedged item.
` in Crores
ParticularsAs at
31-Mar-2018As at
31-Mar-2017
Balance at the beginning of the year (0.24) -
Adjustment pursuant to Scheme of Arrangement (Refer Note 1.2) - (0.57)
Other comprehensive income for the Year (Note 29) 0.12 0.33
Balance at the end of the year (0.12) (0.24)
f. Foreign Currency Translation Reserve - Exchange differences relating to the translation of the Results and Net Assets of the Foreign Subsidiaries from their functional currencies to the Group’s presentation currency (ie., Indian Rupees) are recognised directly in Other Comprehensive Income and accumulated in the Foreign Currency Translation Reserve. At the time of disposal of the foreign operation, it is reclassified to the Statement of Profit and Loss.
` in Crores
ParticularsAs at
31-Mar-2018As at
31-Mar-2017
Balance at the beginning of the year (0.06) -
Adjustment pursuant to Scheme of Arrangement (Refer Note 1.2) - 0.70
Movement during the year (Net of tax) 4.25 (0.76)
Balance at the end of the year 4.19 (0.06)
Notes to Consolidated Financial Statements

182 Annual Report 2017-18
Tube Investments of India Limited(Formerly known as TI Financial Holdings Limited)
g. FVTOCI Reserve - This reserve represents the cumulative gains and losses arising on the revaluation of equity instruments measured at fair value through Other Comprehensive Income.
` in Crores
ParticularsAs at
31-Mar-2018As at
31-Mar-2017
Balance at the beginning of the year 7.20 -
Adjustment pursuant to transition to Ind AS - 5.18
Other comprehensive income for the Year (Note 29) 0.77 (2.06)
Gain on bargain purchase of subsidiaries through Business Combination (Refer Note 39)
(0.38) -
Re-measurement (Loss) / Gain on Defined Benefit Obligations (Net) transferred to Retained Earnings
(0.95) 4.08
Balance at the end of the year 6.64 7.20
h. Capital Reserve - The share capital of the Company as at 31st March 2016, had been cancelled pursuant to the Scheme of Arrangement (Refer Note 1.2) and the same has been credited to the Capital Reserve. The amount also includes the gain on bargain purchase relating to acquisition of two subsidiaries namely, Great Cycles (Private) Limited and Creative Cycles (Private) Limited.
` in Crores
ParticularsAs at
31-Mar-2018As at
31-Mar-2017
Balance at the beginning of the year 0.11 -
Adjustment pursuant to Scheme of Arrangement (Refer Note 1.2) - 0.11
Gain on bargain purchase of Subsidiaries through Business Combination(Refer Note 39)
0.38 -
Balance at the end of the year 0.49 0.11
i. Debenture Redemption Reserve (DRR) - The Group has been vested with redeemable non-convertible debentures, pursuant to the Scheme of Arrangement. Accordingly, the Companies (Share capital and Debentures) Rules, 2014 (as amended), require the Group to create DRR out of profits of the Group available for payment of dividend. DRR is required to be created for an amount which is equal to 25% of the value of debentures outstanding. According the Group has created DRR equal to 25% of the outstanding debentures.
` in Crores
ParticularsAs at
31-Mar-2018As at
31-Mar-2017
Balance at the beginning of the year 118.75 -
Adjustment pursuant to Scheme of Arrangement (Refer Note 1.2) - 220.83
Additions during the year 25.00 72.92
Deletions during the year (31.25) (175.00)
Balance at the end of the year 112.50 118.75
Notes to Consolidated Financial Statements

Annual Report 2017-18 183
Corporate Overview Management Reports Financial Statements
Note 15a. Long Term Borrowings ` in Crores
ParticularsAs at
31-Mar-2018As at
31-Mar-2017
Secured
Secured, Listed and Rated Non-Convertible Debentures (NCD)
7.56% Privately Placed NCD 100.00 -
7.55% Privately Placed NCD 100.00 100.00
8.79% Privately Placed NCD - 150.00
8.90% Privately Placed NCD - 100.00
Term Loan from Banks 28.56 28.26
Total 228.56 378.26
a. All NCDs are secured by a pari passu first charge on certain immovable properties of the group. (Refer Note 6a.b)
Repayment Schedule:
Secured, Listed and Rated Non-Convertible Debentures (NCD)
Coupon Rate Effective Interest Rate Oustanding Amount in ` Cr. Maturity date and Redemption particulars
7.56% 7.55% 100 28-Dec-20
7.55% 7.55% 100 20-Feb-20
* 8.79% 8.78% 150 26-Oct-18
* 8.90% 8.89% 100 25-Sep-18
*Classified as “Other Financial Liabilities” (Refer Note 17d)
b. Term Loans from banks are secured by way of immovable properties of the respective subsidiary and payable over a period of 3 years.
Note 15b. Long Term Liabilities ` in Crores
ParticularsAs at
31-Mar-2018As at
31-Mar-2017
Rental Deposits 0.88 0.66
Total 0.88 0.66
Note 16. Deferred Tax Assets and Liabilities ` in Crores
Nature - (Liability) / AssetBalance Sheet Statement of Profit and Loss
31-Mar-2018 31-Mar-2017 31-Mar-2018 31-Mar-2017
Deferred Tax Liabilities
Difference between depreciation as per books of accounts and the Income Tax Act, 1961
(57.95) (63.37) (5.42) (2.11)
Deferred Tax on proportionate share in proposed dividend of a subsidiary
- (0.87) (0.87) 0.87
Deferred Tax on fair valuation of assets on acqusition of Subsidiaries
(2.18) - 2.18 -
Deferred Tax on Foreign Currency Translation Reserve
(2.29) - 2.29 -
Others (2.65) (2.26) 0.39 (0.57)
Deferred Tax Liabilities - A (65.07) (66.50) (1.43) (1.81)
Notes to Consolidated Financial Statements
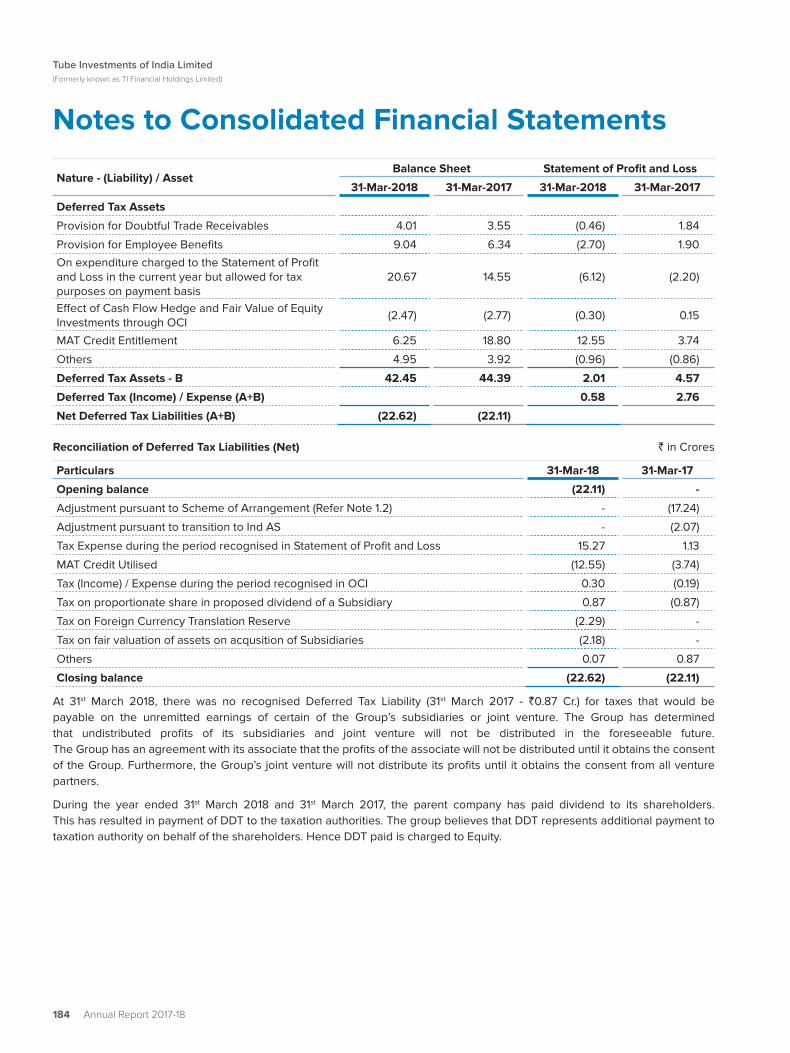
184 Annual Report 2017-18
Tube Investments of India Limited(Formerly known as TI Financial Holdings Limited)
Nature - (Liability) / AssetBalance Sheet Statement of Profit and Loss
31-Mar-2018 31-Mar-2017 31-Mar-2018 31-Mar-2017
Deferred Tax Assets
Provision for Doubtful Trade Receivables 4.01 3.55 (0.46) 1.84
Provision for Employee Benefits 9.04 6.34 (2.70) 1.90
On expenditure charged to the Statement of Profit and Loss in the current year but allowed for tax purposes on payment basis
20.67 14.55 (6.12) (2.20)
Effect of Cash Flow Hedge and Fair Value of Equity Investments through OCI
(2.47) (2.77) (0.30) 0.15
MAT Credit Entitlement 6.25 18.80 12.55 3.74
Others 4.95 3.92 (0.96) (0.86)
Deferred Tax Assets - B 42.45 44.39 2.01 4.57
Deferred Tax (Income) / Expense (A+B) 0.58 2.76
Net Deferred Tax Liabilities (A+B) (22.62) (22.11)
Reconciliation of Deferred Tax Liabilities (Net) ` in Crores
Particulars 31-Mar-18 31-Mar-17
Opening balance (22.11) -
Adjustment pursuant to Scheme of Arrangement (Refer Note 1.2) - (17.24)
Adjustment pursuant to transition to Ind AS - (2.07)
Tax Expense during the period recognised in Statement of Profit and Loss 15.27 1.13
MAT Credit Utilised (12.55) (3.74)
Tax (Income) / Expense during the period recognised in OCI 0.30 (0.19)
Tax on proportionate share in proposed dividend of a Subsidiary 0.87 (0.87)
Tax on Foreign Currency Translation Reserve (2.29) -
Tax on fair valuation of assets on acqusition of Subsidiaries (2.18) -
Others 0.07 0.87
Closing balance (22.62) (22.11)
At 31st March 2018, there was no recognised Deferred Tax Liability (31st March 2017 - `0.87 Cr.) for taxes that would be payable on the unremitted earnings of certain of the Group’s subsidiaries or joint venture. The Group has determined that undistributed profits of its subsidiaries and joint venture will not be distributed in the foreseeable future. The Group has an agreement with its associate that the profits of the associate will not be distributed until it obtains the consent of the Group. Furthermore, the Group’s joint venture will not distribute its profits until it obtains the consent from all venture partners.
During the year ended 31st March 2018 and 31st March 2017, the parent company has paid dividend to its shareholders. This has resulted in payment of DDT to the taxation authorities. The group believes that DDT represents additional payment to taxation authority on behalf of the shareholders. Hence DDT paid is charged to Equity.
Notes to Consolidated Financial Statements

Annual Report 2017-18 185
Corporate Overview Management Reports Financial Statements
Note 17a. Short term Borrowings ` in Crores
ParticularsAs at
31-Mar-2018As at
31-Mar-2017Secured Borrowings(secured by pari passu first charge on Inventories and Trade Receivables)
From Banks
Packing Credit Rupee Loans 148.92 142.62
Other Borrowings 68.94 37.08
Cash Credit 88.55 9.19
306.41 188.89
Unsecured Borrowings
From Banks
Other Borrowings - 9.26
Commercial Papers - 149.16
- 158.42
Total 306.41 347.31
Note - Short term Borrowings have a maturity of up to 6 months with an interest rate range of 7% - 10%.
During the current year, the Group has borrowed fresh short term loans amounting to `1,381.86 Cr. and repaid loans to the tune of `1,501.12 Cr. relating to Packing Credit, Commercial Paper and Other Borrowings.
Note 17b. Trade Payables ` in Crores
ParticularsAs at
31-Mar-2018As at
31-Mar-2017
Trade Payables
- Dues to Micro, Small and Medium Enterprises 0.40 1.36
- Others 950.15 774.02
Total 950.55 775.38
Terms and conditions of the above financial liabilities:
Trade Payables are non-interest bearing and are normally settled within a period of 90 to 180 days. For terms and conditions relating to Related Party receivables, refer Note 36.
Note 17c. Derivative Instruments ` in Crores
ParticularsAs at
31-Mar-2018As at
31-Mar-2017
Derivative instruments at FVTOCI
Cash Flow Hedges (Refer Note 42)
Foreign Exchange Forward Contracts 0.31 0.15
Total 0.31 0.15
Notes to Consolidated Financial Statements

186 Annual Report 2017-18
Tube Investments of India Limited(Formerly known as TI Financial Holdings Limited)
Note 17d. Other Financial Liabilities
(At Amortised Cost) ` in Crores
ParticularsAs at
31-Mar-2018As at
31-Mar-2017Current maturities of Long Term BorrowingsSecured, Listed and rated Non-Convertible Debentures (NCD)
8.79% Privately Placed NCD * 150.00 -8.90% Privately Placed NCD * 100.00 -9.81% Privately Placed NCD* - 75.009.99% Privately Placed NCD* - 49.99
Payable to TIFHL (Demerged Company) - 55.00Interest Accrued but Not Due 13.69 17.38Unpaid Dividends# 0.99 0.39Advances and Deposits from Customers / Others 8.65 9.27Dues to Directors 1.35 -Other liabilities
- Recoveries from Employees 3.54 3.24 - Capital Creditors 18.00 15.08 - Others 0.58 2.27
Total 296.80 227.62
* Refer Note 15a for security and repayment terms
# Amount to be credited to Investor Education and Protection Fund towards Unpaid Dividends `0.05 Cr. (Previous Year - `0.06 Cr.)
Note 18. Short Term Provisions ` in Crores
ParticularsAs at
31-Mar-2018As at
31-Mar-2017Provision for Compensated Absences (Refer Note a below) 19.01 16.76Provision for Warranties (Refer Note b below) 1.67 1.82Provision for Contingency / Others (Refer Note c below) 38.57 31.24Others 12.17 -Total 71.42 49.82
(a) Provision for Compensated absences
This refers to the amount provided for accumulated Earned Leave and Sick Leave, which can be encashed at the time of resignation / retirement of employee. The assumptions used to compute the provision are provided in Note 34.
(b) Provision for Warranties ` in Crores
ParticularsAs at
31-Mar-2018As at
31-Mar-2017At the Beginning of the Year 1.82 -Adjustment pursuant to the Scheme of Arrangement (Refer Note 1.2) - 1.84Created during the Year 1.20 1.43Utilized during the Year (1.35) (1.45)At the End of the Year 1.67 1.82
Notes to Consolidated Financial Statements

Annual Report 2017-18 187
Corporate Overview Management Reports Financial Statements
A provision is recognised for expected warranty claims on products sold during the last one year (2 years in respect of certain components), based on past experience of the level of returns. It is expected that most of these costs will be incurred within one year after the reporting date. Assumptions used to calculate the provision for warranties were based on current sales levels and current information available about returns based on the applicable warranty period for all products sold.
(c) Provision for Contingencies / Others ` in Crores
ParticularsAs at
31-Mar-2018As at
31-Mar-2017At the Beginning of the Year 31.24 -Adjustment pursuant to the Scheme of Arrangement (Refer Note 1.2) - 23.02Created during the Year 7.33 8.22At the End of the Year 38.57 31.24
The above Provision represents expected future outflows relating to various tax related matters, timing of which cannot be ascertained. The assumptions used to calculate the provisions are based on past experience of similar matters and professional consultations.
Note 19. Other Current Liabilities ` in Crores
ParticularsAs at
31-Mar-2018As at
31-Mar-2017Statutory Liabilities 37.35 36.37Advances from Customers 22.54 16.77Total 59.89 53.14
Note 20a. Financial Assets ` in Crores
ParticularsAs at
31-Mar-2018As at
31-Mar-2017Financial Assets - Non CurrentAt Fair ValueInvestments at FVTOCI 23.29 24.36At Amortised CostOther Financial Assets 22.30 22.16Total Non Current Financial Assets (A) 45.59 46.52
Financial Assets - CurrentAt Fair ValueInvestments at FVTPL 101.40 159.68At Amortised Cost(a) Loans 1.64 1.58(b) Trade receivables 697.01 614.99(c) Cash and Cash Equivalents 32.46 23.94(d) Other financial assets 78.85 81.39Total Current Financial Assets (B) 911.36 881.58Total Financial Assets (A + B) 956.95 928.10
Notes to Consolidated Financial Statements

188 Annual Report 2017-18
Tube Investments of India Limited(Formerly known as TI Financial Holdings Limited)
Note 20b. Financial Liabilities ` in Crores
ParticularsAs at
31-Mar-2018As at
31-Mar-2017
Financial Liabilities - Non Current
At Amortised Cost
Long Term Borrowings 228.56 378.26
At Fair Value through Profit and Loss
Other Long Term Liabilities 0.88 0.66
Total Non Current Financial Liabilities (A) 229.44 378.92
Financial Liabilities - Current
At Fair Value
Derivative Instruments 0.31 0.15
At Amortised Cost
(a) Short Term Borrowings 306.41 347.31
(b) Trade Payables 950.55 775.38
(c) Other Financial Liabilities 296.80 227.62
Total Current Financial Liabilities (B) 1,554.07 1,350.46
Total Financial Liabilities (A + B) 1,783.51 1,729.38
Note 20c. Government Grants ` in Crores
ParticularsAs at
31-Mar-2018As at
31-Mar-2017
Opening balance at the beginning of the period 1.38 -
Received during the Year 4.41 6.65
Released to the Statement of Profit and Loss (4.71) (5.27)
Closing balance at the end of the period 1.08 1.38
Current 1.08 1.38
Non Current - -
1.08 1.38
Government grants are Interest Subvention given by RBI on Packing Credit Rupee Export Loan towards Exports of Certain Goods.
Note 20d. Proposed Dividend ` in Crores
ParticularsAs at
31-Mar-2018As at
31-Mar-2017
Proposed Dividends on Equity Shares:
Dividend for FY 2017-18 - `0.50 per share (Dividend for FY 2016-17 - `2 per share) 9.38 37.49
Dividend Distribution Tax (DDT) on Proposed Dividend 1.93 7.63
11.31 45.12
Proposed dividend on Equity Shares are subject to approval at the annual general meeting and are not recognised as a liability (including DDT thereon) as at year end.
Notes to Consolidated Financial Statements

Annual Report 2017-18 189
Corporate Overview Management Reports Financial Statements
Note 21. Revenue from Operations ` in Crores
ParticularsYear Ended31-Mar-2018
Year Ended31-Mar-2017
Sale of Products
Finished Goods 4,563.97 4,386.33
Traded Goods 276.32 218.31
Sale of Products (A) 4,840.29 4,604.64
Other Operating Revenue
Scrap Sales (Gross) 238.56 189.55
Service Income 4.53 4.07
Conversion Income 0.08 0.27
Export Benefits (Duty Drawback and Export Incentive) 27.21 12.31
Others 5.61 9.36
Other Operating Revenue (B) 275.99 215.56
Total (A+B) 5,116.28 4,820.20
Sale of Products includes Excise Duty collected from customers of `79.88 (Previous Year - `302.12 Cr.). Sale of Products net of Excise Duty is `4,760.41 Cr. (Previous Year - `4,302.52 Cr.)
Sale of Scrap includes Excise Duty collected from customers of `8.93 Cr. (Previous Year - `25.07 Cr.). Sale of Scrap net of Excise Duty is `229.63 Cr. (Previous Year - `164.48 Cr.)
Revenue from operations for periods up to 30th June 2017 includes Excise Duty. From 1st July 2017 onwards the Excise Duty and most indirect taxes in India have been subsumed by Goods and Service Tax (GST). The Group collects GST on behalf of the Government. Hence, GST is not included in Revenue from operations. In view of the aforesaid change in indirect taxes, Revenue from operations for the year ended 31st March 2018 and 31st March 2017 are not comparable.
Note 22. Other Income ` in Crores
ParticularsYear Ended31-Mar-2018
Year Ended31-Mar-2017
Dividend Income from Investments at FVTOCI 1.35 0.52
Dividend income from Investments at FVTPL 3.82 3.03
Rental Income 0.99 1.00
Royalty Income 0.23 0.24
Gain on Exchange Fluctuation (Net) 6.28 3.85
Profit on Property, Plant and Equipment sold / discarded (Net) 4.61 4.69
Profit on sale of Investments at FVTPL 2.17 12.61
Fair Value Gain on Financial Instruments at FVTPL 0.67 1.02
Liabilities no longer payable written back 1.47 0.32
Claims recovered 6.24 8.57
Bad debts recovery - 0.15
Interest Income from Financial Assets
Fixed Deposits with Banks 5.47 7.04
Others 1.32 3.55
Provision no longer required written back - 0.90
Others - 0.92
Total 34.62 48.41
Notes to Consolidated Financial Statements

190 Annual Report 2017-18
Tube Investments of India Limited(Formerly known as TI Financial Holdings Limited)
Note 23 (a). Cost of Material Consumed ` in Crores
ParticularsYear Ended31-Mar-2018
Year Ended31-Mar-2017
Opening Raw Material 246.26 -
Adjustment pursuant to Scheme of Arrangement (Refer Note 1.2) - 234.40
Addition on acquisition of Subsidiaries 3.05 -
Purchases 2,832.12 2,574.92
Closing Raw Material (274.64) (246.26)
Cost of Raw Material and Components Consumed 2,806.79 2,563.06
Note 23 (b). Changes in Inventories of Work-in-Progress, Finished Goods and Stock - in - Trade ` in Crores
ParticularsYear Ended31-Mar-2018
Year Ended31-Mar-2017
Closing Stock
Work-in-Progress 191.34 151.75
Finished Goods 217.75 257.45
Stock-in-Trade 70.10 68.31
479.19 477.51
Opening Stock
Work-in-Progress 151.75 -
Finished Goods 257.45 -
Stock-in-Trade 68.31 -
477.51 -
Adjustment pursuant to Scheme of Arrangement (Refer Note 1.2)
Work-in-Progress - 134.77
Finished Goods - 176.01
Stock-in-Trade - 51.29
- 362.07
Addition on acquisition of Subsidiaries
Work-in-Progress 0.33 -
Finished Goods 2.24 -
Stock-in-Trade - -
2.57 -
Changes in Inventories
Work-in-Progress (39.26) (16.98)
Finished Goods 41.94 (81.44)
Stock-in-Trade (1.79) (17.02)
Total 0.89 (115.44)
Notes to Consolidated Financial Statements

Annual Report 2017-18 191
Corporate Overview Management Reports Financial Statements
Note 24. Employee Benefits Expense ` in Crores
ParticularsYear Ended31-Mar-2018
Year Ended31-Mar-2017
Salaries, Wages and Bonus (Refer Note 33) 462.32 418.58
Gratuity Expenses (Refer Note 34) 3.38 4.50
Contribution to Provident and Other Funds 38.14 38.87
Staff Welfare Expenses 58.84 51.03
Total 562.68 512.98
Note 25. Depreciation and Amortization Expense ` in Crores
ParticularsYear Ended31-Mar-2018
Year Ended31-Mar-2017
Depreciation of Property, Plant and Equipment (Refer Note 6a) 153.20 148.48
Depreciation of Intangible Assets (Refer Note 6b) 0.17 0.27
Depreciation on Investment Properties (Refer Note 7) 0.17 0.15
Total 153.54 148.90
Note 26. Finance Costs ` in Crores
ParticularsYear Ended31-Mar-2018
Year Ended31-Mar-2017
Interest Expense on Borrowings 57.65 73.09
Exchange Differences on Foreign Currency Loans 0.77 0.78
Other Borrowing Costs 0.07 0.12
Total 58.49 73.99
Note - The Interest Expense on Borrowings includes the interest subvention received, amounting to `4.71 Cr.
(Previous Year - `5.27 Cr.) on Packing Credit loans
Note 27a. Other Expenses ` in Crores
ParticularsYear Ended31-Mar-2018
Year Ended31-Mar-2017
Consumption of Stores and Spares 221.06 210.79
Conversion Charges 121.58 100.56
Power and Fuel 176.39 157.51
Rent (Net of recoveries) 22.82 24.19
Repairs and Maintenance - Building 1.65 2.65
Repairs and Maintenance - Machinery 88.19 94.91
Insurance 5.91 4.68
Rates and Taxes 6.41 25.16
Travelling and Conveyance 30.27 30.87
Printing, Stationery and Communication 7.51 8.01
Notes to Consolidated Financial Statements

192 Annual Report 2017-18
Tube Investments of India Limited(Formerly known as TI Financial Holdings Limited)
ParticularsYear Ended31-Mar-2018
Year Ended31-Mar-2017
Freight, Delivery and Shipping Charges 214.89 149.89
Discounts / Incentives on Sales 12.17 13.59
Advertisement and Publicity 39.51 30.68
Provision for Doubtful Trade Receivables (Net) 1.60 0.71
Trade Receivables written off 0.88 -
Loss on Tangible Assets Sold / Discarded (Net) 3.26 -
Auditor's Remuneration 1.96 1.73
Commission to Non Whole Time Directors (Refer Note a below) 1.70 1.62
Directors' Sitting Fees 0.17 -
Bank Charges 3.25 3.06
Information Technology Expenses 10.81 10.84
Donations to Charitable and Other Institutions 0.73 0.39
Expenditure on Corporate Social Responsibility 2.15 0.87
Other Expenses 84.15 69.74
1,059.02 942.45
Note a: Commission to Non Whole Time Directors
Pursuant to the Scheme of Arrangement (Refer Note 1.2), in the Previous Year the Commission and Sitting Fees aggregating to `1.62 Cr. has been transferred from the Demerged Company
Note 27b. Exceptional Items ` in Crores
ParticularsYear Ended31-Mar-2018
Year Ended31-Mar-2017
Provision for Impairment of Investment in Joint Ventures 3.26 -
3.26 -
During the current year, considering the market factors, changes in future project potential and accumulated losses, the Group has recognised an impairment loss of `3.26 Crores in the Statement of Profit and Loss (Previous Year - Nil), in respect of investment in Joint Ventures.
Note 28. Income Tax Expense
The major components of Income Tax Expense for the years ended 31st March 2018 and 31st March 2017 are:
Statement of Profit and Loss ` in Crores
ParticularsYear Ended31-Mar-2018
Year Ended31-Mar-2017
Current Tax:
Current Income Tax charge 82.84 64.82
Adjustments in respect of Current Income Tax of Prior Years (10.56) (16.94)
Deferred Tax:
Relating to the origination and reversal of Temporary Differences (13.96) (1.13)
Income Tax Expense reported in the Statement of Profit and Loss 58.32 46.75
Notes to Consolidated Financial Statements

Annual Report 2017-18 193
Corporate Overview Management Reports Financial Statements
Other Comprehensive Income (OCI) section ` in Crores
ParticularsYear Ended31-Mar-2018
Year Ended31-Mar-2017
(Loss) / Gain on FVTOCI Equity Investments (0.43) 0.01
Re-measurement Gain / (Loss) on Defined Benefit Obligations 0.57 (1.47)
Foreign Currency Translation Reserve 2.29 -
Movement on cash flow hedges 0.07 0.18
Income Tax charged to OCI 2.50 (1.28)
Reconciliation of tax expense and the accounting profit multiplied by Corporate income tax rate applicable for 31st March 2018 and 31st March 2017
The tax on the Group’s profit before tax differs from the theoretical amount that would arise on using the standard rate of corporation tax ` in Crores
ParticularsYear Ended31-Mar-2018
Year Ended31-Mar-2017
Accounting Profit Before Tax 213.83 221.10
Profit before income tax multiplied by standard rate of corporate tax in India of 34.608% (Previous year: 34.608%)
74.00 76.52
Effects of:
Benefit u/s 35(2AB) of Income Tax Act, 1961 (7.57) (6.30)
Income - Exempt from tax (5.26) (1.01)
Benefit u/s 80IC of Income Tax Act, 1961 (1.97) (1.73)
Benefit u/s 80IA of Income Tax Act, 1961 (1.43) (1.63)
Capital Allowance u/s 32AC of Income Tax Act, 1961 - (5.78)
Other disallowances 0.37 3.90
Dividend Distribution Tax on proposed dividendof subsidiary
(0.87) 0.87
Tax on fair valuation of assets on acqusition of Subsidiaries (1.23) -
Reversal of provision with respect to prior years (10.56) (18.51)
Others 12.84 0.42
Net effective Income Tax 58.32 46.75
Note 29. Components of Other Comprehensive Income (OCI)
The disaggregation of changes to OCI by each type of reserve in Equity is shown below:
During the year ended 31st March 2018 ` in Crores
Cash flow hedge reserve
FVTOCI reserve
Retained Earnings
Foreign Currency Transalation
Reserve
Total
Currency forward contracts 0.12 - - - 0.12
Loss on FVTOCI financial assets - (0.26) - - (0.26)
Re-measurement gains on defined benefit plans - - 1.06 - 1.06
Exchange Difference on Translation of Foreign Subsidiaries
- - - 4.25 4.25
0.12 (0.26) 1.06 4.25 5.17
Notes to Consolidated Financial Statements

194 Annual Report 2017-18
Tube Investments of India Limited(Formerly known as TI Financial Holdings Limited)
During the year ended 31st March 2017 ` in Crores
Cash flow hedge
reserve
FVTOCI reserve
Retained Earnings
Foreign Currency Transalation
ReserveTotal
Currency forward contracts 0.33 - - - 0.33
Gain on FVTOCI financial assets - 0.70 - - 0.70
Re-measurement loss on defined benefit plans - - (2.78) - (2.78)
Exchange Difference on Translation of Foreign Subsidiary
- - - (0.76) (0.76)
0.33 0.70 (2.78) (0.76) (2.51)
Note 30.Earnings Per Share
The following reflects the profit and share data used in the basic and diluted EPS computations:
ParticularsYear Ended31-Mar-2018
Year Ended31-Mar-2017
Profit After Tax - attributable to Owners of the Company (` in crores) 147.39 167.62
Weighted average number of Equity Shares
- Basic 18,74,91,054 18,74,47,871
- Diluted 18,76,29,895 18,74,47,871
Earnings Per Share of `1 each
- Basic 7.86 8.94
- Diluted 7.86 8.94
Note 31.Significant Accounting Judgements, Estimates and Assumptions
The preparation of the Company’s Consolidated Financial Statements requires management to make judgements, estimates and assumptions that affect the reported amounts of revenues, expenses, assets and liabilities, and the accompanying disclosures, and the disclosure of contingent liabilities. Uncertainty about these assumptions and estimates could result in outcomes that require a material adjustment to the carrying amount of assets or liabilities affected in future periods.
a. Judgements
In the process of applying the Group’s accounting policies, management has not made judgements, which have significant effect on the amounts recognised in the Consolidated Financial Statements.
b. Estimates and Assumptions
The key assumptions concerning the future and other key sources of estimation uncertainty at the reporting date, that have a significant risk of causing a material adjustment to the carrying amounts of assets and liabilities within the next financial year, are described below. The Group based its assumptions and estimates on parameters available when the Financial Statements were prepared. Existing circumstances and assumptions about future developments, however, may change due to market changes or circumstances arising that are beyond the control of the group. Such changes are reflected in the assumptions when they occur.
i. Impairment of Non-Financial Assets
Impairment exists when the carrying value of an asset or cash generating unit exceeds its recoverable amount, which is the higher of its fair value less costs of disposal and its value in use. The fair value less costs of disposal calculation is based on available data from binding sales transactions, conducted at arm’s length, for similar assets or observable market prices less incremental costs for disposing of the asset. The value in use calculation is based on a DCF model.
Notes to Consolidated Financial Statements

Annual Report 2017-18 195
Corporate Overview Management Reports Financial Statements
ii. Taxes
Deferred Tax Assets are recognised for unused tax losses to the extent that it is probable that taxable profit will be available against which the losses can be utilised. Significant management judgement is required to determine the amount of Deferred Tax Assets that can be recognised, based upon the likely timing and the level of future taxable profits together with future tax planning strategies.
iii. Employee Benefits
The cost of the defined benefit gratuity plan and other post-employment leave encashment benefit and the present value of the gratuity obligation are determined using actuarial valuations. An actuarial valuation involves making various assumptions that may differ from actual developments in the future. These include the determination of the discount rate, future salary increases and mortality rates. Due to the complexities involved in the valuation and its long-term nature, a Defined Benefit Obligation is highly sensitive to changes in these assumptions. All assumptions are reviewed at each reporting date. Further details about Defined Benefit Obligations are given in Note 34.
iv. Fair Value Measurement of Financial Instruments
When the fair values of financial assets and financial liabilities recorded in the Balance Sheet cannot be measured based on quoted prices in active markets, their fair value is measured using valuation techniques including the DCF model. The inputs to these models are taken from observable markets where possible, but where this is not feasible, a degree of judgement is required in establishing fair values. Judgements include considerations of inputs such as liquidity risk, credit risk and volatility. Changes in assumptions about these factors could affect the reported fair value of financial instruments. See Note 42 for further disclosures.
Note 32.Standards issued but not yet effective
The amendments to standards that are issued, but not yet effective, up to the date of issuance of the Group’s Financial Statements are disclosed below. The Group intends to adopt these standards, if applicable, when they become effective.
The Ministry of Corporate Affairs (MCA) has the Companies (Indian Accounting Standards) Amendment Rules, 2017 and Companies (Indian Accounting Standards) Amendment Rules, 2018 amending the following standard:
Ind AS 115 Revenue from Contracts with Customers
Ind AS 115 was notified on 28th March 2018 and establishes a five-step model to account for revenue arising from contracts with customers. Under Ind AS 115, revenue is recognised at an amount that reflects the consideration to which an entity expects to be entitled in exchange for transferring goods or services to a customer.
The new revenue standard will supersede all current revenue recognition requirements under Ind AS. This new standard requires revenue to be recognized when promised goods or services are transferred to customers in amounts that reflect the consideration to which the Group expects to be entitled in exchange for those goods or services. Adoption of the new rules could affect the timing of revenue recognition for certain transactions of the Group. Ind AS 115 is effective for the Group in the first quarter of fiscal 2019 using either one of two methods: (i) retrospectively to each prior reporting period presented in accordance with Ind AS 8 Accounting Policies, Changes in Accounting Estimates and Errors, with the option to elect certain practical expedients as defined within Ind AS 115 (the full retrospective method); or (ii) retrospectively with the cumulative effect of initially applying Ind AS 115 recognized at the date of initial application (1st April 2018) and providing certain additional disclosures as defined in Ind AS 115 (the modified retrospective method).
The Group continues to evaluate the available transition methods and its contractual arrangements. The ultimate impact on revenue resulting from the application of Ind AS 115 will be subject to assessments that are dependent on many variables, including, but not limited to, the terms of the contractual arrangements and the mix of business. The Group's considerations also include, but are not limited to, the comparability of its financial statements and the comparability within its industry from application of the new standard to its contractual arrangements. The Group has established an implementation team to implement Ind AS 115 related to the recognition of revenue from contracts with customers and it continues to evaluate
Notes to Consolidated Financial Statements

196 Annual Report 2017-18
Tube Investments of India Limited(Formerly known as TI Financial Holdings Limited)
the changes to accounting system and processes, and additional disclosure requirements that may be necessary. A reliable estimate of the quantitative impact of Ind AS 115 on the financial statements will only be possible once the implementation project has been completed.
Amendments to Ind AS 112 Disclosure of Interests in Other Entities: Clarification of the scope of disclosure requirements in Ind AS 112
The amendments clarify that the disclosure requirements in Ind AS 112, other than those in paragraphs B10-B16, apply to an entity’s interest in a subsidiary, a joint venture or an associate (or a portion of its interest in a joint venture or an associate) that is classified (or included in a disposal group that is classified) as held for sale.
Amendments to Ind AS 12 Recognition of Deferred Tax Assets for Unrealised Losses
The amendments clarify that an entity needs to consider whether tax law restricts the sources of taxable profits against which it may make deductions on the reversal of that deductible temporary difference. Furthermore, the amendments provide guidance on how an entity should determine future taxable profits and explain the circumstances in which taxable profit may include the recovery of some assets for more than their carrying amount.
Entities are required to apply the amendments retrospectively. However, on initial application of the amendments, the change in the opening Equity of the earliest comparative period may be recognised in opening retained earnings (or in another component of Equity, as appropriate), without allocating the change between opening retained earnings and other components of Equity. Entities applying this relief must disclose that fact.
These amendments are effective for annual periods beginning on or after 1st April 2018. These amendments are not expected to have any impact on the Group as the Group has no deductible temporary differences or assets that are in the scope of the amendments.
Transfers of Investment Property - Amendments to Ind AS 40
The amendments clarify when an entity should transfer property, including property under construction or development into, or out of investment property. The amendments state that a change in use occurs when the property meets, or ceases to meet, the definition of investment property and there is evidence of the change in use. A mere change in management’s intentions for the use of a property does not provide evidence of a change in use.
Entities should apply the amendments prospectively to changes in use that occur on or after the beginning of the annual reporting period in which the entity first applies the amendments. An entity should reassess the classification of property held at that date and, if applicable, reclassify property to reflect the conditions that exist at that date. Retrospective application in accordance with Ind AS 8 is only permitted if it is possible without the use of hindsight.
The amendments are effective for annual periods beginning on or after 1st April 2018. The Group will apply amendments when they become effective. However, since Group’s current practice is in line with the clarifications issued, the Group does not expect any effect on its consolidated financial statements.
Ind AS 28 Investments in Associates and Joint Ventures - Clarification that measuring investees at Fair Value through Profit or Loss is an investment-by-investment choice
The amendments clarify that:
• An entity that is a venture capital organisation, or other qualifying entity, may elect, at initial recognition on an investment-by-investment basis, to measure its investments in associates and joint ventures at fair value through profit or loss.
• If an entity, that is not itself an investment entity, has an interest in an associate or joint venture that is an investment entity, the entity may, when applying the equity method, elect to retain the fair value measurement applied by that investment entity associate or joint venture to the investment entity associate’s or joint venture’s interests in subsidiaries. This election is made separately for each investment entity associate or joint venture, at the later of the date on which: (a) the investment entity associate or joint venture is initially recognised; (b) the associate or joint venture becomes an investment entity; and (c) the investment entity associate or joint venture first becomes a parent.
Notes to Consolidated Financial Statements

Annual Report 2017-18 197
Corporate Overview Management Reports Financial Statements
The amendments should be applied retrospectively and are effective from 1st April 2018. These amendments are not applicable to the Group.
Appendix B to Ind AS 21 Foreign Currency Transactions and Advance Consideration
The Appendix clarifies that, in determining the date of transaction for the purpose of determining the exchange rate to use on initial recognition of the related asset, expense or income (or part of it) is the date on which an entity initially recognizes a non-monetary asset or non-monetary liability relating to advance consideration. If there are multiple payments or receipts in advance, then the entity must determine the transaction date for each payment or receipt of advance consideration.
Entities may apply the Appendix requirements on a fully retrospective basis. Alternatively, an entity may apply these requirements prospectively to all assets, expenses and income in its scope that are initially recognised on or after:
• The beginning of the reporting period in which the entity first applies the Appendix, or
• The beginning of a prior reporting period presented as comparative information in the financial statements of the reporting period in which the entity first applies the Appendix.
The Appendix is effective for annual periods beginning on or after 1st April 2018. A reliable estimate of the quantitative impact of Ind AS 21 on the financial statements will only be possible once the implementation project has been completed.
The Group will adopt these amendments from their applicability date.
Note 33.Stock Options pursuant to Scheme of Arrangement (Refer Note 1.2)
Pursuant to the Scheme of Arrangement (Refer Note 1.2), during the year, 3,63,763 stock options were granted to eligible employees at the rate of one stock option of the Group for every stock option held and outstanding in the Demerged Company on the date of the Nomination and Remuneration Committee Resolution dated 21st November 2017.
Further, during the year, the Nomination and Remuneration Committee of the Board of Directors of the Company, at its meeting held on 12th February 2018, approved the grant of 10,86,480 Stock Options and 2,62,200 Stock Options to eligible employees of the Group.
In this regard, the Group has recognised expense amounting to `5.43 Cr. for employees services received during the year, shown under Salaries, Wages and Bonus (Refer Note 24).
The movement in Stock Options are given below:
Particulars Date of Grant
Options Outstanding
as at01-Apr-2017
During the Year 2017-18 Options Outstanding
as at31-Mar-2018
Options vested but not exercised as at
31-Mar-2018
Options Granted
Options Cancelled /
Lapsed
Options Exercised
and Allotted
Grant 1 21-Nov-17 - 51,516 - 4,672 46,844 46,844
Grant 2 21-Nov-17 - 34,241 - 34,241 - -
Grant 3 21-Nov-17 - 21,280 - 4,864 16,416 16,416
Grant 4 21-Nov-17 - 15,112 - - 15,112 15,112
Grant 5 21-Nov-17 - 9,344 - 2,000 7,344 7,344
Grant 6 21-Nov-17 - 2,32,270 9,660 - 2,22,610 2,22,610
Grant 7 12-Feb-18 - 10,86,480 - - 10,86,480 -
Grant 8 12-Feb-18 - 2,62,200 - - 2,62,200 -
Total - 17,12,443 9,660 45,777 16,57,006 3,08,326
Notes to Consolidated Financial Statements

198 Annual Report 2017-18
Tube Investments of India Limited(Formerly known as TI Financial Holdings Limited)
The details of Stock Options granted to certain employees are given below:
Particulars Date of Grant
Weighted Average Exercise Price (`)
Options Granted
Options Cancelled / Lapsed
Options Exercised
and Allotted
Options vested and
Outstanding at the End of the Year
Options unvested
and Outstanding at the End of
the Year
Vested Date
Weighted Average
Remaining Contractual
Life(In Years)
Grant 1 21-Nov-17 44.36 51,516 - 4,672 46,844 - 21-Nov-17 2.72
Grant 2 21-Nov-17 17.61 34,241 - 34,241 - - 21-Nov-17 -
Grant 3 21-Nov-17 43.42 21,280 - 4,864 16,416 - 21-Nov-17 1.96
Grant 4 21-Nov-17 43.42 15,112 - - 15,112 - 21-Nov-17 1.33
Grant 5 21-Nov-17 13.78 9,344 - 2,000 7,344 - 21-Nov-17 0.33
Grant 6 21-Nov-17 187.29 2,32,270 9,660 - 2,22,610 - 15-Mar-18 4.96
Grant 7 12-Feb-18 270.20 10,86,480 - - - 10,86,480 - 5.87
Grant 8 12-Feb-18 270.20 2,62,200 - - - 2,62,200 - 6.88
17,12,443 9,660 45,777 3,08,326 13,48,680
The following tables list the inputs to the Black Scholes model used for the plans for the year ended 31st March 2018:
Particulars Vesting Date
Risk-free Interest Rate
Expected Life Expected Volatility of Share Price
Dividend Yield
Price of the Underlying Share in the
market at the time of Option
grant
Fair Value of the Option
% (p.a) (Years) (%) (%) (`) (`)
Grant 1 21-Nov-17 8.23 4.64 43.70 1.86 44.36 21.30
Grant 2 21-Nov-17 8.23 2.18 33.90 1.86 17.61 6.51
Grant 3 21-Nov-17 8.22 3.93 42.84 1.86 43.42 21.93
Grant 4 21-Nov-17 8.23 2.88 39.83 1.86 43.42 20.71
Grant 5 21-Nov-17 6.58 2.04 28.69 1.86 13.78 5.18
Grant 6 21-Nov-17 6.75 3.50 31.49 0.25 187.29 60.27
Grant 7 12-Feb-18 7.33 4.63 38.19 0.00 270.20 117.98
Grant 8 12-Feb-18 7.41 5.21 38.19 0.00 270.20 125.66
Notes to Consolidated Financial Statements

Annual Report 2017-18 199
Corporate Overview Management Reports Financial Statements
Note 34.Employee Benefits Obligation
Defined Benefit Plan
a. Gratuity
Under the Gratuity plan operated by the Group, every employee who has completed atleast five years of service gets a Gratuity on departure at 15 days on last drawn salary for each completed year of service as per Payment of Gratuity Act, 1972. The scheme is funded with an Insurance Company in the form of qualifying insurance policy. The following table summarizes the components of net benefit expense recognised in the Statement of Profit and Loss and the funded status and amounts recognised in the Balance Sheet.
` in Crores
Particulars 31-Mar-2018 31-Mar-2017
A. Change in defined benefit obligation
1. Defined benefit obligation at beginning of period 55.29 -
Defined benefit obligation transferred pursuant to Scheme of Arrangement(Note 1.2)
- 45.76
2. Service cost
a. Current service cost 3.43 4.26
b. Past service cost - -
c. (Gain) / loss on settlements - 0.12
3. Interest expenses 4.01 3.57
4. Cash flows
Benefit payments from plan (3.75) (2.11)
5. Remeasurements
a. Effect of changes in financial assumptions (3.30) 2.88
b. Effect of experience adjustments 1.65 0.81
6 Defined benefit obligation at end of period 57.33 55.29
` in Crores
B. Change in fair value of plan assets 31-Mar-2018 31-Mar-2017
1. Fair value of plan assets at beginning of period 55.87 -
Fair value of plan assets transferred pursuant to Scheme of Arrangement (Note 1.2) - 46.77
2. Interest income 4.05 3.75
3. Cash flows
a. Total employer contributions 1.66 7.60
b. Benefit payments from plan assets (2.93) (2.11)
4. Remeasurements
a. Return on plan assets (excluding interest income) (0.02) (0.44)
b. Expected return on plan assets - 0.30
5. Fair value of plan assets at end of period 58.63 55.87
Notes to Consolidated Financial Statements

200 Annual Report 2017-18
Tube Investments of India Limited(Formerly known as TI Financial Holdings Limited)
` in Crores
C. Amounts recognized in the Balance Sheet 31-Mar-2018 31-Mar-2017
1. Defined benefit obligation 57.33 55.29
2. Fair value of plan assets (58.63) (55.87)
3. Funded status (1.30) (0.58)
4. Net defined benefit asset (1.30) (0.58)
` in Crores
D. Components of defined benefit cost 31-Mar-2018 31-Mar-2017
1. Service cost
a. Current service cost 3.43 4.26
b. (Gain) / Loss on settlements - 0.12
c. Total service cost 3.43 4.38
2. Net interest cost
a. Interest expense on DBO 4.01 3.57
b. Less - Interest income / expected return on plan assets 4.06 3.45
c. Total net interest cost (0.05) 0.12
3. Remeasurements (recognized in OCI)
a. Effect of changes in financial assumptions (3.30) 2.88
b. Effect of experience adjustments 1.65 0.93
c. Less - (Return) on plan assets (excluding interest income) (0.02) (0.44)
d. Total remeasurements included in OCI (1.63) 4.25
4. Total defined benefit cost recognized in P&L and OCI 1.75 8.75
` in Crores
E. Re-measurement 31-Mar-2018 31-Mar-2017
a. Actuarial Loss / (Gain) on DBO (1.65) 3.81
b. Less - Returns above Interest Income (0.02) (0.44)
Total Re-measurements (OCI) (1.63) 4.25
` in Crores
F. Employer Expense (P&L) 31-Mar-2018 31-Mar-2017
a. Current Service Cost 3.43 4.38
b. Interest Cost on net DBO (0.05) 0.12
c. Total P&L Expenses 3.38 4.50
` in Crores
G. Net defined benefit liability (asset) / reconciliation 31-Mar-2018 31-Mar-2017
1. Net defined benefit asset (0.58) (1.73)
2. Defined benefit cost included in P&L 3.38 4.50
3. Total remeasurements included in OCI (1.63) 4.25
4. Employer contributions (1.66) (7.60)
5. Net benefit paid from plan assets (0.81) -
6. Net defined benefit liability (asset) as of end of period (1.30) (0.58)
Notes to Consolidated Financial Statements

Annual Report 2017-18 201
Corporate Overview Management Reports Financial Statements
` in Crores
H. Reconciliation of OCI (Re-measurment) 31-Mar-2018 31-Mar-2017
1. Recognised in OCI during the period (1.63) 4.25
2. Recognised in OCI at the end of the period (1.63) 4.25
` in Crores
I. Sensitivity analysis - DBO end of Period 31-Mar-2018 31-Mar-2017
1. Discount rate +1% 48.98 51.13
2. Discount rate - 1% 57.90 59.91
3. Salary Increase Rate +1% 57.82 59.61
4. Salary Increase Rate -1% 48.97 51.32
5. Attrition Rate +1% 53.97 55.94
6. Attrition Rate -1% 52.28 54.48
J. Significant actuarial assumptions 31-Mar-2018 31-Mar-2017
1. Discount rate Current Year 7.5% - 8% 7% - 7.25%
2. Discount rate Previous Year 7% - 7.25% 8.00%
3. Salary increase rate Uniform 5.0% Uniform 5.0%
4. Attrition Rate3.0% [AGE 0-30]1.0% [AGE 31-40]2.0% [AGE 41-58]
3.0% [AGE 0-30]1.0% [AGE 31-40]2.0% [AGE 41-58]
5. Retirement Age 58 58
6. Pre-retirement mortality
Indian Assured Lives Mortality
(2006-08) Ultimate
Indian Assured Lives Mortality
(2006-08) Ultimate
7. Disability Nil Nil
` in Crores
K. Data 31-Mar-2018 31-Mar-2017
1. No. 3,902 4,030
2. Avg. Age (yrs.) 40 39
3. Avg. Past Service (yrs.) 14 12
4. Avg. Sal. Mly (`) 21,857 19,831
5. Future Service (yrs.) 18 19
6. Weighted average duration of DBO 14 15
` in Crores
L. Expected cash flows for following year 31-Mar-2018 31-Mar-2017
1. Expected employer contributions / Additional. Provision Next Year 2.38 4.68
2. Expected total benefit payments
Year 1 5.01 4.40
Year 2 to Year 5 21.31 15.66
Next 5 years 31.93 22.51
Notes to Consolidated Financial Statements

202 Annual Report 2017-18
Tube Investments of India Limited(Formerly known as TI Financial Holdings Limited)
` in Crores
M. Defined benefit obligation at end of period 31-Mar-2018 31-Mar-2017
Current Obligation 5.00 4.51
Non-Current Obligation 52.33 50.77
Total 57.33 55.29
SUMMARY ` in Crores
Assets / Liabilities 31-Mar-2018 31-Mar-2017
1. Defined benefit obligation at end of period 57.33 55.29
2. Fair value of plan assets at end of period 58.63 55.87
3. Net defined benefit asset (1.30) (0.58)
4. Defined benefit cost included in P&L 3.38 4.50
5. Total remeasurements included in OCI (1.63) 4.25
6. Total defined benefit cost recognized in P&L and OCI 1.75 8.75
Notes:
i. The entire Plan Assets are invested in insurer managed funds with Life Insurance Corporation of India (LIC).
ii. The expected / actual return on Plan Assets is as furnished by LIC.
iii. The estimate of future salary increase takes into account inflation, likely increments, promotions and other relevant factors.
b. Provident Fund
The Group’s Provident Fund is exempted under Section 17 of the Employees' Provident Fund Act, 1952. Conditions for the grant of exemption stipulate that the employer shall make good the deficiency, if any, in the interest rate declared by the Trust over the statutory limit. The Actuary has provided a valuation for Provident Fund liabilities on the basis of guidance issued by Actuarial Society of India and based on the assumptions provided below, the Group does not have additional obligation as at 31st March 2018 and 31st March 2017.
The details of fund and plan assets are given below: ` in Crores
Particulars 31-Mar-2018 31-Mar-2017
Fair value of plan assets at end of period 140.58 137.44
Defined Benefit Obligation at end of period 136.56 109.63
The principal assumptions used in determining the present value obligation of interest guarantee under the deterministic approach are as follows:
Assumption 31-Mar-2018 31-Mar-2017
Discount Rate 8.00% 7.25%
Weighted Average Duration of DBO in years 15 15
Expected Investment Return 7.25% 8.67%
Average Interest Rate expected to be declared 8.55% 8.62%
During the year, the Group contributed `6.95 Cr. (Previous year - `5.88 Cr.) under Defined Benefit Plans and the same has been recognised in the Statement of Profit and Loss under Employee Benefits expense.
Notes to Consolidated Financial Statements

Annual Report 2017-18 203
Corporate Overview Management Reports Financial Statements
c. Long Term Compensated Absences
The assumption used for computing the long term accumulated compensated absences on actuarial basis are as follows:
Assumptions 31-Mar-2018 31-Mar-2017
Discount Rate 7.25% - 8% 7% - 7.25%
Future Salary Increase (%) 5% 5%
Attrition Rate 1% to 3% 1% to 3%
d. Contributions to Defined Contribution Plans
During the year, the Group recognised `6.68 Cr. (Previous Year - `6.88 Cr.) to Provident Fund under Defined Contribution Plan, `6.34 Cr. (Previous Year - `5.22 Cr.) for Contributions to Superannuation Fund and `1.66 Cr. (Previous Year - `1.20 Cr.) for Contributions to Employee State Insurance Scheme in the Statement of Profit and Loss.
Note 35.Commitment and Contingencies ` in Crores
ParticularsAs at
31-Mar-2018As at
31-Mar-2017
I. Contingent Liabilities
a) Disputed Income-Tax demands under appeal / remand pending before various appellate / assessing authorities against the Demerged Company (Refer Note d)
39.40 39.36
b) Disputed Service Tax, Excise and Customs duty demand pertaining to financial years 1999-2000 to 2012-13 pending before the Appellate Tribunal. The Management of the Group is of the opinion that the above demands are arbitrary and are not sustainable
0.11 0.11
c) Claims against the Group not acknowledged as debts 1.57 1.44
d) Disputed demand for additional sales tax on CST 0.02 0.02
e) Disputed Excise Duty on interunit transfer of machinery 1.52 1.52
f) Dispute pending in court on a legal case 0.02 -
II. Commitments
a) Estimated amount of contracts remaining to be executed on capital expenditure and not provided for
64.63 78.08
b) Export obligation under EPCG / Advance License Scheme to be fulfilled. The Group is confident of meeting its obligations under the Schemes within the Stipulated Period.
7.95 7.16
Notes:
a. Draft Assessment Orders received from Income Tax Authorities and Show Cause Notices received from various other Government Authorities, pending adjudication, have not been considered as Contingent Liabilities.
b. The uncertainties and possible reimbursement in respect of the above mentioned contingent liabilities are dependent on the outcome of various legal proceedings and therefore, cannot be predicted accurately.
c. The Group considers the Cash flow in each of the cases to be uncertain and hence considered as Contingent liabilities.
d. As per the Scheme of Arrangement, all taxes, duties, cess payable by the Demerged Company relating to the Manufacturing Business Undertaking including all advance tax payments, tax deducted at source or any refunds / credit / claims relating thereto shall, for all purposes, be treated as advance tax payments, Tax Deducted at Source or refunds / credit / claims, as the case may be, of the Company, provided however that any direct and indirect taxes that cannot specifically be earmarked as the liability or refunds / credit / claims relating to the Manufacturing Business Undertaking shall continue to be borne by the Demerged Company. The Scheme further provides that if the Demerged Company or their successor(s) receive any refunds / credit / claims or incurs any liability in respect of the Manufacturing Business Undertaking, the same shall be on behalf of and as a trustee of the Company and the same shall be refunded to / paid by the Company.
Notes to Consolidated Financial Statements
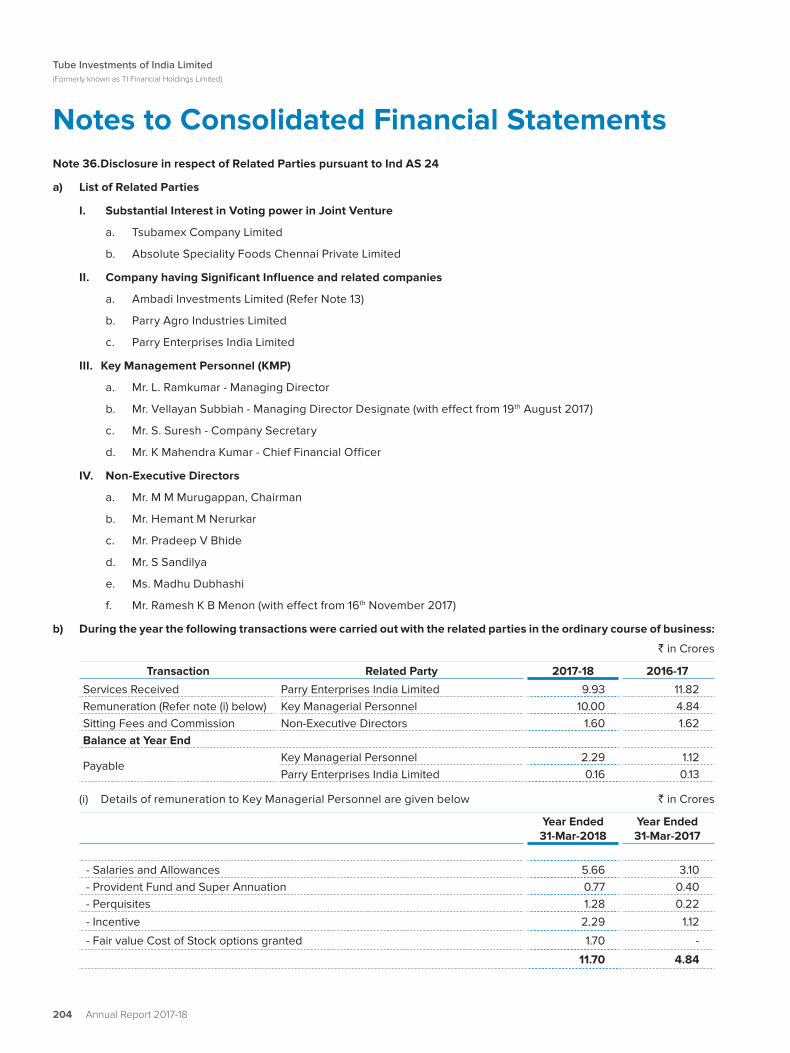
204 Annual Report 2017-18
Tube Investments of India Limited(Formerly known as TI Financial Holdings Limited)
Note 36.Disclosure in respect of Related Parties pursuant to Ind AS 24
a) List of Related Parties
I. Substantial Interest in Voting power in Joint Venture
a. Tsubamex Company Limited
b. Absolute Speciality Foods Chennai Private Limited
II. Company having Significant Influence and related companies
a. Ambadi Investments Limited (Refer Note 13)
b. Parry Agro Industries Limited
c. Parry Enterprises India Limited
III. Key Management Personnel (KMP)
a. Mr. L. Ramkumar - Managing Director
b. Mr. Vellayan Subbiah - Managing Director Designate (with effect from 19th August 2017)
c. Mr. S. Suresh - Company Secretary
d. Mr. K Mahendra Kumar - Chief Financial Officer
IV. Non-Executive Directors
a. Mr. M M Murugappan, Chairman
b. Mr. Hemant M Nerurkar
c. Mr. Pradeep V Bhide
d. Mr. S Sandilya
e. Ms. Madhu Dubhashi
f. Mr. Ramesh K B Menon (with effect from 16th November 2017)
b) During the year the following transactions were carried out with the related parties in the ordinary course of business:
` in Crores
Transaction Related Party 2017-18 2016-17
Services Received Parry Enterprises India Limited 9.93 11.82Remuneration (Refer note (i) below) Key Managerial Personnel 10.00 4.84Sitting Fees and Commission Non-Executive Directors 1.60 1.62Balance at Year End
PayableKey Managerial Personnel 2.29 1.12Parry Enterprises India Limited 0.16 0.13
(i) Details of remuneration to Key Managerial Personnel are given below ` in Crores
Year Ended31-Mar-2018
Year Ended31-Mar-2017
- Salaries and Allowances 5.66 3.10 - Provident Fund and Super Annuation 0.77 0.40 - Perquisites 1.28 0.22
- Incentive 2.29 1.12
- Fair value Cost of Stock options granted 1.70 -
11.70 4.84
Notes to Consolidated Financial Statements
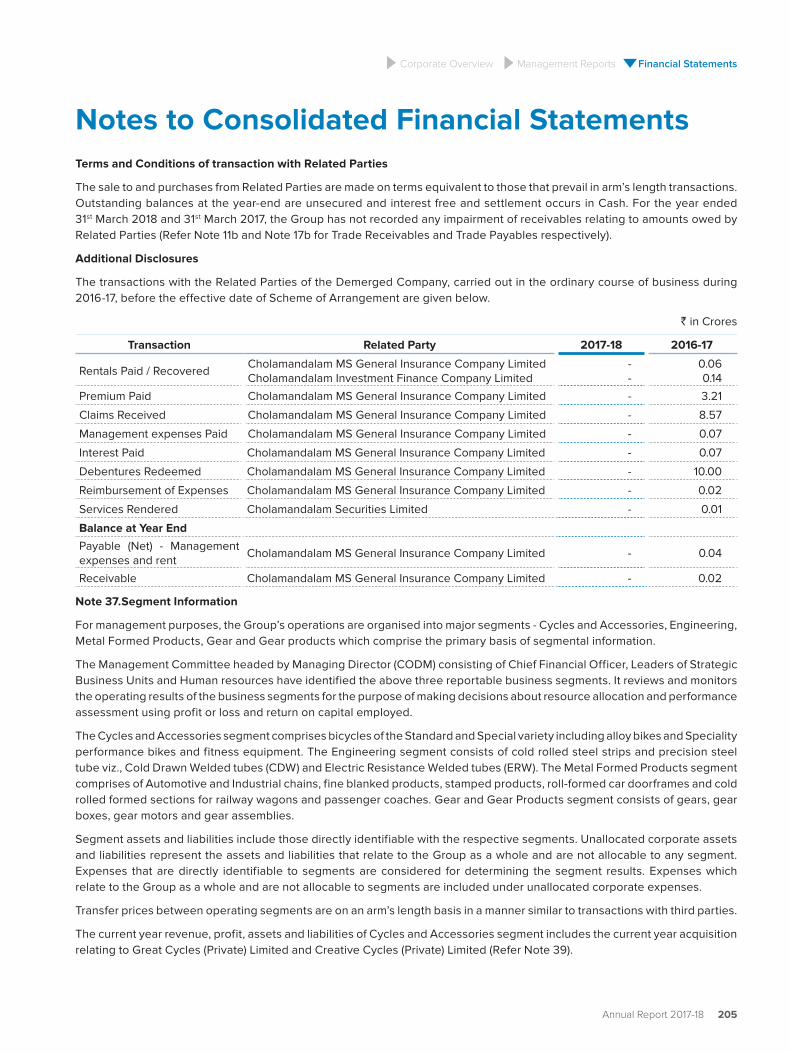
Annual Report 2017-18 205
Corporate Overview Management Reports Financial Statements
Terms and Conditions of transaction with Related Parties
The sale to and purchases from Related Parties are made on terms equivalent to those that prevail in arm’s length transactions. Outstanding balances at the year-end are unsecured and interest free and settlement occurs in Cash. For the year ended 31st March 2018 and 31st March 2017, the Group has not recorded any impairment of receivables relating to amounts owed by Related Parties (Refer Note 11b and Note 17b for Trade Receivables and Trade Payables respectively).
Additional Disclosures
The transactions with the Related Parties of the Demerged Company, carried out in the ordinary course of business during 2016-17, before the effective date of Scheme of Arrangement are given below.
` in Crores
Transaction Related Party 2017-18 2016-17
Rentals Paid / RecoveredCholamandalam MS General Insurance Company LimitedCholamandalam Investment Finance Company Limited
--
0.060.14
Premium Paid Cholamandalam MS General Insurance Company Limited - 3.21
Claims Received Cholamandalam MS General Insurance Company Limited - 8.57
Management expenses Paid Cholamandalam MS General Insurance Company Limited - 0.07
Interest Paid Cholamandalam MS General Insurance Company Limited - 0.07
Debentures Redeemed Cholamandalam MS General Insurance Company Limited - 10.00
Reimbursement of Expenses Cholamandalam MS General Insurance Company Limited - 0.02
Services Rendered Cholamandalam Securities Limited - 0.01
Balance at Year End
Payable (Net) - Management expenses and rent
Cholamandalam MS General Insurance Company Limited - 0.04
Receivable Cholamandalam MS General Insurance Company Limited - 0.02
Note 37.Segment Information
For management purposes, the Group’s operations are organised into major segments - Cycles and Accessories, Engineering, Metal Formed Products, Gear and Gear products which comprise the primary basis of segmental information.
The Management Committee headed by Managing Director (CODM) consisting of Chief Financial Officer, Leaders of Strategic Business Units and Human resources have identified the above three reportable business segments. It reviews and monitors the operating results of the business segments for the purpose of making decisions about resource allocation and performance assessment using profit or loss and return on capital employed.
The Cycles and Accessories segment comprises bicycles of the Standard and Special variety including alloy bikes and Speciality performance bikes and fitness equipment. The Engineering segment consists of cold rolled steel strips and precision steel tube viz., Cold Drawn Welded tubes (CDW) and Electric Resistance Welded tubes (ERW). The Metal Formed Products segment comprises of Automotive and Industrial chains, fine blanked products, stamped products, roll-formed car doorframes and cold rolled formed sections for railway wagons and passenger coaches. Gear and Gear Products segment consists of gears, gear boxes, gear motors and gear assemblies.
Segment assets and liabilities include those directly identifiable with the respective segments. Unallocated corporate assets and liabilities represent the assets and liabilities that relate to the Group as a whole and are not allocable to any segment. Expenses that are directly identifiable to segments are considered for determining the segment results. Expenses which relate to the Group as a whole and are not allocable to segments are included under unallocated corporate expenses.
Transfer prices between operating segments are on an arm’s length basis in a manner similar to transactions with third parties.
The current year revenue, profit, assets and liabilities of Cycles and Accessories segment includes the current year acquisition relating to Great Cycles (Private) Limited and Creative Cycles (Private) Limited (Refer Note 39).
Notes to Consolidated Financial Statements

206 Annual Report 2017-18
Tube Investments of India Limited(Formerly known as TI Financial Holdings Limited)
`
in C
rore
s
Par
ticul
ars
Cyc
les
and
Acc
esso
ries
Engi
neer
ing
Met
al F
orm
ed
Pro
duct
sG
ears
and
Gea
r P
rodu
cts
Elim
inat
ions
Con
solid
ated
Tot
al
20
17-1
82
016
-17
20
17-1
82
016
-17
20
17-1
82
016
-17
20
17-1
82
016
-17
20
17-1
82
016
-17
20
17-1
82
016
-17
REV
ENU
E
Exte
rnal
Sal
es1,3
02.
65
1,3
47.5
2 1
,99
3.16
1,7
70.14
1,3
39.2
6 1
,29
6.11
20
5.2
2 1
90.
87 4
,840
.29
4,6
04.
64
Inte
r-Se
gmen
t Sal
es -
- 1
89.8
5 1
62.
25 1
.15 0
.98
4.7
4 0
.89
(195
.74)
(164.
12)
- -
Oth
er O
pera
ting
Inco
me
8.4
9 1
1.17
19
2.84
144
.54
65
.07
47.7
8 9
.59
12.
06
(7.5
9)
(6.3
0)
26
8.40
20
9.25
Una
lloca
ted
Cor
pora
te In
com
e -
- -
- -
--
--
- 7
.59
6.3
1
Tot
al R
even
ue 1
,311
.14 1
,35
8.6
9 2
,375
.85
2,0
76.9
3 1
,40
5.4
8 1
,344
.87
219
.55
20
3.8
2(2
03.
33)
(170
.42
) 5
,116
.28
4,8
20
.20
Una
lloca
ted
Cor
pora
te E
xpen
ses
(16
.79
) (7
.13)
RES
ULT
Ope
ratin
g Pr
ofit
0.0
936
.03
178.
1514
4.85
89.4
782
.55
27.9
824
.42
--
278.
90
280
.72
Profi
t / (L
oss)
on
Sale
of
Pro
pert
y, P
lant
an
d Eq
uipm
ent
0.47
(0.3
0)
(3.2
3) 0
.93
3.81
3.9
00.
700.
11-
-1.7
5 4
.64
Net
Ope
ratin
g P
rofit
0.5
635
.73
174.
92
145
.78
93.
28
86
.45
28
.68
24.
53
- -
28
0.6
5 2
85
.36
Div
iden
d In
com
e -
- -
- -
- 3
.82
3.0
3 -
-5
.173.
55
Fina
nce
Cos
ts -
- -
- (2
.11)
(1.9
4) -
- -
-(5
8.49
)(7
3.9
9)
Tax
Expe
nse
(2.3
0)
- -
- 3
.93
2.6
6 (4
.59
) (5
.99
) -
-(5
8.32
)(4
6.7
5)
Exce
ptio
nal I
tem
s
- Pro
visi
on fo
r Im
pairm
ent o
f In
vest
men
t in
Join
t V
entu
res
- -
- -
- -
- -
- -
(3.2
6)
-
- Pro
fit o
n Sa
le o
f C
urre
nt In
vest
men
ts
(Net
) -
- -
- 0
.14 2
.00
0.6
7 0
.94
- -
2.84
13.6
3
- Sha
re o
f Los
s fr
om
Join
t Ven
ture
s -
- -
-(13
.08)
(7.4
5)
Net
Pro
fit (1
.74)
35
.73
174.
92
145
.78
95
.24
89.
172
8.5
8 2
2.5
1 -
-15
5.5
1 1
74.3
5
Not
es t
o C
onso
lidat
ed F
inan
cial
Sta
tem
ents

Annual Report 2017-18 207
Corporate Overview Management Reports Financial Statements
Par
ticul
ars
Cyc
les
and
Acc
esso
ries
Engi
neer
ing
Met
al F
orm
ed
Pro
duct
sG
ears
and
Gea
r P
rodu
cts
Elim
inat
ions
Con
solid
ated
Tot
al
20
17-1
82
016
-17
20
17-1
82
016
-17
20
17-1
82
016
-17
20
17-1
82
016
-17
20
17-1
82
016
-17
20
17-1
82
016
-17
Oth
er In
form
atio
n
Segm
ent A
sset
s5
91.0
36
21.9
3 1
,165
.81
946
.96
825
.70
744.
7935
3.6
634
3.33
(39.
31)
(29.
99
) 2
,89
6.8
9 2
,627
.02
Una
lloca
ted
Cor
pora
te A
sset
s 1
06
.55
20
2.14
Tota
l Ass
ets
59
1.0
36
21.
93
1,16
5.8
19
46.9
68
25
.70
744.
7935
3.6
634
3.33
(39.
31)
(29.
99
) 3
,00
3.44
2,8
29.
16
Segm
ent L
iabi
litie
s32
7.88
332.
00
494.
01
317.7
028
0.33
237.
95
41.8
240
.61
(39.
31)
(29.
99
) 1
,104.
73 8
98.
27
Una
lloca
ted
Cor
pora
te L
iabi
litie
s 2
6.5
0 8
4.89
Tota
l Lia
bilit
ies
327.
88
332
.00
494.
01
317
.70
28
0.3
3 2
37.9
541
.82
40
.61
(39.
31)
(29.
99
) 1
,131.
23
98
3.16
Cap
ital E
xpen
ditu
re7.
805
4.27
140.
56
48.5
66
8.46
57.
37 6
.32
6.11
- -
223.
14 1
66
.31
Una
lloca
ted
Cor
pora
te C
apita
l Ex
pend
iture
11.6
53.
80
Dep
reci
atio
n15
.95
15.8
06
5.6
66
3.18
52.
8749
.20
15.5
617
.83
- -
150.
04
146
.01
Una
lloca
ted
Cor
pora
te
Dep
reci
atio
n3.
50
2.89
Inve
stm
ent i
n Jo
int
Ven
ture
(Net
of
Impa
irmen
t)8.
8517
.64
Not
es t
o C
onso
lidat
ed F
inan
cial
Sta
tem
ents

208 Annual Report 2017-18
Tube Investments of India Limited(Formerly known as TI Financial Holdings Limited)
Revenue from External Customers ` in Crores
ParticularsYear Ended31-Mar-2018
Year Ended31-Mar-2017
India 4,525.51 4,257.30
Outside India 590.77 562.90
Total Revenue as per Statement of Profit and Loss 5,116.28 4,820.20
There are no sales to external customers more than 10% of Total Revenue.
Non-Current Operating Assets ` in Crores
ParticularsYear Ended31-Mar-2018
Year Ended31-Mar-2017
India 1,472.89 1,256.21
Outside India 79.29 186.75
Total 1,552.18 1,442.96
Reconciliation of Segment Assets and Liabilities to amounts reflected in the Financial Statements ` in Crores
ParticularsAs at
31-Mar-2018As at
31-Mar-2017Segment Assets 3,003.44 2,829.16
Add: Deferred Tax Assets (Note 16) 42.45 44.39
Add: Goodwill on Consolidation (Note 6c) 308.17 305.79
Total Assets 3,354.06 3,179.34
` in Crores
ParticularsAs at
31-Mar-2018As at
31-Mar-2017Segment Liabilities 1,131.23 983.16
Add: Deferred Tax Liabilities (Note 16) 65.07 66.50
Add: Long Term and Short Term Borrowings (Note 15a and Note 17a) 534.97 725.57
Add: Current maturities of Long term Borrowings (Note 17d) 250.00 124.99
Total Liabilities 1,981.27 1,900.22
Note 38.Operating Leases
The Group has operating lease agreements for certain office space and residential accommodation which are generally cancellable in nature. As per the lease terms, an amount of `22.82 Cr. (Previous Year - `24.19 Cr.) has been recognised in the Statement of Profit and Loss.
Note 39.Business Combination and acquisition of Non-Controlling Interests
On 9th March 2018, the Group acquired 80% shares in Great Cycles (Private) Limited and Creative Cycles (Private) Limited, bicycle and component manufacturing companies based out of Sri Lanka for a consideration of `16.98 Cr. (USD 2.61 Million) and `6.47 Cr. (USD 0.99 Million) and accounted a capital reserve of `0.38 Cr. in the Consolidated Financial Statements.
The acquisition is part of the Group strategy for securing the backend supply chain in the mass premium and super premium segments of its bicycles business.
The Group has elected to measure the Non-Controlling Interest in the acquiree(s) at proportionate share of its interest in the acquiree’s identifiable asset.
The Group, based on external expert valuation report determined the fair values of all the Assets and Liabilities taken over / assumed, in both these companies on acquisition date. Valuation of leasehold land and buildings are made using investment method taking into account the potential market value of the assets.
Notes to Consolidated Financial Statements

Annual Report 2017-18 209
Corporate Overview Management Reports Financial Statements
The fair value of the identifiable assets and liabilities of the acquirees as at the date of acquisition are given below
` in Crores
ParticularsGreat Cycles
(Private) LimitedCreative Cycles (Private) Limited
Assets
Property, Plant and Equipment 6.45 3.06
Intangible Assets 5.82 4.89
Other Non Current Financial Assets 0.28 0.82
Inventories 1.42 4.22
Trade Receivables 4.76 5.19
Cash and Cash Equivalents 4.30 5.01
Other Current Assets 0.07 0.06
23.10 23.25
Liabilities
Trade Payables 1.35 9.41
Other Current Financial Liabilities 0.13 0.09
Other Current Liabilities 0.11 5.47
1.59 14.97
Net Assets at Fair Value 21.51 8.28
Non Controlling Interest at Fair Value 4.30 1.66
Purchase Consideration 16.98 6.47
Gain on Bargain Purchase (Refer Note 14) 0.23 0.15
There is no contingent consideration to be paid to the previous owner as per the purchase agreement, and transactions to be recognised separately from acquisition of assets and assumption of liabilities.
The acquisition is a bargain purchase and also completed in one tranche.
From the date of acquisition, Great Cycles (Private) Limited and Creative Cycles (Private) Limited have contributed `2.56 Cr. of Revenue from Operations and `0.28 Cr. of Profit before tax of the continuing operations of the Group. If the Business Combination had taken place at the beginning of the year, revenue from operations to the group would have been `15.45 Cr. and profit before tax would have been `0.20 Cr. respectively.
Note 40. Non-Controlling Interest
Financial information of Subsidiaries having Non-Controlling Interest is given below
As at 31st March 2018
Name of the Subsidiary Country of Incorporation
As on 31st March 2018
Profit allocated to Non-Controlling
Interest(` in Crores)
Other Comprehensive Income allocated
to Non-Controlling Interest
(` in Crores)
Accumulated Non-Controlling
Interest(` in Crores)
Shanthi Gears Limited India 29.88% 8.54 0.03 94.97Great Cycles (Private) Limited
Sri Lanka 20.00% 0.03 - 4.05
Creative Cycles (Private) Limited
Sri Lanka 20.00% - - 1.46
Notes to Consolidated Financial Statements

210 Annual Report 2017-18
Tube Investments of India Limited(Formerly known as TI Financial Holdings Limited)
As at 31st March 2017
Name of the Subsidiary Country of Incorporation
As on 31st March 2017
Profit allocated to Non-Controlling Interest
(` in Crores)
Other Comprehensive Income allocated
to Non-Controlling Interest
(` in Crores)
Accumulated Non-Controlling
Interest(` in Crores)
Shanthi Gears Limited India 29.88% 6.73 (0..02) 91.53
The summarised financial information of the Subsidiariesis provided below. This information is based on amounts before inter-company eliminations
As at 31st March 2018
Summarised Statement of Profit and Loss ` in Crores
Particulars Shanthi Gears Limited
Great Cycles (Private) Limited
Creative Cycles (Private) Limited
Income 231.47 1.30 5.58
Expenses 198.3 1.15 5.45
Profit Before Tax 33.17 0.15 0.13
Tax Expense 4.59 - 0.12
Profit for the Year 28.58 0.15 0.01
- attributable to the owners of the Company 20.04 0.12 0.01
- attributable to the non-controlling interest 8.54 0.03 -
Other Comprehensive Income 0.11 - -
- attributable to the owners of the Company 0.08 - -
- attributable to the non-controlling interest 0.03 - -
Total Comprehensive Income 28.69 0.15 0.01
- attributable to the owners of the Company 20.12 0.12 0.01
- attributable to the non-controlling interest 8.57 0.03 -
Summarised Balance Sheet ` in Crores
Particulars Shanthi Gears Limited
Great Cycles(Private) Limited
Creative Cycles (Private) Limited
Non-Current Asset 81.24 12.46 8.42
Current Asset 278.82 10.23 14.68
Non-Current Liabilities 0.88 1.22 0.98
Current Liabilities 41.39 1.22 14.84
Total Equity 317.79 20.25 7.28
- attributable to the owners of the company 222.82 16.20 5.82
- attributable to the non-controlling interest 94.97 4.05 1.46
Notes to Consolidated Financial Statements

Annual Report 2017-18 211
Corporate Overview Management Reports Financial Statements
Summarised Cash Flow Statement ` in Crores
Particulars Shanthi Gears Limited
Great Cycles (Private) Limited
Creative Cycles (Private) Limited
Net cash inflow in operating activities 56.30 (0.04) 0.08
Net cash outflow from investing activities (40.20) - (0.41)
Net cash inflow in financing activities (17.21) - -
Net Increase in Cash and Cash equivalent (1.11) (0.04) (0.33)
As at 31st Mar 2017Summarised Statement of Profit and Loss ` in Crores
Particulars Shanthi Gears Limited
Income 214.55
Expenses 186.05
Profit Before Tax 28.50
Tax Expense 5.99
Profit for the Year 22.51
- attributable to the owners of the Company 15.78
- attributable to the non-controlling interest 6.73
Other Comprehensive Income (0.08)
- attributable to the owners of the Company (0.06)
- attributable to the non-controlling interest (0.02)
Total Comprehensive Income 22.43
- attributable to the owners of the Company 15.72
- attributable to the non-controlling interest 6.71
Summarised Balance Sheet ` in Crores
Particulars Shanthi Gears Limited
Non-Current Asset 88.38
Current Asset 259.17
Non-Current Liabilities 0.76
Current Liabilities 40.47
Total Equity 306.32
- attributable to the owners of the Company 214.79
- attributable to the non-controlling interest 91.53
Summarised Cash Flow Statement ` in Crores
Particulars Shanthi Gears Limited
Net cash inflow in operating activities 13.81
Net cash outflow from investing activities (12.92)
Net cash inflow in financing activities -
Net Increase in Cash and Cash equivalent 0.89
Notes to Consolidated Financial Statements

212 Annual Report 2017-18
Tube Investments of India Limited(Formerly known as TI Financial Holdings Limited)
Note 41.Interest in Joint Venture
The Group has interest in Joint Ventures namely TI Tsubamex Private Limited (TTPL) and TI Absolute Concepts Private Limited (TIACPL) at 78.33% and 50% respectively as at 31st March 2018 (Previous Year 75% and 50% respectively).
The Group’s interest is accounted using the Equity method in the Consolidated Financial Statements. Summarised financial information of the Joint Ventures based on their Ind AS Financial Statements is given below
As at 31st March 2018
Summarised Statement of Profit and Loss ` in Crores
Particulars TTPL TIACPL
Income 26.76 10.68
Expenses 33.74 26.20
Profit Before Tax (6.98) (15.52)
Tax Expense - -
Profit for the Year (6.98) (15.52)
Other Comprehensive Income - -
Total Comprehensive Income (6.98) (15.52)
Proportion of Group's ownership 78% 50%
Group's share in Total Comprehensive Income (5.32) (7.76)
Summarised Balance Sheet ` in Crores
Particulars TTPL TIACPL
Non-Current Asset 16.92 10.02
Current Asset 10.51 1.81
Non-Current Liabilities 6.06 0.03
Current Liabilities 11.68 5.29
Total Equity 9.69 6.51
Proportion of Group's ownership 78% 50%
Group's share in Total Equity 7.59 3.26
As at 31st March 2017
Summarised Statement of Profit and Loss ` in Crores
Particulars TTPL TIACPL
Income 5.19 2.70
Expenses 11.00 8.15
Profit Before Tax (5.81) (5.45)
Tax Expense 0.48 -
Profit for the Year (6.29) (5.45)
Other Comprehensive Income (0.01) -
Total Comprehensive Income (6.30) (5.45)
Proportion of Group's ownership 75% 50%
Group's share in Total Comprehensive Income (4.73) (2.72)
Notes to Consolidated Financial Statements

Annual Report 2017-18 213
Corporate Overview Management Reports Financial Statements
Summarised Balance Sheet ` in Crores
Particulars TTPL TIACPL
Non-Current Asset 18.86 12.47
Current Asset 22.53 4.60
Non-Current Liabilities 0.05 -
Current Liabilities 28.68 2.53
Total Equity 12.66 14.54
Proportion of Group's ownership 75% 50%
Group's share in Total Equity 9.50 7.27
Note 42. Hedging Activities and Derivatives
Cash Flow Hedges
Foreign Exchange Forward Contracts measured at Fair Value through OCI are designated as Hedging Instruments in cash flow hedges of forecast sales in EUR and USD, and also for forecast purchases in USD, EUR and JPY. Currency Swaps measured at Fair Value through Profit and Loss are designated as Hedging Instruments in cash flow hedges of floating rate long term borrowings in USD.
` in Crores
ParticularsAs at 31-Mar-2018 As at 31-Mar-2017
Assets Liabilities Assets Liabilities
Fair Value of Foreign Exchange Forward Contracts - 0.31 - 0.15
Disclosure of effects of Hedge accounting
As at 31st March 2018
Foreign Exchange Risk on Cash Flow
Hedge
Nominal Value of Hedging Instruments
(No. of Contracts)
Carrying Value of Hedging Instruments(` in Crores)
Maturity Date Hedge Ratio Weighted Average
Rate
Changes in Fair value
of Hedging Instrument
Changes in the value of Hedged
Item used as a basis for
recognising hedge effectiveness
Foreign Currency Forward
Contracts
Asset Liability Asset Liability
05-Apr-2018 to 29-Mar-
20191:1
1 USD - `65.74
(0.17) 0.1716 18 10.18 21.25
1 EUR - `82.82
1 JPY - `0.63
` in Crores
Cash Flow Hedge Change in the value of Hedging Instrument recognised in Other
Comprohensive Income
Hedge Inffectiveness recognised in Profit or Loss
Amount reclassified from Cash Flow Hedge
Reserve to Profit or Loss
Line item affected in Statement of Profit
and Loss because of the Reclassification
Foreign Exchange Risk 1.15 - 0.96 Other Income
Notes to Consolidated Financial Statements

214 Annual Report 2017-18
Tube Investments of India Limited(Formerly known as TI Financial Holdings Limited)
As at 31st March 2017
Foreign Exchange Risk on Cash Flow
Hedge
Nominal Value of Hedging Instruments
(No. of Contracts)
Carrying Value of Hedging Instruments(` in Crores)
Maturity Date Hedge Ratio Weighted Average
Rate
Changes in Fair value
of Hedging Instrument
Changes in the value of Hedged
Item used as a basis for
recognising hedge effectiveness
Foreign Currency Forward
Contracts
Asset Liability Asset Liability 05-Apr-2017 to 29-Mar-
20181:1
1 USD - `65.32
(0.36) 0.3639 9 25.75 6.53
1 EUR - `72.39
` in Crores
Cash Flow Hedge Change in the value of Hedging Instrument recognised in Other
Comprohensive Income
Hedge Inffectiveness recognised in Profit or Loss
Amount reclassified from Cash Flow Hedge
Reserve to Profit or Loss
Line item affected in Statement of Profit
and Loss because of the Reclassification
Foreign Exchange Risk (0.03) - (0.54) Other Income
Note 43.1 Fair Values
The following table presents the carrying amounts and fair value of each category of financial assets and liabilities.` in Crores
ParticularsCarrying value Fair value
31-Mar-2018 31-Mar-2017 31-Mar-2018 31-Mar-2017
Financial assets
FVTOCI Equity Investments 11.12 12.19 11.12 12.19
Other Non-current Investments 12.17 12.17 12.17 12.17
Other Financial Assets - Non Current 22.30 22.16 22.30 22.16
Loans 1.64 1.58 1.64 1.58
Trade Receivables 697.01 614.99 697.01 614.99
FVTPL Investments in Mutual Funds 101.40 159.68 101.40 159.68
Cash and Cash Equivalents 32.46 23.94 32.46 23.94
Other Financial Assets - Current 78.85 81.39 78.85 81.39
Total 956.95 928.10 956.95 928.10
Financial liabilities
Non-current Borrowings 228.56 378.26 235.57 390.12
Other Non-current Liabilities 0.88 0.66 0.88 0.66
Current Borrowings 306.41 347.31 306.41 347.31
Trade Payables 950.55 775.38 950.55 775.38
Derivative Instruments 0.31 0.15 0.31 0.15
Other Financial Liabilities - Current 296.80 227.62 296.80 227.62
Total 1,783.51 1,729.38 1,790.52 1,741.24
Notes to Consolidated Financial Statements

Annual Report 2017-18 215
Corporate Overview Management Reports Financial Statements
The management assessed that derivatives, cash and cash equivalents, trade receivables, loans, current investments, other financial assets, borrowings, trade payables, bank overdrafts and other financial liabilities approximate their carrying amounts largely due to the short-term maturities of these instruments.
The fair value of the financial assets and liabilities is included at the amount at which the instrument could be exchanged in a current transaction between willing parties, other than in a forced or liquidation sale. The following methods and assumptions were used to estimate the fair values:
i. The fair values of quoted equity investments are derived from quoted market prices in active markets.
ii. The fair values of certain unquoted equity investments have been estimated using Discounted Cash-flow Model (DCF). The valuation is based on certain assumptions like forecast cash-flows, discount rate, etc.
iii. The fair values of quoted investments routed through FVTPL are derived from quoted market prices in active markets.
iv. The fair value of borrowings is estimated by discounting expected future cash flows using a discount rate equivalent to the risk-free rate of return, adjusted for the credit spread considered by the lenders for instruments of the similar maturity.
v. Derivatives are fair valued using market observable rates and published prices.
Note 43.2 Fair Values Hierarchy
The following table provides the fair value measurement hierarchy of the Group's assets and liabilities:
Quantitative disclosures fair value measurement hierarchy for assets as at 31st March 2018: ` in Crores
Particulars
Fair Value Measurement using
TotalQuoted Price in active markets
(Level 1)
Significant observable
inputs (Level 2)
Significant unobservable
inputs (Level 3)
Asset measured at fair value:
FVTOCI Equity investments 11.12 2.37 - 8.75
FVTPL Investments 113.57 113.57 - -
Assets for which fair values are disclosed:
Investment Properties 14.91 - 14.91 -
There have been no transfers between the level 1 and level 2 during the period.
Quantitative disclosures fair value measurement hierarchy for liabilities as at 31st March 2018:
Particulars
Fair Value Measurement using
TotalQuoted Price in active markets
(Level 1)
Significant observable
inputs (Level 2)
Significant unobservable
inputs (Level 3)
Liabilities measured at fair value:
Derivative Financial Liabilities:
Foreign Exchange forward Contracts 0.31 - 0.31 -
Liabilities for which fair values are disclosed:
Borrowings:
Long term Borrowings 235.57 - 235.57 -
There have been no transfers between the level 1 and level 2 during the period.
Notes to Consolidated Financial Statements
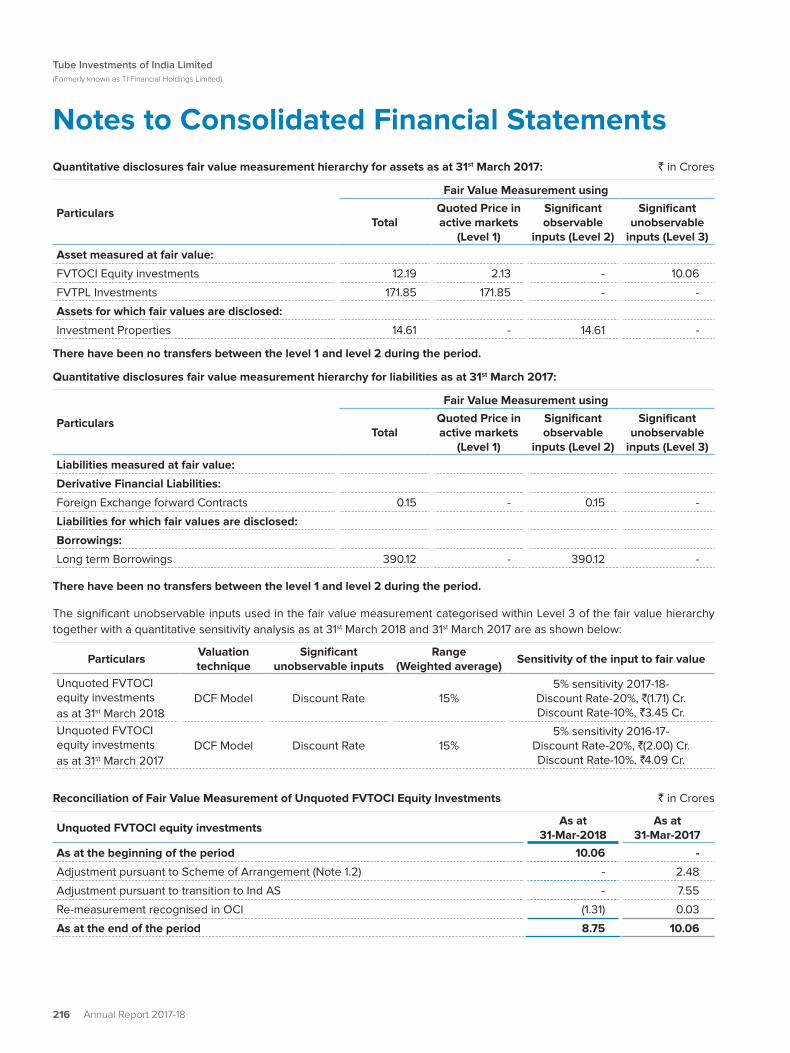
216 Annual Report 2017-18
Tube Investments of India Limited(Formerly known as TI Financial Holdings Limited)
Quantitative disclosures fair value measurement hierarchy for assets as at 31st March 2017: ` in Crores
Particulars
Fair Value Measurement using
TotalQuoted Price in active markets
(Level 1)
Significant observable
inputs (Level 2)
Significant unobservable
inputs (Level 3)
Asset measured at fair value:
FVTOCI Equity investments 12.19 2.13 - 10.06
FVTPL Investments 171.85 171.85 - -
Assets for which fair values are disclosed:
Investment Properties 14.61 - 14.61 -
There have been no transfers between the level 1 and level 2 during the period.
Quantitative disclosures fair value measurement hierarchy for liabilities as at 31st March 2017:
Particulars
Fair Value Measurement using
TotalQuoted Price in active markets
(Level 1)
Significant observable
inputs (Level 2)
Significant unobservable
inputs (Level 3)
Liabilities measured at fair value:
Derivative Financial Liabilities:
Foreign Exchange forward Contracts 0.15 - 0.15 -
Liabilities for which fair values are disclosed:
Borrowings:
Long term Borrowings 390.12 - 390.12 -
There have been no transfers between the level 1 and level 2 during the period.
The significant unobservable inputs used in the fair value measurement categorised within Level 3 of the fair value hierarchy together with a quantitative sensitivity analysis as at 31st March 2018 and 31st March 2017 are as shown below:
ParticularsValuation technique
Significant unobservable inputs
Range (Weighted average)
Sensitivity of the input to fair value
Unquoted FVTOCI equity investmentsas at 31st March 2018
DCF Model Discount Rate 15%5% sensitivity 2017-18-
Discount Rate-20%, (̀1.71) Cr.Discount Rate-10%, `3.45 Cr.
Unquoted FVTOCI equity investmentsas at 31st March 2017
DCF Model Discount Rate 15%5% sensitivity 2016-17-
Discount Rate-20%, (̀2.00) Cr.Discount Rate-10%, 4̀.09 Cr.
Reconciliation of Fair Value Measurement of Unquoted FVTOCI Equity Investments ` in Crores
Unquoted FVTOCI equity investmentsAs at
31-Mar-2018As at
31-Mar-2017
As at the beginning of the period 10.06 -
Adjustment pursuant to Scheme of Arrangement (Note 1.2) - 2.48
Adjustment pursuant to transition to Ind AS - 7.55
Re-measurement recognised in OCI (1.31) 0.03
As at the end of the period 8.75 10.06
Notes to Consolidated Financial Statements

Annual Report 2017-18 217
Corporate Overview Management Reports Financial Statements
Note 44.Financial Risk Management Objectives and Policies
The Group's principal financial liabilities, other than derivatives, comprise of bank loans and trade payables. The main purpose of these financial liabilities is to raise finance for the operations. The Group has various financial assets such as trade receivables, cash and short-term deposits, which arise directly from its operations. There are FVTOCI investments and derivative transactions.
There is exposure to market risk, credit risk and liquidity risk. The senior management oversees the management of these risks. The senior management is supported by a Risk Management Committee that advises on financial risks and the appropriate financial risk governance framework. The Risk Management Committee provides assurance to the senior management that the financial risk activities are governed by appropriate policies and procedures and that the financial risks are identified, measured and managed in accordance with the policies and risk objectives. All derivative activities for risk management purposes are carried out by specialist teams that have the appropriate skills, experience and supervision. It is the policy that no trading in derivatives for speculative purposes may be undertaken.
A. Market Risk
Market risk is the risk of any loss in future earnings, in realizable fair values or in future cash flows that may result from a change in the price of a financial instrument. The value of a financial instrument may change as a result of changes in the interest rates, foreign currency exchange rates, equity price fluctuations, liquidity and other market changes. Future specific market movements cannot be normally predicted with reasonable accuracy.
i. Foreign Currency Exchange Rate Risk
The fluctuation in foreign currency exchange rates may have potential impact on the Income Statement and Equity, where any transaction references more than one currency or where assets / liabilities are denominated in a currency other than the functional currency of the respective consolidated entities.
As per the forex policy, foreign exchange and other derivative instruments are primarily used to hedge foreign exchange and interest rate exposure.
The impact of foreign exchange rate fluctuations is evaluated by assessing its exposure to exchange rate risks. A part of these risks are hedged by using derivative financial instruments in accordance with the forex policy.
The foreign exchange rate sensitivity is calculated for each currency by aggregation of the net foreign exchange rate exposure of a currency and a simultaneous parallel foreign exchange rates shift in the foreign exchange rates of each currency by 5%.
Foreign Currency Sensitivity
The following tables demonstrate the sensitivity to 5% appreciation in USD and EURO exchange rates on foreign currency exposures as at the year end, with all other variables held constant. The impact on the profit before tax is due to changes in the fair value of monetary assets and liabilities. The exposure to foreign currency changes for all other currencies is not material.
` in Crores
As at NatureIncrease/
(Decrease) in PBT for change in USD rates
Increase/(Decrease) in PBT for change in EURO rates
31st March 2018Receivables 1.18 1.29
Payables (2.40) (0.48)
31st March 2017Receivables 2.58 0.53
Payables (2.00) (0.27)
Notes to Consolidated Financial Statements

218 Annual Report 2017-18
Tube Investments of India Limited(Formerly known as TI Financial Holdings Limited)
Derivative Contracts ` in Crores
As at Nature
Increase/(Decrease) in
PBT for change in USD rates
Increase/(Decrease) in
PBT for change in EURO rates
Increase/(Decrease) in
OCI for change in USD rates
Increase/(Decrease) in
OCI for change in EURO rates
Increase/(Decrease) in
OCI for change in JPY rates
31st March 2018Derivative Contracts
(0.54) (0.79) (0.04) (0.66) 0.18
31st March 2017Derivative Contracts
(0.43) (0.17) 0.59 0.34 -
Conversely, 5% depreciation in the USD and Euro rates against the significant foreign currencies as at 31-Mar-18 and 31-Mar-2017 would have had the same but opposite effect, again holding all other variables constant.
ii. Equity Price Risk
Equity Price Risk is related to the change in market reference price of the investments in equity securities.
The majority of the Group's investments are in the shares of group companies, which are carried at cost. The Group has investments in other equity investments, routed through FVTOCI of only `11.12 Cr. as at 31st March 2018. (As at 31st March 2017 - `12.19 Cr.)
B. Credit Risk
Credit risk is the risk of financial loss arising from counterparty failure to repay or service debt according to the contractual terms or obligations. Credit risk encompasses both the direct risk of default and the risk of deterioration of creditworthiness as well as concentration risks.
Financial instruments that are subject to concentrations of credit risk principally consist of trade receivables, loans and advances and derivative financial instruments. None of the financial instruments of the Group result in material concentrations of credit risks.
Exposure to credit risk - The carrying amount of financial assets represents the maximum credit exposure. The maximum exposure to credit risk was `832.26 Cr. as at 31st March 2018, `744.06 Cr. as at 31st March 2017, being the total of the carrying amount of balances with banks, short term deposits with banks, trade receivables and other financial assets excluding equity investments.
At 31st March 2018, the group had 119 customers (as at 31st March 2017 - 112 customers) that owed the Group more than `1 Cr. each and accounted for approximately 72% (as at 31st March 2017 - 67%) of the total trade receivables outstanding. There were 12 customers (as at 31st March 2017 - 8 customers) with balances greater than ̀ 10 Cr. accounting for around 26% (as at 31st March 2017 - 21%) of the total trade receivables.
Credit risk from balances with banks and investment of surplus funds in mutual funds is managed by the Group’s treasury department. The objective is to minimise the concentration of risks and therefore mitigate financial loss.
Of the above, `48.91 Cr. is backed by Letter of Credit / Export Credit Guarantee Cover as at 31st March 2018 (as at 31st March 2017 - `65.55 Cr.).
C. Liquidity Risk
Liquidity risk refers to the risk that the Group cannot meet its financial obligations. The objective of liquidity risk management is to maintain sufficient liquidity and ensure that funds are available for use as per requirements.
The Group has obtained fund and non-fund based working capital lines from various banks. Furthermore, the Group has access to funds from debt markets through commercial paper, non-convertible debentures, and other debt instruments. The Group invests its surplus funds in bank fixed deposit and liquid and liquid plus schemes of mutual funds, which Carry no / low mark to market risks. The Group has also invested 15% of the non-convertible debentures (taken by the group) falling due for repayment in the next 12 months in bank deposits, to meet the regulatory norms of liquidity requirements.
Notes to Consolidated Financial Statements

Annual Report 2017-18 219
Corporate Overview Management Reports Financial Statements
The Group also constantly monitors funding options available in the debt and capital markets with a view to maintaining financial flexibility.
As at 31st March 2018, the Group has undrawn committed lines of `287.53 Cr. (As at 31st March 2017 - `224.03 Cr).
The table below provides details regarding the contractual maturities of financial liabilities based on contractual undiscounted payments: ` in Crores
Particulars On demandLess than 3
months3 to 12 months > 1 year Total
Year ended 31st March 2018
Borrowings 157.49 0.66 438.94 248.51 845.60
Other Financial Liabilities 1.10 32.01 - 0.88 33.99
Trade and Other Payables 145.25 794.84 10.46 - 950.55
Derivatives - 0.31 - - 0.31
303.84 827.82 449.40 249.39 1,830.45
Year ended 31st March 2017
Borrowings 55.53 204.75 221.39 445.12 926.79
Other Financial Liabilities 55.39 29.86 - 0.66 85.91
Trade and Other Payables - 775.38 - - 775.38
Derivatives - 0.15 - - 0.15
110.92 1,010.14 221.39 445.78 1,788.23
Note 45.Capital Management
The Group’s capital management is intended to create value for shareholders by facilitating the meeting of long-term and short-term goals.
The amount of capital required is determined based on annual operating plans and long-term product and other strategic investment plans. The funding requirements are met through internal accruals, nonconvertible debentures, external commercial borrowings and other long - term / short - term borrowings. The Group’s policy is aimed at combination of short - term and long - term borrowings.
The Group monitors capital employed using a Debt Equity ratio, which is total debt divided by total equity and maturity profile of the overall debt portfolio of the Group.
The following table summarizes the Capital of the Group: ` in Crores
ParticularsAs at
31-Mar-2018As at
31-Mar-2017
Borrowings
- Long Term 228.56 378.26
- Short Term 306.41 347.31
- Other Current liabilities (Current maturities of Long Term Borrowings) 250.00 124.99
Total Debt 784.97 850.56
Equity Share Capital 18.75 18.74
Other Equity 1,253.56 1,168.85
Equity 1,272.31 1,187.59
Debt Equity ratio 0.62 0.72
Notes to Consolidated Financial Statements

220 Annual Report 2017-18
Tube Investments of India Limited(Formerly known as TI Financial Holdings Limited)
Not
e 46
. Add
ition
al in
form
atio
n as
requ
ired
by
Par
agra
ph 2
of t
he G
ener
al In
stru
ctio
ns fo
r Pre
para
tion
of C
onso
lidat
ed F
inan
cial
Sta
tem
ents
to S
ched
ule
III to
the
Com
pani
es A
ct, 2
013
as
at a
nd fo
r th
e ye
ar e
nded
31st
Mar
ch 2
017
and
31st
Mar
ch 2
018
Nam
e of
the
Entit
ies
Net
Ass
ets
Sha
re in
Pro
fit a
nd L
oss
Oth
er C
ompr
ehen
sive
Inco
me
Tota
l Com
preh
ensi
ve In
com
eA
s %
of
Con
solid
ated
N
et A
sset
s
Am
ount
(` in
Cro
res)
As
% o
f C
onso
lidat
ed
Pro
fit a
nd
Loss
Am
ount
(` in
Cro
res)
As
% o
f C
onso
lidat
ed
Oth
er
Com
preh
ensi
ve
Inco
me
Am
ount
(` in
Cro
res)
As
% o
f C
onso
lidat
ed
Tota
l C
ompr
ehen
sive
In
com
e
Am
ount
(` in
Cro
res)
I. P
aren
t
Tube
Inve
stm
ents
of I
ndia
Li
mite
d6
8% 9
37.0
59
1% 1
41.7
09
8% 5
.06
91%
146
.76
II. S
ubsi
diar
ies
a)
Ind
ian
Shan
thi G
ears
Lim
ited
16%
220
. 1314
% 2
2.29
2% 0
.08
14%
22.
37
b) F
orei
gn
Fi
nanc
iere
C10
SA
S (R
efer
Not
e)6
% 7
8.0
1-1
% (1
.87)
0%
--1
% (1
.87)
Gre
at C
ycle
s Pr
ivat
e Li
mite
d1%
17.7
1-1
% (0
.89
)0
% -
-1%
(0.8
9)
Cre
ativ
e C
ycle
s Pr
ivat
e Li
mite
d1%
10.
56
0%
(0.7
6)
0%
-0
% (0
.76
)
III. N
on C
ontr
ollin
g In
tere
stS
ubsi
diar
ies
a)
Ind
ian
Shan
thi G
ears
Lim
ited
7% 9
7.6
15
% 8
.54
1% 0
.03
5%
8.5
7
b) F
orei
gn
G
reat
Cyc
les
Priv
ate
Lim
ited
0%
2.6
00
% (0
.21)
0%
-0
% (0
.21)
Cre
ativ
e C
ycle
s Pr
ivat
e Li
mite
d0
% 0
.27
0%
(0.2
1)0
% -
0%
(0.2
1)
IV. J
oint
Ven
ture
s
Indi
an
TI T
suba
mex
Priv
ate
Lim
ited
1% 8
.85
-3%
(5.3
2)-3
% (5
.32)
TI
Abs
olut
e C
once
pts
Priv
ate
Lim
ited
0%
--5
% (7
. 76
)-5
% (7
.76
)
Tota
l 1
,372
.79
155
.51
5.17
16
0.6
8
Not
es t
o C
onso
lidat
ed F
inan
cial
Sta
tem
ents

Annual Report 2017-18 221
Corporate Overview Management Reports Financial Statements
Year
End
ed 3
1st M
arch
20
17
Nam
e of
the
Entit
ies
Net
Ass
ets
Sha
re in
Pro
fit a
nd L
oss
Oth
er C
ompr
ehen
sive
Inco
me
Tota
l Com
preh
ensi
ve In
com
e
As
% o
f C
onso
lidat
ed
Net
Ass
ets
Am
ount
(` in
Cro
res)
As
% o
f C
onso
lidat
ed
Pro
fit a
nd
Loss
Am
ount
(` in
Cro
res)
As
% o
f C
onso
lidat
ed
Oth
er
Com
preh
ensi
ve
Inco
me
Am
ount
(` in
Cro
res)
As
% o
f C
onso
lidat
ed
Tota
l C
ompr
ehen
sive
In
com
e
Am
ount
(` in
Cro
res)
I. P
aren
t
Tu
be In
vest
men
ts o
f Ind
ia
Lim
ited
69
% 8
76.5
087
% 1
51.7
89
7% (2
.43)
87%
149
.35
II. S
ubsi
diar
ies
a)
Ind
ian
Shan
thi G
ears
Lim
ited
17%
214
.89
10%
17.7
92%
(0.0
6)
10%
17.7
3
b)
For
eign
Fina
ncie
re C
10 S
AS
(Ref
er N
ote)
6%
78.
56
3% 5
.50
0%
-3%
5.5
0
III. N
on C
ontr
ollin
g In
tere
st
S
ubsi
diar
ies
a) I
ndia
n
Sh
anth
i Gea
rs L
imite
d7%
91.5
34%
6.7
31%
(0.0
2)4%
6.7
1
IV. J
oint
Ven
ture
s
In
dian
TI
Tsu
bam
ex P
rivat
e Li
mite
d1%
10.3
7-3
% (4
.72)
-3%
(4.7
2)
TI
Abs
olut
e C
once
pts
Priv
ate
Lim
ited
1%7.
27-2
% (2
.73)
-2%
(2.7
3)
Tota
l 1
,279
.1217
4.35
(2.5
1) 1
71.8
4
Not
e: R
epre
sent
s de
tails
as
per
Con
solid
ated
Fin
anci
al S
tate
men
ts o
f Fi
nanc
iere
C10
SA
S (F
C10
). C
onso
lidat
ed F
inan
cial
Sta
tem
ents
of
FC10
inc
lude
s th
e Fi
nanc
ial S
tate
men
ts o
f its
thre
e w
holly
ow
ned
subs
idia
ries
nam
ely
Sedi
s SA
S, S
edis
Gm
bH a
nd S
edis
Co.
Lim
ited.
Not
es t
o C
onso
lidat
ed F
inan
cial
Sta
tem
ents

222 Annual Report 2017-18
Tube Investments of India Limited(Formerly known as TI Financial Holdings Limited)
Note 47. Previous Year’s figures
The Group has reclassified / regrouped previous year figures to Conform to this year’s classification.
Notes to Consolidated Financial Statements
Signatures to Notes to Financial StatementsAs per our report of even dateFor S.R. Batliboi & Associates LLPChartered AccountantsICAI Firm Regn. No : 101049W / E300004
On behalf of the BoardFor Tube Investments of India Limited
per Subramanian SureshPartnerMembership No : 083673
M M MurugappanChairman
Chennai7th May 2018
S SureshCompany Secretary
K Mahendra KumarChief Financial Officer
L RamkumarManaging Director

TUBE INVESTMENTS OF INDIA LIMITED(formerly, TI Financial Holdings Limited)
CIN: L35100TN2008PLC069496
Regd. Office: ‘Dare House’, 234, N S C Bose Road, Chennai - 600 001
Tel: 91.44.42177770-5 Fax: 91.44.42110404 Website: www.tiindia.com;
E-mail id: [email protected]
(Pursuant to Section 105(6) of the Companies Act, 2013 and Rule 19(3) of the Companies (Management and Administration) Rules, 2014
Name of the Member(s) :
Registered Address :
E-mail ID :
Folio/DP ID-Client ID No. :
I/We, being the member(s) of ………………………………………………………..................shares of the above named Company, hereby appoint:
1. Name : …………………………………………………………………………………………………..................................................... Address : …………………………………………………………………………………………………..................................................... E-Mail ID : ………………………………………………………………………………………………….....................................................
Signature : …………………………………………………………………….....................................................or failing him/her;
2. Name : …………………………………………………………………………………………………..................................................... Address : …………………………………………………………………………………………………..................................................... E-Mail ID : ………………………………………………………………………………………………….....................................................
Signature : …………………………………………………………………….....................................................or failing him/her;
3. Name : ………………………………………………………………………………………………….....................................................
Address : ………………………………………………………………………………………………….....................................................
E-Mail ID : ………………………………………………………………………………………………….....................................................
Signature : ………………………………………………………………………………………………….....................................................
as my/our proxy to attend and vote (on a poll) for me/us and on my/our behalf at the 10th Annual General Meeting of the Company, to be held on Monday, the 13th day of August, 2018 at 3.30 P.M. at T T K Auditorium, The Music Academy, 168 T T K Road, Chennai - 600 014 and at any adjournment thereof in respect of such resolutions as are indicated below:
Resolution No. ResolutionVote (Optional)*
For Against Abstain
Ordinary Business1. Adoption of Audited Financial Statements of the Company
for FY 2017-18, Reports of the Board of Directors and Auditors thereon.
2. Adoption of Audited Consolidated Financial Statements of the Company for FY 2017-18 and Reports of the Auditors thereon.
3. Declaration of Dividend.4. Re-appointment of Mr. M M Murugappan, Director retiring by
rotation.5. Ratification of appointment M/s. S.R.Batliboi & Associates
LLP, Chartered Accountants as statutory auditors for FY2018-19 and fixing their remuneration in respect thereof.
Proxy Form
Tube Investments of India Limited(formerly known as TI Financial Holdings Limited)

Resolution No. ResolutionVote (Optional)*
For Against Abstain
Special Business6. Appointment of Mr. Ramesh K B Menon as Director.
7.Alteration of sub-clause 10 under III(B) of the Memorandum of Association of the Company.
8.Issue of Non-Convertible Debentures for an aggregate sum of `500 Crores on private placement basis.
9.Ratification of remuneration payable to M/s. Mahadevan & Co., Cost Auditor, for FY 2018-19.
Signed this ……………................... day of …………………………………........, 2018Affix
Revenue Stamp
`1/-
Member’s Folio/DP ID-Client ID No. ……………………………………………..........Signature of Shareholder(s)……………………………………………..........................Signature of Proxyholder(s)…………………………………………………………...........
Note:
1. This form of proxy in order to be effective should be duly completed and deposited at the registered office of the Company not less than 48 hours before commencement of the meeting.
2. In the case of a Corporation, this Proxy shall be either given under the Common Seal or signed on behalf by an Attorney or Officer of the Corporation.
3. * This is only optional. Please fill up the Item Nos. as appearing in the Notice of the Annual General Meeting. If you leave the Item Nos. blank, your proxy will be entitled to vote in the manner as he/she thinks appropriate.
4. Shareholders/Proxies are requested to desist from using mobile phones during the proceedings of the Annual General Meeting.

Cautionary Statement Certain expectations and projections regarding the future performance of the Company referenced in the Annual Report constitute forward-looking statements. These expectations and projections are based on currently available competitive, financial and economic data, along with the Company’s operating plans and are subject to certain future events and uncertainties, which could cause actual results to differ materially from those indicated by such statements.
Corporate Overview 01 Repositioning for growth
02 Business Segments
03 Financial Highlights
04 Engineering Business
06 Metal Formed Products Business
08 Bicycles Business
10 From the Desk of the Chairman
12 From the Desk of the Managing Director
14 Our Parentage
15 Corporate Information
16 Board of Directors
Management Reports 17 Board’s Report & Management Discussion and Analysis
35 Report on Corporate Governance
46 General Shareholder Information
Financial Statements 75 Standalone Financial Statements
142 Consolidated Financial Statements
Contents

TUBE INVESTMENTS OF INDIA LIMITEDAnnual Report 2017-18
REPOSITIONINGFOR GROWTHTube Investments of India Limited
CIN: L35100TN2008PLC069496‘Dare House’, No. 234 N.S.C Bose Road, Chennai - 600001.
Tel: 044-42177770-5 Fax: 044-42110404Email: [email protected]
Website: www.tiindia.com

TUBE INVESTMENTS OF INDIA LIMITED(formerly, TI Financial Holdings Limited)
CIN: L35100TN2008PLC069496Regd. Office: ‘Dare House’, 234, N S C Bose Road, Chennai – 600 001
Tel: 91.44.42177770-5, Fax: 91.44.42110404, Website: www.tiindia.comE-mail id: [email protected]
PLEASE COMPLETE THIS ATTENDANCE SLIP AND HAND OVER AT THE ENTRANCE OF THE HALL.ONLY MEMBERS OR THEIR PROXIES ARE ENTITLED TO BE PRESENT AT THE MEETING.
Attendance Slip
I hereby record my presence at the 10th ANNUAL GENERAL MEETING held at T T K Auditorium,The Music Academy, 168 T T K Road, Chennai – 600 014 at 3.30 P.M. on Monday, the 13th August,2018.
NAME OF PROXY IN BLOCK LETTERS SIGNATURE OF THE SHAREHOLDER/PROXY*
* Strike out whichever is not applicable
Note:
1. Members/Proxy holders are hereby requested to produce duly filled in and signed attendance slip at the
venue for admission to the 10th Annual General Meeting (AGM).
2. PROXY FORM IS ATTACHED AT THE END OF THE ANNUAL REPORT FOR MEMBERS’ USE.
3. Only Members/Representatives of the Corporate Members or Proxies are allowed to attend the AGM.
Bodies Corporate, whether a company or not, who are members, may attend through their authorised
representatives appointed under Section 113 of the Companies Act, 2013. A copy of authorization
should be deposited with the Company.
4. Members/Proxies are requested to desist from using mobile phones during the proceedings of the AGM.
ELECTRONIC VOTING PARTICULARS
Folio / DP ID / Client ID Electronic Voting User ID PasswordSequence Number
Commencement of Electronic voting
8th August, 2018 (9.00 a.m)
End of Electronic voting
12th August, 2018 (5.00 p.m)

TUBE INVESTMENTS OF INDIA LIMITED(formerly, TI Financial Holdings Limited)
CIN: L35100TN2008PLC069496
Regd. Office: ‘Dare House’, 234, N S C Bose Road, Chennai - 600 001
Tel: 91.44.42177770-5 Fax: 91.44.42110404 Website: www.tiindia.com;
E-mail id: [email protected]
(Pursuant to Section 105(6) of the Companies Act, 2013 and Rule 19(3) of the Companies (Management and Administration) Rules, 2014
Name of the Member(s) :
Registered Address :
E-mail ID :
Folio/DP ID-Client ID No. :
I/We, being the member(s) of ………………………………………………………..................shares of the above named Company, hereby appoint:
1. Name : …………………………………………………………………………………………………..................................................... Address : …………………………………………………………………………………………………..................................................... E-Mail ID : ………………………………………………………………………………………………….....................................................
Signature : …………………………………………………………………….....................................................or failing him/her;
2. Name : …………………………………………………………………………………………………..................................................... Address : …………………………………………………………………………………………………..................................................... E-Mail ID : ………………………………………………………………………………………………….....................................................
Signature : …………………………………………………………………….....................................................or failing him/her;
3. Name : ………………………………………………………………………………………………….....................................................
Address : ………………………………………………………………………………………………….....................................................
E-Mail ID : ………………………………………………………………………………………………….....................................................
Signature : ………………………………………………………………………………………………….....................................................
as my/our proxy to attend and vote (on a poll) for me/us and on my/our behalf at the 10th Annual General Meeting of the Company, to be held on Monday, the 13th day of August, 2018 at 3.30 P.M. at T T K Auditorium, The Music Academy, 168 T T K Road, Chennai - 600 014 and at any adjournment thereof in respect of such resolutions as are indicated below:
Resolution No. ResolutionVote (Optional)*
For Against Abstain
Ordinary Business1. Adoption of Audited Financial Statements of the Company
for FY 2017-18, Reports of the Board of Directors and Auditors thereon.
2. Adoption of Audited Consolidated Financial Statements of the Company for FY 2017-18 and Reports of the Auditors thereon.
3. Declaration of Dividend.4. Re-appointment of Mr. M M Murugappan, Director retiring by
rotation.5. Ratification of appointment M/s. S.R.Batliboi & Associates
LLP, Chartered Accountants as statutory auditors for FY2018-19 and fixing their remuneration in respect thereof.
Proxy Form
Tube Investments of India Limited(formerly known as TI Financial Holdings Limited)
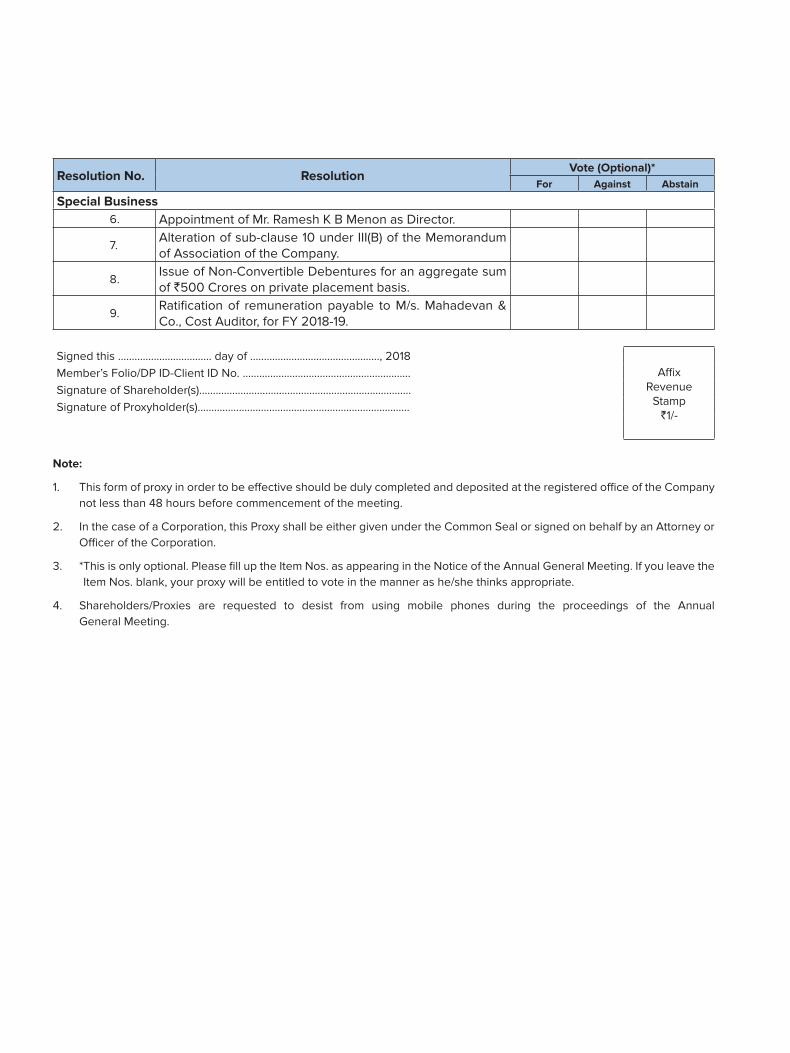
Resolution No. ResolutionVote (Optional)*
For Against Abstain
Special Business6. Appointment of Mr. Ramesh K B Menon as Director.
7.Alteration of sub-clause 10 under III(B) of the Memorandum of Association of the Company.
8.Issue of Non-Convertible Debentures for an aggregate sum of `500 Crores on private placement basis.
9.Ratification of remuneration payable to M/s. Mahadevan & Co., Cost Auditor, for FY 2018-19.
Signed this ……………................... day of …………………………………........, 2018Affix
Revenue Stamp
`1/-
Member’s Folio/DP ID-Client ID No. ……………………………………………..........Signature of Shareholder(s)……………………………………………..........................Signature of Proxyholder(s)…………………………………………………………...........
Note:
1. This form of proxy in order to be effective should be duly completed and deposited at the registered office of the Company not less than 48 hours before commencement of the meeting.
2. In the case of a Corporation, this Proxy shall be either given under the Common Seal or signed on behalf by an Attorney or Officer of the Corporation.
3. * This is only optional. Please fill up the Item Nos. as appearing in the Notice of the Annual General Meeting. If you leave the Item Nos. blank, your proxy will be entitled to vote in the manner as he/she thinks appropriate.
4. Shareholders/Proxies are requested to desist from using mobile phones during the proceedings of the Annual General Meeting.