tsunami probability in the caribbean region - woods hole · tsunami probability in the caribbean...
TRANSCRIPT

Tsunami Probability in the Caribbean Region
TOM PARSONS1 and ERIC L. GEIST
1
Abstract—We calculated tsunami runup probability (in excess of 0.5 m) at coastal sites throughout the
Caribbean region. We applied a Poissonian probability model because of the variety of uncorrelated tsunami
sources in the region. Coastlines were discretized into 20 km by 20 km cells, and the mean tsunami runup rate
was determined for each cell. The remarkable *500-year empirical record compiled by O’LOUGHLIN and
LANDER (2003) was used to calculate an empirical tsunami probability map, the first of three constructed for this
study. However, it is unclear whether the 500-year record is complete, so we conducted a seismic moment-
balance exercise using a finite-element model of the Caribbean-North American plate boundaries and the
earthquake catalog, and found that moment could be balanced if the seismic coupling coefficient is c ¼ 0.32.
Modeled moment release was therefore used to generate synthetic earthquake sequences to calculate 50 tsunami
runup scenarios for 500-year periods. We made a second probability map from numerically-calculated runup
rates in each cell. Differences between the first two probability maps based on empirical and numerical-modeled
rates suggest that each captured different aspects of tsunami generation; the empirical model may be deficient in
primary plate-boundary events, whereas numerical model rates lack backarc fault and landslide sources. We thus
prepared a third probability map using Bayesian likelihood functions derived from the empirical and numerical
rate models and their attendant uncertainty to weight a range of rates at each 20 km by 20 km coastal cell. Our
best-estimate map gives a range of 30-year runup probability from 0–30% regionally.
Key words: Tsunami, Caribbean, hazard, earthquake.
1. Introduction
On Sunday, August 4, 1946, a M ¼ 8.1 earthquake struck off the northeastern shore
of the Dominican Republic that caused extensive damage and loss of life. Luis Miura, a
United Press correspondent, described the subsequent tsunami at Ciudad Trujillo: ‘‘With
a swelling roar it rolled up the bay and smashed against the towns. Dwellings and shops
were swept away by the waves. Slabs of walls and roofs were hurled inland from the
shore.’’ The tsunami is thought to have killed 1790 people at Matancitas who went to
collect fish from the exposed shore when the sea receded after the earthquake; the water
returned as a 2.4 m wave that encroached nearly 1 km inland (O’LOUGHLIN and LANDER,
2003). Significant runups were recorded at Puerto Rico as well as many other sites on
Hispaniola; in this paper we define significant tsunami runup to be in excess of 0.5 m. At
least 10 significant tsunamis have been documented in the northern Caribbean since 1498,
1 U.S. Geological Survey, Menlo Park, CA, U.S.A.
Pure appl. geophys. 165 (2009) 2089–2116 � Birkhauser Verlag, Basel, 2008
0033–4553/08/112089–28
DOI 10.1007/s00024-008-0416-7Pure and Applied Geophysics

six of which are known to have resulted in loss of life. Previous tsunamis destroyed Port
Royal, Jamaica, killing an estimated 2000 people in 1692, killed at least 10 Jamaicans on
the island’s south coast in 1780, and damaged the north coast of Hispaniola and the
Virgin Islands in 1842. Population increases mean that now, 35.5 million people in the
northern Caribbean region are at risk from tsunami inundation (GRINDLAY et al., 2005).
In this paper we attempt to map out spatial variations in the probability of hazardous
Caribbean tsunamis by using the lengthy historic record in combination with numerical
modeling techniques. We first calculate purely empirical probabilities using the observed
record. We then investigate whether the *500-yr historical record is likely to be complete
by comparing the observed and expected regional seismic moment as calculated with a
finite-element model of Caribbean plate subduction. We then use the modeled slip-rate
distribution in combination with tsunami generation and hydrodynamic models for
individual earthquakes to calculate multiple synthetic tsunami catalogs. We lastly produce
a probability map of the region where tsunami probabilities calculated from the long-term
synthetic catalog are combined with the empirical model using a Bayesian method.
2. Historical Tsunami Catalog
2.1. Empirical Runup Frequencies
A motivating factor in making a probabilistic tsunami hazard assessment for the
Caribbean region is the remarkable written record that has its first observation dating
back to 1498. We identify 116 individual observations of tsunami runups in excess of
0.5 m in Table 1 that were used to establish empirical estimates of Caribbean tsunami
frequency. To calculate empirical tsunami frequency, we gridded the Caribbean region
into 20 km by 20 km cells, and summed the number of runup observations (C0.5 m) in
each cell (Fig. 1). The rate within a cell is simply the number of observed events divided
by the total observation time. We use the total catalog duration for observation time so
that the open intervals can be included.
The empirical tsunami record shows evidence for highest activity in the northern
Caribbean region, especially the islands of Hispaniola, Puerto Rico, and the Virgin
Islands in the Greater Antilles, and the northern end of the Lesser Antilles along the
Caribbean subduction zone (Fig. 1). There is little to no record for much of Cuba and the
South American coastline west of Venezuela having been affected in the past 500 yrs,
which could be a reporting issue. Although, this pattern of tsunami activity is mirrored by
the distribution of large earthquakes (Fig. 2), which would likely be felt regionally.
A key question is to what extent the observed spatial distribution of runups is related
to the distribution of earthquake sources vs. areas that might be sheltered from high-
amplitude tsunamis by benefit of location (areas protected by other islands that lie in
principal propagation paths for example). A further important question regarding the
empirical catalog is whether 500 years is long enough to represent the full hazard. For
2090 T. Parsons and E. L. Geist Pure appl. geophys.,
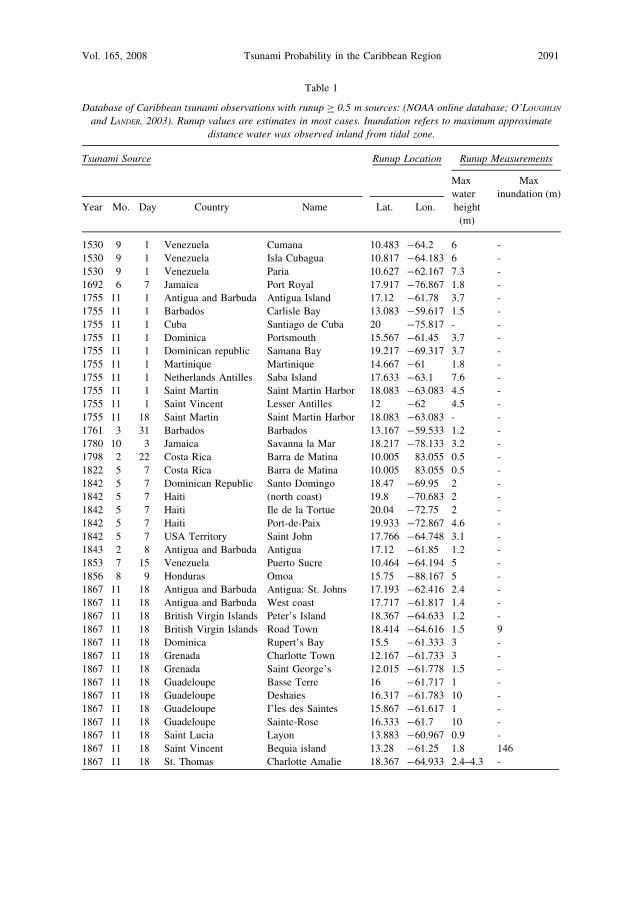
Table 1
Database of Caribbean tsunami observations with runup C 0.5 m sources: (NOAA online database; O’LOUGHLIN
and LANDER, 2003). Runup values are estimates in most cases. Inundation refers to maximum approximate
distance water was observed inland from tidal zone.
Tsunami Source Runup Location Runup Measurements
Max
water
Max
inundation (m)
Year Mo. Day Country Name Lat. Lon. height
(m)
1530 9 1 Venezuela Cumana 10.483 -64.2 6 -
1530 9 1 Venezuela Isla Cubagua 10.817 -64.183 6 -
1530 9 1 Venezuela Paria 10.627 -62.167 7.3 -
1692 6 7 Jamaica Port Royal 17.917 -76.867 1.8 -
1755 11 1 Antigua and Barbuda Antigua Island 17.12 -61.78 3.7 -
1755 11 1 Barbados Carlisle Bay 13.083 -59.617 1.5 -
1755 11 1 Cuba Santiago de Cuba 20 -75.817 - -
1755 11 1 Dominica Portsmouth 15.567 -61.45 3.7 -
1755 11 1 Dominican republic Samana Bay 19.217 -69.317 3.7 -
1755 11 1 Martinique Martinique 14.667 -61 1.8 -
1755 11 1 Netherlands Antilles Saba Island 17.633 -63.1 7.6 -
1755 11 1 Saint Martin Saint Martin Harbor 18.083 -63.083 4.5 -
1755 11 1 Saint Vincent Lesser Antilles 12 -62 4.5 -
1755 11 18 Saint Martin Saint Martin Harbor 18.083 -63.083 - -
1761 3 31 Barbados Barbados 13.167 -59.533 1.2 -
1780 10 3 Jamaica Savanna la Mar 18.217 -78.133 3.2 -
1798 2 22 Costa Rica Barra de Matina 10.005 83.055 0.5 -
1822 5 7 Costa Rica Barra de Matina 10.005 83.055 0.5 -
1842 5 7 Dominican Republic Santo Domingo 18.47 -69.95 2 -
1842 5 7 Haiti (north coast) 19.8 -70.683 2 -
1842 5 7 Haiti Ile de la Tortue 20.04 -72.75 2 -
1842 5 7 Haiti Port-de-Paix 19.933 -72.867 4.6 -
1842 5 7 USA Territory Saint John 17.766 -64.748 3.1 -
1843 2 8 Antigua and Barbuda Antigua 17.12 -61.85 1.2 -
1853 7 15 Venezuela Puerto Sucre 10.464 -64.194 5 -
1856 8 9 Honduras Omoa 15.75 -88.167 5 -
1867 11 18 Antigua and Barbuda Antigua: St. Johns 17.193 -62.416 2.4 -
1867 11 18 Antigua and Barbuda West coast 17.717 -61.817 1.4 -
1867 11 18 British Virgin Islands Peter’s Island 18.367 -64.633 1.2 -
1867 11 18 British Virgin Islands Road Town 18.414 -64.616 1.5 9
1867 11 18 Dominica Rupert’s Bay 15.5 -61.333 3 -
1867 11 18 Grenada Charlotte Town 12.167 -61.733 3 -
1867 11 18 Grenada Saint George’s 12.015 -61.778 1.5 -
1867 11 18 Guadeloupe Basse Terre 16 -61.717 1 -
1867 11 18 Guadeloupe Deshaies 16.317 -61.783 10 -
1867 11 18 Guadeloupe I’les des Saintes 15.867 -61.617 1 -
1867 11 18 Guadeloupe Sainte-Rose 16.333 -61.7 10 -
1867 11 18 Saint Lucia Layon 13.883 -60.967 0.9 -
1867 11 18 Saint Vincent Bequia island 13.28 -61.25 1.8 146
1867 11 18 St. Thomas Charlotte Amalie 18.367 -64.933 2.4–4.3 -
Vol. 165, 2008 Tsunami Probability in the Caribbean Region 2091

Table 1
contd.
Tsunami Source Runup Location Runup Measurements
Max
water
Max
inundation (m)
Year Mo. Day Country Name Lat. Lon. height
(m)
1867 11 18 St. Thomas St. Thomas Harbor 18.367 -64.933 9.1–18.3 -
1867 11 18 St. Thomas West Gregerie Channel 18.328 -64.955 9 -
1867 11 18 St. Thomas Little Saba 18.341 -64.982 12 -
1867 11 18 St. Thomas Water Island 18.323 -64.952 7 -
1867 11 18 St. Thomas Hassel Island 18.3 -64.96 4.9 -
1867 11 18 St. Thomas Prince Rupert’s Ledge 18.33 -64.926 7 -
1867 11 18 St. Croix Christiansted and
Frederiksted
17.756 -64.799 7.6–9 -
1867 11 18 USA Territory Puerto Rico: Arroyo 17.983 -66.05 6.1 40
1867 11 18 USA Territory Puerto Rico: Bahia de San
Juan
18.45 -66.117 0.9 -
1867 11 18 USA Territory Puerto Rico: Fajardo 18.34 65.66 6.1 -
1867 11 18 USA Territory Puerto Rico: Salinas 17.975 -66.29 6.1 -
1867 11 18 USA Territory Puerto Rico: Vieques 18.15 -65.45 6.1 -
1867 11 18 USA Territory Puerto Rico: Culebra 18.305 -65.3 6.1 -
1867 11 18 USA Territory Puerto Rico: Yabucoa 18.033 -65.883 1.37 -
1867 11 18 USA Territory Charlotte amalie 18.367 -64.933 6 -
1867 11 18 USA Territory Frederiksted 17.717 -64.883 7.6 76
1867 11 18 USA Territory Hassel Island 18.3 -64.96 4.9 -
1867 11 18 USA Territory Saint Croix 17.75 -64.75 7 -
1868 3 17 Saint Vincent Bequia Island 13 -61.25 0.9 21
1868 3 17 USA Territory Puerto Rico: Arroyo 17.983 -66.05 1.5 -
1868 3 17 USA Territory Charlotte Amalie 18.367 -64.933 0.6 -
1882 9 7 Panama San Blas Archipelago 9.533 -78.917 3 -
1900 10 29 Venezuela Puerto Tuy 10.333 -65.917 10 -
1902 8 30 Martinique Fort de France 14.6 -61.083 1 -
1906 1 31 Panama Naos Is. 8.917 -79.533 0.7 -
1907 1 14 Jamaica Annotto Bay 18.267 -76.767 2.2 9
1907 1 14 Jamaica Buff Bay 18.233 -76.667 2.5 -
1907 1 14 Jamaica Hope Bay 18.2 -76.567 2.5 -
1907 1 14 Jamaica Kingston Harbor 17.967 -76.8 2.5 -
1907 1 14 Jamaica Ocho Rios 18.4 -77.1 2.5 -
1907 1 14 Jamaica Orange Bay 18.367 -78.317 2.5 -
1907 1 14 Jamaica Port Antonio 18.167 -76.45 2.5 -
1907 1 14 Jamaica Port Maria 18.367 -76.9 2.4 -
1907 1 14 Jamaica Saint Ann’s Bay 18.433 -77.2 2.5 -
1907 1 14 Jamaica Sheerness Bay 18.317 -76.8 2.5 -
1916 4 25 Panama Isla Col–n 9.385 -82.265 0.5 -
1916 4 25 Panama Bocas del Toro 9.333 -82.55 0.6 -
1916 4 25 Panama Careening Cay 9.333 -81.75 1.3 -
1918 10 11 British Virgin
Islands
Tortola Island 18.667 -64.65 0.7 -
1918 10 11 Dominican
Republic
Rio Ozama 18.47 -69.95 0.7 -
2092 T. Parsons and E. L. Geist Pure appl. geophys.,

Table 1
contd.
Tsunami Source Runup Location Runup Measurements
Max
water
Max
inundation (m)
Year Mo. Day Country Name Lat. Lon. height
(m)
1918 10 11 USA Territory Puerto Rico: Aguadilla 18.45 -67.133 3.7 -
1918 10 11 USA Territory Puerto Rico: Arecibo 18.448 -66.733 0.6 -
1918 10 11 USA Territory Puerto Rico: Bahia de
Boqueron
18.463 -66.084 1.1 -
1918 10 11 USA Territory Puerto Rico: Caja de
Muertos
17.867 -66.533 1.5 15
1918 10 11 USA Territory Puerto Rico: Cayo
Cardona
17.959 -66.365 0.75 -
1918 10 11 USA Territory Puerto Rico: Guanica 17.983 -66.917 0.5 -
1918 10 11 USA Territory Puerto Rico: Isabela 18.5 -67.033 2 -
1918 10 11 USA Territory Puerto Rico: Isla Mona 18.08 -67.9 4 -
1918 10 11 USA Territory Puerto Rico: Mayaguez 18.217 -67.15 1.5 -
1918 10 11 USA Territory Puerto Rico: Punta
Agujereada
18.51 -67.167 6.1 -
1918 10 11 USA Territory Puerto Rico: Punta
Borinquen
18.484 -67.169 4.5 100
1918 10 11 USA Territory Puerto Rico: Punta
Higuero
18.367 -67.267 5.5 -
1918 10 11 USA Territory Puerto Rico: Rio
Culebrinas
18.4 -67.183 4 -
1918 10 11 USA Territory Puerto Rico: Rio Grande
de Loiza
18.45 -65.883 1 -
1918 10 11 USA Territory Saint Thomas: Krum Bay 18.329 -64.961 1.2 -
1931 10 1 Cuba Playa Panchita 22.95 -80.417 1 -
1946 8 4 Dominican
Republic
Northern coast 19.7 -70.5 4.6 -
1946 8 4 Dominican
Republic
Nagua 19.417 -69.817 5 -
1946 8 4 Dominican
Republic
Rio Boba 19.467 -69.867 5 -
1946 8 4 USA Territory Puerto Rico: San Juan 18.483 -66.133 0.66 -
1946 8 8 USA Territory Puerto Rico: San Juan 18.483 -66.133 0.6 -
1953 5 31 Dominican
Republic
Puerto Plata 19.8 -70.683 0.06 -
1969 12 25 Barbados Barbados 13.167 -59.533 0.46 -
1976 2 4 Honduras Puerto Cortes 15.833 -87.917 0.45 -
1969 12 25 Dominica Dominica 15.5 -61.3 0.12 -
1985 3 16 Guadeloupe Basse Terre 16 -61.717 0.12 -
1989 11 1 USA Territory Puerto Rico: Cabo Rojo 18.083 -67.15 0.1 -
1991 4 22 Costa Rica R’o Mo’n 9.73 -82.84 3 -
1991 4 22 Costa Rica Puerto Viejo 10.5 -83.5 2 -
1991 4 22 Panama Coco Solo 9.37 -79.881 0.76 -
1991 4 22 Panama Isla de Carenero 9.33 -82.33 2–3 -
1991 4 22 Panama Portobelo 9.55 -79.617 0.6 -
1997 12 26 Montserrat Old Road Bay 16.737 -62.236 3 80
Vol. 165, 2008 Tsunami Probability in the Caribbean Region 2093

example, it is evident that the southern part of the Caribbean subduction zone in the
Lesser Antilles has produced fewer earthquakes and tsunamis during the past 500 years
than has the northern part (Figs. 1, 2). This might reflect genuine differences in the
seismic production of the zone, or the southern part of the subduction zone might
represent a seismic gap waiting to be filled. We address these issues in detail in
Sections 4 and 5. In the next section, we pursue calculation of empirical tsunami
probabilities under the assumption that the catalog observations are complete and
representative.
3. Monte Carlo Estimation of Rate-Model Uncertainty
Tsunamis affect broad areas as they propagate away from their sources, and a region
as complex as the Caribbean has widely distributed tsunamigenic sources. Since tsunamis
resulting from multiple seismic sources operating at different recurrence intervals can
affect a given coast, the best probability model is one that is time-independent, such as a
Poisson process built around an exponential distribution (e.g., GEIST and PARSONS, 2006;
2008). We thus used observed tsunami runups to calculate rate parameters (k) in the
exponential probability density distribution as
f ðtÞ ¼ ke�kt; for t [ 0; ð1Þ
which when integrated over a given duration gives a time-independent cumulative
probability.
Estimation of the event rate k (inverse of the recurrence interval) for a small number
of observations is subject to considerable uncertainty. Further, since the observation
period begins at an arbitrary time, and we have no knowledge of what happened before
1498, we wish to treat the first open interval properly. To accomplish both objectives, we
rely on Monte Carlo modeling of the tsunami runup frequencies (PARSONS, 2008).
Table 1
contd.
Tsunami Source Runup Location Runup Measurements
Max
water
Max
inundation (m)
Year Mo. Day Country Name Lat. Lon. height
(m)
2003 7 12 Guadeloupe Deshaies 16.317 -61.783 1 25
2003 7 12 Guadeloupe Vieux Habitants 16.05 -61.75 0.6 -
2003 7 12 Montserrat Farm Bay 16.737 -67.153 4 -
Figure 1
Top shows individual runup observations as noted in Table 1. Circle size represents runup in m. Bottom panel
shows summed number of runup observations per 20 km by 20 km cell and the corresponding empirical Poisson
probability.
c
2094 T. Parsons and E. L. Geist Pure appl. geophys.,

-90˚ -86˚ -82˚ -78˚ -74˚ -70˚ -66˚ -62˚
6˚
10˚
14˚
18˚
22˚
Tsunami runup observations
1 24 6 8 10 12
Runup (m)
-90˚ -86˚ -82˚ -78˚ -74˚ -70˚ -66˚ -62˚
6˚
10˚
14˚
18˚
22˚
Tsunami frequency in 20 km by 20 km cell
Runup frequency
30-yr empirical Poisson probability
1 2 ≥3
5% 10% ≥15%
GreaterAntilles
Lesser Antilles
Bahamas
Columbia
Venezuela
Jamaica
Puerto RicoHispaniola
Panama
Cuba
Costa Rica
Vol. 165, 2008 Tsunami Probability in the Caribbean Region 2095

Here it is assumed that if an exponential distribution is used to calculate tsunami
probability, then the best way to estimate the range of possible rate parameters that fit
the observations is to find those that most commonly reproduce observed tsunami
frequencies. The first step was construction of a series of distributions that covered all
reasonable rates (1/10 to 1/3000 yrs-1). Rates were randomly drawn 100,000 times from
each series and assembled into tsunami event sequences. These Monte Carlo sequences
began with events given freedom to happen any time before 1498. The extra events were
not counted into the frequencies, but did establish starting points for Monte Carlo
sequences. This was needed because it is expected that tsunamis occurred prior to 1498,
but we have no knowledge of them other than that. In this way we avoided the arbitrary
starting time having undue influence on rate estimation.
Each event sequence that matched the observed frequencies was tallied. A
distribution of matches to the observed record was produced (Fig. 3), and the mode
-90˚ -88˚ -86˚ -84˚ -82˚ -80˚ -78˚ -76˚ -74˚ -72˚ -70˚ -68˚ -66˚ -64˚ -62˚ -60˚
6˚
8˚
10˚
12˚
14˚
16˚
18˚
20˚
22˚
24˚
5.5 6.5
Magnitude
7.5 8.5
Figure 2
500-yr catalog of large (M C 5) earthquakes in the Caribbean region. Locations of older events are
approximations based on historical accounts. The completeness threshold varies with time, and is likely *M = 7 before the 20th century. Sources: SHEPHERD, 1993; NEIC, Significant Worldwide Earthquakes (NOAA).
2096 T. Parsons and E. L. Geist Pure appl. geophys.,

(most frequent value), median, or mean of that distribution can be taken to represent the
rate parameter. This approach also simultaneously estimates uncertainty in the rate
parameter resulting from small sampling, and the influence of the open intervals. The
Monte Carlo techniques we used are discussed in detail by PARSONS (2008) in relation to
paleoseismic earthquake observations.
4. Poisson Probability of Tsunami Occurrence from Empirical Analysis
In the Poisson model, probability depends on the rate parameter (discussed in
Section 2) and the duration (Dt) of the interval of interest. Probability is given by
PðDtÞ ¼ 1� e�kDt: ð2Þ
Probability calculation from the rates shown in Figure 3 then is straightforward using
Equation (2). Results are shown in Figures 1 and 4. As can be seen from Figure 4, there is
considerable spread in probability that results from the spread of possible rates (Fig. 3)
consistent with the observed number of runups C0.5 m in the 20 km by 20 km cells.
Mean 30-year probability for sites with one event over the observation period is 4%, for
cells with two events the mean is 7%, for three events the mean is 12%, and for four
Modeled Tsunami Frequency 1502-2006
0
0.2
0.4
0.6
0.8
1
0
0.2
0.4
0.6
0.8
1
0 1000 2000 3000 0 1000 2000 3000
Recurrence interval (yr)
Re
lative
pro
ba
bili
ty
1 event 2 events
3 events 4 events
Figure 3
Normalized histograms of the Monte Carlo sequences that matched the indicated event frequencies over 500-
year intervals. Ranges of exponential rate parameters are shown (expressed as the inverse, which is recurrence
interval) that can match observed frequencies of Caribbean tsunami runups (C 0.5 m), which range from 1 to 4
events in *500 yrs.
Vol. 165, 2008 Tsunami Probability in the Caribbean Region 2097

events the mean is 17%. Using empirical rates under a time-independent Poisson model
thus causes the hazard estimate to be greatest where runups were most frequently
observed in the past, and assumes that future events will most likely happen where past
ones have. In contrast, a time-dependent, renewal, or seismic gap model might place the
greatest hazard near submerged faults where little activity has been observed in the recent
past.
Given the wide range of credible probability results shown in Figure 4, it is difficult
to know what single value might best represent tsunami hazard. The mean value is an
obvious choice, although the distributions of possible probability values are not
symmetrical (e.g., Gaussian). Thus it is perhaps more useful to think of the hazard in
terms of confidence bounds. For example if the empirical model is assumed to be valid,
then we can state with 95% confidence that a site that experienced four tsunamis with
runup in excess of 0.5 m since 1498 has a 3% to 42% probability of another such event in
the next 30 yrs (Table 2).
A central question surrounding exclusive use of empirical tsunami runup rates for
future hazard calculations is how complete the empirical record is, and how
representative the past *500-yr-period has been. Examination of Table 1 shows a
much higher frequency of observation in the 19th century as compared with the
previous centuries, implying that increased population density increased the number of
Empirical Tsunami Probability
0
0.2
0.4
0.6
0.8
1
0
0.2
0.4
0.6
0.8
1
30-yr Probability (%)
Lik
elih
ood
1 event
3 events
0 10 20 30 40 50 60 0 10 20 30 40 50 60
2 events
4 events
Figure 4
Normalized histograms indicating the likelihood of a given 30-yr Poisson probability resulting from the rate
parameters shown in Figure 3, for 20 km by 20 km cells with observations of 1 to 4 events in *500 yrs. Means
and confidence intervals are given in Table 2.
2098 T. Parsons and E. L. Geist Pure appl. geophys.,

observations. Additionally, since the Caribbean catalog is dominated by local-
earthquake generated tsunamis, we want to know whether the 500-yr earthquake
catalog has released all the expected seismic moment, or whether there needs to be
more large earthquakes to satisfy a moment deficit. In the next section we discuss
calculation of expected moment and comparison with the moment expressed in the
seismic catalog.
5. Is the 500-year Tsunami Catalog Representative? Expected vs. Expressed Seismic
Moment in the Caribbean Region
5.1. Model Development
To calculate the expected seismic moment rate in the Caribbean region, we developed
a 3-D finite-element model of long-term fault slip (Fig. 5). The purpose was to displace
the Caribbean plate relative to North America to simulate slip along the primary plate
boundaries. The model tracked the amount of expected slip, which was used to calculate
seismic moment accumulation, assuming all of the slip in the seismogenic zone is
released during earthquakes. The results gave a sum of total moment that we used to
compare with observed seismic moment, as well as a spatial distribution of expected
moment. The nature of the problem made a 3-D approach necessary because: (1)
Caribbean plate motion is rotational relative to North America, (2) the model involves
permanent deformation because lithosphere is variably consumed along the subduction
front, and (3) the calculated relative slip rates and rakes are used to generate synthetic
tsunamigenic earthquake events.
The model consisted of two blocks that represented the lithosphere on either side of the
Caribbean plate boundary with the North American plate. To define the plate boundary
geometry, we used surface traces of the primary strike-slip boundary and subduction front
(MANN et al., 2007). We extended the strike-slip boundary on the northwestern edge of the
Caribbean plate vertically through the crust. We defined the subduction-zone shape from
Table 2
30-year probabilities of tsunami runup (C0.5 m) in the 20 km by 20 km cells shown in Figure 1, which contain
observations from 1 to 4 past events. 95% and 67% confidence intervals on the probability values as well as
means (PARSONS, 2008) are given.
30-Year Poisson probability from empirical rates
Confidence bound 1 Event 2 Events 3 Events 4 Events
97.5% 14% 23% 32% 42%
83.5% 6% 11% 18% 26%
Mean 4% 7% 12% 17%
16.5% 1% 2% 4% 8%
2.5% 1% 1% 2% 3%
Vol. 165, 2008 Tsunami Probability in the Caribbean Region 2099

the database of CRUCIANI et al. (2005), who used seismic tomography and earthquake
hypocenters to constrain subducted slab geometries. We interpolated the transition from
strike-slip into subduction smoothly as shown in Figures 5 and 6. The model Caribbean
plate was displaced relative to the North American plate according to the Caribbean-North
American ‘‘hybrid’’ rotation pole (latitude = 64.9�N, longitude = 250.5�E, x = 0.214�/
Myr) of DEMETS et al. (2000), based in part on GPS measurements reported by DIXON et al.
(1998).
Volumes were meshed by first estimating element edge lengths for all defining lines.
The element edge lengths on these lines were then refined for curvature and proximity of
faults in the geometry. The mesh was thus finest where volumes changed shape the most,
and in regions of greatest complexity. The model was composed of 24,509 elastic
tetrahedral elements defined by 36,412 nodes with an average node spacing of 50 km.
Elements were defined by 10 nodes, each having three degrees of freedom (translations in
the nodal x, y, and z directions).
Our Caribbean finite-element model had two major contact zones, representing
subduction of the North American plate beneath the Caribbean, and transition into strike-
-90˚ -86˚ -82˚ -78˚ -74˚ -70˚ -66˚ -62˚12˚
14˚
16˚
18˚
20˚
22˚
24˚
20 mm/yr
Differential stress (MPa)
0 15 30
Figure 5
Finite-element model of the submerged parts of the Caribbean-North American plate boundaries. Strike-slip
boundary to the northwest is vertical, while the subduction zone is variably dipping according to CRUCIANI et al.
(2005). The top figure shows displacement vectors, and the color shading on the Caribbean plate below displays
small variations in differential stress resulting from displacement.
2100 T. Parsons and E. L. Geist Pure appl. geophys.,

slip motion along the northern Caribbean plate to the northwest (Fig. 5). These faults were
deformable, and were constructed from contact elements obeying the Coulomb failure
stress (CF) relation
CF � �sf þ lrn; ð3Þ
where �sf is shear stress acting on a fault surface, l is the friction coefficient, and rn is
the component of stress acting normal to a fault surface. Contact elements had zero
thickness and were welded to the sides of tetrahedral elements. We assigned a low
friction coefficient (l ¼ 0.2) to the subduction and strike-slip interfaces (e.g., CATTIN
et al., 1997; RUFF, 2002; KOPF and BROWN, 2003).
We loaded our model by decomposing the Caribbean plate rotation into E-W and
N-S vectors at each model node within the Caribbean plate. These combined motions
resulted in a *18–20 mm/yr of relative plate motion depending on the plate-boundary
orientation. The Caribbean block was constrained not to sink along its base, but could
slip freely, simulating the asthenosphere-lithosphere boundary. Rather than subducting
the North American plate beneath the Caribbean in the model, we caused the
Caribbean plate to override North America, which generates the equivalent moment
accumulation, but is a much simpler model because no subduction channel was
required. We ran the model for a 10,000-year simulation to ensure steady-state slip
along the plate boundaries and extracted 500-yr periods for comparison with observed
seismic moment release. Total slip divided by 500 years gave the long-term slip rate
distribution.
-90˚ -88˚ -86˚ -84˚ -82˚ -80˚ -78˚ -76˚ -74˚ -72˚ -70˚ -68˚ -66˚ -64˚ -62˚ -60˚
6˚ 8˚
10˚ 12˚
14˚ 16˚
18˚ 20˚
22˚ 24˚
Modeled Slip in 500 yr (m)0 4 8 12 >16
0
1
2
0 150 300 450 600 750
3
Slip (m
)
900 1050 1200 1350 1500 1650 1800 1950Distance (km)
2100 2250 2400 2550
0
1
20
150300
450600
750
3
Slip (
m)
Distance (km)
Calculated coseismic slip in 500 yr (m)
Figure 6
Distribution of slip rate on the submerged Caribbean plate boundary for a 500-yr simulation period (color
shading). Approximate seismic slip compiled from the catalog in Figure 2 is shown for comparison (red graph).
Slip was derived from reported magnitudes using regressions of WELLS and COPPERSMITH (1994).
Vol. 165, 2008 Tsunami Probability in the Caribbean Region 2101

6. Comparison between Expected and Observed Seismic Moment
Our model of Caribbean-North American plate interaction enabled calculation of
expected slip rate distribution _uð Þ on the interplate megathrust and strike-slip zones,
which was used to calculate the tectonic moment rate _mtð Þ distribution, as _mt ¼ lA _u;
where A is fault area and l is the shear modulus (where l¼3�1011 dyne-cm-2) (Fig. 6).
We calculated the total tectonic moment for a 505-year period (duration of seismic
catalog AD1502-2006) to be 7.42�1029 dyne-cm on the surface shown in Figure 6. The
expressed seismic moment sum from the earthquake catalog shown in Figure 2 is
2.39�1029 dyne-cm. Thus the ratio of expressed seismic to expected tectonic moment
release (coupling coefficient) is c ¼ 0.32. We note that KAGAN (2002a; 2002b) arrived at
a similar low coupling coefficient for the Caribbean region using modern catalog data,
and a simpler plate boundary model. One of two conclusions can be drawn from this
result: (1) The seismic coupling coefficient around the Caribbean plate is low, or (2) there
is a large temporal seismic gap waiting to be expressed.
If we were to accept the low seismic coupling estimate for the Caribbean region, then we
could further conclude that the tsunami runup probabilities we calculated from the
empirical rates represent a valid forecast. However, if the 500-yr observation period is
deficient, then we require an alternative runup rate model. We pursue such a model in
Section 7, where the slip rates derived from the finite-element model are discretized into
earthquake events, some of which are tsunamigenic (i.e., result in C 0.5 m runups). We then
applied a hydrodynamic model to assess runup potential throughout the Caribbean region.
7. Numerical Models of Expected Tsunami Frequency
If we know the slip rate along the Caribbean plate boundaries, we can calculate the
expected rate of earthquakes greater than a certain magnitude using a Gutenberg-Richter
magnitude-frequency distribution. Some percentage of these events is expected to cause
observable tsunamis. Tsunami runups for a given earthquake can be approximated using
standard generation and hydrodynamic models; multiple realizations can give an estimate
of the likely range in frequencies at any coastal location in the model (e.g., GEIST and
PARSONS, 2006). Given the very real possibility that the past 500-yr observations are
incomplete, we describe the development of an alternative tsunami rate model below,
which is based on the modeled slip-rate distribution from Section 4 and the assumption of
complete seismic coupling along the Caribbean plate boundary.
7.1. General Probabilistic Framework
To develop synthetic tsunami catalogs, we used a general aggregation equation for
determining the rate (k) at which tsunamis will exceed a certain runup (R0) at a coastal
location as
2102 T. Parsons and E. L. Geist Pure appl. geophys.,

kðR [ R0Þ ¼X
type¼i
X
zone¼j
mij
ZPðR [ R0jwijÞfwðwijÞ dw; ð4Þ
where the index i refers to the type of tsunami source (e.g., i ¼ 1 earthquakes, i ¼ 2
landslides, etc.), index j the zone which that source occurs in (according to some
particular zonation scheme), mij the mean rate for source (i,j), wij the tsunami source
parameters for source (i, j), fw the probability distribution for tsunami source parameters,
and P(R > R0|wij) is the probability that runup will exceed R0 at the coastal location for
a given source parameter (GEIST and PARSONS, 2006; GEIST et al., 2008). For this study,
we only considered earthquake-generated tsunamis scaled according to the seismic
moment m, where moment magnitude M is related to seismic moment according
to M = (2/3)(log m-9.05) (HANKS and KANAMORI, 1979). Equation (4) therefore is
reduced to
kðR [ R0Þ ¼X
zone¼j
mj
Z1
mt
PðR [ R0jmjÞfjðmÞ dm : ð5Þ
Propagation distance was included in the term P(R > R0|mj) since this term is
computed by numerical propagation models described below. The term fj(m) is the
frequency-moment distribution for earthquakes in zone j. We used the tapered
Gutenberg-Richter (G-R) distribution in which the complementary cumulative (survivor)
distribution Fj(m) is given by (KAGAN, 2002a; KAGAN and JACKSON, 2000)
FjðmÞ ¼ mt=mð Þbexpmt � m
mc
� �; m�mt; ð6Þ
where b is the shape parameter for the distribution, mt is the threshold moment, and
mc is the corner moment that controls the tail of the distribution.
7.2. Seismic Zonation
The northern boundary of the Caribbean plate was divided into 7 zones in which
the rate calculations were aggregated. The first two zones represented the eastern and
western parts of the Cayman transform fault, separated by the Cayman spreading
center (LEROY et al., 2000). The remaining zones represented the Greater Antilles
(zones 3 through 5) and Lesser Antilles (zones 6 and 7) subduction zones. For each
zone, the frequency-moment distribution parameters were set equal to the parame-
ters determined from the global study of BIRD and KAGAN (2004) according to
their tectonic setting: i.e., zones 1 and 2, b = 0.64 and Mc¼8.14 for slow oceanic
transform faults and zones 3 through 7, b = 0.64 and Mc¼9.58 for subduction zones.
See BIRD and KAGAN (2004) regarding uncertainty estimates associated with these
values.
Vol. 165, 2008 Tsunami Probability in the Caribbean Region 2103

The source rate parameter for each zone (tj) was defined as the activity rate for
earthquakes of m C mt and is related to the seismic moment rate _msð Þ as described by
KAGAN (2002b):
t mð Þ ¼ ð1� bÞ _ms
mbm1�bc Cð2� bÞem=mc
; ð7Þ
where C is the gamma function. The ‘‘tectonic’’ moment rate _mtð Þ is given by
_mt ¼ lA _u; where l is the shear modulus, A is the area of the seismogenic part of the fault
zone, and _u is the long-term slip rate along the fault determined from the finite-element
modeling described in Section 5. _ms and _mt are related by a seismic coupling parameter
(0 B c B 1) : _ms ¼ c _mt: For a fault that has no aseismic slip at seismogenic depths,
c ¼ 1. Since the empirical catalog already provides a low-coupling rate estimate, we
assumed that c ¼ 1 in determining the maximum activity rate of earthquakes for each
zone from the tectonic rate.
To calculate _mt for each zone, the long-term slip rate _uð Þ from the finite-element
modeling was averaged over seismogenic depths. Fault lengths (L) were taken from the
surface traces of the faults. For the oceanic transform faults, the fault width at
seismogenic depths is taken from BIRD and KAGAN (2004), whereas for the subduction
faults, the fault width was taken from ten BRINK and LIN (2004). A constant shear
modulus of 30 GPa was assumed for each zone.
7.3. Monte Carlo Implementation
We implemented Equation (5) using a Monte Carlo-type procedure in which a
synthetic earthquake catalog of fixed duration was prepared from random samples of the
distribution defined by Equations (6) and (7). Two different Monte Carlo analyses were
conducted: (1) Tsunami results were aggregated from 310 M C 7 earthquakes
representing a single catalog of duration 4,442 years and (2) tsunami results were
aggregated from 50 separate earthquake catalogs of duration 500 years each (approx-
imately the duration of the observed earthquake catalog). The number of earthquakes
sampled from the tapered G-R distribution (Equation (8)) varied for each source zone,
depending on _mt: For a given time period s, the expected number of earthquakes of
moment m C mt was derived from (7) (cf., MCCAFFREY, 1994):
N m [ mtð Þ ¼ ð1� bÞ _mts
mbt m1�b
c Cð2� bÞemt=mc
: ð8Þ
The location of each earthquake was randomly varied within each source zone
according to a uniform distribution.
Other source parameters were scaled with respect to seismic moment according to
global scaling relationships. For subduction zones, the fault length scaling relationship
was taken from the LAY et al. (1982) catalog of subduction zone earthquake source
2104 T. Parsons and E. L. Geist Pure appl. geophys.,

parameters, updated to include more recent earthquakes (GEIST, 2002). For the oceanic
transform fault, the WELLS and COPPERSMITH (1994) scaling relationship was used. Fault
width was assumed to be half the fault length (GELLER, 1976), with a maximum fault
width constrained by the dimensions of the seismogenic zone. Each earthquake had a
stochastic slip distribution that conformed to a k-2 slip spectrum (HERRERO and BERNARD,
1994; TSAI, 1997) with average slip scaled to seismic moment based on the global
subduction zone earthquake catalog.
For each earthquake, vertical and horizontal coseismic seafloor displacements are the
initial conditions for tsunami modeling (TANIOKA and SATAKE, 1996). We calculated these
displacements using OKADA’s (1985) analytic functions that are applicable for an elastic
half-space. A finite rise-time of 20 s was applied uniformly along the rupture zone, with
no preferred rupture propagation direction. We modeled the propagation of the tsunami
wavefield using a finite-difference approximation to the linear long-wave equations
(AIDA, 1969; SATAKE, 2002). A 2-arc-minute bathymetric grid (SMITH and SANDWELL,
1997) was used with an 8 s time step that satisfied the Courant-Friedrichs-Lewy stability
criterion for the Caribbean region. A reflection boundary condition was imposed at the
250 m isobath, whereas a radiation boundary condition was imposed along the open-
ocean boundaries of the model (REID and BODINE, 1968). Runup (R0) was approximated
from the coarse grid model for use in Equation (4) by finding the nearest model grid point
to the coastline and then multiplying the peak offshore tsunami amplitude by a factor of 3
that roughly accounts for shoaling amplification and the runup process itself (SATAKE,
1995, 2002; SHUTO, 1991). For the first experiment (single 4,442-year synthetic catalog),
the exceedance probability was calculated for 3 runup threshold values: 0.5 m, 1.0 m,
and 2.0 m (Fig. 7). For the second experiment (fifty 500-year catalogs), the exceedance
probability was calculated using a 0.5 m runup threshold for each of the 50 synthetic
catalogs.
It is likely that runup varies considerably within the scale of our cell size.
Significant focusing of tsunami waves from nearshore bathymetric variation can
greatly amplify tsunami runup as exemplified in high resolution runup models (e.g.,
TITOV and SYNOLAKIS, 1997; MATSUYAMA et al., 1999), such that the runup thresholds
we use in our coarse-grid model are low-estimate values. Furthermore, in coastal low-
lying regions, inundation from low runup regions can cover a large area, as
exemplified by the 1 km inundation distance from the 2.5 m runup at Matanzas,
Dominican Republic, in 1946.
We found that the fifty 500-year catalogs captured more variability in spatial runup
distribution than did the 4442-year catalog. This resulted from the multiple catalogs
having more variety of earthquake locations since a few very large events can
dominate the distribution of moment, and consequently regional tsunami runup
distribution, due to the Gutenberg-Richter constraint. We thus used the set of fifty 500-
year catalogs to determine mean rates and uncertainties in the probability calculations
that follow.
Vol. 165, 2008 Tsunami Probability in the Caribbean Region 2105

8. Poisson Probability of Tsunami Occurrence from Numerical Modeling
8.1. Probability Mapping
Numerical models of expected tsunami frequency gave us an alternative estimate of
the rate of R0 C 0.5-m runup throughout the Caribbean region (Fig. 7). We calculated
Poisson probabilities from these rates in the same manner as was used for the empirical
observations, and the results are shown in Figure 8. We used the mean frequency in
Equation (2) at each 20 km by 20 km coastal cell from the 50 Monte Carlo runs described
in Section 7.
Results from mapping probability from modeled tsunami rates show highest
probability (*20–30% in 30 years) along the Lesser Antilles. The Greater Antilles also
show significant runup probability in the 10–20% range, particularly in Puerto Rico and
eastern Hispaniola. The majority of sites around the Caribbean region show low
probability, which is evident in Figure 8. The overall distribution of values shows that the
vast majority of 20 km by 20 km cells have 0–5% probability in 30 years (Fig. 9).
One concern with the probability results from the numerical model is that we used a
simplified version of the plate boundary, which might have the effect of maximizing
hazard along the subduction front, and omitting events emanating from accommodating
intra-plate faults, particularly in the intra- and backarc regions of the Greater Antilles and
the convergence zone north of Panama and South America (e.g., AUDEMARD and
AUDEMARD, 2002), that were not in our model. In Section 10, we investigate ways of
Figure 7
Example calculation of expected runup (C0.5 m) frequency over a 4442-yr period calculated from the expected
seismic moment rate shown in Figure 6.
2106 T. Parsons and E. L. Geist Pure appl. geophys.,

combining the numerically modeled rates with the empirical rates to account for the
sources not included in the numerical models, but first we compare results from the two
methods below.
9. Comparison of Empirically-Derived Probability with Model-Derived Values
One of the key reasons for undertaking the numerical modeling exercise for tsunami
runup frequency was to determine if there were low-probability events associated with
-90˚ -86˚ -82˚ -78˚ -74˚ -70˚ -66˚ -62˚
6˚
10˚
14˚
18˚
22˚
30-yr model Poisson probability
0% 20% 40%30%10%
Figure 8
Mapping of 30-year Poisson probability calculations made from numerical modeling of tsunami runup rates.
30-yr Probability (%)
Lik
elih
ood
0
0.2
0.4
0.6
0.8
1
0 10 20 30 40 50 60 0 10 20 30 40 50 60
Figure 9
Histograms of 30-year runup (C 0.5 m) probability for all Caribbean coastlines modeled. The left panel shows
results mapped in Figure 8; the vast majority of 20 km by 20 km cells have less than 5% probability. The right
panel shows the distribution of values greater than 5%. The gray line gives an example shape from the empirical
tsunami probability distributions shown in Figure 4 for comparison.
Vol. 165, 2008 Tsunami Probability in the Caribbean Region 2107
plate boundary earthquakes not present in the empirical record, and if the spatial
frequency patterns were similar, or greatly different. The probability map shown in
Figure 8 indicates many regions with low probability that were not evident in the
empirical mapping shown in Figure 1, including the coasts of Venezuela, Columbia,
Cuba, and the Bahamas. These regions show 30-year probabilities of less than 5%, which
loosely translates into rates fewer than 1 in 500 years, which may explain why the
empirical map has virtually no observations from these regions (Fig. 1). These regions
where the numerical-modeling results augment the empirical are straightforward to
combine in an overall mapping, since there is no overlap. Where the two methods overlap
and potentially conflict will require a relative weighting process for combination.
To assess similarities and differences between the empirical and numerically modeled
results, we made two maps with the same probability thresholds (5–15%; Fig. 10).
Perhaps the most obvious difference between the two models where they have
overlapping results is along the Lesser Antilles, where modeled probabilities are nearly
uniformly higher than empirical. This is a result of the numerical model having 100%
seismic coupling vs. the observed seismic release being *30% of the expected moment
release. The model-derived probabilities are also higher than empirical along southern
Hispaniola (Fig. 10).
There are places where probabilities derived from the empirical rate observations are
higher than the numerical models predict. In particular this is seen at Puerto Rico,
Jamaica, Costa Rica, and Panama. In these instances it is likely that the empirical model
has captured localized tsunami events that were caused by landslides and/or accommo-
dating faults associated with the plate boundary that were not specifically included in the
numerical model sources. Many of the secondary earthquake sources not included have
very slow and uncertain slip rates, making implementation into a numerical model
difficult.
10. Combination of Empirical and Modeled tsunami Runup Rates through a Bayesian
Process with Likelihood Functions
As with any probabilistic forecast, we were confronted with considerable uncertainty
from many sources. Key sources of epistemic uncertainty included: (1) Expected tsunami
runup rates, (2) tsunami sources not explicitly known or included in the model, (3)
seismic coupling coefficient of the Caribbean plate boundary zones, and (4) degree of
completeness in the empirical tsunami catalog. To encompass these uncertainties into our
probability estimates, we created a Bayesian framework to build tsunami runup rate
estimates within 20 km by 20 km cells that contain coastlines throughout the Caribbean
region. The key advantage of our approach is that the model results end up being
weighted by their attendant uncertainties.
We combined model and empirical rates which addressed the above-listed
uncertainties as follows. (1) Runup-rate uncertainty: Monte Carlo rate-model fits to the
2108 T. Parsons and E. L. Geist Pure appl. geophys.,

empirical rates as shown in Figure 3 along with results from 50 numerical model runs
provided arrays of possible runup rate values at each cell. (2) Unknown/unaccounted-for
tsunami sources: Inclusion of the empirical rates added sources not accounted for in the
numerical model (most-affected areas can be seen by comparing the panels of Fig. 10);
our forecast may suffer from incomplete knowledge if events not covered by our
numerical models have also not occurred in the empirical catalog over the past 500 years.
-90˚ -86˚ -82˚ -78˚ -74˚ -70˚ -66˚ -62˚
6˚
10˚
14˚
18˚
22˚
30-yr empirical Poisson probability
5% 10% ≥15%
6˚
10˚
14˚
18˚
22˚
30-yr model Poisson probability
5% 10% ≥15%
Jamaica
Puerto Rico
Hispaniola
Panama
Costa Rica
Figure 10
Comparison between (top) model-derived 30-year Poisson probability of tsunami runups (C 0.5 m) and (bottom)
empirically derived values. See text for discussion.
Vol. 165, 2008 Tsunami Probability in the Caribbean Region 2109

(3) Seismic coupling: The empirical model implies low seismic coupling of 0.32, whereas
the numerical models have coupling coefficients of 1.0. (4) Completeness: We accounted
for low-rate plate-boundary events potentially not seen in the empirical catalog with the
50 numerical model runs.
As described in more detail below, we combined our model-derived runup rates
with empirical rates according to the following set of logic-tree branches: In cells where
there were no empirical values, the numerical model-derived rates were given full
weight. Conversely, empirical rates were given full weight where numerical model rates
were zero. Lastly, where there were empirical and model rate estimates within the same
cells, we used Bayesian likelihood functions to weight the two models. Distributions
shown in Figure 3 give the relative probability of different rates for a Poisson model
that could have caused the empirical observations. Similarly, results from the 50
numerical model runs produced relative probability (Fig. 11) of different rates in each
model cell.
To rank different rate models for each cell where more than one estimate existed, we
made a likelihood calculation to weight the models. In the simplest binomial case
likelihood is defined as proportional to the probability of obtaining results A given a fixed
hypothesis H resulting from a set of fixed data. If A1 and A2 are two possible mutually
exclusive results, then
P A1 or A2jHð Þ ¼ P A1jHð Þ þ P A2jHð Þ; ð9Þ
and likelihood is thus
L HjAð Þ ¼ kP AjHð Þ; ð10Þ
where k is an arbitrary constant.
The results from likelihood functions were used to obtain the final weights using
Bayes’ rule (Equation (11)), where the posterior distribution is proportional to the
likelihood function multiplied by the prior. For our study, we used a uniform
(noninformative) prior such that there was equal probability of all rates in each coastal
20 km by 20 km cell. Further, since we update the prior twice, once for the empirical
result, and again for the numerical result, the same result is achieved by simply
multiplying the two likelihood functions. Thus the likelihood of a given rate k where
there were empirical estimates (e1) and numerical-modeled estimates (e2) is
Lðkje1; e2Þ ¼ k p1ðe1jkÞ½ � p2ðe2jkÞ½ �; ð11Þ
where p(e1|k) is the probability of rate k based on the Monte Carlo fits shown in
Figure 3, and p(e2| k) is the probability of rate k from the 50 numerical model runs. The
constant k is used for normalizing the weights so that they add to 1.
We used likelihood functions to weight rate models over a range from 0 to 10 events
in the 500-yr observation period. We considered rates between 0 and 10 events in
500 years for all cells, assuming no further prior information. Final rates were found by
weighted means of the posterior rates. To summarize the process, where model and
2110 T. Parsons and E. L. Geist Pure appl. geophys.,

10/5
00
9/5
00
8/5
00
7/5
00
6/5
00
5/5
00
4/5
00
3/5
00
2/5
00
1/5
00
0/5
00
10.90.80.70.60.50.40.30.20.1
0
Lik
elih
oo
d
Lik
elih
oo
d
Rate (yr )
20-km by 20-km cell
0
0.1
0.2
0.3
0.4
0.5
0.6
0.7
0.8
0.9
1
A
B
10/5
00
9/5
00
8/5
00
7/5
00
6/5
00
5/5
00
4/5
00
3/5
00
2/5
00
1/5
00
0/5
00
10.90.80.70.60.50.40.30.20.1
0
Lik
elih
oo
d
Lik
elih
oo
d
Rate (yr )-1
-1
20-km by 20-km cell
0
0.1
0.2
0.3
0.4
0.5
0.6
0.7
0.8
0.9
1
Figure 11
(a) Normalized histogram (likelihood) of tsunami runup (R0 C 0.5 m) rates in 214 20-km by 20-km cells defined
using likelihood functions from empirical rates (Fig. 3) and from 50 numerical modeling simulations. (b)
Normalized histogram of runup rates from numerical modeling in 685 cells where there were no empirical
observations. Mean values from these distributions were used in the best-estimate probability calculations
mapped in Figure 12.
Vol. 165, 2008 Tsunami Probability in the Caribbean Region 2111

empirical values were both absent for a given rate, the posterior distribution was zeroed.
When one model provided rates, its likelihood function was used to update the priors, and
when both empirical and numerical rate estimates were available, likelihood was
developed through combination and renormalization using Equation (11), which was then
used to update the priors.
-90˚ -86˚ -82˚ -78˚ -74˚ -70˚ -66˚ -62˚
6˚
10˚
14˚
18˚
22˚
Best estimate: 30-yr probability 0% 15% 30%
Jamaica
Puerto Rico
Lesser Antilles
Bahamas
PanamaCosta Rica
Nicaragua
Honduras
Belize
Cayman Islands
Mexico
Hispaniola
Cuba
ColumbiaVenezuela
-90˚ -86˚ -82˚ -78˚ -74˚ -70˚ -66˚ -62˚
6˚
10˚
14˚
18˚
22˚
Kingston
Roseau
CastriesFort-de-France
Kingstown
St. George’s
San Juan Road Town
Cockburn Town
CartagenaPuerto Limon
Bluefields
Puerto Barrios
Belize City
George Town
Santo Domingo
Port-Au-PrinceSantiago
de Cuba
Basseterre
Basse-Terre
Willemstad
Cunana
La Ceiba
Colon
St.
John’s
Port of Spain
Figure 12
30-year tsunami runup (r C 0.5 m) probability in 20 km by 20 km cells at coastal sites in the Caribbean region
made from combined rate estimates from empirical and numerical models. Lower panel shows locations of cities
listed in Table 3.
2112 T. Parsons and E. L. Geist Pure appl. geophys.,
11. Probability Results from the Rate Model
We calculated a best-estimate set of 30-year tsunami runup probability (R0 C 0.5 m)
values for the 20 km by 20 km coastal cells throughout the Caribbean region (Fig. 12).
Generally, the highest probabilities (typically 10–20% in 30 years for runup R0 C 0.5 m)
we calculated were for the eastern Lesser Antilles, including the Islands of Antigua,
Barbuda, Dominica, Guadeloupe, Martinique, Greneda, St. Kitts, Nevis, St. Lucia, St.
Vincent, and the Grenadines (Fig. 12, Table 3). Additionally, relatively higher hazard
was calculated for the easternmost Greater Antilles including the Virgin Islands, Puerto
Rico, and eastern Hispaniola. These sites were elevated primarily because of their
proximity to the Caribbean-North American subduction plate boundary. However, we
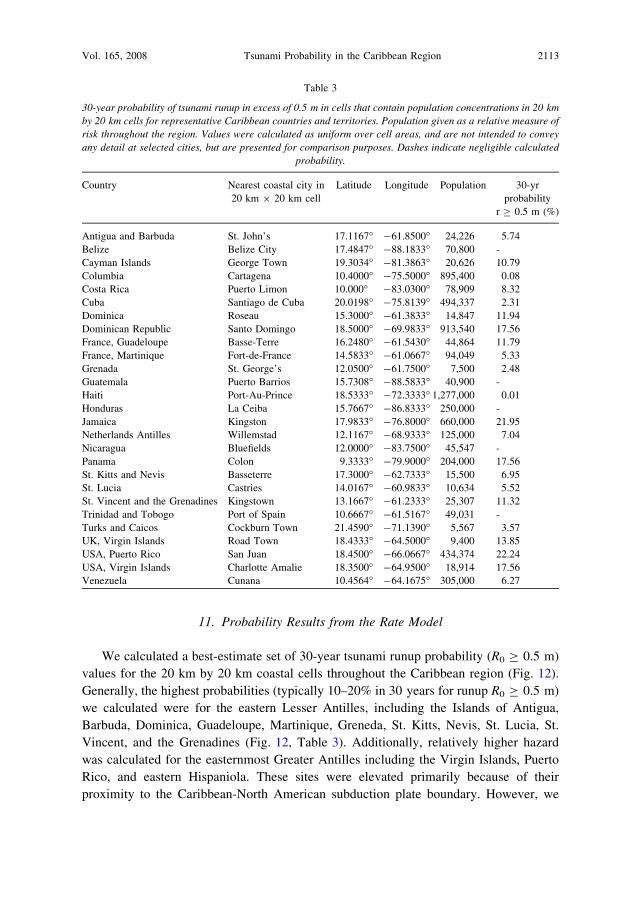
Table 3
30-year probability of tsunami runup in excess of 0.5 m in cells that contain population concentrations in 20 km
by 20 km cells for representative Caribbean countries and territories. Population given as a relative measure of
risk throughout the region. Values were calculated as uniform over cell areas, and are not intended to convey
any detail at selected cities, but are presented for comparison purposes. Dashes indicate negligible calculated
probability.
Country Nearest coastal city in
20 km 9 20 km cell
Latitude Longitude Population 30-yr
probability
r C 0.5 m (%)
Antigua and Barbuda St. John’s 17.1167� -61.8500� 24,226 5.74
Belize Belize City 17.4847� -88.1833� 70,800 -
Cayman Islands George Town 19.3034� -81.3863� 20,626 10.79
Columbia Cartagena 10.4000� -75.5000� 895,400 0.08
Costa Rica Puerto Limon 10.000� -83.0300� 78,909 8.32
Cuba Santiago de Cuba 20.0198� -75.8139� 494,337 2.31
Dominica Roseau 15.3000� -61.3833� 14,847 11.94
Dominican Republic Santo Domingo 18.5000� -69.9833� 913,540 17.56
France, Guadeloupe Basse-Terre 16.2480� -61.5430� 44,864 11.79
France, Martinique Fort-de-France 14.5833� -61.0667� 94,049 5.33
Grenada St. George’s 12.0500� -61.7500� 7,500 2.48
Guatemala Puerto Barrios 15.7308� -88.5833� 40,900 -
Haiti Port-Au-Prince 18.5333� -72.3333� 1,277,000 0.01
Honduras La Ceiba 15.7667� -86.8333� 250,000 -
Jamaica Kingston 17.9833� -76.8000� 660,000 21.95
Netherlands Antilles Willemstad 12.1167� -68.9333� 125,000 7.04
Nicaragua Bluefields 12.0000� -83.7500� 45,547 -
Panama Colon 9.3333� -79.9000� 204,000 17.56
St. Kitts and Nevis Basseterre 17.3000� -62.7333� 15,500 6.95
St. Lucia Castries 14.0167� -60.9833� 10,634 5.52
St. Vincent and the Grenadines Kingstown 13.1667� -61.2333� 25,307 11.32
Trinidad and Tobogo Port of Spain 10.6667� -61.5167� 49,031 -
Turks and Caicos Cockburn Town 21.4590� -71.1390� 5,567 3.57
UK, Virgin Islands Road Town 18.4333� -64.5000� 9,400 13.85
USA, Puerto Rico San Juan 18.4500� -66.0667� 434,374 22.24
USA, Virgin Islands Charlotte Amalie 18.3500� -64.9500� 18,914 17.56
Venezuela Cunana 10.4564� -64.1675� 305,000 6.27
Vol. 165, 2008 Tsunami Probability in the Caribbean Region 2113

also forecasted relatively high hazard from the Cayman transform boundary at Jamaica,
driven primarily by empirical rate estimates. The empirical rate model also significantly
effected for Costa Rica and Panama, likely caused by events along the north Panama
convergence zone in addition to basin-wide tsunamis, for which we calculated relatively
high probabilities (Fig. 12).
For reference, we give the calculated 30-year probability of tsunami runup
(r C 0.5 m) in cells that contain population concentrations in 20 km by 20 km cells
for representative Caribbean countries and territories in Table 3. Probabilities do not take
into account the relative vulnerability of the populations at different sites related to
specifics of coastal topography and very near-shore bathymetry. Thus maps and tables
presented here might best be applied as sources of relative hazard, subject to corrections
related to local site variations
12. Conclusions
Combination of a *500-year period of tsunami runup observations with numerical
modeling enabled us to make a coarsely-sampled (20 km by 20 km) tsunami hazard map
of the Caribbean region. The primary source of uncertainty is the degree of completeness
that a 500-year catalog represents. We found that we cannot quantify this uncertainty
without knowledge of the seismic coupling coefficient of the Caribbean-North American
plate boundary zones. We thus used likelihood functions to weight an empirical tsunami
runup rate estimate that suggested a very low seismic coupling coefficient of c ¼ 0.32
against numerical models of tsunami runup that assumed full coupling (c ¼ 1).
Combining empirical and modeled rates made up for some of the deficiencies in each
approach; the empirical catalog is likely not a complete record of all possible interplate
tsunami sources, whereas the numerical model did not account for accommodating intra-
plate faults and/or landslide sources that appear likely causes of tsunamis in the empirical
record.
REFERENCES
AIDA, I. (1969), Numerical experiments for the tsunami propagation–The 1964 Niigata tsunami and the 1968
Tokachi-Oki tsunami, Bull. Earthq. Res. Insti. 47, 673–700.
AUDEMARD, F. E. and AUDEMARD, F. A. (2002), Structure of the Merida Andes, Venezuela: Relations with the
South America-Caribbean geodynamic interaction, Tectonophysics 345, 299–327.
BIRD, P. and KAGAN, Y. Y. (2004), Plate-tectonic analysis of shallow seismicity: Apparent boundary width, beta-
value, corner magnitude, coupled lithosphere thickness, and coupling in 7 tectonic settings, Bull. Seismol.
Soc. Am. 94, 2380–2399.
CATTIN, R., LYON-CAEN, H., and CHERY, J. (1997), Quantification of interplate coupling in subduction zones and
forearc topography, Geophys. Res. Lett. 24, 1563–1566.
CRUCIANI, C., CARMINATI, E., and DOGLIONI, C. (2005), Slab dip vs. lithosphere age: No direct function, Earth
Planet. Sci. Lett. 238, 298–310.
2114 T. Parsons and E. L. Geist Pure appl. geophys.,
DEMETS, C., JANSMA, P. E., MATTIOLI, G. S., DIXON, T. H., FARINA, F., BILHAM, R., CALAIS, E., and MANN, P.
(2000), GPS geodetic constraints on Caribbean-North American plate motion, Geophys. Res. Lett. 27, 437–
440.
DIXON, T. H., FARINA, F., DEMETS, C., JANSMA, P., MANN, P., and CALAIS, E. (1998), Relative motion between the
Caribbean and North American plates and related boundary zone deformation from a decade of GPS
observations, J. Geophys. Res. 103, 15157–15182.
GEIST, E. L. (2002), Complex earthquake rupture and local tsunamis, J. Geophy. Res. 107, doi:10.1029/
2000JB000139.
GEIST, E. L. and PARSONS, T. (2006), Probabilistic analysis of tsunami hazards, Natural Hazards 37, 277–314.
GEIST, E. L. and PARSONS, T. (2008), Distribution of tsunami inter-event times, Geophys. Res. Lett. 35,
doi:10.1029/2007GL032690.
GEIST, E. L., PARSONS, T., tEN BRINK, U. S., and LEE, H. J., Tsunami Probability. In The Sea (eds. Bernard, E. N.
and Robinson, A. R.) (Harvard University Press, Cambridge, Massachusetts (2008)), in press.
GELLER, R. J. (1976), Scaling relations for earthquake source parameters and magnitudes, Bull. Seismol. Soc.
Am. 66, 1501–1523.
GRINDLAY, N. R., HEARNE, M., and MANN, P. (2005), High risk of tsunami in the northern Caribbean, EOS Trans.
86, 121–132.
HANKS, T. C. and KANAMORI, H. (1979), A moment magnitude scale, J. Geophys. Res. 84, 2348–2350.
HERRERO, A. and BERNARD, P. (1994), A kinematic self-similar rupture process for earthquakes, Bull. Seismol.
Soc. Am. 84, 1216–1228.
KAGAN, Y. Y. (2002a), Seismic moment distribution revisited: I, Statistical Results, Geophys. J. Int. 148,
520–541.
KAGAN, Y. Y. (2002b), Seismic moment distribution revisited: II, Moment conservation principle, Geophys.
J. Int. 149, 731–754.
KAGAN, Y. Y, and Jackson, D. D. (2000), Probabilistic forecasting of earthquakes, Geophys. J. Int. 143,
438–453.
KOPF A., and BROWN, K. M. (2003), Friction experiments on saturated sediments and their implications for the
stress state of the Nankai and Barbados subduction thrusts, Marine Geology 202, 193–210.
LAY, T., KANAMORI, H., and RUFF, L. J. (1982), The asperity model and the nature of large subduction zone
earthquakes, Earthq. Predict. Res. 1, 3–71.
LEROY, S., MAUFFRET, A., PATRIAT, P., and MERCIER DE LEPINAY, B. (2000), An alternative interpretation of the
Cayman trough evolution from a reidentification of magnetic anomalies, Geophys. J. Int. 141, 539–557.
MANN, P., ROGERS, R., and GAHAGAN, L., Overview of plate tectonic history and its unresolved tectonic problems.
In Central America: Geology, Resources, and Hazards vol. 1 (eds. Bundschuh, J. and Alvarado, G.) (Taylor
and Francis/Balkema, Leiden, The Netherlands 2007), pp. 201–237.
MATSUYAMA, M., WALSH, J. P., and YEH, H. (1999), The effect of bathymetry on tsunami characteristics at
Sissano Lagoon, Papua New Guinea, Geophys. Res. Lett. 26, 3513–3516.
MCCAFFREY, R. (1994), Dependence of earthquake size distributions on convergence rates at subduction zones,
Geophys. Res. Lett. 21, 2327–2330.
OKADA, Y. (1985), Surface deformation due to shear and tensile faults in a half-space, Bull. Seismol. Soc. Am.
75, 1135–1154.
O’LOUGHLIN, K. F. and LANDER, J. F., Caribbean Tsuanmis: A 500-Year History from 1498–1998 (Kluwer
Academic Publishers, Dordrecht, The Netherlands (2003)).
PARSONS, T. (2008), Monte Carlo method for determining earthquake recurrence parameters from short
paleoseismic catalogs: Example calculations for California, J. Geophys. Res. 112, doi:10.1029/
2007JB004998.
REID, R. O. and BODINE, B. R. (1968), Numerical model for storm surges in Galveston Bay, J. Waterways and
Harbors Div., A.C.E. 94, 33–57.
RUFF, L. J. , State of stress within the Earth. In International Handbook of Earthquake and Engineering
Seismology, 81A (eds. Lee, W. H. K., Kanimori, H., Jennings, P. C., and Kisslinger, C.) (Academic Press,
Amsterdam 2002) pp. 539–557.
SATAKE, K. (1995), Linear and nonlinear computations of the 1992 Nicaragua earthquake tsunami, Pure Appli.
Geophys., 144, 455–470.
Vol. 165, 2008 Tsunami Probability in the Caribbean Region 2115
SATAKE, K., Tsunamis. In International Handbook of Earthquake and Engineering Seismology, 81A (eds. Lee,
W. H. K., Kanimori, H., Jennings, P. C., and Kisslinger, C.) (Academic Press, Amsterdam 2002) pp. 437–451.
SHEPHERD, J.B., Seismic hazard in the eastern Caribbean. In The Practice of Earthquake Hazard Assessment (ed.
McGuire, R.K.) (IASPEI, Denver (1993)) pp. 51–55.
SHUTO, N. (1991), Numerical simulation of tsunamis–Its present and near future, Natural Hazards 4, 171–191.
SMITH, W. H. F. and SANDWELL, D. T. (1997), Global seafloor topography from satellite altimetry and ship depth
soundings, Science 277, 1957–1962.
TANIOKA, Y. and SATAKE, K. (1996), Tsunami generation by horizontal displacement of ocean bottom, Geophys.
Res. Lett. 23, 861–865.
tEN BRINK, U. S. and LIN, J. (2004), Stress interaction between subduction earthquakes and forearc strike-slip
faults: Modeling and application to the northern Caribbean plate boundary, J. Geophys. Res. 109,
doi:12310.11029/12004JB003031.
TITOV, V. V. and SYNOLAKIS, C. E. (1997), Extreme inundation flows during the Hokkaido-Nansei-Oki tsunami,
Geophys. Res. Lett. 24, 1315–1318.
TSAI, C. P. (1997), Slip, stress drop and ground motion of earthquakes: A view from the perspective of fractional
Brownian motion, Pure Appli. Geophys. 149, 689–706.
WELLS, D. L., and COPPERSMITH, K. J. (1994), New empirical relationships among magnitude, rupture length,
rupture width, rupture area, and surface displacement, Bull. Seismol. Soc. Am. 84, 974–1002.
(Received December 12, 2007, revised August 19, 2008)
Published Online First: December 19, 2008
To access this journal online:
www.birkhauser.ch/pageoph
2116 T. Parsons and E. L. Geist Pure appl. geophys.,