ts 101 388 - v1.3.1 - transmission and multiplexing (tm
TRANSCRIPT

ETSI TS 101 388 V1.3.1 (2002-05)Technical Specification
Transmission and Multiplexing (TM);Access transmission systems on metallic access cables;
Asymmetric Digital Subscriber Line (ADSL) -European specific requirements
[ITU-T Recommendation G.992.1 modified]

ETSI
ETSI TS 101 388 V1.3.1 (2002-05)2
ReferenceRTS/TM-06025
Keywordsaccess, ADSL, basic, endorsement, interaction,
interworking, IP, ISDN, transmission
ETSI
650 Route des LuciolesF-06921 Sophia Antipolis Cedex - FRANCE
Tel.: +33 4 92 94 42 00 Fax: +33 4 93 65 47 16
Siret N° 348 623 562 00017 - NAF 742 CAssociation à but non lucratif enregistrée à laSous-Préfecture de Grasse (06) N° 7803/88
Important notice
Individual copies of the present document can be downloaded from:http://www.etsi.org
The present document may be made available in more than one electronic version or in print. In any case of existing orperceived difference in contents between such versions, the reference version is the Portable Document Format (PDF).
In case of dispute, the reference shall be the printing on ETSI printers of the PDF version kept on a specific network drivewithin ETSI Secretariat.
Users of the present document should be aware that the document may be subject to revision or change of status.Information on the current status of this and other ETSI documents is available at
http://portal.etsi.org/tb/status/status.asp
If you find errors in the present document, send your comment to:[email protected]
Copyright Notification
No part may be reproduced except as authorized by written permission.The copyright and the foregoing restriction extend to reproduction in all media.
© European Telecommunications Standards Institute 2002.All rights reserved.
DECTTM, PLUGTESTSTM and UMTSTM are Trade Marks of ETSI registered for the benefit of its Members.TIPHONTM and the TIPHON logo are Trade Marks currently being registered by ETSI for the benefit of its Members.3GPPTM is a Trade Mark of ETSI registered for the benefit of its Members and of the 3GPP Organizational Partners.
ETSI
ETSI TS 101 388 V1.3.1 (2002-05)3
Contents
Intellectual Property Rights ................................................................................................................................6
Foreword.............................................................................................................................................................6
1 Scope ........................................................................................................................................................7
2 References ................................................................................................................................................7
3 Definitions and abbreviations...................................................................................................................83.1 Definitions..........................................................................................................................................................83.2 Abbreviations .....................................................................................................................................................9
4 Configuration of ADSL............................................................................................................................94.1 Methods for configuring ADSL over POTS.......................................................................................................94.1.1 EC ADSL over POTS...................................................................................................................................94.1.2 FDD ADSL over POTS ................................................................................................................................94.2 Methods for configuring ADSL over ISDN .......................................................................................................94.2.1 EC ADSL over ISDN .................................................................................................................................104.2.1.1 Downstream transmit spectral mask .....................................................................................................104.2.1.2 Upstream transmit spectral mask ..........................................................................................................114.2.2 FDD ADSL over ISDN...............................................................................................................................114.2.2.1 Downstream transmit spectral mask .....................................................................................................124.2.2.2 Upstream transmit spectral mask ..........................................................................................................124.3 Aggregate transmit power ................................................................................................................................13
5 Transmission performance objectives and test methods ........................................................................135.1 Test procedures ................................................................................................................................................145.1.1 Test set-up definition ..................................................................................................................................145.1.2 Noise injection network ..............................................................................................................................155.1.2.1 Differential mode injection ...................................................................................................................155.1.2.2 Common mode injection .......................................................................................................................155.1.3 Signal and noise level definitions ...............................................................................................................155.1.4 Noise levels calibration...............................................................................................................................165.1.4.1 Differential mode noise calibration.......................................................................................................165.1.4.2 Common mode noise calibration...........................................................................................................165.1.5 Startup training procedure ..........................................................................................................................175.2 Test loops .........................................................................................................................................................175.2.1 Background information .............................................................................................................................175.2.2 Test loop topology ......................................................................................................................................185.2.3 Test loop accuracy ......................................................................................................................................195.3 Impairment generators......................................................................................................................................195.3.1 Functional description.................................................................................................................................195.3.2 Cable cross-talk models ..............................................................................................................................215.3.3 Individual impairment generators ...............................................................................................................225.3.3.1 Equivalent NEXT disturbance generator [G1.xx] .................................................................................225.3.3.2 Equivalent FEXT disturbance generator [G2.xx]..................................................................................225.3.3.3 Background noise generator [G3] .........................................................................................................225.3.3.4 White noise generator [G4]...................................................................................................................225.3.3.5 Broadcast RF noise generator [G5].......................................................................................................235.3.3.6 Amateur RF noise generator [G6].........................................................................................................245.3.3.7 Impulse noise generator [G7]................................................................................................................245.3.3.8 Line sharing noise generator [G8].........................................................................................................245.3.4 Profiles of the individual impairment generators........................................................................................245.3.4.1 Frequency domain profiles of generators G1 and G2 ...........................................................................245.3.4.1.1 Frequency domain profiles for EC ADSL over POTS ....................................................................255.3.4.1.2 Frequency domain profiles for EC ADSL over ISDN.....................................................................265.3.4.1.3 Frequency domain profiles for FDD ADSL over POTS .................................................................275.3.4.1.4 Frequency domain profiles for FDD ADSL over ISDN..................................................................285.3.4.2 Time domain profiles of generator G1-G4............................................................................................29

ETSI
ETSI TS 101 388 V1.3.1 (2002-05)4
5.4 Transmission performance tests .......................................................................................................................315.4.1 Bit error ratio requirements.........................................................................................................................315.4.1.1 Control of transmit power in opposing direction ..................................................................................315.4.2 Measuring noise margin..............................................................................................................................315.4.2.1 Measuring cross-talk noise margin .......................................................................................................315.4.2.2 Measuring impulse noise margin ..........................................................................................................315.4.3 Test sequences ............................................................................................................................................325.4.4 Micro-interruptions.....................................................................................................................................335.5 Performance objectives ....................................................................................................................................335.5.1 Performance objectives for EC ADSL over ISDN .....................................................................................345.5.2 Performance objectives for EC ADSL over POTS.....................................................................................385.5.3 Performance objectives for FDD ADSL over ISDN...................................................................................425.5.4 Performance objectives for FDD ADSL over POTS ..................................................................................46
6 ADSL splitter .........................................................................................................................................496.1 Impact on existing baseband services...............................................................................................................50
Annex A (normative): Distributed cable coefficients for the test loop cables.................................51
Annex B (informative): Transmission of cable sections......................................................................57
B.1 Definition of transmission function and insertion loss...........................................................................57
B.2 Derivation of s-parameters from primary cable parameters...................................................................58
Annex C (informative): ADSL over ISDN configuration of T1.413 based modems.........................59
C.1 Introduction ............................................................................................................................................59
C.2 ATU-C....................................................................................................................................................59C.2.1 Used frequency band ........................................................................................................................................59C.2.2 Nominal aggregate power level........................................................................................................................59C.2.3 Pilot frequency .................................................................................................................................................59C.2.4 Transmit spectral mask.....................................................................................................................................59
C.3 ATU-R....................................................................................................................................................60C.3.1 ATU-R transmitter reference models ...............................................................................................................60C.3.2 Used frequency band ........................................................................................................................................60C.3.3 Nominal aggregate power level........................................................................................................................60C.3.4 Maximum number of data sub-carriers ............................................................................................................61C.3.5 Pilot frequency .................................................................................................................................................61C.3.6 Nyquist frequency ............................................................................................................................................61C.3.7 Modulation by the inverse discrete fourier transform ......................................................................................61C.3.8 Synchronization symbol ...................................................................................................................................61C.3.9 Cyclic prefix .....................................................................................................................................................62C.3.10 Transmit spectral mask.....................................................................................................................................62
C.4 Initialization ...........................................................................................................................................62C.4.1 C-Activate ........................................................................................................................................................62C.4.2 C-ACT2m.........................................................................................................................................................62C.4.3 C-ACT2e ..........................................................................................................................................................62C.4.4 R-Acknowledgment..........................................................................................................................................63C.4.5 R-ACT-REQ.....................................................................................................................................................63C.4.6 R-ACK1m ........................................................................................................................................................63C.4.7 R-ACK1e..........................................................................................................................................................63C.4.8 R-ACK2m ........................................................................................................................................................63C.4.9 R-ACK2e..........................................................................................................................................................63C.4.10 C-REVEILLE...................................................................................................................................................63C.4.11 C-PILOT1.........................................................................................................................................................63C.4.12 R-REVERB1 ....................................................................................................................................................64C.4.13 R-MEDLEY .....................................................................................................................................................64C.4.14 C-MSGS2 .........................................................................................................................................................64C.4.15 R-MSGS2 .........................................................................................................................................................64C.4.16 C-ECT and R-ECT ...........................................................................................................................................64C.4.17 Power Cut-back ................................................................................................................................................65

ETSI
ETSI TS 101 388 V1.3.1 (2002-05)5
C.4.18 C-B&G .............................................................................................................................................................65
Annex D (informative): PSD masks for ADSL over POTS as specified in ITU-TRecommendation G.992.1 .............................................................................67
D.1 ATU-C Downstream transmit spectral mask .........................................................................................67
D.2 ATU-C transmitter PSD mask for reduced NEXT.................................................................................68
D.3 ATU-R Transmitter spectral mask .........................................................................................................69
Annex E (informative): Characteristics of all digital loop signals .....................................................71
E.1 All digital mode ADSL derived from ADSL over POTS ......................................................................71E.1.1 ATU-C downstream transmit spectral mask for overlapped spectrum operation.............................................71E.1.1.1 Passband PSD and response .......................................................................................................................72E.1.2 ATU-C downstream transmit spectral mask for non-overlapped spectrum operation .....................................72E.1.3 ATU-R upstream transmit spectral mask .........................................................................................................72E.1.3.1 Passband PSD and response .......................................................................................................................73
E.2 All digital mode ADSL derived from ADSL over ISDN.......................................................................74E.2.1 ATU-C downstream transmit spectral mask for overlapped spectrum operation.............................................74E.2.2 ATU-C downstream transmit spectral mask for non-overlapped spectrum operation .....................................74E.2.3 ATU-R upstream transmit spectral mask .........................................................................................................74E.2.3.1 Passband PSD and response .......................................................................................................................76
E.3 Aggregate transmit power ......................................................................................................................77
Annex F (informative): Example injection method for noise generator [G8]...................................78
History ..............................................................................................................................................................79

ETSI
ETSI TS 101 388 V1.3.1 (2002-05)6
Intellectual Property RightsIPRs essential or potentially essential to the present document may have been declared to ETSI. The informationpertaining to these essential IPRs, if any, is publicly available for ETSI members and non-members, and can be foundin ETSI SR 000 314: "Intellectual Property Rights (IPRs); Essential, or potentially Essential, IPRs notified to ETSI inrespect of ETSI standards", which is available from the ETSI Secretariat. Latest updates are available on the ETSI Webserver (http://webapp.etsi.org/IPR/home.asp).
Pursuant to the ETSI IPR Policy, no investigation, including IPR searches, has been carried out by ETSI. No guaranteecan be given as to the existence of other IPRs not referenced in ETSI SR 000 314 (or the updates on the ETSI Webserver) which are, or may be, or may become, essential to the present document.
ForewordThis Technical Specification (TS) has been produced by ETSI Technical Committee Transmission and Multiplexing(TM).
The present document, in conjunction with ITU-T Recommendation G.992.1 [2] provides the European specificationsfor ADSL.

ETSI
ETSI TS 101 388 V1.3.1 (2002-05)7
1 ScopeThe present document specifies European requirements for ADSL.
The definition of new line codes and/or transmission systems is outside the scope of the present document.
The present document endorses ITU-T Recommendation G.992.1 [2], the contents of which apply together with theaddition of the modifications being covered herein. In particular the aspects covered by the present document are relatedto:
1) Methods to allow the simultaneous delivery of ADSL and ISDN-BA services [1] on the single pair. For examplethe techniques and redefinition of the ADSL signals/parameters as defined in ITU-T RecommendationG.992.1 [2] to allow ISDN-BA base band signals to occupy frequencies below ADSL (from here onwardsreferred as out-of-band transport).
2) Performance Objectives and Test methods for ADSL over POTS/ISDN-BA.
3) TS 102 080 [1] backward compatibility.
4) Power feeding for the transported ISDN-BA.
5) Latency.
6) ISDN-BA splitter characteristics.
2 ReferencesThe following documents contain provisions which, through reference in this text, constitute provisions of the presentdocument.
• References are either specific (identified by date of publication and/or edition number or version number) ornon-specific.
• For a specific reference, subsequent revisions do not apply.
• For a non-specific reference, the latest version applies.
[1] ETSI TS 102 080 (V1.3.2): "Transmission and Multiplexing (TM); Integrated Services DigitalNetwork (ISDN) basic rate access; Digital transmission system on metallic local lines".
[2] ITU-T Recommendation G.992.1 (1999): "Asymmetrical digital subscriber line (ADSL)transceivers".
[3] ETSI TS 101 388 (V1.1.1): "Transmission and Multiplexing (TM); Access transmission systemson metallic access cables; Asymetric Digital Subscriber Line (ADSL) - Coexistence of ADSL andISDN-BA on the same pair [ANSI T1.413 - 1998, modified]".
[4] ITU-T Recommendation G.996.1 (2001): "Test procedures for digital subscriber line (DSL)transceivers".
[5] ANSI T1.413: "Network to Customer Installation Interfaces - Asymmetric Digital Subscriber Line(ADSL) Metallic Interface".
[6] ETSI TS 101 952-1-1: "Access network xDSL transmission filters; Part 1: ADSL splitters forEuropean deployment; Sub-part 1: Specification of the low pass part of ADSL/POTS splitters".
[7] ETSI TS 101 952-1-2: "Access network xDSL transmission filters; Part 1: ADSL splitters forEuropean deployment; Sub-part 2: Specification of the high pass part of ADSL/POTS splitters".
[8] ETSI TS 101 952-1-3: "Access network xDSL transmission filters; Part 1: ADSL splitters forEuropean deployment; Sub-part 3: Specification of ADSL/ISDN splitters".

ETSI
ETSI TS 101 388 V1.3.1 (2002-05)8
[9] ITU-T Recommendation G.992.2: "Splitterless asymmetric digital subscriber line (ADSL)transceivers".
3 Definitions and abbreviations
3.1 DefinitionsFor the purposes of the present document, the following terms and definitions apply:
characteristic impedance (Z0): property of homogeneous cables that is cable dependent
NOTE: This impedance value can be observed as input impedance, when the other end of the cable is terminatedwith a load having the same impedance Z0.
design impedance (RV): target input and output impedance of the ADSL modem
NOTE: This is 100 Ω for ADSL modems.
downstream: high speed digital data channel(s) in the direction of ALT towards ANT (network to customer premises)
EC ADSL over ISDN: refers to ADSL systems, using overlapped spectra, configured to allow delivery of ISDN-BA orPOTS on the same pair
NOTE: EC ADSL over ISDN systems are configured as described in annex B of ITU-T RecommendationG.992.1 [2].
EC ADSL over POTS: refers to ADSL systems, using overlapped spectra, configured to allow delivery of POTS onthe same pair
NOTE: EC ADSL over POTS systems are configured as described for overlapped PSD masks in annex A ofITU-T Recommendation G.992.1 [2].
electrical length: insertion loss for a loop at a given test frequency fT, normalized to the reference impedance of 135 Ω
FDD ADSL over ISDN: refers to ADSL systems, using reduced NEXT spectra, configured to allow delivery ofISDN-BA or POTS on the same pair
NOTE: FDD ADSL over ISDN systems are configured as described in annex B of ITU-T RecommendationG.992.1 [2], but using the downstream PSD mask described in clause 4.2.2.1.
FDD ADSL over POTS: refers to ADSL systems, using reduced NEXT spectra, configured to allow delivery of POTSon the same pair
NOTE: FDD ADSL over POTS systems are configured as described in annex A of ITU-T RecommendationG.992.1 [2].
reference impedance (RN): chosen impedance used for specifying transmission and reflection characteristics of cablesand test loops
NOTE: ETSI has normalized this value at 135 Ω for a wide range of xDSL performance and conformance tests,including ADSL tests. This value is considered as being a reasonable average of characteristicimpedances (Z0) observed for a wide range of commonly used European distribution cables.
upstream: high speed digital data channel(s) in the direction of ANT towards ALT (customer premises to network)

ETSI
ETSI TS 101 388 V1.3.1 (2002-05)9
3.2 AbbreviationsFor the purposes of the present document, the following abbreviations apply:
2B1Q Baseband linecode for ISDN-BA (4-PAM)4B3T Alternative ISDN-BA baseband linecode with wider frequency spectrum than 2B1QADL All Digital LoopADSL Asymmetric Digital Subscriber LineALT ADSL Line TerminationANT ADSL Network TerminationATM Asynchronous Transfer ModeATU-C ADSL Terminal Unit-Central officeATU-R ADSL Terminal Unit-RemoteAWGN Additive White Gaussian NoiseBER Bit Error RatioEC Echo CancelledFDD Frequency Division Duplexing/DuplexedFEXT Far-End Cross-TalkIDFT Inverse Discrete Fourier TransformISDN Integrated Services Digital NetworkISDN-BA Integrated Service Digital Network Basic Rate AccessLTU Line Termination UnitNEXT Near-End Cross-TalkNTU Network Termination UnitPOTS Plain Old Telephone ServicePRU Pseudo-Random UpstreamPSD Power Spectral Density (single sided)STM Synchronous Transfer Mode
4 Configuration of ADSL
4.1 Methods for configuring ADSL over POTSThe methods for configuring ADSL over POTS are as described in ITU-T Recommendation G.992.1 [2]. Additionalconstraints on ADSL over POTS operation are specified in clauses 4.1.1 and 4.1.2.
4.1.1 EC ADSL over POTS
EC ADSL over POTS shall comply with the requirements in annex A of ITU-T Recommendation G.992.1 [2]. Theupstream transmission shall comply with the transmit spectral mask in clause A.2.4 of ITU-T RecommendationG.992.1 [2] (reproduced in clause D.3). The downstream transmission shall comply with the transmit spectral mask inclause A.1.2 of ITU-T Recommendation G.992.1 [2] (reproduced in clause D.1).
4.1.2 FDD ADSL over POTS
FDD ADSL over POTS shall comply with the requirements in annex A of ITU-T Recommendation G.992.1 [2]. Theupstream transmission shall comply with the transmit spectral mask in clause A.2.4 of ITU-T RecommendationG.992.1 [2] (reproduced in clause D.3). The downstream transmission shall comply with the transmit spectral mask inclause A.1.3 of ITU-T Recommendation G.992.1 [2] (reproduced in clause D.2).
4.2 Methods for configuring ADSL over ISDNThe methods for configuring ADSL over ISDN are described in ITU-T Recommendation G.992.1 [2]. Additionalconstraints on ADSL over ISDN operation are specified in clauses 4.2.1 and 4.2.2. Annex C gives information tomaintain backward compatibility with version 1.1.1 of the present document [3] (version 1.1.1 was based onANSI T1.413 [5]).

ETSI
ETSI TS 101 388 V1.3.1 (2002-05)10
4.2.1 EC ADSL over ISDN
EC ADSL over ISDN systems shall comply with the transmit spectral masks defined in clauses 4.2.1.1 and 4.2.1.2.
All PSD measurements made at the Line port of the ISDN splitter shall measure the spectral power into a resistive loadhaving the same value as the design impedance for ADSL (RV = 100 Ω).
The ISDN port of the ISDN splitter shall be terminated with the appropriate 2B1Q or 4B3T design impedance forISDN-BA as defined in TS 102 080 [1].
It is intended that the degradation impact on the ISDN-BA line system performance be no more than 4,5 dB and 4 dB,for 2B1Q and 4B3T line codes respectively, at the insertion loss reference frequency.
4.2.1.1 Downstream transmit spectral mask
The ATU-C transmit PSD for EC ADSL over ISDN shall be as defined in figure 1 and in table 1.
120 1 104
3 093
11 040Frequencyin kHz0
PSD indBm/Hz
-90 dBm/Hz peak12 dB/octave
-36 dB/octave
-36,5 peak
Measurements are into 100 Ω resistive termination
4 545
-50 dBm power in any1 MHz sliding windowabove 4 545 kHz
-90 dBm/Hz peak
50 80
NOTE: There is a discrepancy between the out-of-band power spectral density limits given in the presentdocument and those given in a recently revised ETSI TS relating to ISDN-BA (TS 102 080 [1] V1.3.1). Theout-of-band limits on ISDN-BA are more stringent than the limits on the ADSL system described in thepresent document. It is acknowledged that there is a need to make the documents consistent. This is forfurther study.
Figure 1: ATU-C transmitted PSD mask
Table 1: Line equations for the ATU-C transmitted PSD mask
Frequency band (kHz) Equation for line (dBm/Hz)0 ≤ f ≤ 50 -9050 < f ≤ 80 -90 + 12 x log2(f/50)
80 < f ≤ 120 -81,8 + 77,4 x log2(f/80)
120 < f ≤ 1 104 -36,51 104 < f ≤ 3 093 -36,5 - 36 x log2(f/1 104)
3 093 < f ≤ 4 545 -90 peak, with maximum power in the [f, f + 1 MHz] window of(-36,5 - 36 x log2(f/1 104) + 60) dBm
4 545 < f ≤ 11 040 -90 peak, with maximum power in the [f, f + 1 MHz] window of -50 dBm

ETSI
ETSI TS 101 388 V1.3.1 (2002-05)11
4.2.1.2 Upstream transmit spectral mask
The ATU-R transmit PSD for ADSL over ISDN shall be as defined in figure 2 and in table 2.
120 276
614
11 040Frequencyin kHz0
PSD indBm/Hz
-90 dBm/Hz peak12 dB/octave
-48 dB/octave
-34,5 peak
Measurements are into 100 Ω resistive termination
1 221
-50 dBm power in any1 MHz sliding windowabove 1 630 kHz
90 dBm/Hz peak
50 80
1 630
NOTE: There is a discrepancy between the out-of-band power spectral density limits given in the presentdocument and those given in a recently revised ETSI TS relating to ISDN-BA (TS 102 080 [1] V1.3.1). Theout-of-band limits on ISDN-BA are more stringent than the limits on the ADSL system described in thepresent document. It is acknowledged that there is a need to make the documents consistent. This is forfurther study.
Figure 2: ATU-R transmitted PSD mask
Table 2: Line equations for the ATU-R transmitted PSD mask
Frequency band (kHz) Equation for line (dBm/Hz)0 < f ≤ 50 -9050 < f ≤ 80 -90 + 12 x log2(f/50)
80 < f ≤ 120 -81,8 + 80,9 x log2(f/80)
120 < f ≤ 276 -34,5276 < f ≤ 614 -34,5 - 48 x log2(f/276)
614 < f ≤ 1 221 -901 221 < f ≤ 1 630 -90 peak, with maximum power in the [f, f + 1 MHz] window of
(-90 - 48 x log2(f/1 221) + 60) dBm
1 630 < f ≤ 11 040 -90 peak, with maximum power in the [f, f + 1 MHz] window of -50 dBm
4.2.2 FDD ADSL over ISDN
FDD ADSL over ISDN systems shall comply with the transmit spectral masks defined in clauses 4.2.2.1 and 4.2.2.2.
All PSD measurements made at the Line port of the ISDN splitter shall measure the spectral power into a resistive loadhaving the same value as the design impedance for ADSL (RV = 100 Ω).
The ISDN port of the ISDN splitter shall be terminated with the appropriate 2B1Q or 4B3T design impedance forISDN-BA as defined in TS 102 080 [1].
It is intended that the degradation impact on the ISDN-BA line system performance be no more than4,5 dB and 4 dB, for 2B1Q and 4B3T line codes respectively, at the insertion loss reference frequency.
ETSI
ETSI TS 101 388 V1.3.1 (2002-05)12
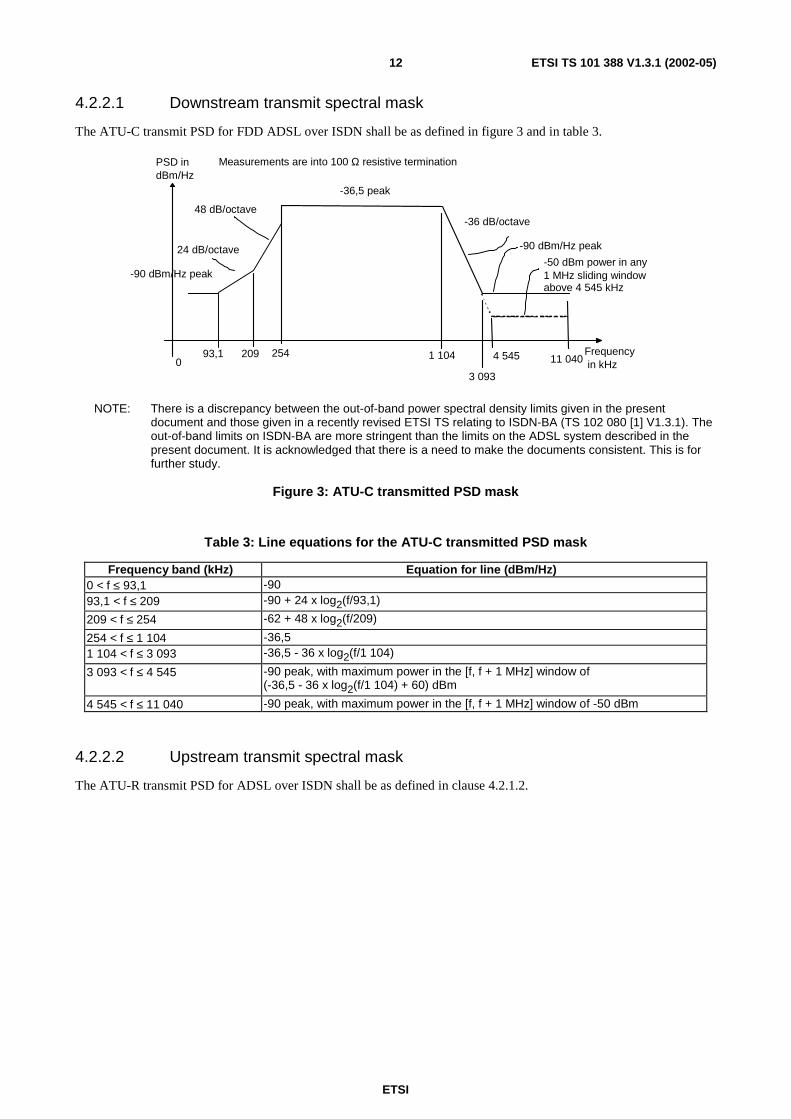
4.2.2.1 Downstream transmit spectral mask
The ATU-C transmit PSD for FDD ADSL over ISDN shall be as defined in figure 3 and in table 3.
254 1 104
3 093
11 040Frequencyin kHz0
PSD indBm/Hz
-90 dBm/Hz peak24 dB/octave
-36 dB/octave
-36,5 peak
Measurements are into 100 Ω resistive termination
4 545
-50 dBm power in any1 MHz sliding windowabove 4 545 kHz
-90 dBm/Hz peak
93,1 209
48 dB/octave
NOTE: There is a discrepancy between the out-of-band power spectral density limits given in the presentdocument and those given in a recently revised ETSI TS relating to ISDN-BA (TS 102 080 [1] V1.3.1). Theout-of-band limits on ISDN-BA are more stringent than the limits on the ADSL system described in thepresent document. It is acknowledged that there is a need to make the documents consistent. This is forfurther study.
Figure 3: ATU-C transmitted PSD mask
Table 3: Line equations for the ATU-C transmitted PSD mask
Frequency band (kHz) Equation for line (dBm/Hz)0 < f ≤ 93,1 -9093,1 < f ≤ 209 -90 + 24 x log2(f/93,1)
209 < f ≤ 254 -62 + 48 x log2(f/209)
254 < f ≤ 1 104 -36,51 104 < f ≤ 3 093 -36,5 - 36 x log2(f/1 104)
3 093 < f ≤ 4 545 -90 peak, with maximum power in the [f, f + 1 MHz] window of(-36,5 - 36 x log2(f/1 104) + 60) dBm
4 545 < f ≤ 11 040 -90 peak, with maximum power in the [f, f + 1 MHz] window of -50 dBm
4.2.2.2 Upstream transmit spectral mask
The ATU-R transmit PSD for ADSL over ISDN shall be as defined in clause 4.2.1.2.

ETSI
ETSI TS 101 388 V1.3.1 (2002-05)13
4.3 Aggregate transmit powerThe aggregate downstream power shall not exceed
(-3,65 + 10 × log10(ncdown)) dBm,
where ncdown is the number of downstream subcarriers used to carry bits (see clauses A.1.2.3.3 and B.1.3.2.2 ofITU-T Recommendation G.992.1 [2]). The aggregate upstream power shall not exceed
(-1,65 + 10 × log10 (ncup)) dBm,
where ncup is the number of upstream subcarriers used to carry bits (see clauses A.2.4.3.3 and B.2.2.3.2 of ITU-TRecommendation G.992.1 [2]). Regardless of the number of subcarriers in use, the aggregate transmit power shall notexceed the transmit power given in table 4. The transmit power measurement shall measure the power into a resistiveload having the same value as the design impedance for ADSL (RV = 100 Ω).
Table 4: Maximum aggregate transmit power into 100 ΩΩΩΩ
Signal type Maximum aggregatetransmit power
Indicative number ofcarriers (see note)
EC ADSL over POTS down: 20,4 dBm 254EC ADSL over POTS up: 12,5 dBm 26FDD ADSL over POTS down: 19,9 dBm 227FDD ADSL over POTS up: 12,5 dBm 27EC ADSL over ISDN down: 19,9 dBm 227EC ADSL over ISDN up: 13,3 dBm 31FDD ADSL over ISDN down: 19,3 dBm 197FDD ADSL over ISDN up: 13,3 dBm 31NOTE: This column is only informative and gives the number of carriers that have
to be transmitted at full power to reach the maximum aggregate power level.This information does not limit the effective number of carriers which may beused.
NOTE: The values of the power spectral density limits shown in the document may not be sufficient to fulfil therequirements for the radiation power limits specified by national frequency management entities.
5 Transmission performance objectives and testmethods
This clause defines the transmission performance objectives and laboratory test methods to stress ADSL transceiversThe test methods are intended to be representative of a high-penetration scenario in access networks. Thishigh-penetration approach enables operators to define deployment rules that apply across a wide range of operationalsituations. The noise models represent a mixture of different DSL services (including some systems that may needrepeaters in real deployment) that are assumed to share the same cable with the transceiver under test. For the sake ofsimplicity and reproducibility, the noise models do not take into account reach limitations of some of the DSL servicesassumed in the noise models.
The performance objectives are only intended for the purpose of testing ADSL transceivers and should not beconsidered a limitation on deployment in operator networks. In individual operational cases, characterized by lowernoise levels and/or insertion loss values, the ADSL system tested will perform better than under these test conditions.
The performance objectives described herein apply to both ADSL over POTS and ADSL over ISDN operations(see ITU-T Recommendation G.992.1 [2]). The design impedance RV is 100 Ω. In the context of the present documentall spectra represent single-sided Power Spectral Densities (PSDs).

ETSI
ETSI TS 101 388 V1.3.1 (2002-05)14
5.1 Test proceduresThis clause provides a specification of the test set-up, the insertion path and definition of signal and noise levels. Thetests focus on the noise margin when ADSL signals under test are attenuated by standard test loops and interfered withby standard cross-talk noise or impulse noise. This noise margin indicates what increase of cross-talk noise or impulsenoise level can be tolerated by the ADSL system under test before the bit error ratio exceeds the design target.
5.1.1 Test set-up definition
Figure 4 illustrates the functional description of the test set-up. It includes:
- the test loops, as specified in clause 5.2;
- an adding element to add impairments (a mix of random, impulsive and harmonic noise), as specified inclause 5.3;
- an impairment generator, as specified in clause 5.3, to generate both the differential mode and common modeimpairment noise, which are input to the adding element;
- a high-impedance, well-balanced differential voltage probe (e.g. better than 60 dB across the entire band of theADSL system under test), connected with level detectors such as a spectrum analyser or a true rms voltmeter;
- a high-impedance, well-balanced common mode voltage probe (e.g. better than 60 dB across the entire band ofthe ADSL system under test), connected with level detectors such as a spectrum analyser or a true rms voltmeter.
The two-port characteristics (insertion loss, impedance) of the test loop, as specified in clause 5.2, are defined betweenport Tx (node pairs A1, B1) and port Rx (node pair A2, B2).
The noise injection network is specified in clause 5.1.2 and is inserted between the test cable and the Rx port. Thisadding element is acting on both the differential and the common modes. The source present in this element iscontrolled by the impairment generator, as specified in clause 5.2.
The balance about earth, observed at port Tx, at port Rx and at the tips of the voltage probe, shall be at least 10 dBgreater than the balance about earth of the transceiver under test. This is to ensure that the insertion of the impairmentgenerator and monitor functions does not appreciably deteriorate the balance about earth of the transceiver under test.
test "cable"
test loop
impairmentgenerator
[A1]
[B1]
Txmodemunder test
PRBSpattern
generator
applicationinterface
Rxmodem
under testBERTSreceiver
applicationinterface
GND
probevoltage
differentialprobe
voltage
U1
GND
[A2]
[B2]
probevoltage
U2
leveldetector
leveldetector
leveldetector
Lx noiseinjection
NOTE 1: To allow test reproducibility, the testing equipment and the Termination Units (LTU and NTU) should referto an artificial earth. If the Termination Units have no earth terminal, the test should be performed while theTermination Units are placed on a metal plate (of sufficient large size) connected to earth.
NOTE 2: When external splitters are required for the ADSL system under test (for POTS or ISDN signals), thissplitter shall be included in or attached as an integral part of the modem under test. In these externalsplitters an optional highpass can be present. However, when measuring the performance requirements ofclause 5.5, the external highpass should be limited to the DC blocking variant, composed of 2 seriescapacitors, because the higher order variant is still under study. Moreover, the ADSL transceiver variantused with the DC blocking capacitors should be a version compensating the series capacitors.
NOTE 3: The management system should be connected to enable collection of parameters from the OAM facilities,in particular loop loss and SNR figures.
Figure 4: Functional description of the set-up of the performance tests

ETSI
ETSI TS 101 388 V1.3.1 (2002-05)15
The signal flow through the test set-up is from port Tx to port Rx, which means that measuring upstream anddownstream performance requires an interchange of transceiver position and test "cable" ends.
The received signal level at port Rx is measured between nodes A2 and B2, when ports Tx and Rx are terminated withthe ADSL transceivers under test. The impairment generator is switched off during this measurement.
Test Loop #0, as specified in clause 5.2, shall always be used to calibrate and verify the correct settings of generatorsG1-G7, as specified in clause 5.3.
The transmitted signal level at port Tx is measured between nodes A1 and B1 under the same conditions.
The impairment noise shall be a mix of random, impulsive and harmonic noise, as defined in clause 5.3.
5.1.2 Noise injection network
5.1.2.1 Differential mode injection
The noise injector for differential mode noise is a two-port network in nature, and may have additional ports connectedto the impairment generator. The Norton equivalent circuit diagram is shown in figure 5. The current source Ix is
controlled by the impairment generator. The parasitic shunt impedance Zinj shall have a value of |Zinj| > 4 kΩ in the
frequency range from 100 Hz to 2 MHz.
I xZinjR -portxL -portx
Figure 5: Norton equivalent circuit diagram for the differential mode noise injection
5.1.2.2 Common mode injection
This mode is for further study.
5.1.3 Signal and noise level definitions
The signal and noise levels are probed with a well-balanced differential voltage probe. The differential impedancebetween the tips of the probe shall be higher than the shunt impedance of 100 kΩ in parallel with 10 pF. Figure 4 showsthe probe position when measuring the Rx signal level at the LT or NT receiver. Measuring the Tx signal level requiresthe connection of the tips to node pair [A1, B1].
The various PSDs of signals and noises specified in the present document are defined at the Tx or Rx side of the set-up.The levels are defined when the set-up is terminated, as described above, with design impedance RV or with ADSLtransceivers under test.
Probing an rms-voltage Urms [V] in this set-up, over the full signal band, results in a power level of P [dBm] that equals:
P = 10 × log10 (Urms2/RV × 1 000) [dBm]
Probing an rms-voltage Urms [V] in this set-up, within a small frequency band of ∆f (in Hertz), corresponds to an
average spectral density level of P [dBm/Hz] within that filtered band that equals:
P = 10 × log10 (Urms2/RV × 1 000/∆f) [dBm/Hz]
The bandwidth ∆f identifies the noise bandwidth of the filter, and not the -3 dB bandwidth.

ETSI
ETSI TS 101 388 V1.3.1 (2002-05)16
5.1.4 Noise levels calibration
5.1.4.1 Differential mode noise calibration
The differential mode noise injection is calibrated using the configuration shown in figure 6. During calibration the Rx
side of the noise injector is terminated by the design impedance RV (= 100 Ω) and the LX side of the noise injector is
terminated by an impedance ZLx. The noise levels given in clause 5.3 specify the PSD dissipated in RV on the RX side
when ZLx on the Lx side is equal to the calibration impedance Zcal. The impedance Zcal is defined in figure 7.
NOTE: This noise injection method is similar to the cross-talk injection method specified in ITU-TRecommendation G.996.1 (G.test) [4], clause 5.1.2.1.
Rv
Ux
impairmentgenerator
differential mode
noise injection
networkZLx
R -portxL -portx
Figure 6: Configuration for noise level calibration
150 nF
150 ohm
47 nF
750 ohm120 ohm
Figure 7: Calibration impedance Zcal
ΩIf the impedance ZLx on the Lx side of the noise injection circuit is equal to the calibration impedance Zcal as given in
figure 7, then the PSD dissipated in the impedance Rv shall be equal to the noise PSD Pxn(f) defined in clause 5.3.1. For
an arbitrary value of the impedance ZLx, the PSD dissipated in Rv is equal to:
( ) ( )fPZfGfP xnLxcal ),(= .
The impedance dependent correction factor is specified as:
2
111
111
),(vinjcal
vinjLx
RZZ
RZZ
LxZfG++
++= ,
where Zcal is the calibration impedance given in figure 7, Zinj is the Norton equivalent impedance of the noise injection
circuit (see figure 5), and Rv = 100 Ω is the ADSL design impedance.
The noise generator gain settings determined during calibration shall be used during performance testing. Duringperformance testing the noise injection circuit will be inserted as shown in figure 4. Because the loop impedance andthe impedance of the modem under test may differ from the impedances ZLx and Rv used during calibration, the voltage
over the Rx port of the modem may differ from the voltage Ux observed during calibration.
5.1.4.2 Common mode noise calibration
This calibration method is for further study.

ETSI
ETSI TS 101 388 V1.3.1 (2002-05)17
5.1.5 Startup training procedure
The content of this clause is for further study.
5.2 Test loopsThe purpose of the test loops shown in figure 8 is to stress ADSL transceivers under test in various ways, and inparticular to test performance under quasi-realistic circumstances. Due to the requirement for ADSL transceivers tooperate over the majority of metallic local lines without the requirement of any special conditioning, a variety of testloops have been defined in clause 5.2.1.
5.2.1 Background information
The test loops in figure 8 are an artificial mixture of cable sections. A number of different loops have been constructedto capture a wide range of cable impedances, and to represent ripple in the amplitude and phase characteristics of thetest loop transmission functions.
- The test loops are characterized by their electrical lengths. The electrical length of each loop is defined as theinsertion loss at a given test frequency, fT. The total physical length, in meters, is also provided for information.
In performance tests, the informative physical length can be used to establish a preliminary test loop. The lengthof the loop must then be adjusted, as specified in clause 5.2.3, to meet the normative electrical lengthrequirements.
- The impedance characteristics of the test loops are such that they represent the impedances of a wide range ofdistribution cables that are commonly used in Europe. The purpose of a wide range of impedances is to stress thesignal processing capabilities of the ADSL modem under test. This effect has been captured by defining sometest loops with highly mismatched cable sections.
- One test loop includes bridged taps, which cause rapid variations in amplitude and phase characteristics of thecable transmission function. In some European access networks, installation practices have introduced bridgedtaps in the past. The presence of the bridged tap stresses the ADSL modem under test in a particular way.
- Loop #0 is a symbolic name for a loop with zero (or near zero) length, to prove that the ADSL transceiver undertest can handle the potentially high signal levels when two transceivers are directly interconnected.
ETSI
ETSI TS 101 388 V1.3.1 (2002-05)18
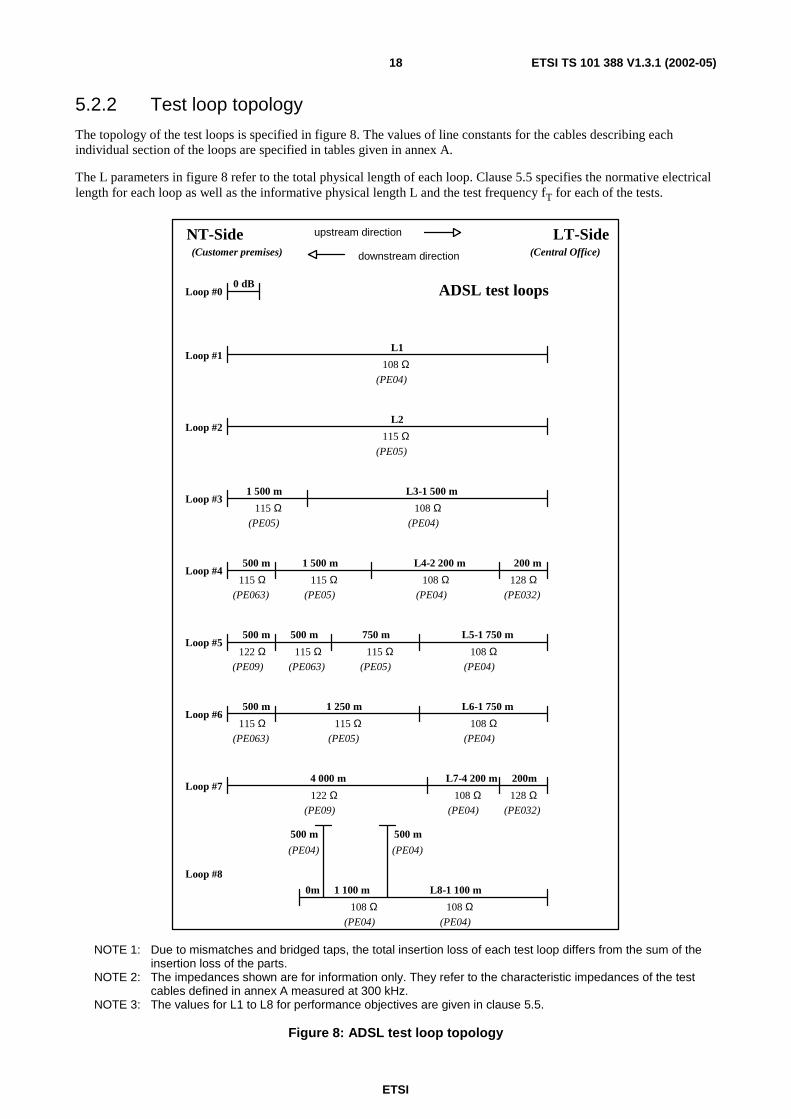
5.2.2 Test loop topology
The topology of the test loops is specified in figure 8. The values of line constants for the cables describing eachindividual section of the loops are specified in tables given in annex A.
The L parameters in figure 8 refer to the total physical length of each loop. Clause 5.5 specifies the normative electricallength for each loop as well as the informative physical length L and the test frequency fT for each of the tests.
0 dBLoop #0
Loop #1108 Ω
(PE04)
L1
500 m500 m
Loop #8
(PE04) (PE04)
L8-1 100 m1 100 m
NT-Side(Customer premises)
LT-Side(Central Office)
upstream direction
downstream direction
Loop #2115 Ω
(PE05)
L2
Loop #31 500 m L3-1 500 m
108 Ω(PE04)
115 Ω(PE05)
200 m500 mLoop #4
L4-2 200 m1 500 m
(PE063)
115 Ω 115 Ω(PE05)
108 Ω(PE04) (PE032)
128 Ω
750 m500 mLoop #5
L5-1 750 m500 m
(PE09)
122 Ω(PE063)
115 Ω 115 Ω(PE05)
108 Ω(PE04)
500 mLoop #6
L6-1 750 m1 250 m
(PE063)
115 Ω 115 Ω(PE05)
108 Ω(PE04)
4 000 mLoop #7
200mL7-4 200 m
(PE09)
122 Ω 108 Ω(PE04) (PE032)
128 Ω
108 Ω(PE04)
108 Ω(PE04)
0m
ADSL test loops
NOTE 1: Due to mismatches and bridged taps, the total insertion loss of each test loop differs from the sum of theinsertion loss of the parts.
NOTE 2: The impedances shown are for information only. They refer to the characteristic impedances of the testcables defined in annex A measured at 300 kHz.
NOTE 3: The values for L1 to L8 for performance objectives are given in clause 5.5.
Figure 8: ADSL test loop topology

ETSI
ETSI TS 101 388 V1.3.1 (2002-05)19
5.2.3 Test loop accuracy
The different cable sections of the test loops shown in figure 8 are specified by two-port cable models that represent realtwisted pair cables. Cable simulators as well as real cables can be used to construct these test loops. The associatedmodels and line constants are specified in annex A.
The characteristics of each test loop, including those with cascaded sections, shall approximate the models within aspecified accuracy. This accuracy specification does not apply to the individual sections.
- The magnitude of the test loop insertion loss shall approximate the insertion loss of the specified models within±3 % on a dB scale, between 20 kHz and 1,8 MHz.
- The magnitude of the test loop characteristic impedance shall approximate the characteristic impedance of thespecified models within ±7 % on a linear scale, between 20 kHz and 1,8 MHz.
- The group delay of the test loop shall approximate the group delay of the specified cascaded models within ±3 %on a linear scale, between 20 kHz and 1,8 MHz.
The electrical lengths (insertion loss at specified test frequency) of the test loops, specified in clause 5.5, are normative.If the physical length of a test loop implementation is such that electrical length is out of specification, its total physicallength shall be adjusted accordingly to correct this error. This adjustment to the loop insertion loss by scaling of thephysical length should also be used to correct for extra attenuation caused by the noise injection circuit.
5.3 Impairment generatorsThe noise the impairment generator injects into the test setup is frequency-dependent and dependent on the length andinsertion loss of the test loop. The noise differs for downstream and upstream performance tests.
The definition of noise for ADSL performance tests is complex, and for the purposes of the present document it hasbeen partitioned into smaller components that can be specified more easily. These separate, and uncorrelated,impairment "generators" may therefore be isolated and summed to form the impairment generator for the ADSL systemunder test. The detailed specifications for the components of the noise model(s) are given in this clause, together with abrief explanation.
5.3.1 Functional description
Figure 9 shows a functional diagram of the composite impairment noise. It defines a functional description of thecombined impairment noise, as it must be probed at the receiver input of the ADSL transceiver under test. This probingis defined in clause 5.1.3.
The functional diagram has the following elements:
- The eight impairment generators G1 to G8 generate noise as defined in clauses 5.3.3.1 to 5.3.3.8. Their noisecharacteristics are independent of the test loops and bit-rates.
- The NEXT coupling function H1(f, L) models the loop length dependency and frequency dependency of the
NEXT impairment, as specified in clause 5.3.2. The NEXT coupling function is independent of the test looptopology, but dependent on the length of the test loop. The NEXT coupling function is defined in table 5.
- The FEXT coupling function H2(f, L) models the loop length dependency and frequency dependency of the
FEXT impairment, as specified in clause 5.3.2. The FEXT coupling function is independent of the test looptopology, but depends on the length of the test loop. The FEXT coupling function is defined in table 5.
- Switches S1-S7 are logocal switches that indicate whether or not a specific impairment generator contributes tothe total impairment during a test.
- Amplifier A1 models the ability to increase the level of noise generators G1, G2 and G3 simultaneously toperform the noise margin tests as defined in clause 5.4.2. The gain of A1 (x dB) shall be frequency independentover the entire frequency band of the ADSL system under test. Unless otherwise specified, the gain of A1 is setto 0 dB.

ETSI
ETSI TS 101 388 V1.3.1 (2002-05)20
- Amplifier A2 models the ability to increase the noise level of generator G8. Unless otherwise specified, the gainof A2 is set to 0 dB.
The diagram in figure 9 is a conceptual diagram and does not specify the actual construction of the impairmentgenerator. In a practical implementation of the test set-up, there is no need to give access to any of the internal signalsof the diagram in figure 9. Furthermore, these functional blocks may be incorporated with the test loop and the addingelement as one integrated construction.
independentnoise generators
crosstalkcoupling functions
ΣΣΣΣ
NEXT noise
FEXT noise
Background noise
Cable independent
White noise
Cable independent
Cable independent
Fixed powers, fixed freq
Broadcast RF noise
Cable independent
Fixed power, variable freq
Amateur RF noise
Impulsive noise
bursty in nature
Cable independent
G1
G2
G3
G4
G5
G6
G7
S1
S2
S3
S4
S5
S6
S7
probelevel
ΣΣΣΣ A1H2(f,L)
H1(f,L)
G8S8
probelevel
A2line sharing noise
NOTE 1: Generator G7 is the only generator symbolically shown in the time domain.NOTE 2: Although generator G3 is inactive for ADSL tests, the noise construction in this figure is common to all
xDSL specified by ETSI. For this reason, it is maintained in the diagram.NOTE 3: The primary purpose of generator G4 is to provide designers of noise generation equipment a reasonable
noise floor to avoid over-design of their equipment.
Figure 9: Functional diagram of the composition of the impairment noise
This functional diagram will be used for impairment tests in the downstream and upstream directions. Several scenarioshave been identified for ADSL testing. These scenarios are intended to be representative of the impairments found inmetallic access networks.
Each scenario (or noise model) results in a length-dependent and test loop-dependent description of a noise PSD. Eachnoise model is subdivided into two parts: one to be injected at the LT-side, and another to be injected at the NT-side ofthe ADSL modem link under test. Therefore, the eight individual impairment generators G1 to G8 can representdifferent values for each noise model. Specifically, G1 and G2 are dependent on which unit, LT or NT, is under test.Each test has its own impairment specification, as specified in clause 5.4.
Generator G1-G3 represent cross-talk noise and G4 a noise floor. G1 represent the cumulated noise from all collocateddisturbers at one end of the loop near to the receiver under test. G2 represent the same, but located at another end of theloop far from the receiver under test. Generator G3 represent all cumulated noise from disturbers at unidentifiedlocations. Generator G4 is a white noise generator to provide designers of noise generation equipment a reasonablenoise floor to avoid over-design of their equipment.

ETSI
ETSI TS 101 388 V1.3.1 (2002-05)21
The spectral power Pxn(f) for cross-talk noise is characterized by the sum:
Pxn(f)= |A1|2 × |H1(f,L)|2 × PG1(f) + |H2(f,L)|2 × PG2(f) + PG3(f) + PG4(f)
Each component of this sum is specified in the following clauses. Only the noise generators that are active duringtesting should be included during calibration. This combined impairment noise is applied to the receiver under test, ateither the LT (for upstream) or NT (for downstream) ends of the test loop.
Generators G5 and G6 represent ingress noise. The level of the ingress noise and the calibration of noise sources G5 andG6 are for further study.
Generator G7 represents impulse noise. The definition of signals for G7 is for further study.
Generator G8 represents energy appearing at the receiver of the unit under test due to signals sharing the line.
5.3.2 Cable cross-talk models
The purpose of the cable cross-talk models is to model both the length and frequency dependence of cross-talkmeasured in real cables. The cross-talk coupling functions, H1(f,L) and H2(f,L), are transfer functions that adjust the
levels of the noise generators in figure 9 when the test loop changes. The frequency and length dependency of thesefunctions is in accordance with observations from real cables. The specification is based on the following constants,parameters and functions:
a) Variable f identifies the frequency in Hertz.
b) Constant f0 identifies a chosen reference frequency, which is 1 MHz in the present document.
c) Variable L identifies the physical length of the test loop in meters. This physical length is derived from thespecified electrical length using the cable models in annex B and the cable characteristics of annex A. Values ofthe required electrical lengths and the corresponding (informative) physical lengths are summarized in table 20through table 51 for each combination of payload bit rate, noise model and test loop. In the case of test loop 8,which has bridged taps, L is the physical length of the main path.
d) Constant L0 identifies a chosen reference length, which is 1 km in the present document.
e) The function ST0(f, L) represents the frequency- and length-dependent amplitude of the transmission function
of the actual test loop. This value equals sT = |s21|, where s21 is the transmission s-parameter of the loop
normalized to 135 Ω. Annex B provides formulas to calculate this s-parameter.
f) Constant Kxn identifies an empirically-obtained number that scales the NEXT function H1(f, L). The resultingtransfer function represents a power-summed cross-talk coupling of the NEXT as it was observed in a testcable. Although several disturbers and wire pairs were used in the derivation, the value of Kxn was scaled downas if it originated from a single disturber in a single wire pair.
g) Constant Kxf identifies an empirically-obtained number that scales the FEXT function H2(f, L). The resultingtransfer function represents a power-summed cross-talk coupling of the FEXT as it was observed in a test cable.Although several disturbers and wire pairs were used in the derivation, the value of Kxn was scaled down as if itoriginated from a single disturber in a single wire pair.
The transfer functions in table 5 shall be used as cross-talk coupling functions in the impairment generators G1 and G2.
Table 5: Definition of the cross-talk coupling functions
H1(f, L) = Kxn × (f/f0)0,75 × 1 – |sT0(f, L)|4
H2(f, L) = Kxf × (f/f0) × (L/L0) × |sT0(f, L)|
Kxn = 10(-50/20) ≈ 0,0032, f0 = 1 MHz
Kxf = 10(-45/20) ≈ 0,0056, L0 = 1 km
sT0(f, L) = magnitude of test loop transmission
function

ETSI
ETSI TS 101 388 V1.3.1 (2002-05)22
5.3.3 Individual impairment generators
The noise produced by each impairment generator shall be uncorrelated with the noise produced by all other impairmentgenerators, and uncorrelated with the xDSL system under test. The noise shall be random in nature and near Gaussiandistributed, as specified in clause 5.3.4.2.
5.3.3.1 Equivalent NEXT disturbance generator [G1.xx]
The NEXT noise generator represents the equivalent disturbance of all impairments that are identified as cross-talknoise from a predominantly near-end origin. This noise, filtered by the NEXT cross-talk coupling function ofclause 5.3.2, represents the contributions of all NEXT to the composite impairment noise of the test.
The PSD of this noise generator is defined in clause 5.3.4.1. For testing upstream and downstream performance,different PSD profiles are to be used, as specified below:
G1.UP.# = X.LT.#
G1.DN.# = X.NT.#
The symbols in this expression, refer to the following:
• Symbol "#" is a placeholder for noise model "FA", "FB", "FC" or "FD".
• Symbol "X.LT.#" and "X.NT.#" refers to the cross-talk profiles, as defined in clause 5.3.4.1.
The G1 PSD is not related to the cable because the cable portion is modelled separately as part of the NEXT couplingfunction H1(f, L), as specified in clause 5.3.2.
5.3.3.2 Equivalent FEXT disturbance generator [G2.xx]
The FEXT noise generator represents the equivalent disturbance of all impairments that are identified as cross-talknoise from a predominantly far-end origin. This noise, filtered by the FEXT cross-talk coupling function of clause 5.3.2,represents the contributions of all FEXT to the composite impairment noise of the test.
The PSD of this noise generator is defined in clause 5.3.4.1. For testing upstream and downstream performance,different PSD profiles are to be used, as specified below:
G2.UP.# = X.NT.#
G2.DN.# = X.LT.#
The symbols in this expression, refer to the following:
• Symbol "#" is a placeholder for noise model "FA", "FB", "FC" or "FD".
• Symbol "X.LT.#" and "X.NT.#" refers to the cross-talk profiles, as defined in clause 5.3.4.1.
This PSD is not related to the cable because the cable portion is modelled separately as part of the FEXT couplingfunction H2(f, L), as specified in clause 5.3.2.
5.3.3.3 Background noise generator [G3]
The background noise generator is inactive and set to zero.
5.3.3.4 White noise generator [G4]
The white noise generator has a fixed, frequency-independent value, and is set to -140 dBm/Hz.

ETSI
ETSI TS 101 388 V1.3.1 (2002-05)23
5.3.3.5 Broadcast RF noise generator [G5]
The broadcast RF noise generator represents the discrete-tone line interference caused by amplitude modulatedbroadcast transmissions in the SW, MW and LW bands, which ingress into the cable. These interference sources havemore temporal stability than the amateur (ham) interference (see clause 5.3.3.6) because their carriers are notsuppressed. Ingress causes differential mode as well as common mode interference.
The ingress noise signal for differential mode impairment (or common mode impairment) is a superposition of randommodulated carriers (AM). The total voltage U(t) of this signal is defined as:
U(t) = ΣΣΣΣk Uk × cos(2π·fk × t + ϕk) × (1 + m × αk(t))
The individual components of this ingress noise signal U(t) are defined as follows:
- Uk - The voltage Uk of each individual carrier should be as specified in table 6 as power level P (dBm) into a
resistive load R, equal to the design impedance RV = 100 Ω. Note that spectrum analysers will detect levels that
are slightly higher than the values specified in table 6 when their resolution bandwidths are set to 10 kHz ormore, since they will detect the modulation power as well.
- fk - The frequency fk of each individual carrier should be as specified in table 6. The frequency values in table 6
do not represent actual broadcast frequencies but are chosen such that they cover the frequency range that isrelevant for ADSL modems. Note that the harmonic relation between the carriers in table 6 is minimal.
- ϕϕϕϕk - The phase offset ϕk of each individual carrier shall have a random value that is uncorrelated with the phase
offset of every other carrier in the ingress noise signal.
- m - The modulation depth m of each individually modulated carrier shall be m = 0,32, to enable a modulationindex of at least 80 % during the peak levels of the modulation signal m × αk(t).
- ααααk(t) - The normalized modulation noise αk(t) of each individually modulated carrier shall be random in nature,
shall be Gaussian distributed in nature, shall have an RMS value of αrms = 1, shall have a crest factor of 2,5 or
more, and shall be uncorrelated with the modulation noise of each other modulated carrier in the ingress noisesignal.
- ∆∆∆∆b - The modulation width ∆b of each modulated carrier shall be at least 2 × 5 kHz. This is equivalent tocreating αk (t) from white noise, filtered by a low-pass filter with a cut-off frequency at ∆b/2 = 5 kHz. This
modulation width covers the full modulation band used by AM broadcast stations.
NOTE 1: The precise specification of the spectral shape requirements of the modulation signal is for further study.
The ingress noise generator may have two distinct outputs, one contributing to the differential mode impairment, andthe other to the common mode impairment.
NOTE 2: The question of whether the differential mode and common mode signals are partly correlated or fullyuncorrelated is for further study. The amount of correlation between differential and common modesignals is related to the frequency domain variations within a 10 kHz span of cable balance of real cables.
Table 6: Definition of the broadcast RF frequencies and related power levels for differentialand common mode ingress
Frequency (kHz) 99 207 333 387 531 603 711 801 909 981Differential mode
power (dBm)–58 –43 –50 –54 –59 –60 –57 –62 –52 –63
Common modepower (dBm)
TBD TBD TBD TBD TBD TBD TBD TBD TBD TBD
NOTE: The frequencies and power levels are tentative and should be revised in thefuture based on additional measurements. Different power levels may beappropriate for ATU-C and ATU-R. A long term goal is to align the RFIfrequency and power levels specified for ADSL, SDSL and VDSL.

ETSI
ETSI TS 101 388 V1.3.1 (2002-05)24
5.3.3.6 Amateur RF noise generator [G6]
The content of this clause is for further study.
5.3.3.7 Impulse noise generator [G7]
A test with this noise generator is required to prove the burst noise immunity of the ADSL transceiver. This immunityshall be demonstrated on short and long loops in the presence of noise that models cross-talk and RFI. Additionaldetails are given in clause 5.4.
The noise shall consist of bursts of Additive White Gaussian Noise (AWGN) injected onto the line with sufficientpower to ensure effective erasure of the data for the period of the burst, i.e. the bit error ratio during the burst should beapproximately 0,5. The duration of the noise burst shall be no longer than 5 µs, and it shall be applied to the line at afrequency of once per second.
5.3.3.8 Line sharing noise generator [G8]
Noise generator G8 represents the impairment that originates from ISDN systems sharing the same wire pair as used bythe ADSL (over ISDN) systems. Noise generator G8 is only used for testing of ADSL over ISDN systems and shall notbe active when ADSL over POTS systems are tested.
Table 7 specifies the break points for the PSD for noise generator G8. The PSD profiles for noise generator G8 areconstructed with straight lines between these break points, when plotted against a logarithmic frequency scale and alinear dBm scale.
The electrical characteristics of the injection circuit for noise generator G8 are for further study. Annex F provides anexample injection method that can be used for noise generator G8.
NOTE: The specification of the injection circuit for noise generator G8 may affect the performance objectivesspecified in clause 5.5.
Table 7: Break points of the PSD masks for noise generator G8
f(kHz)
PSD(dBm/Hz)
5 -48,722,5 -44,740 -45,365 -47,480 -50,1
100 -59,5122,5 -108,5154,5 -126,1170 -127185 -131200 -135215 -140
> 215 < -140
5.3.4 Profiles of the individual impairment generators
5.3.4.1 Frequency domain profiles of generators G1 and G2
Cross-talk noise represents all impairments that originate from systems connected to adjacent wire pairs that arecoupled to the wires used by the ADSL systems. This noise spectrum varies with the electrical length of the test loop.
To simplify matters, the definition of cross-talk noise has been partitioned into smaller, more easily specifiedcomponents. Noise generators G1 and G2 represent the "equivalent disturbance" of many disturbers in a real scenario,as if all disturbers were collocated at the ends of the test loop. This approach has isolated their definitions from theNEXT and FEXT coupling functions of the cable.

ETSI
ETSI TS 101 388 V1.3.1 (2002-05)25
The following clauses specify the PSD profiles X.LT.# and X.NT.# that apply for the equivalent disturbers G1 and G2(see figure 9) when testing ADSL over POTS and ADSL over ISDN systems. Both EC and FDD modes are addressed.
NOTE: The equivalent disturbers in these noise models are evaluated as a combination of several individualdisturbers. When the equivalent disturbers were generated for the FDD versions of ADSL, the PSD valuesof one type of these disturbers had changed slightly compared to the values used to generate noise PSDsfor the EC version of ADSL.
The character "#" is used as a placeholder for the letters "FA", "FB","FC", and "FD", which indicate the noise model.
Four noise models have been defined for ADSL tests:
• Type "FA" models are intended to represent a high penetration scenario when the ADSL system under test isplaced in a distribution cable (up to hundreds of wire pairs) that is filled with many other (potentiallyincompatible) transmission systems.
• Type "FB" models are intended to represent a medium penetration scenario when the ADSL system under testis placed in a distribution cable (up to tens of wire pairs) that is filled with many other (potentially incompatible)transmission systems.
• Type "FC" models are intended to represent a legacy scenario that accounts for the presence of systems such asISDN-PRI (HDB3), in addition to the medium penetration scenario of model "FB".
• Type "FD" models are intended to represent a pure self-cross-talk scenario, in which the cable is filled withADSL only.
5.3.4.1.1 Frequency domain profiles for EC ADSL over POTS
The LT-profiles for EC ADSL over POTS systems are specified in table 8 and the NT-profiles in table 9. Each PSDprofile specifies the maximum available spectral power of an equivalent disturber that represents a mix of disturbers.The PSD profiles are constructed with straight lines between these break frequencies, when plotted against alogarithmic frequency scale and a linear dBm scale. These profiles shall be met for all frequencies between 1 kHz and2 MHz.
Table 8: Break frequencies of the "X.LT.#" PSD masks for testing EC ADSL over POTS systems
X.LT.FA X.LT.FB X.LT.FC X.LT.FD(Hz) (dBm/Hz) (Hz) (dBm/Hz) (Hz) (dBm/Hz) (Hz) (dBm/Hz)
0 -20,0 0 -25,6 0 -25,6 0,0 -87,415 k -20,0 15 k -25,6 15 k -25,6 3,99 k -87,431 k -21,5 31 k -27,0 31 k -27,0 4 k -82,463 k -25,6 63 k -31,3 63 k -31,3 25,875 k -29,4
112 k -25,7 112 k -31,3 112 k -31,3 1,104 M -29,4204 k -26,1 204 k -31,8 204 k -31,8 3,093 M -79,9298 k -26,6 298 k -32,5 298 k -32,5 4,545 M -99,9420 k -27,3 420 k -33,7 420 k -33,7 30 M -99,9
1,104 M -27,3 1,104 M -33,7 1,104 M -33,74,5 M -97,8 4,5 M -104,1 1,85 M -58,130 M -97,8 30 M -104,1 23 M -104,1
30 M -104,1

ETSI
ETSI TS 101 388 V1.3.1 (2002-05)26
Table 9: Break frequencies of the "X.NT.#" PSD masks for testing EC ADSL over POTS systems
X.NT.FA X.NT.FB X.NT.FC X.NT.FD(Hz) (dBm/Hz) (Hz) (dBm/Hz) (Hz) (dBm/Hz) (Hz) (dBm/Hz)
0 -20,0 0 -25,6 0 -25,6 0 -87,415 k -20,0 15 k -25,6 15 k -25,6 3,99 k -87,422 k -20,8 22 k -26,6 22 k -26,6 4 k -82,429 k -20,8 29 k -26,6 29 k -26,6 25,875 k -27,461 k -24,4 61 k -30,3 61 k -30,3 138 k -27,4
138 k -24,5 138 k -30,4 138 k -30,4 307 k -79,9153 k -28,2 153 k -33,2 153 k -33,2 1,221 M -79,9220 k -28,9 220 k -33,9 220 k -33,9 1,63 M -99,9315 k -30,8 315 k -35,5 315 k -35,5 30 M -99,9387 k -34,6 387 k -39,5 387 k -39,5461 k -43,4 461 k -48,3 469 k -48,0595 k -62,5 605 k -68,4 776 k -45,5755 k -62,5 755 k -68,4 1 030 k -45,51,2 M -75,3 1,2 M -82,0 1,41 M -48,92,6 M -97,8 2,9 M -104,1 1,8 M -57,930 M -97,8 30 M -104,1 23 M -104,1
30 M -104,1
5.3.4.1.2 Frequency domain profiles for EC ADSL over ISDN
The LT-profiles for EC ADSL over ISDN systems are specified in table 10 and the NT-profiles in table 11. Each PSDprofile represents a mix of disturbers. These profiles shall be met for all frequencies between 1 kHz and 2 MHz. ThePSD profiles are constructed with straight lines between these break frequencies, when plotted against a logarithmicfrequency scale and a linear dBm scale.
Table 10: Break frequencies of the "X.LT.#" PSD masks for testing EC ADSL over ISDN systems
X.LT.FA X.LT.FB X.LT.FC X.LT.FD(Hz) (dBm/Hz) (Hz) (dBm/Hz) (Hz) (dBm/Hz) (Hz) (dBm/Hz)
0 -20,0 0 -25,6 0 -25,6 0 -79,915 k -20,0 15 k -25,6 15 k -25,6 50 k -79,930 k -21,5 30 k -27,2 30 k -27,2 80 k -71,866 k -27,7 66 k -32,6 66 k -32,6 138 k -29,4
130 k -27,7 130 k -32,7 130 k -32,7 1,104 M -29,4138 k -25,9 138 k -31,5 138 k -31,5 3,093 M -79,9204 k -26,1 204 k -31,8 204 k -31,8 4,545 M -99,9298 k -26,6 298 k -32,5 298 k -32,5 30 M -99,9420 k -27,3 420 k -33,7 420 k -33,7
1,104 M -27,3 1,104 M -33,7 1,104 M -33,74,5 M -97,8 4,5 M -104,1 1,85 M -58,1
30 -97,8 30 M -104,1 23 M -104,130 M -104,1

ETSI
ETSI TS 101 388 V1.3.1 (2002-05)27
Table 11: Break frequencies of the "X.NT.#" PSD masks for testing EC ADSL over ISDN systems
X.NT.FA X.NT.FB X.NT.FC X.NT.FD(Hz) (dBm/Hz) (Hz) (dBm/Hz) (Hz) (dBm/Hz) (Hz) (dBm/Hz)
0 -20,0 0 -25,6 0 -25,6 0 -79,915 k -20,0 15 k -25,6 15 k -25,6 50 k -79,930 k -21,6 30 k -27,1 30 k -27,1 80 k -71,866 k -27,7 65 k -32,6 65 k -32,6 138 k -27,4
129 k -27,7 129 k -32,7 129 k -32,7 276 k -27,4138 k -24,5 138 k -30,4 138 k -30,4 614 k -79,9276 k -24,9 276 k -31,0 276 k -31,0 1,221 M -79,9298 k -28,8 296 k -34,1 296 k -34,1 1,63 M -99,9387 k -34,6 381 k -38,8 381 k -38,8 30 M -99,9500 k -48,6 461 k -48,3 469 k -48,0595 k -62,5 605 k -68,4 776 k -45,5755 k -62,5 755 k -68,4 1,030 M -45,51,2 M -75,3 1,2 M -82,0 1,410 M -48,92,6 M -97,8 2,9 M -104,1 1,8 M -57,930 M -97,8 30 M -104,1 23 M -104,1
30 M -104,1
5.3.4.1.3 Frequency domain profiles for FDD ADSL over POTS
The LT-profiles for FDD ADSL over POTS systems are specified in table 12 and the NT-profiles in table 13. Each PSDprofile represents a mix of disturbers. These profiles shall be met for all frequencies between 1 kHz and 2 MHz. ThePSD profiles are constructed with straight lines between these break frequencies, when plotted against a logarithmicfrequency scale and a linear dBm scale.
Table 12: Break frequencies of the "X.LT.#" PSD masks for testing FDD ADSL over POTS systems
X.LT.FA X.LT.FB X.LT.FC X.LT.FD(Hz) (dBm/Hz) (Hz) (dBm/Hz) (Hz) (dBm/Hz) (Hz) (dBm/Hz)
1 -20,1 1 -25,7 1 -25,8 1 -87,415 k -20 15 k -25,6 15 k -25,6 3,99 k -87,430 k -21,6 30 k -27,1 30 k -27,2 4 k -82,445 k -24,1 45 k -29,6 45 k -29,7 80 k -62,464 k -27,6 65 k -32,6 63 k -32,6 137,99 k -34,1
137,99 k -27,7 137,99 k -32,8 137 k -32,8 138 k -29,9138 k -26,1 138 k -31,7 139 k -31,7 1 104 k -29,9277 k -26,8 272 k -32,5 294 k -32,7 3 093 k -79,9407 k -27,8 414 k -34,2 417 k -34,2 4 545 k -99,9
1,106 M -27,8 1,103 M -34,2 1 110 k -34,2 30 M -99,94,544 M -96,2 4,360 M -101,6 2 160 k -66,1
30 M -96,2 30 M -101,6 2 400 k -63,62 550 k -63,820 M -101,630 M -101,6

ETSI
ETSI TS 101 388 V1.3.1 (2002-05)28
Table 13: Break frequencies of the "X.NT.#" PSD masks for testing FDD ADSL over POTS systems
X.NT.FA X.NT.FB X.NT.FC X.NT.FD(Hz) (dBm/Hz) (Hz) (dBm/Hz) (Hz) (dBm/Hz) (Hz) (dBm/Hz)
1 -20,0 1 -25,8 1 -25,8 1 -87,415 k -20,0 15 k -25,6 2 k -25,8 3,99 k -87,424 k -20,9 24 k -26,5 15 k -25,6 4 k -82,430 k -21,0 30 k -26,8 22 k -26,4 25,875 k -27,945 k -23,0 61 k -30,5 30 k -26,8 138 k -27,960 k -24,7 138 k -30,8 45 k -28,8 307 k -79,9
138 k -24,9 149 k -33,0 60 k -30,5 1 221 k -79,9151 k -28,0 200 k -33,5 138 k -30,7 1 630 k -99,9207 k -28,7 308 k -35,2 150 k -33,0 30 M -99,9300 k -30,3 375 k -38,5 206 k -33,6358 k -32,8 456 k -46,9 338 k -35,7407 k -36,7 605 k -68,4 477 k -47,8500 k -48,6 755 k -68,4 788 k -45,4594 k -62,3 980 k -77,3 1 064 k -45,5755 k -62,3 1 128 k -80,8 1 500 k -50,1
1 059 k -73,7 1 402 k -83,7 1 800 k -58,61 221 k -75,5 2 570 k -101,6 20 M -101,61 400 k -77,9 30 M -101,6 30 M -101,62 532 k -96,230 M -96,2
5.3.4.1.4 Frequency domain profiles for FDD ADSL over ISDN
The LT-profiles for FDD ADSL over ISDN systems are specified in table 14 and the NT-profiles in table 15. Each PSDprofile represents a mix of disturbers. These profiles shall be met for all frequencies between 1 kHz and 2 MHz. ThePSD profiles are constructed with straight lines between these break frequencies, when plotted against a logarithmicfrequency scale and a linear dBm scale.
Table 14: Break frequencies of the "X.LT.#" PSD masks for testing FDD ADSL over ISDN systems
X.LT.FA X.LT.FB X.LT.FC X.LT.FD(Hz) (dBm/Hz) (Hz) (dBm/Hz) (Hz) (dBm/Hz) (Hz) (dBm/Hz)
1 -20,1 1 -25,8 1 -25,7 1 -79,914 k -20 2 k -25,8 15 k -25,6 93,1 k -79,930 k -21,5 15 k -25,6 30 k -27,2 209 k -51,945 k -24,1 30 k -27,1 45 k -29,6 253,99 k -38,464 k -27,7 45 k -29,6 62 k -32,6 254 k -29,9
105 k -27,6 66 k -32,6 107 k -32,6 1 104 k -29,9204 k -28,7 106 k -32,6 203 k -33,6 3 093 k -79,9253 k -29,4 200 k -33,6 253,8 k -34,3 4 545 k -99,9255 k -26,7 253 k -34,3 254 k -32,5 30 M -99,9412 k -27,8 254 k -32,5 300 k -32,8
1 104 k -27,8 303 k -32,9 409 k -34,24 543 k -96,2 417 k -34,2 1 104 k -34,230 M -96,2 1 104 k -34,2 1 703 k -53,6
4 439 k -101,6 2 162 k -66,230 M -101,6 2 387 k -63,7
2 520 k -63,62 677 k -65,520 M -101,630 M -101,6

ETSI
ETSI TS 101 388 V1.3.1 (2002-05)29
Table 15: Break frequencies of the "X.NT.#" PSD masks for testing FDD ADSL over ISDN systems
X.NT.FA X.NT.FB X.NT.FC X.NT.FD(Hz) (dBm/Hz) (Hz) (dBm/Hz) (Hz) (dBm/Hz) (Hz) (dBm/Hz)
1 -20,1 1 -25,8 1 -25,6 1 -79,915 k -20 2 k -25,8 15 k -25,6 50 k -79,930 k -21,5 15 k -25,6 30 k -27,2 80 k -71,845 k -24,1 30 k -27,1 45 k -29,6 120 k -27,965 k -27,6 44 k -29,6 62 k -32,6 276 k -27,9
111 k -27,7 64 k -32,6 114 k -32,7 614 k -79,9120 k -24,8 114 k -32,6 120 k -30,7 1 221 k -79,9275 k -25,3 120 k -30,7 200 k -31,0 1 630 k -99,9300 k -29,1 277 k -31,4 276 k -31,4 30 M -99,9403 k -36 305 k -34,9 300 k -34,6500 k -48,6 389 k -39,3 377 k -38,7614 k -64,8 500 k -53,6 470 k -47,8630 k -64,8 620 k -70,1 802 k -45,4651 k -62,3 633 k -70,1 1 024 k -45,6755 k -62,4 650 k -68,2 1 309 k -47,8
1 023 k -72,7 758 k -68,5 1 587 k -52,31 220 k -75,5 1 071 k -79,9 1 900 k -63,01 400 k -77,9 1 222 k -81,6 2 011 k -76,82 590 k -96,2 1 398 k -83,7 2 283 k -63,730 M -96,2 2 479 k -101,6 2 492 k -63,7
30 M -101,6 2 716 k -66,120 M -101,630 M -101,6
5.3.4.2 Time domain profiles of generator G1-G4
The noise, as specified in the frequency domain in clauses 5.3.3.1 to 5.3.3.4, shall be random in nature and nearGaussian distributed. This means that the amplitude distribution function of the combined impairment noise injected atthe adding element (see figure 4) shall lie between the two boundaries illustrated in figure 10 and defined in table 16.
It is expected that noise generators will generate signals that are approximately Gaussian. Therefore, the upper bound offigure 10 is loose. PDFs of signals generated by noise generators are expected to be well below the upper boundallowed by the PDF mask shown in figure 10.
The amplitude distribution function F(a) of noise u(t) is the fraction of the time that the absolute value of u(t) exceedsthe value "a". From this definition, it can be concluded that F(0) = 1 and that F(a) monotonically decreases up to thepoint where "a" equals the peak value of the signal. From there on, F(a) vanishes:
0)( =aF , for peakua ≥ .
The boundaries on the amplitude distribution ensure that the noise is characterized by peak values that are occasionallysignificantly higher than the rms-value of that noise (up to 5 times the rms-value).

ETSI
ETSI TS 101 388 V1.3.1 (2002-05)30
0 1 2 3 4 5 6 710
-8
10-6
10-4
10-2
100
Flow er
Fupper
NOTE: The non-shaded area is the allowed region. The boundaries of the mask are specified in table 16.
Figure 10: Mask for the amplitude distribution function.
Table 16: Upper and lower boundaries of the amplitude distribution function of the noise
Boundary (σσσσ = rms value of noise) Interval Parameter ValueFlower(a) = (1 - ε) · 1 - erf((a/σ)/√2) 0 ≤ a/σ < CF Crest factor CF = 5
Flower(a) = 0 CF ≤ a/σ < ∞ Gaussian gap ε = 0,1
Fupper(a) = (1 + ε) · 1 - erf((a/σ)/√2) 0 ≤ a/σ < A A = CF/2 = 2,5
Fupper(a) = (1 + ε) · 1 - erf(A/√2) A ≤ a/σ < ∞
The meaning of the parameters in table 16 is as follows:
• CF denotes the minimum crest factor of the noise. Crest factor is defined as the ratio between the absolute peakvalue and rms value (CF = |upeak|/urms).
• ε denotes the Gaussian gap that indicates how closely the near Gaussian noise approximates true Gaussian noise.
• "A" denotes the point beyond which the upper limit is alleviated to allow the use of noise signals of practicalrepetition length.

ETSI
ETSI TS 101 388 V1.3.1 (2002-05)31
5.4 Transmission performance tests
5.4.1 Bit error ratio requirements
The ADSL system under test shall operate with a noise margin of at least +6 dB when operated over any of the testloops with the noise models and test conditions as specified in this clause. The noise margin is measured using themethod described in clause 5.4.2.1. The long-term bit error ratio shall be less than 1 in 107, with margin greater than0 dB. In general, the bit error ratio, and the frequency of error bursts should decrease as the margin is increased. Thebehaviour of the bit error ratio with increasing noise margin depends on the modem settings (e.g. interleaver settings).
NOTE: The specification of performance objectives for error performance with margins equal to or greater than6 dB, including performance objectives for the frequency of error bursts and measuring methods toestablish conformance to these limits with necessary confidence, is for further study.
The measurement period shall be at least (N × 107)/R, where N = 100 and R is the bit rate in the direction being tested.A long-term performance test shall be performed for a period of not less than 24 h to ensure long-term temporalstability (see clause 5.4.3).
5.4.1.1 Control of transmit power in opposing direction
This clause specifies the transmit PSD and the bitrate to be used in the direction opposing the direction under test.
The transmit PSD used in the direction not under test shall be at the nominal value. This means that the transmit PSDshall be around -40 dBm/Hz minus the power cutback in downstream, and around -38 dBm/Hz in upstream. Theindividual carrier gains shall be ±2,5 dB around the nominal. The bitrate of the link in the direction not under test shallbe at the maximal available value, with a target margin of 6 dB. Tones determined to be unusable in the bit-loadingprocedure are allowed to be turned off.
NOTE: With these conditions, a maximal number of tones will be used in the direction not under test, all withmargin of about 6 dB, all around the nominal PSD. The PSD level can be forced around the nominal levelby forcing the noise margin to highest possible value via the appropriate interface of the modem.
5.4.2 Measuring noise margin
Before start-up of the ADSL modem under test, the level and shape of injected noise are adjusted, and their level isprobed at port Rx to meet the impairment level specification in clause 5.3. This relative level is referred to as 0 dB. Thetransceiver link is subsequently activated, and the bit error ratio of the link is monitored.
5.4.2.1 Measuring cross-talk noise margin
To measure the cross-talk noise margin, the cross-talk noise level x is increased in steps of 1 dB until the Bit Error Ratio(BER) is higher than 10-7. The adjustment to the noise level shall be equivalent to adjusting the gain of amplifier A1 infigure 9, equally over the full frequency band of the ADSL system under test. The cross-talk noise margin is defined asthe highest increase in noise level, relative to the 0 dB level, that yields a BER no higher than 10-7.
A delay of 5 seconds shall be imposed between 1 dB increases to allow the system to stabilize.
The noise margins shall be measured for upstream as well as downstream transmission for all the test loops defined inclause 5.2 except loop #0, the zero length loop. To verify that ADSL systems under test meet the 6 dB cross-talk noisemargin requirement, it is sufficient to verify that the BER is no higher than 10-7 when the noise level is increased by6 dB, in steps of 1 dB, relative to the 0 dB reference level.
5.4.2.2 Measuring impulse noise margin
The content of this clause is for further study.
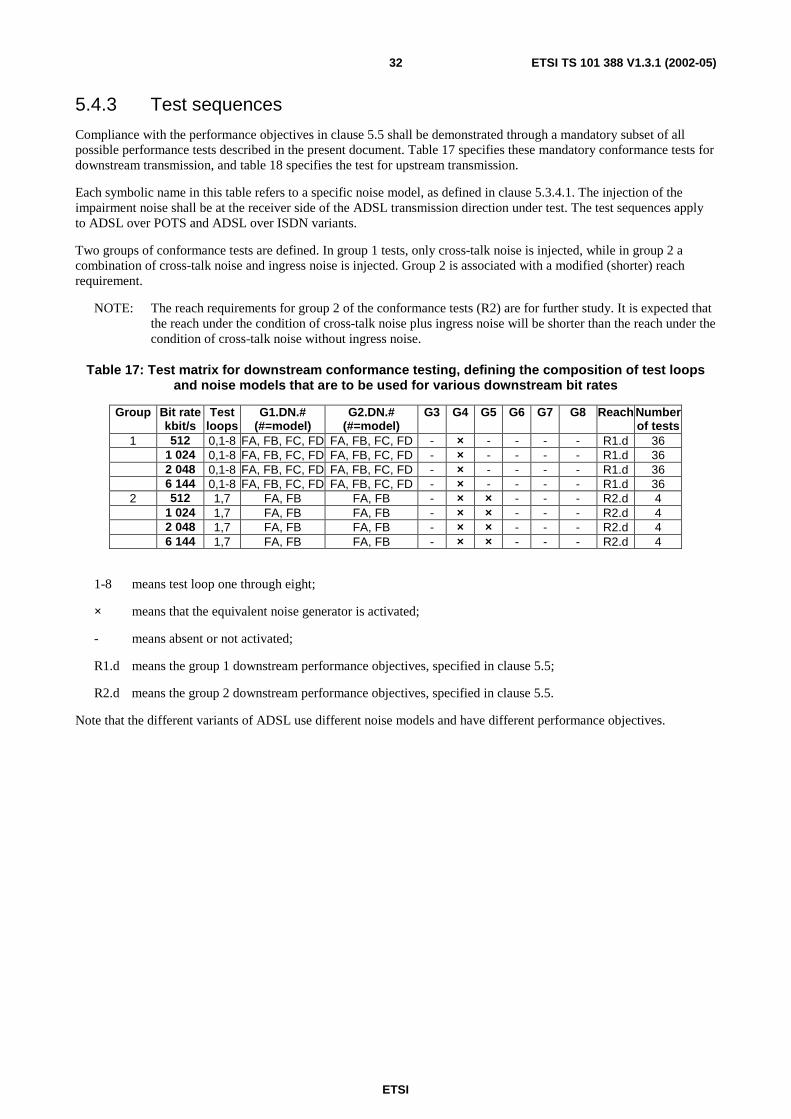
ETSI
ETSI TS 101 388 V1.3.1 (2002-05)32
5.4.3 Test sequences
Compliance with the performance objectives in clause 5.5 shall be demonstrated through a mandatory subset of allpossible performance tests described in the present document. Table 17 specifies these mandatory conformance tests fordownstream transmission, and table 18 specifies the test for upstream transmission.
Each symbolic name in this table refers to a specific noise model, as defined in clause 5.3.4.1. The injection of theimpairment noise shall be at the receiver side of the ADSL transmission direction under test. The test sequences applyto ADSL over POTS and ADSL over ISDN variants.
Two groups of conformance tests are defined. In group 1 tests, only cross-talk noise is injected, while in group 2 acombination of cross-talk noise and ingress noise is injected. Group 2 is associated with a modified (shorter) reachrequirement.
NOTE: The reach requirements for group 2 of the conformance tests (R2) are for further study. It is expected thatthe reach under the condition of cross-talk noise plus ingress noise will be shorter than the reach under thecondition of cross-talk noise without ingress noise.
Table 17: Test matrix for downstream conformance testing, defining the composition of test loopsand noise models that are to be used for various downstream bit rates
Group Bit ratekbit/s
Testloops
G1.DN.#(#=model)
G2.DN.#(#=model)
G3 G4 G5 G6 G7 G8 Reach Numberof tests
1 512 0,1-8 FA, FB, FC, FD FA, FB, FC, FD - × - - - - R1.d 361 024 0,1-8 FA, FB, FC, FD FA, FB, FC, FD - × - - - - R1.d 362 048 0,1-8 FA, FB, FC, FD FA, FB, FC, FD - × - - - - R1.d 366 144 0,1-8 FA, FB, FC, FD FA, FB, FC, FD - × - - - - R1.d 36
2 512 1,7 FA, FB FA, FB - × × - - - R2.d 41 024 1,7 FA, FB FA, FB - × × - - - R2.d 42 048 1,7 FA, FB FA, FB - × × - - - R2.d 46 144 1,7 FA, FB FA, FB - × × - - - R2.d 4
1-8 means test loop one through eight;
× means that the equivalent noise generator is activated;
- means absent or not activated;
R1.d means the group 1 downstream performance objectives, specified in clause 5.5;
R2.d means the group 2 downstream performance objectives, specified in clause 5.5.
Note that the different variants of ADSL use different noise models and have different performance objectives.

ETSI
ETSI TS 101 388 V1.3.1 (2002-05)33
Table 18: Test matrix for upstream conformance testing, defining the composition of test loopsand noise models that are to be used for various upstream bit rates
Group Bit ratekbit/s
Testloops
G1.UP.#(#=model)
G2.UP.#(#=model)
G3 G4 G5 G6 G7 G8 Reach Numberof tests
1 64 0,1-8 FA, FB, FC, FDFA, FB, FC, FD - × - - - - R1.u 36256 0,1-8 FA, FB, FC, FDFA, FB, FC, FD - × - - - - R1.u 36640 0,1-8 FA, FB, FC, FDFA, FB, FC, FD - × - - - - R1.u 36
2 64 1,7 FA, FB FA, FB - × × - - - R2.u 4256 1,7 FA, FB FA, FB - × × - - - R2.u 4640 1,7 FA, FB FA, FB - × × - - - R2.u 4
1-8 means test loop one through eight;
× means that the equivalent noise generator is activated;
- means absent or not activated;
R1.u means the group 1 upstream performance objectives, specified in clause 5.5;
R2.u means the group 2 upstream performance objectives, specified in clause 5.5.
Note that the different variants of ADSL use different noise models and performance objectives.
5.4.4 Micro-interruptions
A micro-interruption is a temporary line interruption due to external mechanical action on the copper wires constitutingthe transmission path, for example, at a cable splice. Splices can be hand-made wire-to-wire junctions, and during cablelife oxidation phenomena and mechanical vibrations can induce micro-interruptions at these critical points.
The effect of a micro-interruption on the transmission system can be a failure of the digital transmission link, togetherwith a failure of the power feeding (if provided) for the duration of the micro-interruption.
The objective is that in the presence of a micro-interruption of specified maximum length, the ADSL transceiver shouldnot reset, and the system should resume normal reception and transmission.
The transceiver shall not be reset by a micro-interruption event of duration t = 10 ms, which shall occur at an eventfrequency of 0,2 Hz.
Note of caution related to the duration of the test: After missing RX signal a few times for 10 ms (i.e. 40 symbols, andseveral kbit) the ADSL modem will report severely errored seconds, at a rhythm of 1 every 5 seconds. Under thesecircumstances the modem might be asked to retrain by higher layers, even though the modem has not lostsynchronization and although there is no need for the modem to retrain in this particular test.
5.5 Performance objectivesThe performance objectives, R1.d and R1.u, for each test loop are specified in tables 20 through 51. There are differentobjectives for EC ADSL over POTS, EC ADSL over ISDN, FDD ADSL over POTS, and FDD ADSL over ISDN. Theperformance objectives R2.d and R2.u are for further study.
For each test case in the performance objective tables, the specified electrical length Y (insertion loss at the specifiedtest frequency) is normative. The physical lengths L are given for information only. If the electrical length of a test loopis out of specification when the informative physical length is used, then the total physical length of the loop shall beadjusted as specified in clause 5.2.3.
The length is chosen to be a typical maximum loop length for which the ADSL transceiver under test can support thespecified bit rate at the target bit error ratio. This value is bit rate dependent: the higher the payload bit rate, the lowerthe insertion loss that can be handled in practice.
In the context of the performance objectives in this clause, payload data rate means net data rate as specified inclauses 6.2 and 6.3 of ITU-T Recommendation G.992.1 [2]. For ATM transfer, the ATM overhead is included in the netdata rate.

ETSI
ETSI TS 101 388 V1.3.1 (2002-05)34
Clauses 5.5.1 through 5.5.4 provide performance objectives for the ADSL variants, including EC ADSL over ISDN, ECADSL over POTS, FDD ADSL over ISDN, and FDD ADSL over POTS.
The performance objectives shall be met while maintaining a 6 dB noise margin and a bit error ratio of 10-7 or lower.
Systems configured as specified in table 19 should meet the performance objectives. Other modem configurationparameter combinations may also result in the system meeting the objectives.
NOTE: The requirements in tables 20 through 51 were derived based on simulations. Following tests of realmodems, in the future the requirements may need to be adjusted if specific requirements appear to be toohigh or too low for practical implementations.
Table 19: Modem configuration parameters for performance verification
Parameter ValuePath InterleavedLatency HighTrellis To meet the objectives,
trellis coding, which is anoptional feature, may beused
Noise margin 6 dB
5.5.1 Performance objectives for EC ADSL over ISDN
Tables 20 through 27 provide performance objectives for EC ADSL over ISDN with noise models FA through FD.Systems configured as specified in table 19 should meet these performance objectives.
Table 20: Reach requirements for EC ADSL over ISDN downstream with noise model FA
PayloadBitrate(kbit/s)
fT(kHz)
Loop #1Y
(dB)
Loop #2Y
(dB)
Loop #3Y
(dB)
Loop #4Y
(dB)
Loop #5Y
(dB)
Loop #6Y
(dB)
Loop #7Y
(dB)
Loop #8Y
(dB)512 300 37,00*
(2 594)37,00
(3 459)37,50*
(3 004)37,00*
(3 135)37,50
(3 306)37,50
(3 144)36,50
(4 810)40,00*
(2 143)768 300 37,00*
(2 594)36,00
(3 366)37,00
(2 969)36,50
(3 099)36,50
(3 236)37,00
(3 109)35,50
(4 740)40,00*
(2 143)1 024 300 37,00*
(2 594)35,50
(3 319)36,00
(2 899)36,00
(3 064)36,00
(3 201)36,00
(3 039)35,00
(4 704)40,00*
(2 143)1 544 300 35,50
(2 489)34,00
(3 179)34,50
(2 794)34,00
(2 924)34,00
(3 061)34,50
(2 934)33,00
(4 564)40,00*
(2 143)2 048 300 33,50
(2 349)32,00
(2 992)32,50
(2 653)32,00
(2 784)32,00
(2 920)32,50
(2 793)31,00
(4 424)40,00*
(2 143)3 072 300 30,00
(2 103)28,50
(2 664)29,00
(2 408)28,50
(2 538)28,50
(2 674)28,50
(2 512)- 37,00
(1 934)4 096 300 25,00
(1 752)23,00
(2 149)23,50
(2 021)- 22,50
(2 253)23,50
(2 162)- 33,00
(1 653)5 120 300 18,00
(1 260)15,50
(1 447)- - - - - 28,00
(1 314)6 144 300 - - - - - - - -
* Limited in reach by longest reach in upstream direction.
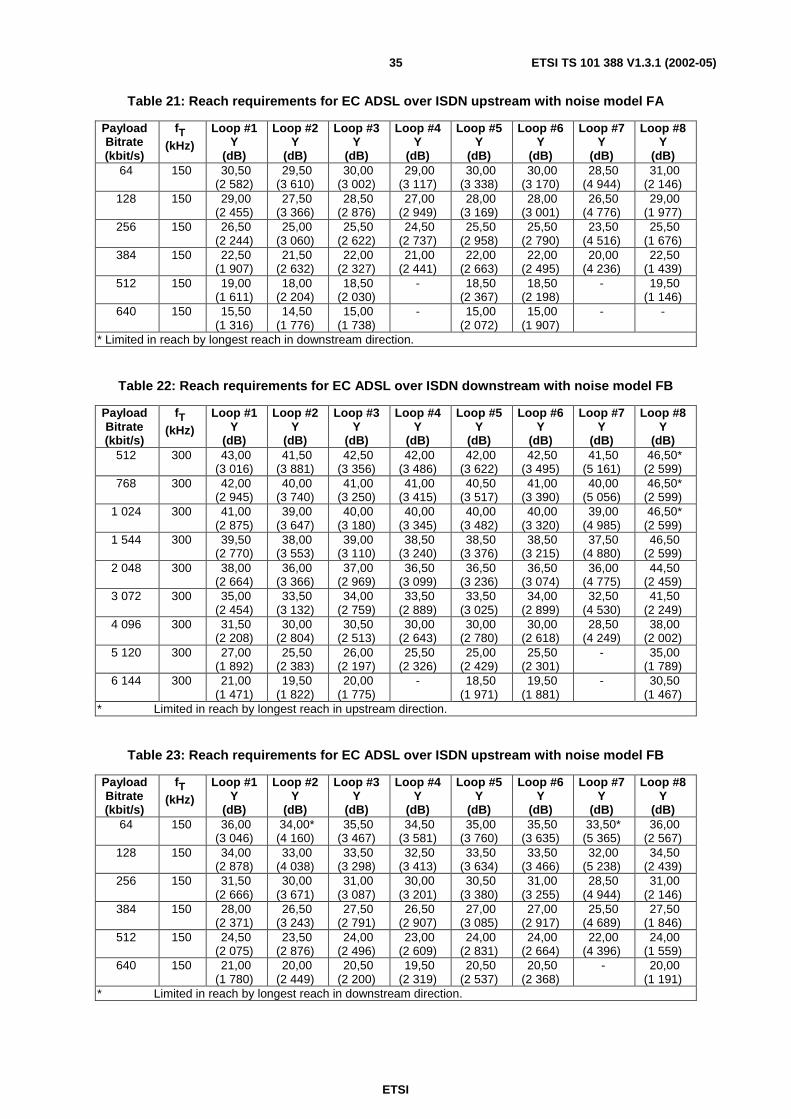
ETSI
ETSI TS 101 388 V1.3.1 (2002-05)35
Table 21: Reach requirements for EC ADSL over ISDN upstream with noise model FA
PayloadBitrate(kbit/s)
fT(kHz)
Loop #1Y
(dB)
Loop #2Y
(dB)
Loop #3Y
(dB)
Loop #4Y
(dB)
Loop #5Y
(dB)
Loop #6Y
(dB)
Loop #7Y
(dB)
Loop #8Y
(dB)64 150 30,50
(2 582)29,50
(3 610)30,00
(3 002)29,00
(3 117)30,00
(3 338)30,00
(3 170)28,50
(4 944)31,00
(2 146)128 150 29,00
(2 455)27,50
(3 366)28,50
(2 876)27,00
(2 949)28,00
(3 169)28,00
(3 001)26,50
(4 776)29,00
(1 977)256 150 26,50
(2 244)25,00
(3 060)25,50
(2 622)24,50
(2 737)25,50
(2 958)25,50
(2 790)23,50
(4 516)25,50
(1 676)384 150 22,50
(1 907)21,50
(2 632)22,00
(2 327)21,00
(2 441)22,00
(2 663)22,00
(2 495)20,00
(4 236)22,50
(1 439)512 150 19,00
(1 611)18,00
(2 204)18,50
(2 030)- 18,50
(2 367)18,50
(2 198)- 19,50
(1 146)640 150 15,50
(1 316)14,50
(1 776)15,00
(1 738)- 15,00
(2 072)15,00
(1 907)- -
* Limited in reach by longest reach in downstream direction.
Table 22: Reach requirements for EC ADSL over ISDN downstream with noise model FB
PayloadBitrate(kbit/s)
fT(kHz)
Loop #1Y
(dB)
Loop #2Y
(dB)
Loop #3Y
(dB)
Loop #4Y
(dB)
Loop #5Y
(dB)
Loop #6Y
(dB)
Loop #7Y
(dB)
Loop #8Y
(dB)512 300 43,00
(3 016)41,50
(3 881)42,50
(3 356)42,00
(3 486)42,00
(3 622)42,50
(3 495)41,50
(5 161)46,50*
(2 599)768 300 42,00
(2 945)40,00
(3 740)41,00
(3 250)41,00
(3 415)40,50
(3 517)41,00
(3 390)40,00
(5 056)46,50*
(2 599)1 024 300 41,00
(2 875)39,00
(3 647)40,00
(3 180)40,00
(3 345)40,00
(3 482)40,00
(3 320)39,00
(4 985)46,50*
(2 599)1 544 300 39,50
(2 770)38,00
(3 553)39,00
(3 110)38,50
(3 240)38,50
(3 376)38,50
(3 215)37,50
(4 880)46,50
(2 599)2 048 300 38,00
(2 664)36,00
(3 366)37,00
(2 969)36,50
(3 099)36,50
(3 236)36,50
(3 074)36,00
(4 775)44,50
(2 459)3 072 300 35,00
(2 454)33,50
(3 132)34,00
(2 759)33,50
(2 889)33,50
(3 025)34,00
(2 899)32,50
(4 530)41,50
(2 249)4 096 300 31,50
(2 208)30,00
(2 804)30,50
(2 513)30,00
(2 643)30,00
(2 780)30,00
(2 618)28,50
(4 249)38,00
(2 002)5 120 300 27,00
(1 892)25,50
(2 383)26,00
(2 197)25,50
(2 326)25,00
(2 429)25,50
(2 301)- 35,00
(1 789)6 144 300 21,00
(1 471)19,50
(1 822)20,00
(1 775)- 18,50
(1 971)19,50
(1 881)- 30,50
(1 467)* Limited in reach by longest reach in upstream direction.
Table 23: Reach requirements for EC ADSL over ISDN upstream with noise model FB
PayloadBitrate(kbit/s)
fT(kHz)
Loop #1Y
(dB)
Loop #2Y
(dB)
Loop #3Y
(dB)
Loop #4Y
(dB)
Loop #5Y
(dB)
Loop #6Y
(dB)
Loop #7Y
(dB)
Loop #8Y
(dB)64 150 36,00
(3 046)34,00*
(4 160)35,50
(3 467)34,50
(3 581)35,00
(3 760)35,50
(3 635)33,50*
(5 365)36,00
(2 567)128 150 34,00
(2 878)33,00
(4 038)33,50
(3 298)32,50
(3 413)33,50
(3 634)33,50
(3 466)32,00
(5 238)34,50
(2 439)256 150 31,50
(2 666)30,00
(3 671)31,00
(3 087)30,00
(3 201)30,50
(3 380)31,00
(3 255)28,50
(4 944)31,00
(2 146)384 150 28,00
(2 371)26,50
(3 243)27,50
(2 791)26,50
(2 907)27,00
(3 085)27,00
(2 917)25,50
(4 689)27,50
(1 846)512 150 24,50
(2 075)23,50
(2 876)24,00
(2 496)23,00
(2 609)24,00
(2 831)24,00
(2 664)22,00
(4 396)24,00
(1 559)640 150 21,00
(1 780)20,00
(2 449)20,50
(2 200)19,50
(2 319)20,50
(2 537)20,50
(2 368)- 20,00
(1 191)* Limited in reach by longest reach in downstream direction.
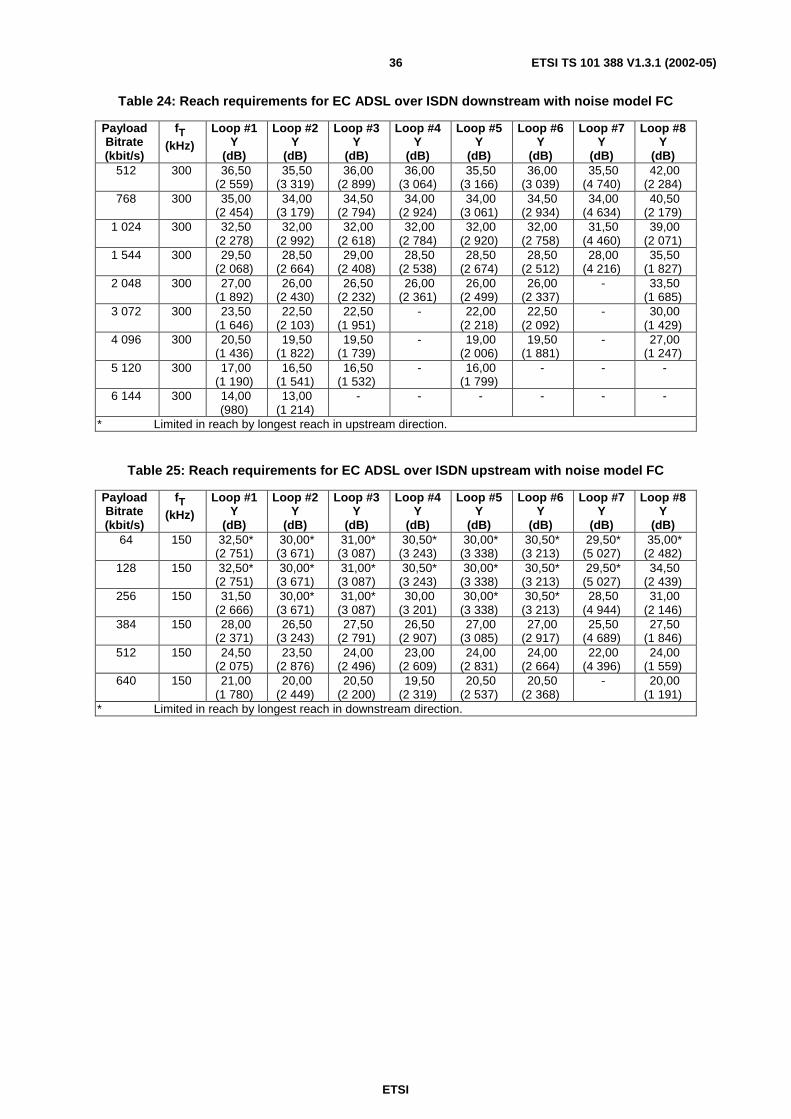
ETSI
ETSI TS 101 388 V1.3.1 (2002-05)36
Table 24: Reach requirements for EC ADSL over ISDN downstream with noise model FC
PayloadBitrate(kbit/s)
fT(kHz)
Loop #1Y
(dB)
Loop #2Y
(dB)
Loop #3Y
(dB)
Loop #4Y
(dB)
Loop #5Y
(dB)
Loop #6Y
(dB)
Loop #7Y
(dB)
Loop #8Y
(dB)512 300 36,50
(2 559)35,50
(3 319)36,00
(2 899)36,00
(3 064)35,50
(3 166)36,00
(3 039)35,50
(4 740)42,00
(2 284)768 300 35,00
(2 454)34,00
(3 179)34,50
(2 794)34,00
(2 924)34,00
(3 061)34,50
(2 934)34,00
(4 634)40,50
(2 179)1 024 300 32,50
(2 278)32,00
(2 992)32,00
(2 618)32,00
(2 784)32,00
(2 920)32,00
(2 758)31,50
(4 460)39,00
(2 071)1 544 300 29,50
(2 068)28,50
(2 664)29,00
(2 408)28,50
(2 538)28,50
(2 674)28,50
(2 512)28,00
(4 216)35,50
(1 827)2 048 300 27,00
(1 892)26,00
(2 430)26,50
(2 232)26,00
(2 361)26,00
(2 499)26,00
(2 337)- 33,50
(1 685)3 072 300 23,50
(1 646)22,50
(2 103)22,50
(1 951)- 22,00
(2 218)22,50
(2 092)- 30,00
(1 429)4 096 300 20,50
(1 436)19,50
(1 822)19,50
(1 739)- 19,00
(2 006)19,50
(1 881)- 27,00
(1 247)5 120 300 17,00
(1 190)16,50
(1 541)16,50
(1 532)- 16,00
(1 799)- - -
6 144 300 14,00(980)
13,00(1 214)
- - - - - -
* Limited in reach by longest reach in upstream direction.
Table 25: Reach requirements for EC ADSL over ISDN upstream with noise model FC
PayloadBitrate(kbit/s)
fT(kHz)
Loop #1Y
(dB)
Loop #2Y
(dB)
Loop #3Y
(dB)
Loop #4Y
(dB)
Loop #5Y
(dB)
Loop #6Y
(dB)
Loop #7Y
(dB)
Loop #8Y
(dB)64 150 32,50*
(2 751)30,00*
(3 671)31,00*
(3 087)30,50*
(3 243)30,00*
(3 338)30,50*
(3 213)29,50*
(5 027)35,00*
(2 482)128 150 32,50*
(2 751)30,00*
(3 671)31,00*
(3 087)30,50*
(3 243)30,00*
(3 338)30,50*
(3 213)29,50*
(5 027)34,50
(2 439)256 150 31,50
(2 666)30,00*
(3 671)31,00*
(3 087)30,00
(3 201)30,00*
(3 338)30,50*
(3 213)28,50
(4 944)31,00
(2 146)384 150 28,00
(2 371)26,50
(3 243)27,50
(2 791)26,50
(2 907)27,00
(3 085)27,00
(2 917)25,50
(4 689)27,50
(1 846)512 150 24,50
(2 075)23,50
(2 876)24,00
(2 496)23,00
(2 609)24,00
(2 831)24,00
(2 664)22,00
(4 396)24,00
(1 559)640 150 21,00
(1 780)20,00
(2 449)20,50
(2 200)19,50
(2 319)20,50
(2 537)20,50
(2 368)- 20,00
(1 191)* Limited in reach by longest reach in downstream direction.

ETSI
ETSI TS 101 388 V1.3.1 (2002-05)37
Table 26: Reach requirements for EC ADSL over ISDN downstream with noise model FD
PayloadBitrate(kbit/s)
fT(kHz)
Loop #1Y
(dB)
Loop #2Y
(dB)
Loop #3Y
(dB)
Loop #4Y
(dB)
Loop #5Y
(dB)
Loop #6Y
(dB)
Loop #7Y
(dB)
Loop #8Y
(dB)512 300 40,50*
(2 840)43,00*
(4 021)41,50*
(3 285)40,50*
(3 380)41,50*
(3 587)41,50*
(3 425)42,00*
(5 196)44,00*
(2 423)768 300 40,50*
(2 840)43,00*
(4 021)41,50*
(3 285)40,50*
(3 380)41,50*
(3 587)41,50*
(3 425)42,00*
(5 196)44,00*
(2 423)1 024 300 40,50*
(2 840)43,00*
(4 021)41,50*
(3 285)40,50*
(3 380)41,50*
(3 587)41,50*
(3 425)42,00*
(5 196)44,00*
(2 423)1 544 300 40,50*
(2 840)42,00
(3 927)41,50*
(3 285)40,50*
(3 380)41,50*
(3 587)41,50*
(3 425)41,50
(5 161)44,00*
(2 423)2 048 300 40,50*
(2 840)40,00
(3 740)41,00
(3 250)40,50*
(3 380)40,50
(3 517)40,50
(3 355)39,00
(4 985)44,00*
(2 423)3 072 300 38,00
(2 664)36,00
(3 366)37,00
(2 969)36,50
(3 099)36,50
(3 236)37,00
(3 109)35,00
(4 704)44,00*
(2 423)4 096 300 33,00
(2 313)31,50
(2 945)32,00
(2 618)31,50
(2 748)31,00
(2 850)31,50
(2 723)29,00
(4 283)41,00
(2 214)5 120 300 25,50
(1 787)23,00
(2 149)23,50
(2 021)- 22,00
(2 218)23,50
(2 162)- 36,50
(1 900)6 144 300 16,00
(1 120)13,50
(1 261)- - - - - 29,00
(1 368)* Limited in reach by longest reach in upstream direction.
Table 27: Reach requirements for EC ADSL over ISDN upstream with noise model FD
PayloadBitrate(kbit/s)
fT(kHz)
Loop #1Y
(dB)
Loop #2Y
(dB)
Loop #3Y
(dB)
Loop #4Y
(dB)
Loop #5Y
(dB)
Loop #6Y
(dB)
Loop #7Y
(dB)
Loop #8Y
(dB)64 150 33,50
(2 835)32,50
(3 977)33,00
(3 256)32,00
(3 370)33,00
(3 591)33,00
(3 424)31,50
(5 196)34,00
(2 397)128 150 32,00
(2 709)31,00
(3 794)31,50
(3 129)30,50
(3 243)31,00
(3 422)31,50
(3 297)29,50
(5 027)32,00
(2 229)256 150 29,00
(2 455)27,50
(3 366)28,50
(2 876)27,50
(2 991)28,00
(3 169)28,50
(3 044)26,50
(4 776)28,50
(1 934)384 150 25,50
(2 160)24,50
(2 999)25,00
(2 580)24,00
(2 694)25,00
(2 916)25,00
(2 748)23,00
(4 475)25,50
(1 676)512 150 22,00
(1 864)21,00
(2 571)21,50
(2 285)20,50
(2 400)21,50
(2 621)21,50
(2 453)- 20,50
(1 242)640 150 18,50
(1 569)18,00
(2 204)18,00
(1 988)- 18,00
(2 324)18,00
(2 156)- 19,50
(1 146)* Limited in reach by longest reach in downstream direction.

ETSI
ETSI TS 101 388 V1.3.1 (2002-05)38
5.5.2 Performance objectives for EC ADSL over POTS
Tables 28 through 35 provide performance objectives for EC ADSL over POTS with noise models FA through FD.Systems configured as specified in table 19 should meet these performance objectives.
Table 28: Reach requirements for EC ADSL over POTS downstream with noise model FA
PayloadBitrate(kbit/s)
fT(kHz)
Loop #1Y
(dB)
Loop #2Y
(dB)
Loop #3Y
(dB)
Loop #4Y
(dB)
Loop #5Y
(dB)
Loop #6Y
(dB)
Loop #7Y
(dB)
Loop #8Y
(dB)512 300 41,50
(2 910)41,00
(3 834)41,00
(3 250)41,00
(3 415)41,00
(3 552)41,00
(3 390)41,50
(5 161)47,00
(2 634)768 300 39,50
(2 770)39,00
(3 647)39,50
(3 145)39,00
(3 275)39,00
(3 412)39,50
(3 285)39,50
(5 020)46,00
(2 564)1 024 300 38,50
(2 700)37,50
(3 506)38,00
(3 040)37,50
(3 170)37,50
(3 306)37,50
(3 144)37,50
(4 880)45,00
(2 494)1 544 300 37,00
(2 594)35,50
(3 319)36,50
(2 934)36,00
(3 064)36,00
(3 201)36,00
(3 039)35,50
(4 740)43,50
(2 388)2 048 300 35,50
(2 489)34,50
(3 225)35,00
(2 829)34,50
(2 959)34,50
(3 096)34,50
(2 934)34,00
(4 634)42,00
(2 284)3 072 300 32,00
(2 243)31,00
(2 898)31,50
(2 583)31,50
(2 748)31,00
(2 850)31,50
(2 723)30,50
(4 387)38,50
(2 036)4 096 300 28,50
(1 997)27,50
(2 570)27,50
(2 302)27,50
(2 468)27,50
(2 604)27,50
(2 443)- 35,50
(1 827)5 120 300 23,50
(1 646)22,00
(2 056)22,50
(1 951)- 21,50
(2 183)22,00
(2 056)- 31,50
(1 551)6 144 300 17,00
(1 190)15,50
(1 447)- - - - - 26,50
(1 186)* Limited in reach by longest reach in upstream direction.
Table 29: Reach requirements for EC ADSL over POTS upstream with noise model FA
PayloadBitrate(kbit/s)
fT(kHz)
Loop #1Y
(dB)
Loop #2Y
(dB)
Loop #3Y
(dB)
Loop #4Y
(dB)
Loop #5Y
(dB)
Loop #6Y
(dB)
Loop #7Y
(dB)
Loop #8Y
(dB)64 75 32,50*
(3 153)32,50*
(4 721)32,50*
(3 649)32,50*
(3 867)32,50*
(4 024)32,50*
(3 836)33,00*
(6 001)40,00
(2 828)128 75 32,50*
(3 153)32,50*
(4 721)32,50*
(3 649)32,50*
(3 867)32,50*
(4 024)32,50*
(3 836)33,00*
(6 001)36,50
(2 489)256 75 31,50
(3 057)31,50
(4 576)31,50
(3 553)30,50
(3 675)31,00
(3 880)31,50
(3 740)30,00
(5 714)33,50
(2 205)384 75 27,00
(2 625)27,00
(3 926)27,00
(3 121)26,00
(3 242)26,50
(3 448)26,50
(3 260)25,50
(5 281)29,00
(1 782)512 75 22,50
(2 193)22,50
(3 275)22,00
(2 640)21,50
(2 812)22,00
(3 016)22,00
(2 828)21,50
(4 895)25,00
(1 344)640 75 18,00
(1 762)18,00
(2 625)18,00
(2 258)17,00
(2 382)17,50
(2 585)18,00
(2 446)16,50
(4 431)22,50
(1 132)* Limited in reach by longest reach in downstream direction.

ETSI
ETSI TS 101 388 V1.3.1 (2002-05)39
Table 30: Reach requirements for EC ADSL over POTS downstream with noise model FB
PayloadBitrate(kbit/s)
fT(kHz)
Loop #1Y
(dB)
Loop #2Y
(dB)
Loop #3Y
(dB)
Loop #4Y
(dB)
Loop #5Y
(dB)
Loop #6Y
(dB)
Loop #7Y
(dB)
Loop #8Y
(dB)512 300 46,50
(3 261)46,00
(4 302)46,50
(3 636)46,00
(3 766)46,50
(3 938)46,50
(3 776)47,00
(5 547)52,00
(2 985)768 300 44,50
(3 121)44,00
(4 114)44,00
(3 461)44,00
(3 626)44,00
(3 763)44,00
(3 601)44,50
(5 372)50,50
(2 880)1 024 300 43,00
(3 016)42,50
(3 974)42,50
(3 356)42,50
(3 521)42,50
(3 657)42,50
(3 495)42,50
(5 231)49,50
(2 810)1 544 300 41,50
(2 910)40,00
(3 740)40,50
(3 215)40,50
(3 380)40,50
(3 517)40,50
(3 355)40,00
(5 056)48,00
(2 704)2 048 300 40,00
(2 805)38,50
(3 600)39,00
(3 110)39,00
(3 275)39,00
(3 412)39,00
(3 250)38,00
(4 915)46,50
(2 599)3 072 300 37,00
(2 594)35,50
(3 319)36,00
(2 899)36,00
(3 064)36,00
(3 201)36,00
(3 039)35,50
(4 740)43,00
(2 353)4 096 300 34,00
(2 384)33,00
(3 085)33,50
(2 724)33,00
(2 854)33,00
(2 990)33,00
(2 828)32,50
(4 530)40,50
(2 179)5 120 300 30,50
(2 138)29,50
(2 758)30,00
(2 478)29,50
(2 608)29,50
(2 745)30,00
(2 618)28,50
(4 249)37,50
(1 968)6 144 300 26,50
(1 857)25,50
(2 383)26,00
(2 197)25,50
(2 326)25,00
(2 429)25,50
(2 301)- 34,00
(1 718)* Limited in reach by longest reach in upstream direction.
Table 31: Reach requirements for EC ADSL over POTS upstream with noise model FB
PayloadBitrate(kbit/s)
fT(kHz)
Loop #1Y
(dB)
Loop #2Y
(dB)
Loop #3Y
(dB)
Loop #4Y
(dB)
Loop #5Y
(dB)
Loop #6Y
(dB)
Loop #7Y
(dB)
Loop #8Y
(dB)64 75 38,50*
(3 729)38,00*
(5 516)39,00*
(4 272)39,00*
(4 490)38,50*
(4 600)38,50*
(4 412)39,00*
(6 577)44,50*
(3 260)128 75 38,50*
(3 729)38,00*
(5 516)39,00*
(4 272)39,00*
(4 490)38,50*
(4 600)38,50*
(4 412)39,00*
(6 577)42,00
(3 021)256 75 37,00
(3 585)36,50
(5 299)37,00
(4 080)36,00
(4 202)37,00
(4 456)37,00
(4 268)35,50
(6 241)40,00
(2 828)384 75 32,50
(3 153)32,50
(4 721)32,50
(3 649)32,00
(3 819)32,50
(4 024)32,50
(3 836)31,50
(5 858)34,50
(2 298)512 75 28,00
(2 721)28,00
(4 070)28,00
(3 217)27,00
(3 338)28,00
(3 592)28,00
(3 404)27,00
(5 426)30,00
(1 880)640 75 23,50
(2 289)23,50
(3 419)23,50
(2 785)22,50
(2 906)23,50
(3 160)23,50
(2 972)22,50
(4 990)25,50
(1 397)* Limited in reach by longest reach in downstream direction.

ETSI
ETSI TS 101 388 V1.3.1 (2002-05)40
Table 32: Reach requirements for EC ADSL over POTS downstream with noise model FC
PayloadBitrate(kbit/s)
fT(kHz)
Loop #1Y
(dB)
Loop #2Y
(dB)
Loop #3Y
(dB)
Loop #4Y
(dB)
Loop #5Y
(dB)
Loop #6Y
(dB)
Loop #7Y
(dB)
Loop #8Y
(dB)512 300 42,00
(2 945)45,50
(4 255)43,50
(3 426)44,00
(3 626)43,50
(3 728)44,00
(3 601)47,00
(5 547)47,00
(2 634)768 300 39,00
(2 735)40,50
(3 787)39,00
(3 110)39,00
(3 275)39,00
(3 412)39,00
(3 250)41,50
(5 161)44,00
(2 423)1 024 300 37,00
(2 594)37,00
(3 459)37,00
(2 969)37,00
(3 135)37,00
(3 271)37,00
(3 109)37,50
(4 880)43,00
(2 353)1 544 300 34,00
(2 384)34,00
(3 179)34,00
(2 759)34,00
(2 924)34,00
(3 061)34,00
(2 899)34,50
(4 669)39,50
(2 107)2 048 300 31,00
(2 173)31,00
(2 898)31,00
(2 548)31,00
(2 713)31,00
(2 850)31,00
(2 688)31,00
(4 424)36,50
(1 900)3 072 300 26,50
(1 857)26,00
(2 430)26,00
(2 197)26,00
(2 361)25,50
(2 464)26,00
(2 337)- 32,50
(1 622)4 096 300 23,00
(1 611)22,50
(2 103)22,50
(1 951)- 22,50
(2 253)22,50
(2 092)- 30,00
(1 429)5 120 300 20,50
(1 436)19,50
(1 822)20,00
(1 775)- 19,50
(2 042)19,50
(1 881)- 26,50
(1 186)6 144 300 17,50
(1 225)16,50
(1 541)16,50
(1 532)- 16,50
(1 834)- - -
* Limited in reach by longest reach in upstream direction.
Table 33: Reach requirements for EC ADSL over POTS upstream with noise model FC
PayloadBitrate(kbit/s)
fT(kHz)
Loop #1Y
(dB)
Loop #2Y
(dB)
Loop #3Y
(dB)
Loop #4Y
(dB)
Loop #5Y
(dB)
Loop #6Y
(dB)
Loop #7Y
(dB)
Loop #8Y
(dB)64 75 38,50*
(3 729)38,00*
(5 516)39,00*
(4 272)39,00*
(4 490)38,50*
(4 600)38,50*
(4 412)39,00*
(6 577)43,50*
(3 164)128 75 38,50*
(3 729)38,00*
(5 516)39,00*
(4 272)39,00*
(4 490)38,50*
(4 600)38,50*
(4 412)39,00*
(6 577)42,00
(3 021)256 75 37,00
(3 585)36,50
(5 299)37,00
(4 080)36,00
(4 202)37,00
(4 456)37,00
(4 268)35,50
(6 241)40,00
(2 828)384 75 32,50
(3 153)32,50
(4 721)32,50
(3 649)32,00
(3 819)32,50
(4 024)32,50
(3 836)31,50
(5 858)34,50
(2 298)512 75 28,00
(2 721)28,00
(4 070)28,00
(3 217)27,00
(3 338)28,00
(3 592)28,00
(3 404)27,00
(5 426)30,00
(1 880)640 75 23,50
(2 289)23,50
(3 419)23,50
(2 785)22,50
(2 906)23,50
(3 160)23,50
(2 972)22,50
(4 990)25,50
(1 397)* Limited in reach by longest reach in downstream direction.

ETSI
ETSI TS 101 388 V1.3.1 (2002-05)41
Table 34: Reach requirements for EC ADSL over POTS downstream with noise model FD
PayloadBitrate(kbit/s)
fT(kHz)
Loop #1Y
(dB)
Loop #2Y
(dB)
Loop #3Y
(dB)
Loop #4Y
(dB)
Loop #5Y
(dB)
Loop #6Y
(dB)
Loop #7Y
(dB)
Loop #8Y
(dB)512 300 60,50*
(4 244)67,00*
(6 267)62,00*
(4 725)62,00*
(4 890)63,50*
(5 132)62,50*
(4 900)68,00*
(7 022)57,50*
(3 372)768 300 60,50*
(4 244)64,50
(6 033)62,00*
(4 725)62,00*
(4 890)63,50*
(5 132)62,50*
(4 900)65,00
(6 811)57,50*
(3 372)1 024 300 60,50*
(4 244)62,00
(5 799)62,00*
(4 725)62,00*
(4 890)62,00
(5 027)62,00
(4 865)62,00
(6 600)57,50*
(3 372)1 544 300 58,00
(4 069)57,50
(5 378)57,50
(4 409)57,50
(4 574)57,50
(4 711)57,50
(4 549)57,50
(6 284)57,50*
(3 372)2 048 300 54,50
(3 823)53,50
(5 004)54,00
(4 163)54,00
(4 328)54,00
(4 465)54,00
(4 303)53,50
(6 004)57,50*
(3 372)3 072 300 48,50
(3 402)47,00
(4 395)48,00
(3 742)47,50
(3 872)47,50
(4 008)47,50
(3 847)47,00
(5 547)55,00
(3 196)4 096 300 43,50
(3 051)42,00
(3 927)43,00
(3 391)42,50
(3 521)42,50
(3 657)42,50
(3 495)41,00
(5 126)50,50
(2 880)5 120 300 39,00
(2 735)37,50
(3 506)38,00
(3 040)38,00
(3 205)37,50
(3 306)38,00
(3 179)36,00
(4 775)47,00
(2 634)6 144 300 33,50
(2 349)31,00
(2 898)32,00
(2 618)31,00
(2 713)30,00
(2 780)31,50
(2 723)- 42,50
(2 318)* Limited in reach by longest reach in upstream direction.
Table 35: Reach requirements for EC ADSL over POTS upstream with noise model FD
PayloadBitrate(kbit/s)
fT(kHz)
Loop #1Y
(dB)
Loop #2Y
(dB)
Loop #3Y
(dB)
Loop #4Y
(dB)
Loop #5Y
(dB)
Loop #6Y
(dB)
Loop #7Y
(dB)
Loop #8Y
(dB)64 75 44,00
(4 256)43,00
(6 239)43,50
(4 704)43,00
(4 874)44,00
(5 128)43,50
(4 892)43,50
(7 009)45,50
(3 356)128 75 40,50
(3 920)40,00
(5 805)40,00
(4 368)39,50
(4 538)40,50
(4 792)40,50
(4 604)39,50
(6 625)41,50
(2 973)256 75 36,00
(3 489)35,50
(5 155)35,50
(3 936)35,00
(4 106)35,50
(4 312)35,50
(4 124)34,50
(6 145)39,00
(2 732)384 75 31,50
(3 057)31,50
(4 576)31,50
(3 553)30,50
(3 675)31,00
(3 880)31,50
(3 740)30,50
(5 762)33,00
(2 158)512 75 26,50
(2 577)26,50
(3 853)26,50
(3 073)26,00
(3 242)26,50
(3 448)26,50
(3 260)25,50
(5 281)29,00
(1 782)640 75 22,50
(2 193)22,50
(3 275)22,00
(2 640)21,50
(2 812)22,00
(3 016)22,00
(2 828)21,00
(4 848)25,00
(1 344)* Limited in reach by longest reach in downstream direction.

ETSI
ETSI TS 101 388 V1.3.1 (2002-05)42
5.5.3 Performance objectives for FDD ADSL over ISDN
Tables 36 through 43 provide performance objectives for FDD ADSL over ISDN with noise models FA through FD.Systems configured as specified in table 19 should meet these performance objectives.
Use of the optional tones below 138 kHz, subject to the restrictions imposed by the PSD masks in clause 4.2.2.2, isallowed in the upstream direction to meet the objectives.
Table 36: Reach requirements for FDD ADSL over ISDN downstream with noise model FA
PayloadBitrate(kbit/s)
fT(kHz)
Loop #1Y
(dB)
Loop #2Y
(dB)
Loop #3Y
(dB)
Loop #4Y
(dB)
Loop #5Y
(dB)
Loop #6Y
(dB)
Loop #7Y
(dB)
Loop #8Y
(dB)512 300 38,00
(2 664)35,50
(3 319)36,50
(2 934)36,00
(3 064)36,00
(3 201)36,00
(3 039)34,50
(4 669)40,50*
(2 179)768 300 37,50
(2 629)35,50
(3 319)36,00
(2 899)35,50
(3 029)35,50
(3 166)35,50
(3 004)34,00
(4 634)40,50*
(2 179)1 024 300 37,00
(2 594)34,50
(3 225)35,50
(2 864)35,00
(2 994)35,00
(3 131)35,00
(2 969)33,50
(4 599)40,50*
(2 179)1 544 300 34,50
(2 419)32,50
(3 038)33,00
(2 688)32,50
(2 819)32,50
(2 955)33,00
(2 828)31,00
(4 424)40,50*
(2 179)2 048 300 32,00
(2 243)30,00
(2 804)30,50
(2 513)30,00
(2 643)30,00
(2 780)30,00
(2 618)29,00
(4 283)39,00
(2 071)3 072 300 27,50
(1 927)25,50
(2 383)25,50
(2 162)25,00
(2 291)24,50
(2 394)25,50
(2 301)- 34,00
(1 718)4 096 300 19,50
(1 366)16,50
(1 541)- - - - - 29,00
(1 368)5 120 300 - - - - - - - -6 144 300 - - - - - - - -
* Limited in reach by longest reach in upstream direction.
Table 37: Reach requirements for FDD ADSL over ISDN upstream with noise model FA
PayloadBitrate(kbit/s)
fT(kHz)
Loop #1Y
(dB)
Loop #2Y
(dB)
Loop #3Y
(dB)
Loop #4Y
(dB)
Loop #5Y
(dB)
Loop #6Y
(dB)
Loop #7Y
(dB)
Loop #8Y
(dB)64 150 31,00
(2 624)29,50
(3 610)30,50
(3 044)29,00
(3 117)30,50
(3 380)30,50
(3 213)28,50*
(4 944)31,00
(2 146)128 150 29,50
(2 498)28,50
(3 488)29,00
(2 918)27,50
(2 991)29,00
(3 254)29,00
(3 086)27,00
(4 818)29,00
(1 977)256 150 25,00
(2 118)24,50
(2 999)25,00
(2 580)23,00
(2 609)24,50
(2 873)24,50
(2 706)22,50
(4 435)25,00
(1 636)384 150 19,50
(1 653)19,00
(2 326)19,00
(2 073)- 19,00
(2 409)19,00
(2 240)- 20,00
(1 191)512 150 14,00
(1 189)13,50
(1 653)13,00
(1 567)- 13,00
(1 906)- - -
640 150 3,50(305)
3,00(366)
- - - - - -
* Limited in reach by longest reach in downstream direction.

ETSI
ETSI TS 101 388 V1.3.1 (2002-05)43
Table 38: Reach requirements for FDD ADSL over ISDN downstream with noise model FB
PayloadBitrate(kbit/s)
fT(kHz)
Loop #1Y
(dB)
Loop #2Y
(dB)
Loop #3Y
(dB)
Loop #4Y
(dB)
Loop #5Y
(dB)
Loop #6Y
(dB)
Loop #7Y
(dB)
Loop #8Y
(dB)512 300 41,50
(2 910)39,50
(3 693)40,50
(3 215)40,00
(3 345)40,00
(3 482)40,00
(3 320)39,00
(4 985)46,50*
(2 599)768 300 41,00
(2 875)38,50
(3 600)39,50
(3 145)39,00
(3 275)39,00
(3 412)39,50
(3 285)38,00
(4 915)46,50*
(2 599)1 024 300 40,00
(2 805)38,00
(3 553)38,50
(3 075)38,00
(3 205)38,00
(3 341)38,50
(3 215)37,00
(4 845)46,50*
(2 599)1 544 300 38,50
(2 700)36,50
(3 413)37,00
(2 969)36,50
(3 099)36,50
(3 236)36,50
(3 074)35,50
(4 740)44,00
(2 423)2 048 300 36,50
(2 559)34,50
(3 225)35,00
(2 829)34,50
(2 959)34,50
(3 096)34,50
(2 934)33,50
(4 599)42,50
(2 318)3 072 300 33,00
(2 313)31,00
(2 898)31,50
(2 583)31,00
(2 713)31,00
(2 850)31,50
(2 723)29,50
(4 317)38,50
(2 036)4 096 300 28,50
(1 997)26,50
(2 477)27,00
(2 267)26,50
(2 397)26,00
(2 499)26,50
(2 372)- 35,00
(1 789)5 120 300 22,50
(1 576)19,50
(1 822)19,00
(1 704)- 17,00
(1 868)18,00
(1 777)- 30,50
(1 467)6 144 300 13,00
(909)10,00(934)
- - - - - -
* Limited in reach by longest reach in upstream direction.
Table 39: Reach requirements for FDD ADSL over ISDN upstream with noise model FB
PayloadBitrate(kbit/s)
fT(kHz)
Loop #1Y
(dB)
Loop #2Y
(dB)
Loop #3Y
(dB)
Loop #4Y
(dB)
Loop #5Y
(dB)
Loop #6Y
(dB)
Loop #7Y
(dB)
Loop #8Y
(dB)64 150 35,50
(3 004)32,50*
(3 977)35,00
(3 424)33,50
(3 497)34,50*
(3 718)34,50*
(3 550)31,50*
(5 196)36,00
(2 567)128 150 34,00
(2 878)32,50*
(3 977)33,50
(3 298)32,00
(3 370)33,50
(3 634)33,50
(3 466)31,50
(5 196)33,50
(2 354)256 150 30,00
(2 540)29,00
(3 549)29,50
(2 960)28,00
(3 032)29,50
(3 296)29,50
(3 128)27,50
(4 861)29,50
(2 020)384 150 24,50
(2 075)23,50
(2 876)24,00
(2 496)22,50
(2 566)24,00
(2 831)24,00
(2 664)22,00
(4 396)24,50
(1 597)512 150 19,00
(1 611)18,50
(2 265)18,50
(2 030)- 18,50
(2 367)18,50
(2 198)- 19,50
(1 146)640 150 8,00
(684)7,50
(919)- - - - - -
* Limited in reach by longest reach in downstream direction.

ETSI
ETSI TS 101 388 V1.3.1 (2002-05)44
Table 40: Reach requirements for FDD ADSL over ISDN downstream with noise model FC
PayloadBitrate(kbit/s)
fT(kHz)
Loop #1Y
(dB)
Loop #2Y
(dB)
Loop #3Y
(dB)
Loop #4Y
(dB)
Loop #5Y
(dB)
Loop #6Y
(dB)
Loop #7Y
(dB)
Loop #8Y
(dB)512 300 33,00
(2 313)31,50
(2 945)32,00
(2 618)31,50
(2 748)31,50
(2 885)31,50
(2 723)30,50
(4 387)38,50
(2 036)768 300 31,00
(2 173)29,50
(2 758)30,00
(2 478)29,50
(2 608)29,50
(2 745)29,50
(2 582)28,50
(4 249)36,00
(1 864)1 024 300 29,00
(2 033)27,50
(2 570)27,50
(2 302)27,00
(2 432)27,00
(2 569)27,50
(2 443)- 34,50
(1 753)1 544 300 26,00
(1 822)24,50
(2 290)24,50
(2 092)24,00
(2 223)24,00
(2 358)24,50
(2 231)- 31,50
(1 551)2 048 300 24,00
(1 681)22,50
(2 103)22,50
(1 951)- 22,00
(2 218)22,00
(2 056)- 30,00
(1 429)3 072 300 20,50
(1 436)19,50
(1 822)19,00
(1 704)- 18,50
(1 971)19,00
(1 847)- 26,50
(1 186)4 096 300 17,00
(1 190)15,50
(1 447)- - - - - -
5 120 300 13,00(909)
12,00(1 120)
- - - - - -
6 144 300 - - - - - - - -* Limited in reach by longest reach in upstream direction.
Table 41: Reach requirements for FDD ADSL over ISDN upstream with noise model FC
PayloadBitrate(kbit/s)
fT(kHz)
Loop #1Y
(dB)
Loop #2Y
(dB)
Loop #3Y
(dB)
Loop #4Y
(dB)
Loop #5Y
(dB)
Loop #6Y
(dB)
Loop #7Y
(dB)
Loop #8Y
(dB)64 150 29,50*
(2 498)26,50*
(3 243)27,50*
(2 791)27,00*
(2 949)27,00*
(3 085)27,00*
(2 917)25,00*
(4 645)32,00*
(2 229)128 150 29,50*
(2 498)26,50*
(3 243)27,50*
(2 791)27,00*
(2 949)27,00*
(3 085)27,00*
(2 917)25,00*
(4 645)32,00*
(2 229)256 150 29,50*
(2 498)26,50*
(3 243)27,50*
(2 791)27,00*
(2 949)27,00*
(3 085)27,00*
(2 917)25,00*
(4 645)29,50
(2 020)384 150 24,50
(2 075)23,50
(2 876)24,00
(2 496)22,50
(2 566)24,00
(2 831)24,00
(2 664)22,00
(4 396)24,50
(1 597)512 150 19,00
(1 611)18,50
(2 265)18,50
(2 030)- 18,50
(2 367)18,50
(2 198)- 19,50
(1 146)640 150 8,00
(684)7,50
(919)- - - - - -
* Limited in reach by longest reach in downstream direction.

ETSI
ETSI TS 101 388 V1.3.1 (2002-05)45
Table 42: Reach requirements for FDD ADSL over ISDN downstream with noise model FD
PayloadBitrate(kbit/s)
fT(kHz)
Loop #1Y
(dB)
Loop #2Y
(dB)
Loop #3Y
(dB)
Loop #4Y
(dB)
Loop #5Y
(dB)
Loop #6Y
(dB)
Loop #7Y
(dB)
Loop #8Y
(dB)512 300 49,00
(3 437)46,50
(4 348)47,50
(3 707)47,50
(3 872)47,50
(4 008)47,50
(3 847)46,00
(5 477)54,50
(3 161)768 300 47,00
(3 296)45,00
(4 208)46,00
(3 601)45,50
(3 731)45,50
(3 868)45,50
(3 706)44,00
(5 336)53,00
(3 056)1 024 300 45,50
(3 191)43,00
(4 021)44,00
(3 461)43,50
(3 591)43,50
(3 728)44,00
(3 601)42,50
(5 231)51,50
(2 950)1 544 300 43,00
(3 016)40,50
(3 787)41,50
(3 285)41,00
(3 415)41,00
(3 552)41,00
(3 390)39,50
(5 020)49,00
(2 775)2 048 300 40,50
(2 840)38,50
(3 600)39,00
(3 110)38,50
(3 240)38,50
(3 376)39,00
(3 250)37,50
(4 880)47,00
(2 634)3 072 300 36,50
(2 559)33,50
(3 132)34,50
(2 794)33,50
(2 889)33,50
(3 025)34,00
(2 899)31,50
(4 460)43,00
(2 353)4 096 300 29,50
(2 068)26,00
(2 430)25,50
(2 162)24,50
(2 257)23,50
(2 323)25,00
(2 266)- 38,00
(2 002)5 120 300 17,50
(1 225)13,00
(1 214)- - - - - 30,00
(1 429)6 144 300 - - - - - - - -
* Limited in reach by longest reach in upstream direction.
Table 43: Reach requirements for FDD ADSL over ISDN upstream with noise model FD
PayloadBitrate(kbit/s)
fT(kHz)
Loop #1Y
(dB)
Loop #2Y
(dB)
Loop #3Y
(dB)
Loop #4Y
(dB)
Loop #5Y
(dB)
Loop #6Y
(dB)
Loop #7Y
(dB)
Loop #8Y
(dB)64 150 43,50*
(3 680)38,00*
(4 649)41,50*
(3 973)40,50*
(4 088)40,50*
(4 225)41,00*
(4 099)38,00*
(5 745)46,00*
(3 411)128 150 43,50*
(3 680)38,00*
(4 649)41,50*
(3 973)40,50*
(4 088)40,50*
(4 225)41,00*
(4 099)38,00*
(5 745)46,00*
(3 411)256 150 43,50*
(3 680)38,00*
(4 649)41,50*
(3 973)40,50*
(4 088)40,50*
(4 225)41,00*
(4 099)38,00*
(5 745)46,00*
(3 411)384 150 43,00
(3 637)38,00*
(4 649)41,50*
(3 973)40,00
(4 046)40,50*
(4 225)41,00*
(4 099)38,00*
(5 745)42,50
(3 115)512 150 33,00
(2 793)31,00
(3 794)32,50
(3 213)29,50
(3 159)32,00
(3 507)32,00
(3 339)28,50
(4 944)32,00
(2 229)640 150 20,50
(1 738)15,00
(1 837)17,50
(1 946)- 12,00
(1 819)13,50
(1 775)- -
* Limited in reach by longest reach in downstream direction.

ETSI
ETSI TS 101 388 V1.3.1 (2002-05)46
5.5.4 Performance objectives for FDD ADSL over POTS
Tables 44 through 51 provide performance objectives for FDD ADSL over POTS with noise models FA through FD.Systems configured as specified in table 19 should meet these performance objectives.
Table 44: Reach requirements for FDD ADSL over POTS downstream with noise model FA
PayloadBitrate(kbit/s)
fT(kHz)
Loop #1Y
(dB)
Loop #2Y
(dB)
Loop #3Y
(dB)
Loop #4Y
(dB)
Loop #5Y
(dB)
Loop #6Y
(dB)
Loop #7Y
(dB)
Loop #8Y
(dB)512 300 38,00
(2 664)36,50
(3 413)36,50
(2 934)36,00
(3 064)36,00
(3 201)36,50
(3 074)35,50
(4 740)44,00
(2 423)768 300 37,50
(2 629)35,50
(3 319)36,00
(2 899)35,50
(3 029)35,50
(3 166)36,00
(3 039)34,50
(4 669)43,50
(2 388)1 024 300 37,00
(2 594)35,00
(3 272)35,50
(2 864)35,00
(2 994)35,00
(3 131)35,50
(3 004)34,00
(4 634)43,50
(2 388)1 544 300 34,50
(2 419)33,00
(3 085)33,50
(2 724)33,00
(2 854)33,00
(2 990)33,00
(2 828)32,00
(4 495)41,00
(2 214)2 048 300 32,50
(2 278)31,50
(2 945)31,50
(2 583)31,00
(2 713)31,00
(2 850)31,00
(2 688)30,00
(4 352)39,00
(2 071)3 072 300 29,00
(2 033)27,00
(2 524)27,50
(2 302)27,00
(2 432)26,50
(2 534)27,00
(2 407)- 35,50
(1 827)4 096 300 23,50
(1 646)21,50
(2 009)20,50
(1 811)- 19,00
(2 006)20,00
(1 915)- 30,50
(1 467)5 120 300 16,00
(1 120)13,50
(1 261)- - - - - -
6 144 300 8,00(556)
- - - - - - -
* Limited in reach by longest reach in upstream direction.
Table 45: Reach requirements for FDD ADSL over POTS upstream with noise model FA
PayloadBitrate(kbit/s)
fT(kHz)
Loop #1Y
(dB)
Loop #2Y
(dB)
Loop #3Y
(dB)
Loop #4Y
(dB)
Loop #5Y
(dB)
Loop #6Y
(dB)
Loop #7Y
(dB)
Loop #8Y
(dB)64 75 29,50*
(2 865)25,50*
(3 709)27,50*
(3 169)26,50*
(3 290)26,50*
(3 448)26,50*
(3 260)22,00*
(4 943)38,00*
(2 635)128 75 29,50*
(2 865)25,50*
(3 709)27,50*
(3 169)26,50*
(3 290)26,50*
(3 448)26,50*
(3 260)22,00*
(4 943)36,50
(2 489)256 75 29,50*
(2 865)25,50*
(3 709)27,50*
(3 169)26,50*
(3 290)26,50*
(3 448)26,50*
(3 260)22,00*
(4 943)32,00
(2 066)384 75 26,00
(2 529)25,50*
(3 709)25,50
(2 977)25,00
(3 145)25,50
(3 352)25,50
(3 164)22,00*
(4 943)27,00
(1 567)512 75 20,00
(1 953)20,00
(2 914)20,00
(2 449)19,00
(2 576)20,00
(2 824)20,00
(2 636)19,00
(4 664)23,50
(1 208)640 75 12,00
(1 184)12,00
(1 757)11,50
(1 628)- 11,50
(2 006)11,50
(1 812)- -
* Limited in reach by longest reach in downstream direction.

ETSI
ETSI TS 101 388 V1.3.1 (2002-05)47
Table 46: Reach requirements for FDD ADSL over POTS downstream with noise model FB
PayloadBitrate(kbit/s)
fT(kHz)
Loop #1Y
(dB)
Loop #2Y
(dB)
Loop #3Y
(dB)
Loop #4Y
(dB)
Loop #5Y
(dB)
Loop #6Y
(dB)
Loop #7Y
(dB)
Loop #8Y
(dB)512 300 42,00
(2 945)40,50
(3 787)41,00
(3 250)40,50
(3 380)40,50
(3 517)41,00
(3 390)40,00
(5 056)48,50
(2 740)768 300 41,50
(2 910)39,50
(3 693)40,00
(3 180)39,50
(3 310)39,50
(3 447)40,00
(3 320)38,50
(4 950)47,50
(2 669)1 024 300 40,50
(2 840)39,00
(3 647)39,50
(3 145)39,00
(3 275)39,00
(3 412)39,50
(3 285)38,00
(4 915)47,00
(2 634)1 544 300 39,00
(2 735)37,50
(3 506)37,50
(3 004)37,50
(3 170)37,00
(3 271)37,50
(3 144)36,50
(4 810)45,00
(2 494)2 048 300 37,00
(2 594)35,50
(3 319)36,00
(2 899)35,50
(3 029)35,50
(3 166)36,00
(3 039)35,00
(4 704)43,00
(2 353)3 072 300 34,50
(2 419)32,50
(3 038)33,00
(2 688)32,50
(2 819)32,50
(2 955)32,50
(2 793)31,00
(4 424)40,00
(2 143)4 096 300 30,50
(2 138)29,00
(2 711)29,00
(2 408)28,50
(2 538)28,50
(2 674)29,00
(2 547)- 36,50
(1 900)5 120 300 25,50
(1 787)24,00
(2 243)24,00
(2 056)- 23,00
(2 288)23,50
(2 162)- 33,00
(1 653)6 144 300 19,00
(1 331)17,00
(1 588)- - - - - 28,00
(1 314)* Limited in reach by longest reach in upstream direction.
Table 47: Reach requirements for FDD ADSL over POTS upstream with noise model FB
PayloadBitrate(kbit/s)
fT(kHz)
Loop #1Y
(dB)
Loop #2Y
(dB)
Loop #3Y
(dB)
Loop #4Y
(dB)
Loop #5Y
(dB)
Loop #6Y
(dB)
Loop #7Y
(dB)
Loop #8Y
(dB)64 75 32,50*
(3 153)28,00*
(4 070)30,50*
(3 457)30,00*
(3 627)29,50*
(3 736)30,00*
(3 596)25,50*
(5 281)41,00*
(2 925)128 75 32,50*
(3 153)28,00*
(4 070)30,50*
(3 457)30,00*
(3 627)29,50*
(3 736)30,00*
(3 596)25,50*
(5 281)41,00*
(2 925)256 75 32,50*
(3 153)28,00*
(4 070)30,50*
(3 457)30,00*
(3 627)29,50*
(3 736)30,00*
(3 596)25,50*
(5 281)37,50
(2 586)384 75 31,00
(3 009)28,00*
(4 070)30,50*
(3 457)30,00*
(3 627)29,50*
(3 736)30,00*
(3 596)25,50*
(5 281)33,00
(2 158)512 75 25,00
(2 433)25,00
(3 636)25,00
(2 929)24,00
(3 049)25,00
(3 304)25,00
(3 116)24,00
(5 135)26,50
(1 509)640 75 17,50
(1 714)17,50
(2 552)17,00
(2 163)16,50
(2 332)17,50
(2 585)17,00
(2 351)16,00
(4 381)-
* Limited in reach by longest reach in downstream direction.
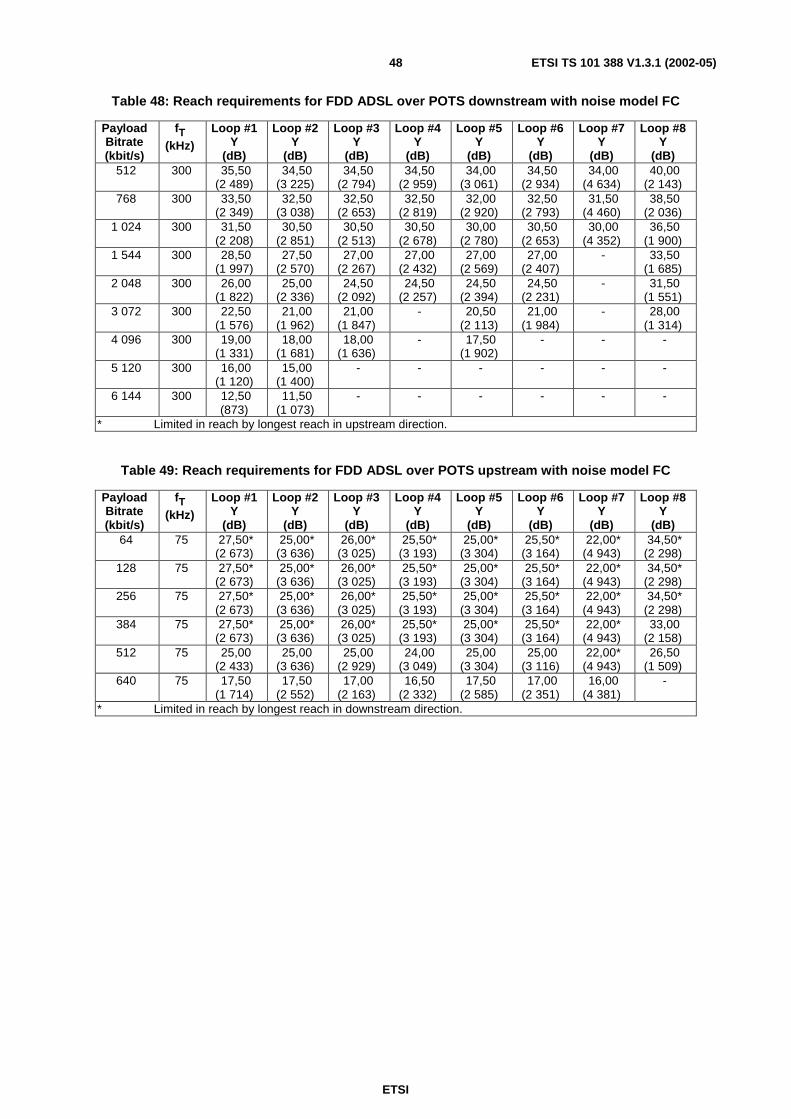
ETSI
ETSI TS 101 388 V1.3.1 (2002-05)48
Table 48: Reach requirements for FDD ADSL over POTS downstream with noise model FC
PayloadBitrate(kbit/s)
fT(kHz)
Loop #1Y
(dB)
Loop #2Y
(dB)
Loop #3Y
(dB)
Loop #4Y
(dB)
Loop #5Y
(dB)
Loop #6Y
(dB)
Loop #7Y
(dB)
Loop #8Y
(dB)512 300 35,50
(2 489)34,50
(3 225)34,50
(2 794)34,50
(2 959)34,00
(3 061)34,50
(2 934)34,00
(4 634)40,00
(2 143)768 300 33,50
(2 349)32,50
(3 038)32,50
(2 653)32,50
(2 819)32,00
(2 920)32,50
(2 793)31,50
(4 460)38,50
(2 036)1 024 300 31,50
(2 208)30,50
(2 851)30,50
(2 513)30,50
(2 678)30,00
(2 780)30,50
(2 653)30,00
(4 352)36,50
(1 900)1 544 300 28,50
(1 997)27,50
(2 570)27,00
(2 267)27,00
(2 432)27,00
(2 569)27,00
(2 407)- 33,50
(1 685)2 048 300 26,00
(1 822)25,00
(2 336)24,50
(2 092)24,50
(2 257)24,50
(2 394)24,50
(2 231)- 31,50
(1 551)3 072 300 22,50
(1 576)21,00
(1 962)21,00
(1 847)- 20,50
(2 113)21,00
(1 984)- 28,00
(1 314)4 096 300 19,00
(1 331)18,00
(1 681)18,00
(1 636)- 17,50
(1 902)- - -
5 120 300 16,00(1 120)
15,00(1 400)
- - - - - -
6 144 300 12,50(873)
11,50(1 073)
- - - - - -
* Limited in reach by longest reach in upstream direction.
Table 49: Reach requirements for FDD ADSL over POTS upstream with noise model FC
PayloadBitrate(kbit/s)
fT(kHz)
Loop #1Y
(dB)
Loop #2Y
(dB)
Loop #3Y
(dB)
Loop #4Y
(dB)
Loop #5Y
(dB)
Loop #6Y
(dB)
Loop #7Y
(dB)
Loop #8Y
(dB)64 75 27,50*
(2 673)25,00*
(3 636)26,00*
(3 025)25,50*
(3 193)25,00*
(3 304)25,50*
(3 164)22,00*
(4 943)34,50*
(2 298)128 75 27,50*
(2 673)25,00*
(3 636)26,00*
(3 025)25,50*
(3 193)25,00*
(3 304)25,50*
(3 164)22,00*
(4 943)34,50*
(2 298)256 75 27,50*
(2 673)25,00*
(3 636)26,00*
(3 025)25,50*
(3 193)25,00*
(3 304)25,50*
(3 164)22,00*
(4 943)34,50*
(2 298)384 75 27,50*
(2 673)25,00*
(3 636)26,00*
(3 025)25,50*
(3 193)25,00*
(3 304)25,50*
(3 164)22,00*
(4 943)33,00
(2 158)512 75 25,00
(2 433)25,00
(3 636)25,00
(2 929)24,00
(3 049)25,00
(3 304)25,00
(3 116)22,00*
(4 943)26,50
(1 509)640 75 17,50
(1 714)17,50
(2 552)17,00
(2 163)16,50
(2 332)17,50
(2 585)17,00
(2 351)16,00
(4 381)-
* Limited in reach by longest reach in downstream direction.
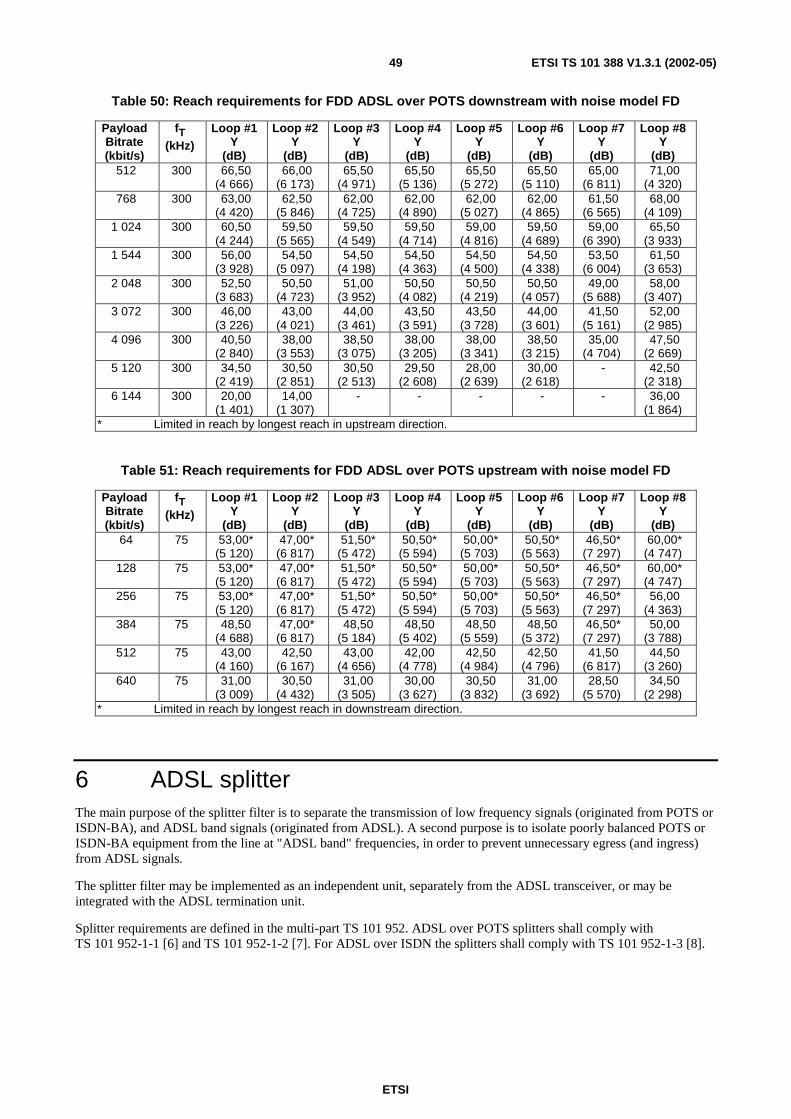
ETSI
ETSI TS 101 388 V1.3.1 (2002-05)49
Table 50: Reach requirements for FDD ADSL over POTS downstream with noise model FD
PayloadBitrate(kbit/s)
fT(kHz)
Loop #1Y
(dB)
Loop #2Y
(dB)
Loop #3Y
(dB)
Loop #4Y
(dB)
Loop #5Y
(dB)
Loop #6Y
(dB)
Loop #7Y
(dB)
Loop #8Y
(dB)512 300 66,50
(4 666)66,00
(6 173)65,50
(4 971)65,50
(5 136)65,50
(5 272)65,50
(5 110)65,00
(6 811)71,00
(4 320)768 300 63,00
(4 420)62,50
(5 846)62,00
(4 725)62,00
(4 890)62,00
(5 027)62,00
(4 865)61,50
(6 565)68,00
(4 109)1 024 300 60,50
(4 244)59,50
(5 565)59,50
(4 549)59,50
(4 714)59,00
(4 816)59,50
(4 689)59,00
(6 390)65,50
(3 933)1 544 300 56,00
(3 928)54,50
(5 097)54,50
(4 198)54,50
(4 363)54,50
(4 500)54,50
(4 338)53,50
(6 004)61,50
(3 653)2 048 300 52,50
(3 683)50,50
(4 723)51,00
(3 952)50,50
(4 082)50,50
(4 219)50,50
(4 057)49,00
(5 688)58,00
(3 407)3 072 300 46,00
(3 226)43,00
(4 021)44,00
(3 461)43,50
(3 591)43,50
(3 728)44,00
(3 601)41,50
(5 161)52,00
(2 985)4 096 300 40,50
(2 840)38,00
(3 553)38,50
(3 075)38,00
(3 205)38,00
(3 341)38,50
(3 215)35,00
(4 704)47,50
(2 669)5 120 300 34,50
(2 419)30,50
(2 851)30,50
(2 513)29,50
(2 608)28,00
(2 639)30,00
(2 618)- 42,50
(2 318)6 144 300 20,00
(1 401)14,00
(1 307)- - - - - 36,00
(1 864)* Limited in reach by longest reach in upstream direction.
Table 51: Reach requirements for FDD ADSL over POTS upstream with noise model FD
PayloadBitrate(kbit/s)
fT(kHz)
Loop #1Y
(dB)
Loop #2Y
(dB)
Loop #3Y
(dB)
Loop #4Y
(dB)
Loop #5Y
(dB)
Loop #6Y
(dB)
Loop #7Y
(dB)
Loop #8Y
(dB)64 75 53,00*
(5 120)47,00*
(6 817)51,50*
(5 472)50,50*
(5 594)50,00*
(5 703)50,50*
(5 563)46,50*
(7 297)60,00*
(4 747)128 75 53,00*
(5 120)47,00*
(6 817)51,50*
(5 472)50,50*
(5 594)50,00*
(5 703)50,50*
(5 563)46,50*
(7 297)60,00*
(4 747)256 75 53,00*
(5 120)47,00*
(6 817)51,50*
(5 472)50,50*
(5 594)50,00*
(5 703)50,50*
(5 563)46,50*
(7 297)56,00
(4 363)384 75 48,50
(4 688)47,00*
(6 817)48,50
(5 184)48,50
(5 402)48,50
(5 559)48,50
(5 372)46,50*
(7 297)50,00
(3 788)512 75 43,00
(4 160)42,50
(6 167)43,00
(4 656)42,00
(4 778)42,50
(4 984)42,50
(4 796)41,50
(6 817)44,50
(3 260)640 75 31,00
(3 009)30,50
(4 432)31,00
(3 505)30,00
(3 627)30,50
(3 832)31,00
(3 692)28,50
(5 570)34,50
(2 298)* Limited in reach by longest reach in downstream direction.
6 ADSL splitterThe main purpose of the splitter filter is to separate the transmission of low frequency signals (originated from POTS orISDN-BA), and ADSL band signals (originated from ADSL). A second purpose is to isolate poorly balanced POTS orISDN-BA equipment from the line at "ADSL band" frequencies, in order to prevent unnecessary egress (and ingress)from ADSL signals.
The splitter filter may be implemented as an independent unit, separately from the ADSL transceiver, or may beintegrated with the ADSL termination unit.
Splitter requirements are defined in the multi-part TS 101 952. ADSL over POTS splitters shall comply withTS 101 952-1-1 [6] and TS 101 952-1-2 [7]. For ADSL over ISDN the splitters shall comply with TS 101 952-1-3 [8].

ETSI
ETSI TS 101 388 V1.3.1 (2002-05)50
6.1 Impact on existing baseband servicesA splitter filter is required at both ends of the line that carries ADSL signals because it is intended that existingbaseband services are to remain unaffected by the presence of higher frequency ADSL signals on the same wire-pair.The functional diagram of this combination is given in figure 11.
The following is advised to maintain minimum guaranteed performance:
• The end-to-end insertion loss from port "Naa" to "Nba" does not exceed the maximum values as specified for thetest loops in clause 5.5.
• The length of cable section Laa and Lba in the presence of ISDN transmission according to TS 102 080 [1],annex B (4B3T) should not exceed the values specified in table 52 in order not to influence the ISDNtransmission. The values in the presence of ISDN 2B1Q are for further study.
• The length (insertion loss) of Lat + Lbt + L0 - D (all in dB) should not exceed the maximum reach in clause 6 ofTS 102 080 [1], where D = 4,0 dB for ISDN 4B3T and D = 4,5 dB for ISDN 2B1Q. The reduced reach is toallow for the presence of the splitters and the parallel ADSL transmission.
Table 52: Recommended limits on cable section lengths for 4B3T ISDN
Cable section Advised maximumlength (see note 4)
Termination at the end of thecable section
Laa; Lba 200 m (see note 1) NT, LT, or open loopLaa; Lba 150 m (see note 2) NT, LT, or open loopLaa; Lba 50 m (see note 3) NT, LT, or open loop
NOTE 1: Tests a to g in clause 6.2.4.1 of TS 102 080 [1] and the length ofthe ADSL cable section (Laa or Lba) at the other port << 150 m.
NOTE 2: Tests a to g in clause 6.2.4.1 of TS 102 080 [1] and the length ofthe ADSL cable section (Laa or Lba) at the other port = 150 m.
NOTE 3: Tests h, i in clause 6.2.4.1 of TS 102 080 [1] and the length of theADSL cable section (Laa or Lba) at the other port << 50 m (forfurther study).
NOTE 4: The given lengths for the cable sections Laa and Lba apply toISDN transmission between Nat and Nbt at maximum length(insertion loss) according to clause 6.2.4.1 of TS 102 080 [1]minus 4 dB as allowed degradation due to the splitter and parallelADSL transmission.
T L
A
T
A
L
Laa Lba
LbtLat Lo
Zaa(Central Office) or NT-side
Zba
ZbtZat
ADSL transceiver ADSL transceiver
POTS or
ISDN
POTS or
ISDN
LT-side
(Optical network unit) Customer Premises)
"A" "B"
Naa Nba
NbtNat
Figure 11: Functional diagram of the ADSL splitter configuration

ETSI
ETSI TS 101 388 V1.3.1 (2002-05)51
Annex A (normative):Distributed cable coefficients for the test loop cablesThis annex provides the distributed cable coefficients for the cable sections in the test loops in clause 5.2. Thecharacteristics of each cable segment in the test loops shall be consistent with the distributed cable coefficientsgenerated according to
+
+
+
++
+=+=
∞−
Nb
m
Nb
m
soscoc
sss
ff
ffLL
jfaRfaR
LjRZ
1
11 01
4 244 24ωω
and
++=+= ∞ Nce
Ngeppp f
CCjfgCjGY 0
0 ωω ,
where the parameters for each cable type are taken from table A.1. The resulting distributed coefficients Rs, Ls and Cpare consistent with the tabulated values in tables A.2 through A.6.
Table A.1: Parameter set for generating distributed cable coefficients
PE032 PE04 PE05 PE063 PE09Roc (ΩΩΩΩ/km) 409 280 179 113 55
ac 0,3822 0,0969 0,0561 0,0256 0,0094
Ros (ΩΩΩΩ/km) ∞ ∞ ∞ ∞ ∞as 0 0 0 0 0
L0 (µH/km) 607,64 587,13 673,57 699,26 750,79
L∞∞∞∞ (µH/km) 500 427,12 544,25 477,42 520,45
fm (kHz) 608,77 739,05 580,92 265,7 124,04
Nb 5,2464 1,3952 1,3013 1,0978 0,9605
g0 (S/km) 0 0 0 0 0
Nge 0 0 0 0 0
C0 (nF/km) 0 0 0 0 0
C∞∞∞∞ (nF/km) 40 50 50 45 40
Nce 0 0 0 0 0

ETSI
ETSI TS 101 388 V1.3.1 (2002-05)52
Table A.2: Rs Ls Cp values for 0,32 mm PE cable (ADSL.PE032)
Frequency(kHz)
Rs(ΩΩΩΩ/km)
Ls(µµµµH/km)
Cp(nF/km)
0,00 409,000 607,640 40,002,50 409,009 607,640 40,00
10,00 409,140 607,640 40,0020,00 409,557 607,640 40,0030,00 410,251 607,640 40,0040,00 411,216 607,640 40,0050,00 412,448 607,640 40,00
100,00 422,302 607,632 40,00150,00 437,339 607,571 40,00200,00 456,088 607,328 40,00250,00 477,232 606,640 40,00300,00 499,762 605,075 40,00350,00 522,973 602,047 40,00400,00 546,402 596,935 40,00450,00 569,755 589,338 40,00500,00 592,851 579,377 40,00550,00 615,584 567,823 40,00600,00 637,894 555,868 40,00650,00 659,752 544,658 40,00700,00 681,148 534,942 40,00750,00 702,083 526,992 40,00800,00 722,567 520,732 40,00850,00 742,612 515,919 40,00900,00 762,236 512,265 40,00950,00 781,454 509,503 40,00
1 000,00 800,284 507,415 40,001 050,00 818,744 505,831 40,001 100,00 836,850 504,623 40,00

ETSI
ETSI TS 101 388 V1.3.1 (2002-05)53
Table A.3: Rs Ls Cp values for 0,4 mm PE cable (ADSL.PE04)
Frequency(kHz)
Rs(ΩΩΩΩ/km)
Ls(µµµµH/km)
Cp(nF/km)
0,00 280,000 587,130 50,002,50 280,007 587,073 50,00
10,00 280,110 586,736 50,0020,00 280,440 586,097 50,0030,00 280,988 585,320 50,0040,00 281,749 584,441 50,0050,00 282,719 583,481 50,00
100,00 290,437 577,877 50,00150,00 302,078 571,524 50,00200,00 316,406 564,888 50,00250,00 332,365 558,232 50,00300,00 349,188 551,714 50,00350,00 366,370 545,430 50,00400,00 383,590 539,436 50,00450,00 400,658 533,759 50,00500,00 417,462 528,409 50,00550,00 433,941 523,385 50,00600,00 450,067 518,677 50,00650,00 465,827 514,272 50,00700,00 481,224 510,153 50,00750,00 496,264 506,304 50,00800,00 510,959 502,707 50,00850,00 525,324 499,343 50,00900,00 539,372 496,197 50,00950,00 553,118 493,253 50,00
1 000,00 566,576 490,494 50,001 050,00 579,761 487,908 50,001 100,00 592,686 485,481 50,00

ETSI
ETSI TS 101 388 V1.3.1 (2002-05)54
Table A.4: Rs Ls Cp values for 0,5 mm PE cable (ADSL.PE05)
Frequency(kHz)
Rs(ΩΩΩΩ/km)
Ls(µµµµH/km)
Cp(nF/km)
0,00 179,000 673,570 50,002,50 179,015 673,462 50,00
10,00 179,244 672,919 50,0020,00 179,970 671,976 50,0030,00 181,161 670,892 50,0040,00 182,790 669,712 50,0050,00 184,823 668,464 50,00
100,00 199,612 661,674 50,00150,00 218,729 654,618 50,00200,00 239,143 647,732 50,00250,00 259,474 641,206 50,00300,00 279,189 635,116 50,00350,00 298,120 629,486 50,00400,00 316,249 624,307 50,00450,00 333,611 619,556 50,00500,00 350,264 615,201 50,00550,00 366,268 611,210 50,00600,00 381,680 607,551 50,00650,00 396,553 604,191 50,00700,00 410,933 601,103 50,00750,00 424,861 598,260 50,00800,00 438,376 595,639 50,00850,00 451,509 593,216 50,00900,00 464,288 590,975 50,00950,00 476,740 588,896 50,00
1 000,00 488,888 586,965 50,001 050,00 500,752 585,169 50,001 100,00 512,350 583,495 50,00

ETSI
ETSI TS 101 388 V1.3.1 (2002-05)55
Table A.5: Rs Ls Cp values for 0,63 mm PE cable (ADSL.PE063)
Frequency(kHz)
Rs(ΩΩΩΩ/km)
Ls(µµµµH/km)
Cp(nF/km)
0,00 113,000 699,260 45,002,50 113,028 697,945 45,00
10,00 113,441 693,363 45,0020,00 114,734 687,010 45,0030,00 116,796 680,716 45,0040,00 119,512 674,594 45,0050,00 122,752 668,691 45,00
100,00 143,076 642,718 45,00150,00 164,880 622,050 45,00200,00 185,617 605,495 45,00250,00 204,911 592,047 45,00300,00 222,866 580,959 45,00350,00 239,661 571,689 45,00400,00 255,463 563,843 45,00450,00 270,414 557,127 45,00500,00 284,627 551,321 45,00550,00 298,197 546,258 45,00600,00 311,200 541,807 45,00650,00 323,699 537,866 45,00700,00 335,746 534,355 45,00750,00 347,387 531,209 45,00800,00 358,658 528,375 45,00850,00 369,592 525,810 45,00900,00 380,217 523,478 45,00950,00 390,558 521,349 45,00
1 000,00 400,635 519,399 45,001 050,00 410,469 517,606 45,001 100,00 420,075 515,953 45,00

ETSI
ETSI TS 101 388 V1.3.1 (2002-05)56
Table A.6: Rs Ls Cp values for 0,9 mm PE cable (ADSL.PE09)
Frequency(kHz)
Rs(ΩΩΩΩ/km)
Ls(µµµµH/km)
Cp(nF/km)
0,00 55,000 750,790 40,002,50 55,088 745,498 40,00
10,00 56,361 731,955 40,0020,00 59,943 716,770 40,0030,00 64,780 703,870 40,0040,00 70,131 692,703 40,0050,00 75,591 682,910 40,00
100,00 100,779 647,493 40,00150,00 121,878 625,138 40,00200,00 140,090 609,652 40,00250,00 156,290 598,256 40,00300,00 171,006 589,504 40,00350,00 184,576 582,563 40,00400,00 197,229 576,919 40,00450,00 209,126 572,237 40,00500,00 220,388 568,288 40,00550,00 231,106 564,911 40,00600,00 241,352 561,989 40,00650,00 251,182 559,435 40,00700,00 260,643 557,184 40,00750,00 269,774 555,184 40,00800,00 278,607 553,395 40,00850,00 287,169 551,785 40,00900,00 295,484 550,328 40,00950,00 303,571 549,003 40,00
1 000,00 311,449 547,794 40,001 050,00 319,134 546,684 40,001 100,00 326,637 545,663 40,00

ETSI
ETSI TS 101 388 V1.3.1 (2002-05)57
Annex B (informative):Transmission of cable sections
B.1 Definition of transmission function and insertion lossTransmission function and insertion loss are quantities that are related to the values of the (complex) source and loadimpedance. Within the context of the present document, a simplified definition is used in which source and load are thesame and equal to a real value RN. The transmission function and insertion loss associated with a two-port network,
normalized to a chosen reference resistance RN, are defined as the following voltage ratios (see figures B.1 and B.2):
Transmission Function =1
2
U
U
Insertion Loss =2
1
U
U
RN
RN
+
-U1
Figure B.1: Voltage across the load
Two-portNetwork
RN
RN
+
-U2
Figure B.2: Voltage across the load with a two-port network inserted
These quantities are directly related to the scattering parameters associated with the two-port network as defined inclause B.2:
Transmission function = s21Magnitude of transmission function (in dB) = 20 log10(|s21|)
Insertion loss = 1/s21 Magnitude of insertion loss (in dB) = -20 log10(|s21|)

ETSI
ETSI TS 101 388 V1.3.1 (2002-05)58
B.2 Derivation of s-parameters from primary cableparameters
The test loops are defined by one or a cascade of cable sections. The characteristics of each section are specified byprimary cable parameters Zs, Yp per unit length (L0), as described in annex A. This clause provides the equations toevaluate the relevant characteristics of cable sections (s-parameters) from the primary parameters and defines how tohandle cascades of cable sections.
Insertion loss and return loss of a cable section, normalized to a chosen reference impedance RN, can be calculated fromthe primary parameters Zs, Yp per unit length (L0) by evaluating the two-port s-parameters, normalized to RN asfollows:
NOTE: ETSI has chosen the value of 135 Ω for RN to describe cables, but the formulas in this annex do not losetheir validity if other values are chosen for other applications.
Zsx = (L/L0) · Zs γx = Zsx ·Ypx αx = real(γx) Rsx = real(Zsx) Gpx = real(Ypx)
Ypx = (L/L0) · Yp Z0 = Zsx /Ypx βx = imag(γx) Lsx = imag(Zsx/ω) Cpx = imag(Ypx/ω)
S =
2221
1211
ss
ss=
) )(( 2tanh//
1
00 +⋅+ xNN ZRRZ γ× ) )((
( ) ( )( )( )
⋅−⋅−
x
x
NNx
xNN
ZRRZ
ZRRZ
γγ
γγ
tanh//cosh/2
cosh/2tanh//
00
00
Insertion Loss: 1/s21 normalized to RN.
Return Loss: 1/s11 normalized to RN.
The s-parameters of two cable sections (a and b) in cascade, Sab, can be calculated from the s-parameters Sa and Sb asdescribed below:
Sab =
2221
1211
ss
ss= ⋅
⋅− ba ss 11221
1
⋅∆−⋅⋅⋅∆−
asbbba
abbsaa
ssss
ssss
22222121
12121111 ∆si = s11i·s22i - s12i·s21i

ETSI
ETSI TS 101 388 V1.3.1 (2002-05)59
Annex C (informative):ADSL over ISDN configuration of T1.413 based modemsThis annex describes the ADSL over ISDN configuration of modems based on ANSI T1.413 [5]. The annex is providedfor information to enhance backward compatibility with legacy modems.
C.1 IntroductionThe ADSL signals described in this clause shall be allocated above the operating band of ISDN-BA signals based on2B1Q/4B3T line signals as those defined in TS 102 080 [1]. In order to allow sufficient upstream bandwidth capacitythe ATU-R shall have a transmission bandwidth making use of tones 33 to 63. The use of an extended range making useof tones between 1 and 63 is optional.
The IDFT implementation at the ATU-R side shall be implemented as follows. Tones 33 to 63 will contain complexvalues generated by the encoder and scaler.
The values in tones 1 to 31 shall be:
• mirrored complex-conjugate of tones 33 to 63 if the transmitter uses only 32 tones (tone #32 = 0);
• zero if the transmitter uses 64 tones and the receiver uses 32 tones (tone #32 = 0);
• complex data generated by the encoder and scaler if both the transmitter and receiver use 64 tones (tone 32 alsoequals value generated by encoder and scaler).
The information whether the upstream transmitter and/or receiver uses 32 or 64 tones is communicated via activationand acknowledgement tones constituting a handshake procedure.
C.2 ATU-C
C.2.1 Used frequency bandThe ATU-C shall use tones between #33 (f = 142,3125 kHz) and #255 (f = 1 099,6875 kHz). The use of tones below#33 is optional.
C.2.2 Nominal aggregate power levelThe nominal aggregate power level shall be 19,83 dBm.
C.2.3 Pilot frequencyTone #96 (f = 414 kHz) shall be reserved for a pilot (see ITU-T Recommendation G.992.1 [2], clause 6.11.1.2); that isb96 = 0 and g96 = 1.
C.2.4 Transmit spectral maskThe ATU-C transmitter spectral response shall be as defined in clause 4.2.1.1.

ETSI
ETSI TS 101 388 V1.3.1 (2002-05)60
C.3 ATU-R
C.3.1 ATU-R transmitter reference modelsThe ATU-R reference model for STM transport is given in figure C.1.
Toneordering
IDFT
n=0n=1
DAC andAnalog processing
Constell-ation
encoderand gainscaling
crcf
crci
S0
LS1
LS2
Mux/SyncControl
Interleaver
scram& FEC
scram& FEC
T-Reoc/aoc
BFEC OutputData Frame
CConstellationEncoder InputData Frame
Zi
i = 0 to 63
AMux
Data Frame
Reference Points
“Bits” “Bits” &“Gains”
OutputParallel/SerialBuffer
120
126
127
LS0
Figure C.1: ATU-R transmitter reference model for STM transport
The ATU-R reference model for ATM transport is given in figure C.2.
IDFT
n=0n=1
DAC andAnalog processing
Toneordering
Constell-ation
encoderand gainscaling
crcf
crci
Mux/SyncControl
Inter leaver
scram& FEC
scram& FEC
T-Reoc/aoc
BFEC OutputData Frame
CConstellationEncoder InputData Frame
Zi
i = 0 to 63
AMux
Data Frame
Reference Points
“Bits” “Bits” &“Gains”
OutputParallel/SerialBuffer
Cell TC
Cell TC
LS0
LS1
ATM0
ATM1
120
126
127
Figure C.2: ATU-R transmitter reference model for ATM transport
C.3.2 Used frequency bandThe ATU-R shall use tones between #33 and #63. The use of tones below #33 is optional.
C.3.3 Nominal aggregate power levelThe nominal aggregate power level shall be 13,26 dBm.

ETSI
ETSI TS 101 388 V1.3.1 (2002-05)61
C.3.4 Maximum number of data sub-carriersThe maximum number of data sub-carriers shall be 63, however the use of carriers between #1 and #32 is optional. Thelower frequency limit of the used sub-carriers is partly determined by the ISDN splitting filters. If FDM is used toseparate the upstream and downstream ADSL signals, the upper limit is set by down-up splitting filters. The cut-offfrequencies of these filters are completely at the discretion of the manufacturer. The range of usable bandwidth isdetermined during the channel estimation.
C.3.5 Pilot frequencyThere is no upstream pilot. The ATU-R shall perform slave loop timing based on the downstream pilot.
C.3.6 Nyquist frequencyThe upstream Nyquist frequency shall be at sub-carrier #64 (f = 276 kHz).
C.3.7 Modulation by the inverse discrete fourier transform
The modulating transform defines the relationship between the 128 real values xk and the Zi⋅:
⋅
=∑= i
i
k Zkij
x127
0
)64
exp(π for k = 0 to 127
The encoder and scaler generate complex values of Zi⋅ corresponding to tones 1 to 63 (plus zero at dc and one real valueif the Nyquist frequency is used). In order to generate real values of xk these values shall be augmented so that the
vector Zi⋅ has Hermitian symmetry. That is,
Zi⋅ = conj[Z128-i
⋅] for i = 65 to 128
If the transceiver receives C-ACT1 during transceiver training then,
Zi⋅ = 0 for i = 1 to 32
NOTE: For the mirrored complex conjugate transmitter,
Zi⋅ = conj[Z64-i
⋅] for i = 1 to 31
Z32⋅ = 0
C.3.8 Synchronization symbolThe data pattern used in the synchronization symbol shall be the pseudo-random sequence PRU (dn, for n = 1 to 128),
defined by:
dn = 1 for n = 1 to 6
dn = dn-5 ⊕ dn-6 for n = 7 to 128
The bits are used as follows: the first pair of bits (d1 and d2) is used for the dc and Nyquist sub-carriers (the powerassigned to them is, of course, zero, so the bits are effectively ignored); then the first and second bits of subsequentpairs shall be used to define the Xi and Yi for i = 1 to 63 in accordance to table 16 of ITU-T RecommendationG.992.1 [2].
ETSI
ETSI TS 101 388 V1.3.1 (2002-05)62
C.3.9 Cyclic prefixThe last 8 samples of the output of the IDFT (xk for k = 120 to 127) shall be prepended to the block of 64 samples andread out to the DAC in sequence. That is, the subscript, k, of the DAC samples in sequence are 120 to 127, 0 to 127.
C.3.10 Transmit spectral maskThe ATU-R transmitter spectral response shall be as defined in clause 4.2.1.2.
C.4 Initialization
C.4.1 C-ActivateC-ACT2m or C-ACT2e shall be sent to initiate a communication link to the ATU-R.
As shown in table C.1, the ATU-C shall transmit C-ACT2m or C-ACT2e to indicate its ability to receive 32 or64 upstream tones.
Table C.1
ATU-C ReceiverC-ACT2m Tones above 32 onlyC-ACT2e Tones below 33 allowed
C.4.2 C-ACT2mATU-C shall transmit C-ACT2m to indicate that it is able to receive tones above 32 only.
C-ACT2m is a single frequency sinusoid at fC-ACT2m = 319,125 kHz defined as in ITU-T RecommendationG.992.1 [2], clause 9.2.1.3, but with k = 74.
The level and duration of C-ACT2m shall be the same as those of C-ACT1 (see ITU-T Recommendation G.992.1 [2],clause 9.2.2.1).
C-QUIET2 immediately follows C-ACT2m.
C.4.3 C-ACT2eATU-C shall transmit C-ACT2e to indicate that it is able to receive tones below 33.
C-ACT2e is a single frequency sinusoid at fC-ACT2e = 327,75 kHz defined as in ITU-T Recommendation G.992.1 [2],clause 9.2.1.3, but with k = 76.
The level and duration of C-ACT2e shall be the same as those of C-ACT1 (see ITU-T Recommendation G.992.1 [2],clause 9.2.2.1).
C-QUIET2 immediately follows C-ACT2e.
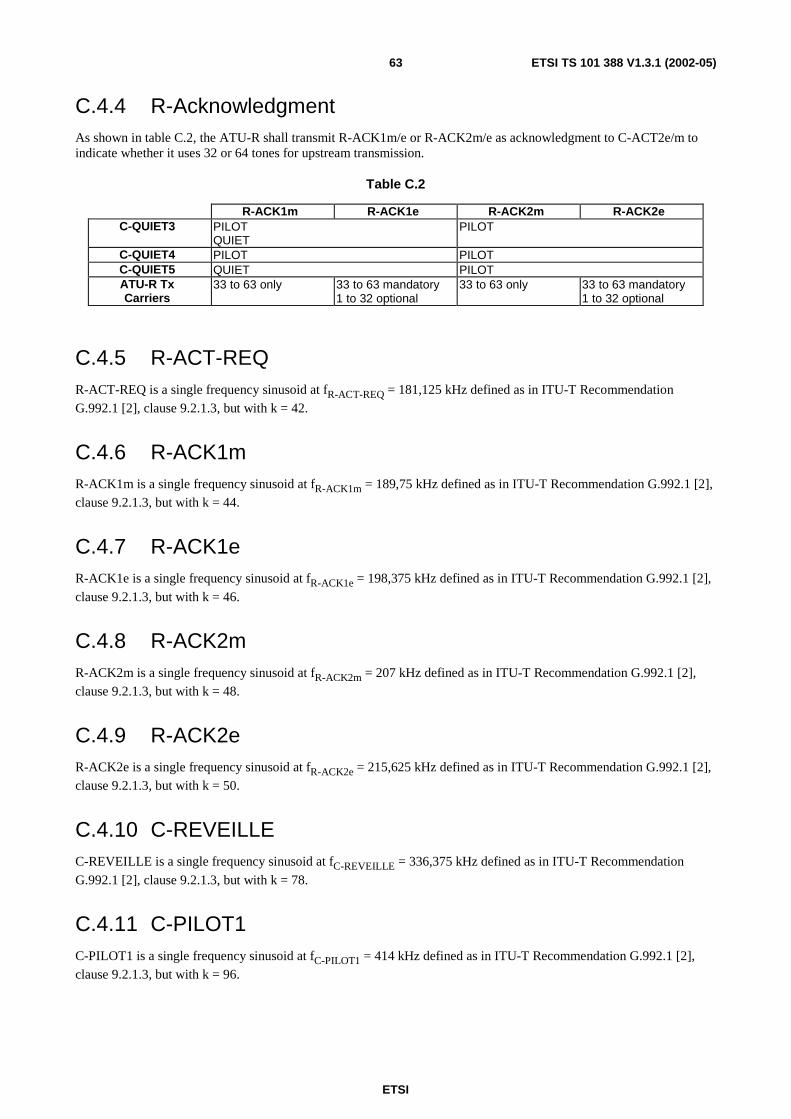
ETSI
ETSI TS 101 388 V1.3.1 (2002-05)63
C.4.4 R-AcknowledgmentAs shown in table C.2, the ATU-R shall transmit R-ACK1m/e or R-ACK2m/e as acknowledgment to C-ACT2e/m toindicate whether it uses 32 or 64 tones for upstream transmission.
Table C.2
R-ACK1m R-ACK1e R-ACK2m R-ACK2eC-QUIET3 PILOT
QUIETPILOT
C-QUIET4 PILOT PILOTC-QUIET5 QUIET PILOTATU-R TxCarriers
33 to 63 only 33 to 63 mandatory1 to 32 optional
33 to 63 only 33 to 63 mandatory1 to 32 optional
C.4.5 R-ACT-REQR-ACT-REQ is a single frequency sinusoid at fR-ACT-REQ = 181,125 kHz defined as in ITU-T RecommendationG.992.1 [2], clause 9.2.1.3, but with k = 42.
C.4.6 R-ACK1mR-ACK1m is a single frequency sinusoid at fR-ACK1m = 189,75 kHz defined as in ITU-T Recommendation G.992.1 [2],clause 9.2.1.3, but with k = 44.
C.4.7 R-ACK1eR-ACK1e is a single frequency sinusoid at fR-ACK1e = 198,375 kHz defined as in ITU-T Recommendation G.992.1 [2],
clause 9.2.1.3, but with k = 46.
C.4.8 R-ACK2mR-ACK2m is a single frequency sinusoid at fR-ACK2m = 207 kHz defined as in ITU-T Recommendation G.992.1 [2],clause 9.2.1.3, but with k = 48.
C.4.9 R-ACK2eR-ACK2e is a single frequency sinusoid at fR-ACK2e = 215,625 kHz defined as in ITU-T Recommendation G.992.1 [2],clause 9.2.1.3, but with k = 50.
C.4.10 C-REVEILLEC-REVEILLE is a single frequency sinusoid at fC-REVEILLE = 336,375 kHz defined as in ITU-T Recommendation
G.992.1 [2], clause 9.2.1.3, but with k = 78.
C.4.11 C-PILOT1C-PILOT1 is a single frequency sinusoid at fC-PILOT1 = 414 kHz defined as in ITU-T Recommendation G.992.1 [2],clause 9.2.1.3, but with k = 96.

ETSI
ETSI TS 101 388 V1.3.1 (2002-05)64
C.4.12 R-REVERB1The data pattern used in R-REVERB1 shall be the pseudo-random sequence PRU (dn, for n = 1 to 128), defined by:
dn = 1 for n = 1 to 6
dn = dn-5 ⊕ dn-6 for n = 7 to 128
The bits are used as follows: the first pair of bits (d1 and d2) is used for the dc and Nyquist sub-carriers (the power
assigned to them is, of course, zero, so the bits are effectively ignored); then the first and second bits of subsequentpairs shall be used to define the Xi and Yi for i = 1 to 63 as defined for C-REVERB1 in table 16 of ITU-T
Recommendation G.992.1 [2].
NOTE: The d1 to d6 are re-initialized for each symbol, so each symbol of R-REVERB1 uses the same data.
C.4.13 R-MEDLEYR-MEDLEY is a wide band pseudo-random signal used for estimation of the upstream SNR at the ATU-C. The data tobe transmitted are derived from the pseudo-random sequence PRU defined in R-REVERB1 clause. In contrast toR-REVERB1, however, the cyclic prefix is used and the data sequence continues from one symbol to the next. Becausethe sequence is of length 63, and 128 bits are used for each symbol, the sub-carrier vector for R-MEDLEY changesfrom one symbol to the next. R-MEDLEY is transmitted for 16 384 symbol periods. Following R-MEDLEY theATU-R enters signalling state R-REVERB4.
C.4.14 C-MSGS2Two bits are encoded onto each of the sub-carriers numbered 75 through 78 using 4QAM constellation labelling givenin clause 6.11.3 and table 16 of ITU-T Recommendation G.992.1 [2]. The same bits are also encoded in the same wayonto a set of backup carriers, namely, sub-carriers 91 through 94. The least significant byte of the message istransmitted in the first symbol of C-MSGS2, with the two least significant bits of each byte encoded onto carriers 75and 91. In addition, the pilot subcarrier 96 shall be modulated with the (+, +) constellation point.
C.4.15 R-MSGS2Two bits are encoded onto each of the sub-carriers numbered 44 through 47 using 4QAM constellation labelling givenin clause 6.11.3 and table 16 of ITU-T Recommendation G.992.1 [2]. The same bits are also encoded in the same wayonto a set of backup carriers, namely, sub-carriers 49 through 52. The least significant byte of the message istransmitted in the first symbol of C-MSGS2, with the two least significant bits of each byte encoded onto carriers 44and 49.
C.4.16 C-ECT and R-ECTBecause C-ECT and R-ECT are vendor defined signals (see ITU-T Recommendation G.992.1 [2], clauses 9.4.9 and9.5.5) the PSD specification shall be interpreted only as a maximum. This maximum level is -39 -2n dBm/Hz (forC-ECT) and -37 dBm/Hz (for R-ECT) (with n indicating the power cut back, n = 0 to 6) for the band from 138 kHz to1 104 kHz (for C-ECT) and to 276 (for R-ECT). Subcarriers 1 to 31 may be used, but the power in the ISDN band shallconform to the specification given in clauses C.2.4 and C.3.10 of the present document.
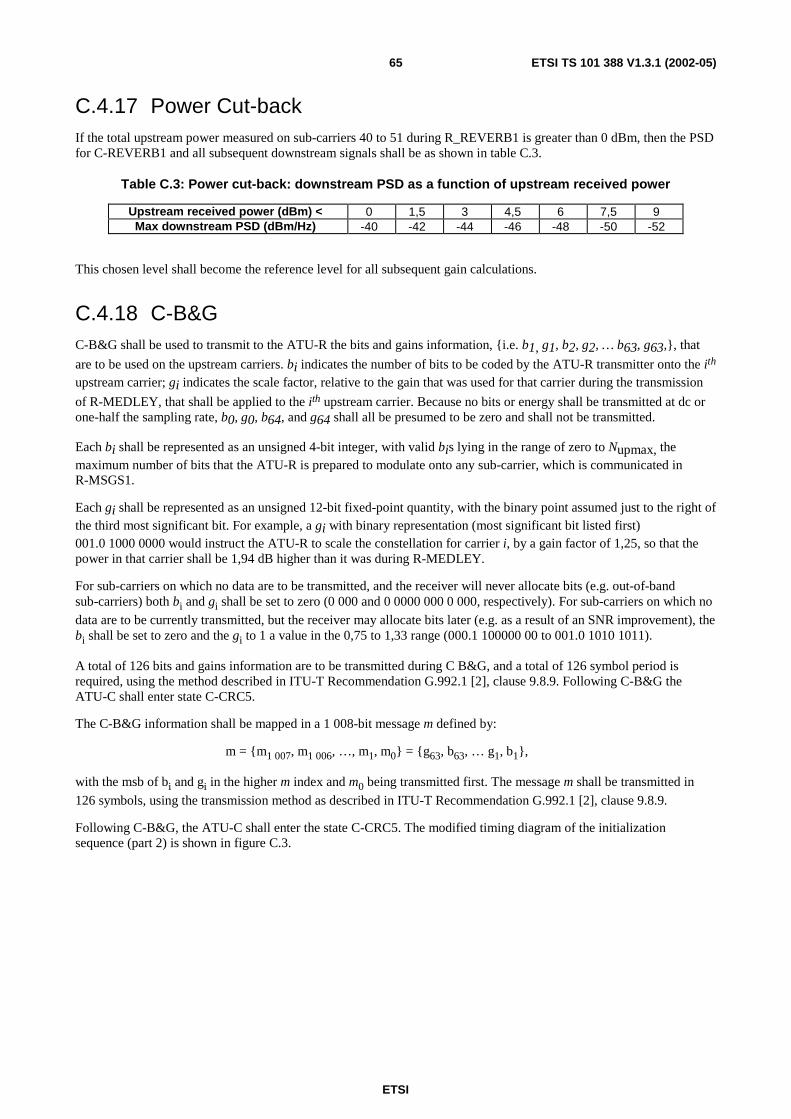
ETSI
ETSI TS 101 388 V1.3.1 (2002-05)65
C.4.17 Power Cut-backIf the total upstream power measured on sub-carriers 40 to 51 during R_REVERB1 is greater than 0 dBm, then the PSDfor C-REVERB1 and all subsequent downstream signals shall be as shown in table C.3.
Table C.3: Power cut-back: downstream PSD as a function of upstream received power
Upstream received power (dBm) < 0 1,5 3 4,5 6 7,5 9Max downstream PSD (dBm/Hz) -40 -42 -44 -46 -48 -50 -52
This chosen level shall become the reference level for all subsequent gain calculations.
C.4.18 C-B&GC-B&G shall be used to transmit to the ATU-R the bits and gains information, i.e. b1, g1, b2, g2, … b63, g63,, that
are to be used on the upstream carriers. bi indicates the number of bits to be coded by the ATU-R transmitter onto the ith
upstream carrier; gi indicates the scale factor, relative to the gain that was used for that carrier during the transmission
of R-MEDLEY, that shall be applied to the ith upstream carrier. Because no bits or energy shall be transmitted at dc orone-half the sampling rate, b0, g0, b64, and g64 shall all be presumed to be zero and shall not be transmitted.
Each bi shall be represented as an unsigned 4-bit integer, with valid bis lying in the range of zero to Nupmax, themaximum number of bits that the ATU-R is prepared to modulate onto any sub-carrier, which is communicated inR-MSGS1.
Each gi shall be represented as an unsigned 12-bit fixed-point quantity, with the binary point assumed just to the right ofthe third most significant bit. For example, a gi with binary representation (most significant bit listed first)001.0 1000 0000 would instruct the ATU-R to scale the constellation for carrier i, by a gain factor of 1,25, so that thepower in that carrier shall be 1,94 dB higher than it was during R-MEDLEY.
For sub-carriers on which no data are to be transmitted, and the receiver will never allocate bits (e.g. out-of-bandsub-carriers) both bi and gi shall be set to zero (0 000 and 0 0000 000 0 000, respectively). For sub-carriers on which nodata are to be currently transmitted, but the receiver may allocate bits later (e.g. as a result of an SNR improvement), thebi shall be set to zero and the gi to 1 a value in the 0,75 to 1,33 range (000.1 100000 00 to 001.0 1010 1011).
A total of 126 bits and gains information are to be transmitted during C B&G, and a total of 126 symbol period isrequired, using the method described in ITU-T Recommendation G.992.1 [2], clause 9.8.9. Following C-B&G theATU-C shall enter state C-CRC5.
The C-B&G information shall be mapped in a 1 008-bit message m defined by:
m = m1 007, m1 006, …, m1, m0 = g63, b63, … g1, b1,
with the msb of bi and gi in the higher m index and m0 being transmitted first. The message m shall be transmitted in
126 symbols, using the transmission method as described in ITU-T Recommendation G.992.1 [2], clause 9.8.9.
Following C-B&G, the ATU-C shall enter the state C-CRC5. The modified timing diagram of the initializationsequence (part 2) is shown in figure C.3.

ETSI
ETSI TS 101 388 V1.3.1 (2002-05)66
C-REVERB5
C-REVERB-RA
C-REVERB4
R-REVERB5
R-REVERB6
R-REVERB-RA
R-SEGUE3 10
9
≥ 291≤ 4 000
R-SEGUE4 10
C-MSG2/C-CRC3C-RATES2/C-CRC4
≥ 80≤ 2 413
15
10
10
≥ 586≤ 4000
C-SEGUE310
R-B&G/R-CRC5
R-SEGUE5 10
≤ 4 000
512
≥ 727≤ 6 000
C-RATES-RA/C-CRC-RA1C-MSG-RA/C-CRC-RA2130
R-MSG-RA/R-CRC-RA1R-RATES-RA/R-CRC-RA2
C-SEGUE2
R-SEGUE-RA
R-MSG2/R-CRC-3R-RATES2/R-CRC4
C-SEGUE-RA
10
SHOWTIME
128
SHOWTIME
≥ 288≤ 4 000
≥ 163≤ 4 000
≤ 2 095
R-REVERB4128
≥ 64≤ 1 447
≥ 80≤ 2 534
≥ 64≤ 1 319
R-MEDLEY
C-B&G/C-CRC5
9
Maximuminitialization time
11,3 seconds
≤ 1 895
Figure C.3: Timing diagram of the initialization sequence

ETSI
ETSI TS 101 388 V1.3.1 (2002-05)67
Annex D (informative):PSD masks for ADSL over POTS as specified in ITU-TRecommendation G.992.1In this annex, the PSD masks for ADSL over POTS are reproduced. The PSD masks are copied from annex A ofITU-T Recommendation G.992.1 [2].
D.1 ATU-C Downstream transmit spectral maskThe band from 25 kHz to 1 104 kHz that is referred to is the widest possible band (used for ADSL over POTSimplemented with overlapped spectrum). Limits defined within this band apply also to any narrower bands used.
Figure D.1 shows a representative spectral mask for the transmit signal. The low-frequency stop-band is defined as thePOTS band, the high-frequency stop-band is defined as frequencies greater than 1 104 kHz.
PSD indBm/Hz
21 dB/octave
-97,5 peak+15 dBrn0 - 4 kHz
-92,5 peak
-36,5 peak
-36 dB/octave
-90 dBm/Hz
-50 dBm power in any1 MHz sliding windowabove 4 545 kHz
04 25,875 1 104
3 0934 545 11 040
Frequencyin kHz
Figure D.1: ATU-C transmitted PSD mask

ETSI
ETSI TS 101 388 V1.3.1 (2002-05)68
Table D.1: Line equations for ATU-C transmitted PSD mask
Frequency band f (kHz) Equation for line(dBm/Hz)
0 < f < 4 -97,5, with max power in the in-0 - 4 kHz band of +15 dBrn4 < f < 25,875 -92,5 + 21 × log2 (f/4)
25,875 < f < 1 104 -36,51 104 < f < 3 093 -36,5 - 36 × log2 (f/1 104)
3 093 < f < 4 545 -90 peak, with max power in the [f, f + 1 MHz] window of(-36,5 - 36 × log2 (f/1 104) + 60) dBm
4 545 < f < 11 040 -90 peak, with max power in the [f, f + 1 MHz] window -f -50 dBmNOTE 1: All PSD measurements are in 100 Ω; the POTS band total power measurement is in
600 Ω.NOTE 2: The breakpoint frequencies and PSD values are exact; the indicated slopes are approximate.NOTE 3: Above 25,875 kHz, the peak PSD shall be measured with a 10 kHz resolution bandwidth.NOTE 4: The power in a 1 MHz sliding window is measured in a 1 MHz bandwidth, starting at the
measurement frequency.NOTE 5: The step in the PSD mask at 4 kHz is to protect V.90 performance. Originally, the PSD mask
continued the 21 dB/octave slope below 4 kHz hitting a floor -f -97,5 dBm/Hz at 3 400 Hz. It wasrecognized that this might impact V.90 performance, and so the floor was extended to 4 kHz.
NOTE 6: All PSD and power measurements shall be made at the U-C interface (see ITU-T RecommendationG.992.1 [2], figure 1.1); the signals delivered to the PSTN are specified in annex E of ITU-TRecommendation G.992.1 [2].
D.2 ATU-C transmitter PSD mask for reduced NEXTFigure D.2 defines a spectral mask for the ATU-C transmitted signal, which results in reduced NEXT into the ADSLupstream band, relative to the mask in clause D.1. Adherence to this mask will in many cases result in improvedupstream performance of the other ADSL systems in the same or adjacent binder group, with the improvementdependent upon the other interferers. This mask differs from the mask in clause D.1 only in the band from 4 kHz to138 kHz.
PSD (dB)
36 dB/octave
-97,5 peak+15 dBrn0 - 4 kHz
-92,5 peak
-36,5 peak
-36 dB/octave
-90 peak
-50 dBm max power in any1 MHz sliding windowabove 4 545 kHz
4 1 104 3 093 4 545 11 040
Frequency(kHz)
0 80 138
-44,2 peak
-72,5 peak
4,63 dB/octave
Figure D.2: ATU-C transmitter PSD mask for reduced NEXT

ETSI
ETSI TS 101 388 V1.3.1 (2002-05)69
Table D.2: Line equations for ATU-C transmitted PSD mask for reduced NEXT
Frequency band f (kHz) Equation for line(dBm/Hz)
0 < f < 4 -97,5, with max power in the in 0 - 4 kHz band of +15 dBrn4 < f < 80 -92,5 + 4,63 × log2 (f/4)
80 < f < 138 -72,5 + 36 × log2 (f/80)
138 < f < 1 104 -36,51 104 < f < 3 093 -36,5 - 36 × log2(f/1 104)
3 093 < f < 4 545 -90 peak, with max power in the [f, f + 1 MHz] window of(-36,5 - 36 × log2(f/1 104) + 60) dBm
4 545 < f < 11 040 -90 peak, with max power in the [f, f + 1 MHz] window -f -50 dBmNOTE 1: All PSD measurements are in 100 Ω; the POTS band total power measurement is in
600 Ω.NOTE 2: The breakpoint frequencies and PSD values are exact; the indicated slopes are approximate.NOTE 3: Above 25,875 kHz, the peak PSD shall be measured with a 10 kHz resolution bandwidth.NOTE 4: The power in a 1 MHz sliding window is measured in a 1 MHz bandwidth, starting at the measurement
frequency.NOTE 5: The step in the PSD mask at 4 kHz is to protect V.90 performance. Originally, the PSD mask
continued the 21 dB/octave slope below 4 kHz hitting a floor -f -97,5 dBm/Hz at 3 400 Hz. It wasrecognized that this might impact V.90 performance, and so the floor was extended to 4 kHz.
NOTE 6: All PSD and power measurements shall be made at the U-C interface (see ITU-T RecommendationG.992.1 [2], figure 1.1); the signals delivered to the PSTN are specified in annex E of ITU-TRecommendation G.992.1 [2].
D.3 ATU-R Transmitter spectral maskFigure D.3 shows a PSD mask for the transmitted signal. The passband is defined as frequency range over which themodem transmits, which may be narrower than the 25,875 kHz to 138 kHz shown. The low-frequency stop-band isdefined as the voiceband.
PSD indBm/Hz
21,5 dB/octave
-97,515 dBrn0 - 4 kHz
-92,5 peak
-34,5 peak
-48 dB/octave
-90 dBm/Hz peak
-50 dBm power in any1 MHz sliding windowabove 1 630 kHz
4 11 040Frequencyin kHz0 25,875 138 307
1 221
1 630
Figure D.3: ATU-R transmitter PSD mask
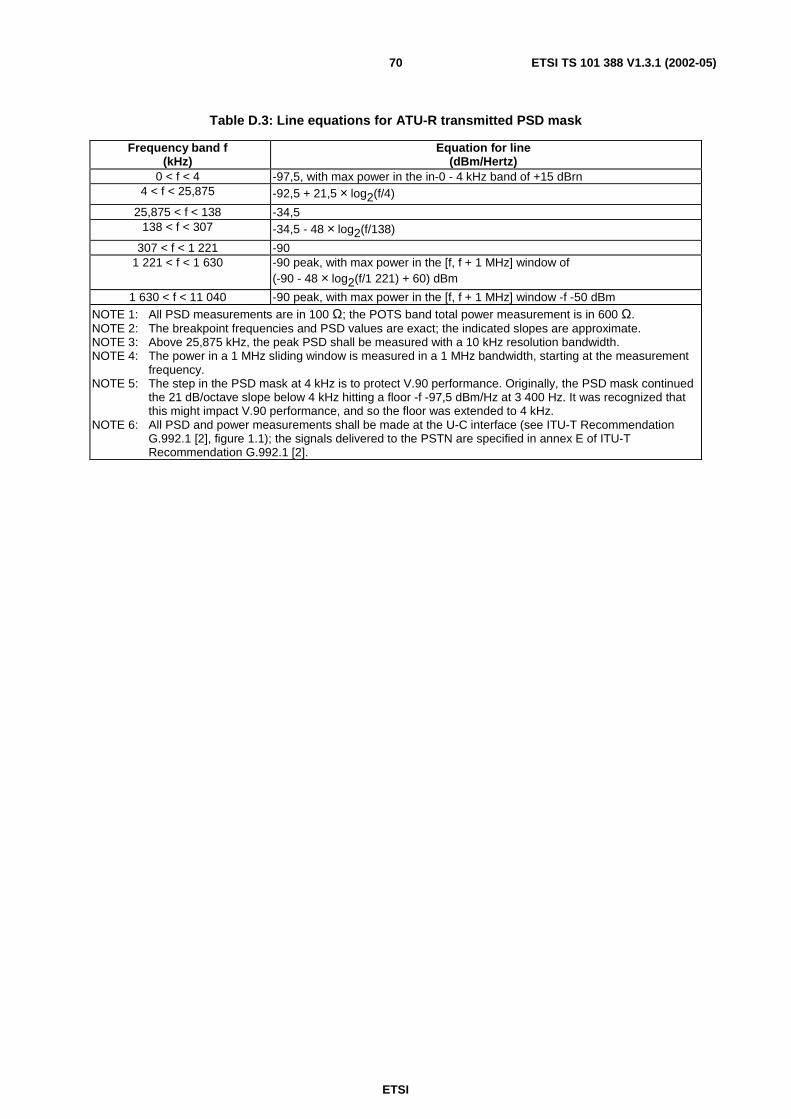
ETSI
ETSI TS 101 388 V1.3.1 (2002-05)70
Table D.3: Line equations for ATU-R transmitted PSD mask
Frequency band f(kHz)
Equation for line(dBm/Hertz)
0 < f < 4 -97,5, with max power in the in-0 - 4 kHz band of +15 dBrn4 < f < 25,875 -92,5 + 21,5 × log2(f/4)
25,875 < f < 138 -34,5138 < f < 307 -34,5 - 48 × log2(f/138)
307 < f < 1 221 -901 221 < f < 1 630 -90 peak, with max power in the [f, f + 1 MHz] window of
(-90 - 48 × log2(f/1 221) + 60) dBm
1 630 < f < 11 040 -90 peak, with max power in the [f, f + 1 MHz] window -f -50 dBmNOTE 1: All PSD measurements are in 100 Ω; the POTS band total power measurement is in 600 Ω.NOTE 2: The breakpoint frequencies and PSD values are exact; the indicated slopes are approximate.NOTE 3: Above 25,875 kHz, the peak PSD shall be measured with a 10 kHz resolution bandwidth.NOTE 4: The power in a 1 MHz sliding window is measured in a 1 MHz bandwidth, starting at the measurement
frequency.NOTE 5: The step in the PSD mask at 4 kHz is to protect V.90 performance. Originally, the PSD mask continued
the 21 dB/octave slope below 4 kHz hitting a floor -f -97,5 dBm/Hz at 3 400 Hz. It was recognized thatthis might impact V.90 performance, and so the floor was extended to 4 kHz.
NOTE 6: All PSD and power measurements shall be made at the U-C interface (see ITU-T RecommendationG.992.1 [2], figure 1.1); the signals delivered to the PSTN are specified in annex E of ITU-TRecommendation G.992.1 [2].

ETSI
ETSI TS 101 388 V1.3.1 (2002-05)71
Annex E (informative):Characteristics of all digital loop signalsThe PSD masks in this annex are intended for use with ITU Recommendation G.dmt.bis currently under development inthe ITU. If for some reason the completion of G.dmt.bis is delayed indefinitely, these PSD masks can be used withITU-T Recommendation G.992.1 [2]. The description in this annex is signal description only and not a systemdescription. European specific requirements such as performance requirements are for further study. Future ITUrefinements of ADL signal descriptions will supercede the signal descriptions in this annex.
When ADL systems are deployed in the same cable with other types of xDSL systems, there may be spectralcompatibility issues. These issues are currently being studied within the ETSI TM6 Spectrum Management projects. Asa result general deployment restrictions for xDSL systems may be imposed (e.g. by the regional regulatory authority),for example, for those using the PSD masks defined in this annex.
E.1 All digital mode ADSL derived from ADSL over POTS
E.1.1 ATU-C downstream transmit spectral mask for overlappedspectrum operation
The passband is defined as the band from 3 kHz to 1 104 kHz and is the widest possible band used (i.e. implementedwith overlapped spectrum). Limits defined within the passband apply also to any narrower bands used.
Figure E.1 defines the spectral mask for the transmit signal. The low-frequency stop-band is defined as frequenciesbelow 3 kHz, the high-frequency stop-band is defined as frequencies greater than 1 104 kHz. Limitations on aggregatetransmit power are specified in clause E.3.
12 dB/octave
-48,5 peak
-36,5 peak
-36 dB/octave
0 1,5 3 1 1043 093
4 545 11 040
PSD indBm/Hz
Frequencyin kHz
-90 dBm/Hz
-50 dBm power in any1MHz sliding windowabove 4 545 kHz
Figure E.1: All digital mode downstream PSD mask for overlapped operation
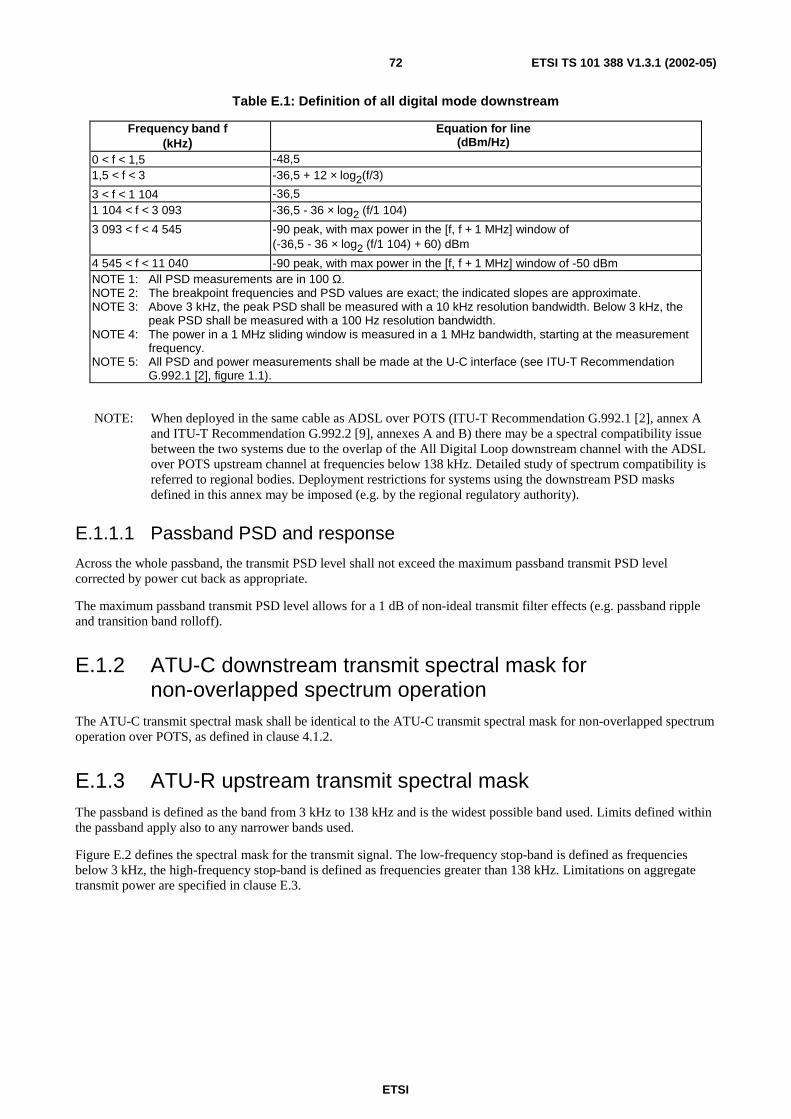
ETSI
ETSI TS 101 388 V1.3.1 (2002-05)72
Table E.1: Definition of all digital mode downstream
Frequency band f(kHz)
Equation for line(dBm/Hz)
0 < f < 1,5 -48,51,5 < f < 3 -36,5 + 12 × log2(f/3)
3 < f < 1 104 -36,51 104 < f < 3 093 -36,5 - 36 × log2 (f/1 104)
3 093 < f < 4 545 -90 peak, with max power in the [f, f + 1 MHz] window of(-36,5 - 36 × log2 (f/1 104) + 60) dBm
4 545 < f < 11 040 -90 peak, with max power in the [f, f + 1 MHz] window of -50 dBmNOTE 1: All PSD measurements are in 100 Ω.NOTE 2: The breakpoint frequencies and PSD values are exact; the indicated slopes are approximate.NOTE 3: Above 3 kHz, the peak PSD shall be measured with a 10 kHz resolution bandwidth. Below 3 kHz, the
peak PSD shall be measured with a 100 Hz resolution bandwidth.NOTE 4: The power in a 1 MHz sliding window is measured in a 1 MHz bandwidth, starting at the measurement
frequency.NOTE 5: All PSD and power measurements shall be made at the U-C interface (see ITU-T Recommendation
G.992.1 [2], figure 1.1).
NOTE: When deployed in the same cable as ADSL over POTS (ITU-T Recommendation G.992.1 [2], annex Aand ITU-T Recommendation G.992.2 [9], annexes A and B) there may be a spectral compatibility issuebetween the two systems due to the overlap of the All Digital Loop downstream channel with the ADSLover POTS upstream channel at frequencies below 138 kHz. Detailed study of spectrum compatibility isreferred to regional bodies. Deployment restrictions for systems using the downstream PSD masksdefined in this annex may be imposed (e.g. by the regional regulatory authority).
E.1.1.1 Passband PSD and response
Across the whole passband, the transmit PSD level shall not exceed the maximum passband transmit PSD levelcorrected by power cut back as appropriate.
The maximum passband transmit PSD level allows for a 1 dB of non-ideal transmit filter effects (e.g. passband rippleand transition band rolloff).
E.1.2 ATU-C downstream transmit spectral mask fornon-overlapped spectrum operation
The ATU-C transmit spectral mask shall be identical to the ATU-C transmit spectral mask for non-overlapped spectrumoperation over POTS, as defined in clause 4.1.2.
E.1.3 ATU-R upstream transmit spectral maskThe passband is defined as the band from 3 kHz to 138 kHz and is the widest possible band used. Limits defined withinthe passband apply also to any narrower bands used.
Figure E.2 defines the spectral mask for the transmit signal. The low-frequency stop-band is defined as frequenciesbelow 3 kHz, the high-frequency stop-band is defined as frequencies greater than 138 kHz. Limitations on aggregatetransmit power are specified in clause E.3.

ETSI
ETSI TS 101 388 V1.3.1 (2002-05)73
0 1,5 138 307 1 221 11 0401 630
3
PSD indBm/Hz
-34,5 peak
-48 dB/octave
-90 dBm/Hz peak
-50 dBm power in any1 MHz sliding windowabove 1 630 kHz
Frequencyin kHz
-46,5 peak
12 dB/octave
Figure E.2: All digital mode upstream PSD mask
Table E.2: Definition of all digital mode upstream
Frequency band f(kHz)
Equation for line(dBm/Hz)
0 < f < 1,5 -46,51,5 < f < 3 -34,5 + 12 × log2(f/3)
3 < f < 138 -34,5138 < f < 307 -34,5 - 48 × log2(f/138)
307 < f < 1 221 -90 peak, with max power in the [f, f + 100 kHz] window of -42,5 dBm1 221 < f < 1 630 -90 peak, with max power in the [f, f + 1 MHz] window of
(-90 - 48 × log2(f/1 221) + 60) dBm
1 630 < f < 11 040 -90 peak, with max power in the [f, f + 1 MHz] window of -50 dBmNOTE 1: All PSD measurements are in 100 Ω.NOTE 2: The breakpoint frequencies and PSD values are exact; the indicated slopes are approximate.NOTE 3: Above 3 kHz, the peak PSD shall be measured with a 10 kHz resolution bandwidth. Below 3 kHz, the
peak PSD shall be measured with a 100 Hz resolution bandwidth.NOTE 4: The power in a 1 MHz sliding window is measured in a 1 MHz bandwidth, starting at the measurement
frequency.NOTE 5: All PSD and power measurements shall be made at the U-R interface (see ITU-T Recommendation
G.992.1 [2], figure 1.1).
E.1.3.1 Passband PSD and response
Across the whole passband, the transmit PSD level shall not exceed the maximum passband transmit PSD levelcorrected by power cut back as appropriate.
The maximum transmit PSD allows for a 1 dB of non-ideal transmit filter effects (e.g. passband ripple and transitionband rolloff).

ETSI
ETSI TS 101 388 V1.3.1 (2002-05)74
E.2 All digital mode ADSL derived from ADSL over ISDN
E.2.1 ATU-C downstream transmit spectral mask for overlappedspectrum operation
The ATU-C transmit spectral mask shall be identical to the ATU-C transmit spectral mask defined in clause E.1.1.
E.2.2 ATU-C downstream transmit spectral mask fornon-overlapped spectrum operation
The ATU-C transmit spectral mask shall be identical to the ATU-C transmit spectral mask for non-overlapped spectrumoperation over ISDN, as defined in clause 4.2.2.1.
E.2.3 ATU-R upstream transmit spectral maskThe ATU-R transmit PSD shall comply to one of the allowed family of spectral masks ADLU-32, ADLU-36 toADLU-64 as defined in table E.3. Each of the spectral masks shall be as defined in figure E.3 and table E.3. Limitationson aggregate transmit power are specified in clause E.3.
The passband is defined as the band from 3 kHz to an upper bound frequency f1, defined in table E.3. It is the widestpossible band used. Limits defined within the passband apply also to any narrower bands used.
Figure E.3 defines the family of ATU-R spectral masks for the transmit signal. The low-frequency stop-band is definedas frequencies below 3 kHz; the high-frequency stop-band is defined as frequencies greater than the passband upperbound frequency f1 defined in table E.3. The frequencies f1 and f2 shall be as defined in table E.3a.
0 1,5 f 1 f 2 1 221 11 0401 630
3
PSD indBm/Hz
Inband_peak_PSD
-48 dB/octave
-90 dBm/Hz peak
-50 dBm power in any1 MHz sliding windowabove 1 630 kHz
Frequencyin kHz
-46,5 peak
Figure E.3: The family of ATU-R upstream transmit PSD masks
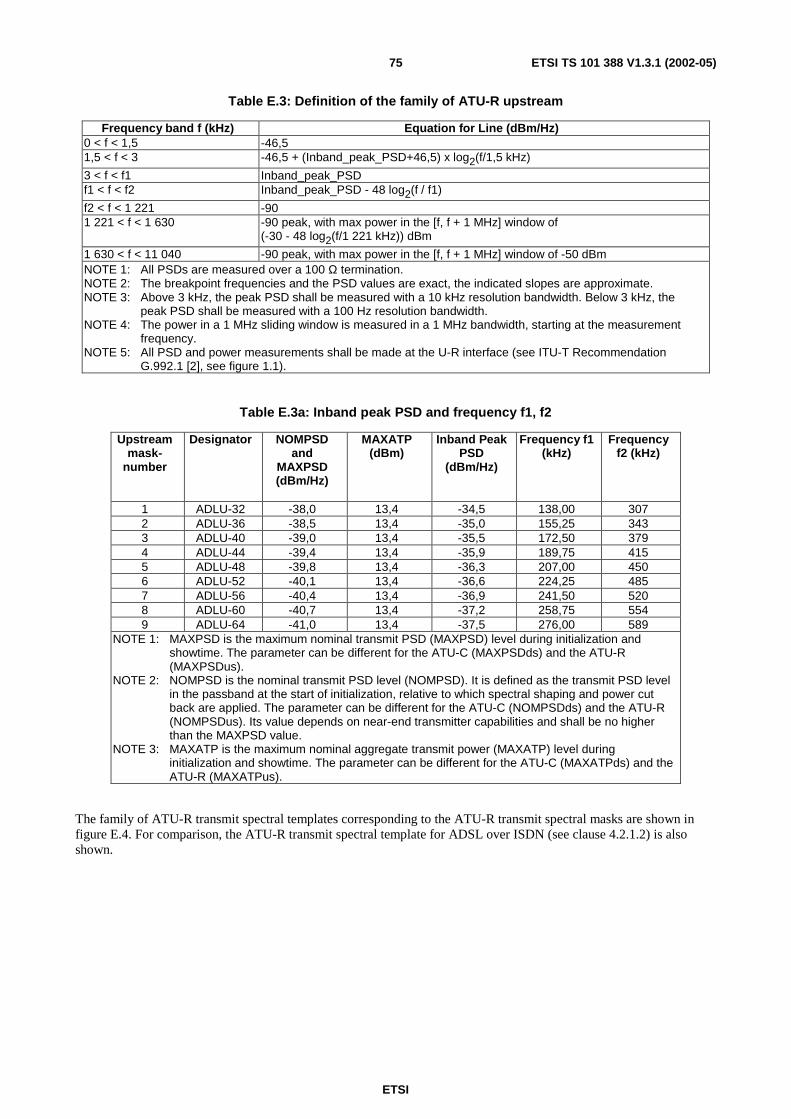
ETSI
ETSI TS 101 388 V1.3.1 (2002-05)75
Table E.3: Definition of the family of ATU-R upstream
Frequency band f (kHz) Equation for Line (dBm/Hz)0 < f < 1,5 -46,51,5 < f < 3 -46,5 + (Inband_peak_PSD+46,5) x log2(f/1,5 kHz)
3 < f < f1 Inband_peak_PSDf1 < f < f2 Inband_peak_PSD - 48 log2(f / f1)
f2 < f < 1 221 -901 221 < f < 1 630 -90 peak, with max power in the [f, f + 1 MHz] window of
(-30 - 48 log2(f/1 221 kHz)) dBm
1 630 < f < 11 040 -90 peak, with max power in the [f, f + 1 MHz] window of -50 dBmNOTE 1: All PSDs are measured over a 100 Ω termination.NOTE 2: The breakpoint frequencies and the PSD values are exact, the indicated slopes are approximate.NOTE 3: Above 3 kHz, the peak PSD shall be measured with a 10 kHz resolution bandwidth. Below 3 kHz, the
peak PSD shall be measured with a 100 Hz resolution bandwidth.NOTE 4: The power in a 1 MHz sliding window is measured in a 1 MHz bandwidth, starting at the measurement
frequency.NOTE 5: All PSD and power measurements shall be made at the U-R interface (see ITU-T Recommendation
G.992.1 [2], see figure 1.1).
Table E.3a: Inband peak PSD and frequency f1, f2
Upstreammask-
number
Designator NOMPSDand
MAXPSD(dBm/Hz)
MAXATP(dBm)
Inband PeakPSD
(dBm/Hz)
Frequency f1(kHz)
Frequencyf2 (kHz)
1 ADLU-32 -38,0 13,4 -34,5 138,00 3072 ADLU-36 -38,5 13,4 -35,0 155,25 3433 ADLU-40 -39,0 13,4 -35,5 172,50 3794 ADLU-44 -39,4 13,4 -35,9 189,75 4155 ADLU-48 -39,8 13,4 -36,3 207,00 4506 ADLU-52 -40,1 13,4 -36,6 224,25 4857 ADLU-56 -40,4 13,4 -36,9 241,50 5208 ADLU-60 -40,7 13,4 -37,2 258,75 5549 ADLU-64 -41,0 13,4 -37,5 276,00 589
NOTE 1: MAXPSD is the maximum nominal transmit PSD (MAXPSD) level during initialization andshowtime. The parameter can be different for the ATU-C (MAXPSDds) and the ATU-R(MAXPSDus).
NOTE 2: NOMPSD is the nominal transmit PSD level (NOMPSD). It is defined as the transmit PSD levelin the passband at the start of initialization, relative to which spectral shaping and power cutback are applied. The parameter can be different for the ATU-C (NOMPSDds) and the ATU-R(NOMPSDus). Its value depends on near-end transmitter capabilities and shall be no higherthan the MAXPSD value.
NOTE 3: MAXATP is the maximum nominal aggregate transmit power (MAXATP) level duringinitialization and showtime. The parameter can be different for the ATU-C (MAXATPds) and theATU-R (MAXATPus).
The family of ATU-R transmit spectral templates corresponding to the ATU-R transmit spectral masks are shown infigure E.4. For comparison, the ATU-R transmit spectral template for ADSL over ISDN (see clause 4.2.1.2) is alsoshown.

ETSI
ETSI TS 101 388 V1.3.1 (2002-05)76
0 1 2 3 4 5 6
x 105
-70
-65
-60
-55
-50
-45
-40
-35
-30
ADLU-32ADLU-36ADLU-40ADLU-44ADLU-48ADLU-52ADLU-56ADLU-60ADLU-64Gdmtbis/AnnexB
f (Hz)
PS
D(dB
m/H
z)
Upstream Nominal PSD templates ADLU-32 to ADLU-64 and G.dmt.bis/AnnexB
Figure E.4: The family of ATU-R transmit spectrum templates
NOTE: When deployed in the same cable as ADSL over POTS (ITU-T Recommendation G.992.1 [2], annex Aand ITU-T Recommendation G.992.2 [9], annexes A and B) there may be a spectral compatibility issuebetween the two systems due to the overlap of the All Digital Loop upstream channel with the ADSLover POTS downstream channel at frequencies above 138 kHz. Detailed study of spectrum compatibilityis referred to regional bodies. Deployment restrictions for systems using the upstream PSD masks definedin this annex may be imposed (e.g. by the regional regulatory authority).
E.2.3.1 Passband PSD and response
Across the whole passband, the transmit PSD level shall not exceed the maximum passband transmit PSD levelcorrected by power cut back as appropriate.
The maximum transmit PSD allows for a 1 dB of non-ideal transmit filter effects (e.g. passband ripple and transitionband rolloff).

ETSI
ETSI TS 101 388 V1.3.1 (2002-05)77
E.3 Aggregate transmit powerThere are several different PSD masks defined for the ADL transmit signals, depending on the type of signal sent(see clauses E.1.1.1, E.1.2.1 and E.2.3.1). In all cases,
• the aggregate transmit power shall not exceed the transmit power given in table E.4;
• the transmit power measurement shall measure the power into a resistive load having the same value as thedesign impedance for ADSL (RV = 100 Ω);
• the aggregate transmit power across the whole passband shall not exceed the maximum aggregate transmit power(minus the power cut-back) by more than 0,5 dB, in order to accommodate implementational tolerances;
• the aggregate transmit power over the 0 MHz to 11,040 MHz band, shall not exceed the maximum aggregatetransmit power (minus the power cut-back) by more than 0,8 dB for upstream signals and 0,9 dB for downstreamsignals, in order to account for residual transmit power in the stop bands and implementational tolerances.
The power emitted by the ATU-R is limited by the requirements in this clause. Notwithstanding these requirements, it isassumed that the ADSL will comply with applicable national requirements on emission of electromagnetic energy.
Table E.4: Maximum aggregate transmit power into 100 ΩΩΩΩ
Signal type Maximum aggregatetransmit power
Indicative number ofcarriers (see note)
EC ADL down (clause E.1.1):(derived from ADSL over POTS)
20,4 dBm 254
EC ADL up (clause E.1.3):(derived from ADSL over POTS)
13,3 dBm 31
FDD ADL down (clause E.1.2):(derived from ADSL over POTS)
19,9 dBm 227
FDD ADL up (clause E.1.3):(derived from ADSL over POTS)
13,3 dBm 31
EC ADL down (clause E.2.1):(derived from ADSL over ISDN)
20,4 dBm 254
EC ADL up (clause E.2.3):(derived from ADSL over ISDN)
13,4 dBm 31-63
FDD ADL down (clause E.2.2):(derived from ADSL over ISDN)
19,3 dBm 197
FDD ADL up (clause E.2.3):(derived from ADSL over ISDN)
13,4 dBm 31-63
NOTE: This column is only informative and gives the number of carriers that haveto be transmitted at full power to reach the maximum aggregate power level.This information does not limit the effective number of carriers which may beused.

ETSI
ETSI TS 101 388 V1.3.1 (2002-05)78
Annex F (informative):Example injection method for noise generator [G8]It is allowed to inject the noise G8 with a voltage source modelling the 4B3T ISDN. This source has a 150Ω outputimpedance, and is coupled to the line with an actual splitter lowpass. This injection method will model not only thenoise, but also the effect of the splitter filters and their impedance on the ADSL system. In this case the PSD of thisvoltage generator must model the complete signal of the ISDN transceiver, and not the residual noise at the entrance ofthe ADSL modem as given in table 7. The PSD of the voltage source including its 150 Ωoutput impedance is measuredon a 150 Ω termination. It is given by table F.1:
Table F.1: PSD mask for ISDN
f(kHz)
PSD(dBm/Hz)
5 -4022,5 -3640 -3765 -4080 -43
100 -50122,5 -62154.5 -60170 -61185 -65200 -69215 -74250 -82300 -78400 -67
1 000 -675 000 -120
NOTE: The above ISDN PSD corresponds to an average PSD based on measurements of different ISDN 4B3Ttransceivers. As worst case, 4B3T is used rather than 2B1Q.

ETSI
ETSI TS 101 388 V1.3.1 (2002-05)79
History
Document history
V1.1.1 November 1998 Publication
V1.2.1 October 2001 Publication
V1.3.1 May 2002 Publication