trust unites us - home - english - siemens global website combines its competencies and activities...
TRANSCRIPT


COVER PHOTO – James D. Palasek and Amber Sherman, two of the 370,000 Siemens employees working together in our global network of trust. To learn more, please see:
SPECIAL REPORT: DIVERSITY, PAGES 66-75
ProximityHow Bangalore’s new airport is driving progress across an entire region
Global presence – page 8
DiversityHow our employees’ wealth of experience is inspiring us
Employees and management culture – page 66
NetworkingHow intelligent IT solutions are creating unimagined value
Cross-business activities – page 54
IdeasHow our Biograph mMR scanner is enhancing patient care
Technology and innovation – page 20
Strength How efficient technologies are shaping the future of energy
Portfolio management – page 34
What sets our integrated technology company apart
Introduction – page 1
How our strategy is pointing the way to the future
One Siemens – page 78
Company Report 2012

When a new international airport is being planned, when a doctor recommends a treatment to a patient, when political leaders and society want to ensure reliable energy supplies for the future, when a company wants to offer tailor-made service solutions, when the development of innovative products demands the creativity, experience and dedication of a wide range of experts, that’s when tough decisions have to be made – far-reaching decisions based on a strong sense of responsibility.
The success of our integrated technology company rests not only on our technological excellence, power of innovation and financial strength but also on our commitment to responsibility – a commitment that’s made us a strong partner of trust to people all around the world for 165 years.
Trust unites us – Building strong partnerships for 165 years

COVER PHOTO – James D. Palasek and Amber Sherman, two of the 370,000 Siemens employees working together in our global network of trust. To learn more, please see:
SPECIAL REPORT: DIVERSITY, PAGES 66-75
ProximityHow Bangalore’s new airport is driving progress across an entire region
Global presence – page 8
DiversityHow our employees’ wealth of experience is inspiring us
Employees and management culture – page 66
NetworkingHow intelligent IT solutions are creating unimagined value
Cross-business activities – page 54
IdeasHow our Biograph mMR scanner is enhancing patient care
Technology and innovation – page 20
Strength How efficient technologies are shaping the future of energy
Portfolio management – page 34
What sets our integrated technology company apart
Introduction – page 1
How our strategy is pointing the way to the future
One Siemens – page 78
Company Report 2012
2
Ever since our Company was founded, we’ve stood for techno logical excellence, quality, reliability and international focus. Coupling innovative concepts and visionary ideas with a willingness to take calculable entrepreneurial risks in order to attain long-term success, our founder, Werner von Siemens, put us on track for achievement – as the following milestones from our history attest. www.SIEmEnS.COm/HISTORY
Trust unites us – Building strong partnerships for 165 years
1847 Werner von Siemens and Johann Georg Halske establish Telegraphen-Bauanstalt von Siemens & Halske in Berlin.
1848 Siemens & Halske wins the contract to build a telegraph line from Berlin to Frankfurt am Main – the longest communications link on the European continent.
1855 Siemens’ first subsidiary outside Germany is established in St. Petersburg by Carl von Siemens.
1850 Siemens’ first sales office outside Germany is opened in London.
1870 After only two years of construction, Siemens begins operation of the Indo-European telegraph line.
1872 Siemens establishes a pension fund for employees and their families.
1866 Werner von Siemens discovers the dynamo-electric principle.

3
1897 To broaden its financial base, Siemens & Halske is reorganized as a publicly listed company.
1879 The world’s first electric railway with an external power source is showcased in Berlin.
1903 Siemens-Schuckertwerke is founded to conduct Siemens’ electrical engineering business.
1938 Siemens scientists formulate the barrier layer theory, the springboard for modern semiconductor physics.
1925 The Irish Free State commissions Siemens to electrify the entire country.
1932 Siemens-Reiniger-Werke is established to bring all of Siemens’ businesses in the area of medical engineering under one roof.
1972 Siemens supplies important electrotechnical equipment for the Olympic Games in Munich.
1951 Construction is begun on a 300-mega-watt steam power plant in San Nicolás, Argentina – marking Siemens’ return to the world markets following World War II.
1959 Siemens launches the SIMATIC control system, enabling it to capture a leading position in automation technology.
1983 In Germany, Siemens installs a MAGNETOM scanner, the world’s first magnetic resonance imaging system.
2011 In Irsching, Germany, Siemens sets a world record for combined cycle power plant efficiency.
2001 The Siemens share is listed on the New York Stock Exchange.
1966 In response to new technological developments and structural changes on the world market, Siemens combines its competencies and activities in a new organization: Siemens AG.
2008 Siemens introduces its Environmental Portfolio.
2
Ever since our Company was founded, we’ve stood for techno logical excellence, quality, reliability and international focus. Coupling innovative concepts and visionary ideas with a willingness to take calculable entrepreneurial risks in order to attain long-term success, our founder, Werner von Siemens, put us on track for achievement – as the following milestones from our history attest. www.SIEmEnS.COm/HISTORY
Trust unites us – Building strong partnerships for 165 years
1847 Werner von Siemens and Johann Georg Halske establish Telegraphen-Bauanstalt von Siemens & Halske in Berlin.
1848 Siemens & Halske wins the contract to build a telegraph line from Berlin to Frankfurt am Main – the longest communications link on the European continent.
1855 Siemens’ first subsidiary outside Germany is established in St. Petersburg by Carl von Siemens.
1850 Siemens’ first sales office outside Germany is opened in London.
1870 After only two years of construction, Siemens begins operation of the Indo-European telegraph line.
1872 Siemens establishes a pension fund for employees and their families.
1866 Werner von Siemens discovers the dynamo-electric principle.

COVER PHOTO – James D. Palasek and Amber Sherman, two of the 370,000 Siemens employees working together in our global network of trust. To learn more, please see:
SPECIAL REPORT: DIVERSITY, PAGES 66-75
ProximityHow Bangalore’s new airport is driving progress across an entire region
Global presence – page 8
DiversityHow our employees’ wealth of experience is inspiring us
Employees and management culture – page 66
NetworkingHow intelligent IT solutions are creating unimagined value
Cross-business activities – page 54
IdeasHow our Biograph mMR scanner is enhancing patient care
Technology and innovation – page 20
Strength How efficient technologies are shaping the future of energy
Portfolio management – page 34
What sets our integrated technology company apart
Introduction – page 1
How our strategy is pointing the way to the future
One Siemens – page 78
Company Report 2012
4
People all over the world place their trust in Siemens because, as an integrated technology company, we’re poised to seize competitive advantages even in a challenging business environ-ment. Siemens stands for:
What sets us apart – What we stand for
With activities in some 190 countries, we’re close to our customers worldwide. The construction of Bengaluru International Airport is a prime example. Siemens employees are on site, providing the air-port’s operators with products and solutions from a single source. Our global presence – coupled with development, procurement and production activities at customer locations all over the world – makes us a strong local partner and is strengthening our position on tomor-row’s growth markets.
Proximity
PAGE 8
PAGE 20
Our research activities also span the globe. To create the technologies and innovations of tomorrow, the experts at our integrated technology company cooperate across organ-izational as well as regional boundaries, working closely with customers, universities, research facilities and industry partners worldwide. The Biograph mMR scanner – devel-oped in collaboration with Tübingen University Hospital in Germany – is just one example of how our pioneering ideas are benefiting people everywhere.
Ideas
The integrated technology company

5
PAGE 66
PAGE 54
PAGE 34
As a company with a solid financial basis and an outstanding com-petitive position, we practice intensive portfolio management, focus-ing our portfolio and investments on attractive markets with high growth potential. The successful test of our new six-megawatt wind turbines in Østerild, Denmark and our strong partnership with the German utility EnBW Energie Baden-Württemberg AG show how this strategy is paying off: thanks to timely investments in offshore wind turbines and combined cycle power plants, we’re already profiting from the transition to a new energy system. Both technologies are part of our groundbreaking Environmental Portfolio.
Strength
In all areas of Company-wide relevance, we foster continuous knowledge exchange across our entire organization. Our service business is a good example of how our cross-business activities are creating value. The IT-supported services we’re providing for machine tool manufacturer Schwäbische Werkzeug-maschinen, for instance, not only improve processes; they also strengthen customer loyalty. Other cross-business activities bundle our expertise in procure-ment and foster the development of our employees.
Networking
We offer our highly qualified, international workforce a wide range of opportunities for further education and professional development. Our Company-wide training and continuing education programs – coupled with measures to make our teams more diverse – are strength-ening our employees and our management culture and enabling us to rigorously leverage the power of Siemens across our entire organi-zation. A specialized software platform allows us to effectively and successfully coordinate diverse teams across continents and time zones. We also conduct entry-level programs for university graduates and run a Company-wide idea management program that enables us to benefit from our employees’ suggestions.
Diversity
4
People all over the world place their trust in Siemens because, as an integrated technology company, we’re poised to seize competitive advantages even in a challenging business environ-ment. Siemens stands for:
What sets us apart – What we stand for
With activities in some 190 countries, we’re close to our customers worldwide. The construction of Bengaluru International Airport is a prime example. Siemens employees are on site, providing the air-port’s operators with products and solutions from a single source. Our global presence – coupled with development, procurement and production activities at customer locations all over the world – makes us a strong local partner and is strengthening our position on tomor-row’s growth markets.
Proximity
PAGE 8
PAGE 20
Our research activities also span the globe. To create the technologies and innovations of tomorrow, the experts at our integrated technology company cooperate across organ-izational as well as regional boundaries, working closely with customers, universities, research facilities and industry partners worldwide. The Biograph mMR scanner – devel-oped in collaboration with Tübingen University Hospital in Germany – is just one example of how our pioneering ideas are benefiting people everywhere.
Ideas
The integrated technology company

COVER PHOTO – James D. Palasek and Amber Sherman, two of the 370,000 Siemens employees working together in our global network of trust. To learn more, please see:
SPECIAL REPORT: DIVERSITY, PAGES 66-75
ProximityHow Bangalore’s new airport is driving progress across an entire region
Global presence – page 8
DiversityHow our employees’ wealth of experience is inspiring us
Employees and management culture – page 66
NetworkingHow intelligent IT solutions are creating unimagined value
Cross-business activities – page 54
IdeasHow our Biograph mMR scanner is enhancing patient care
Technology and innovation – page 20
Strength How efficient technologies are shaping the future of energy
Portfolio management – page 34
What sets our integrated technology company apart
Introduction – page 1
How our strategy is pointing the way to the future
One Siemens – page 78
Company Report 2012
6
We invite you to take a look at the five special reports that follow. In them, our partners, customers and employees talk about how they view their day-to-day cooperation with us and how this cooperation is deepening their trust in Siemens.
The reports provide a look behind the scenes at how we’re leveraging the potential of our integrated technology company and turning it into reality every day.
Proximity, page 8
Ideas, page 20
Strength, page 34
Networking, page 54
Diversity, page 66
The integrated technology company


8
Trust through proximity
“Progress requires a high-performance infrastructure.”
Home to nearly 8.5 million people, Bangalore is India’s third-largest metropolitan area. Called the Silicon Valley of India due to the many IT, aerospace and biotech companies located in and around it, the city owes its success to an advanced infrastructure that’s also driving progress across the entire state of Karnataka, which has a popula-tion of more than 60 million.
Bengaluru International Airport, which was built with the help of an innovative public-private partnership initiated and supported by Siemens, is part of this impressive infrastructure development. Close, trust-based collaboration ensured the huge project’s success. As Managing Director of the international airports in Bangalore and Mumbai, G.V. Sanjay Reddy is ideally positioned to understand the subcontinent’s infrastructure requirements. In the report that follows, he talks about his experiences.

9
Proximity
ideas, page 20
Strength, page 34
Networking, page 54
Diversity, page 66
The integrated technology company
Population growth of roughly 50 % between 2001 and 2011
The challenge for Bangalore

10
8.5 million inhabitants
India’s third-largest city
High levels of air pollution
Overburdened transportation infrastructure
in 2011
Aerospace industry
Above – Bangalore’s growth continues unabated. To meet the needs of its booming population – which already totals about 8.5 million – the indian metropolis needs a high-performance infrastructure.
The challenge for Bangalore
11
IT location
India’s Silicon Valley
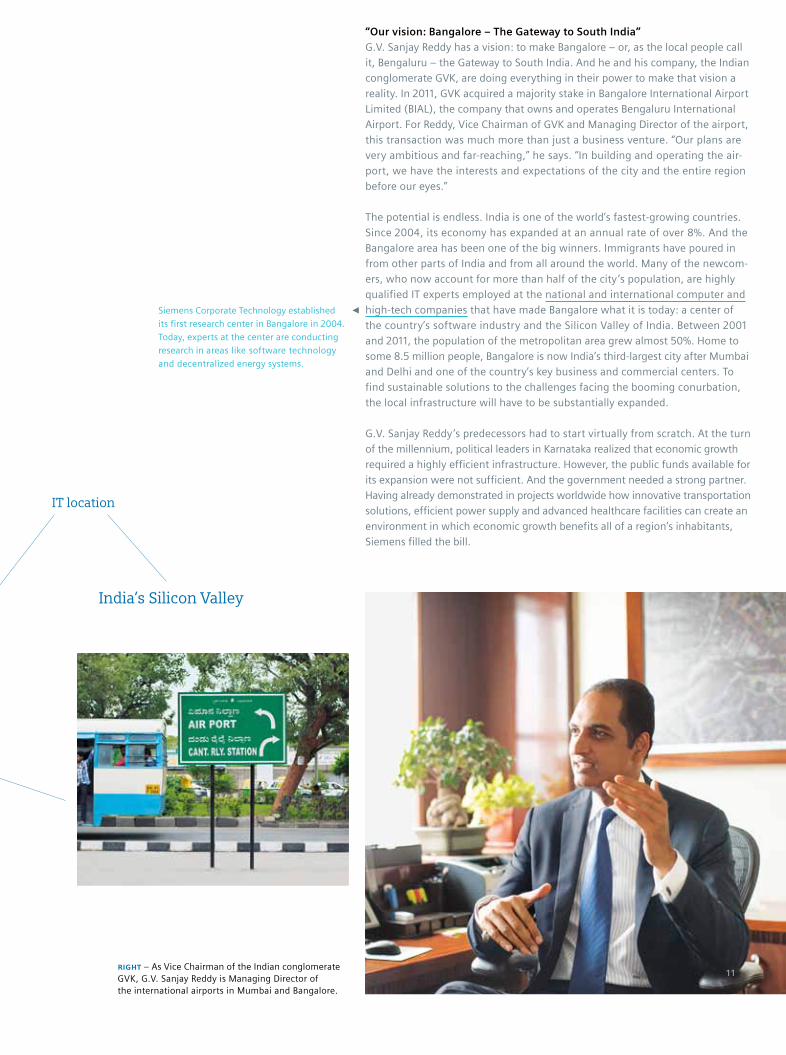
“Our vision: Bangalore – The Gateway to South India”G.V. Sanjay Reddy has a vision: to make Bangalore – or, as the local people call it, Bengaluru – the Gateway to South india. And he and his company, the indian conglomerate GVK, are doing everything in their power to make that vision a reality. in 2011, GVK acquired a majority stake in Bangalore international Airport Limited (BiAL), the company that owns and operates Bengaluru international Airport. For Reddy, Vice Chairman of GVK and managing Director of the airport, this transaction was much more than just a business venture. “Our plans are very ambitious and far-reaching,” he says. “in building and operating the air-port, we have the interests and expectations of the city and the entire region before our eyes.”
The potential is endless. india is one of the world’s fastest-growing countries. Since 2004, its economy has expanded at an annual rate of over 8%. And the Bangalore area has been one of the big winners. immigrants have poured in from other parts of india and from all around the world. many of the newcom-ers, who now account for more than half of the city ’s population, are highly qualified iT experts employed at the national and international computer and high-tech companies that have made Bangalore what it is today: a center of the country’s software industry and the Silicon Valley of india. Between 2001 and 2011, the population of the metropolitan area grew almost 50%. Home to some 8.5 million people, Bangalore is now india’s third-largest city after mumbai and Delhi and one of the country’s key business and commercial centers. To find sustainable solutions to the challenges facing the booming conurbation, the local infrastructure will have to be substantially expanded.
G.V. Sanjay Reddy ’s predecessors had to start virtually from scratch. At the turn of the millennium, political leaders in Karnataka realized that economic growth required a highly efficient infrastructure. However, the public funds available for its expansion were not sufficient. And the government needed a strong partner. Having already demonstrated in projects worldwide how innovative transportation solutions, efficient power supply and advanced healthcare facilities can create an environment in which economic growth benefits all of a region’s inhabitants, Siemens filled the bill.
Right – As Vice Chairman of the indian conglomerate GVK, G.V. Sanjay Reddy is managing Director of the international airports in mumbai and Bangalore.
Siemens Corporate Technology established
its first research center in Bangalore in 2004.
Today, experts at the center are conducting
research in areas like software technology
and decentralized energy systems.

12
Public-private partnership
Bengaluru International Airport
“Public-private partnerships – The formula for India’s success”Bengaluru International Airport is a prime example of how Siemens provides financing as well as technological solutions for future-oriented infrastructure developments. The project was launched in the early 1990s, when a public- private partnership was first proposed. G.V. Sanjay Reddy is convinced that cooperative efforts of this kind – partnerships in which governments and private companies work hand-in-hand to implement projects that benefit entire com-munities – are “the formula for India’s success.” Why? There are two reasons, Reddy explains. The first is financing: “The Indian government doesn’t have the ability to fund the huge infrastructure deficit that we have in India,” he says. “Over the next five years, the government expects that India will need around $1 trillion worth of infrastructure investment. And the public sector does not have the capability to invest that amount.” Therefore, the Indian government is relying increasingly on private investment. And the second reason why public- private partnerships are so important is that they offer major advantages for private companies: “The private sector has the ability,” says Reddy, “to benchmark to the global best practices and find the best solution.” In the case of Bengaluru International Airport, for example, that solution was Siemens.
Siemens paved the way for the public project’s private financing and also sub-sequently invested in BIAL, with Siemens Project Ventures (SPV), a business unit of Financial Services (SFS), acquiring a 40% stake in the new airport com-pany. Other investors included Larson & Toubro Ltd., India’s largest engineering and construction company, and Unique Zurich Airport, a Swiss airport operator, each of whom acquired a 17% stake. To ensure that the state would also have a say in the running of this strategically vital infrastructure project, the remain-ing 26% was split between the government of Karnataka and India’s federal government. “And this still applies today,” says G.V. Sanjay Reddy, “because under Indian law, its 26% stake gives the government a minority veto.”
BIAL has primary entrepreneurial responsibility for the entire airport. To enable
the company to recoup its investment, the Indian government has granted it long-term rights to collect airline and passenger fees.
Siemens has been active in India since
1867. Today, the Company has some
17,700 employees in the country.

13
About 12 million passengers in fiscal 2010 / 2011
Innovative infrastructure solutions
Sharply increasing passenger numbers
India’s most advanced
major airport
Left/Right – its international airport is helping make Bangalore the Gateway to South india. All key air-port data is collected in the airport’s control tower.

14
Contract signed by the Indian government and the airport operator
July 2004
Construction begun
July 2005Official opening
May 2008
Above – Countless planes take off from Bengaluru international Airport every day, linking South india with cities throughout the world.

15
New runway ready for takeoff in record timeAfter years of preparation, work on Bengaluru international Airport proceeded very quickly. Construction began 35 kilometers north of the city center in July 2005. Only 33 months later, in may 2008, the first commercial flight took off from the new runway.
Project implementation was smooth and rapid because Asia’s most advanced airport had selected a complete, customized technology solution from Siemens. For the project, Siemens fully leveraged its unique strengths as an integrated technology company. As in other major projects, we demonstrated locally the entire scope of our international expertise. For example, all sub-solutions were internally coordinated in advance. in line with the Siemens One approach, a key account management team advised the project company every step of the way.
We tackled the challenge head-on, delivering electrical systems on a turnkey basis, supplying energy for the airport buildings, installing customized iT solutions and providing suitable mobility solutions – all in record time. The service package covered everything from planning and delivery to installation and commissioning. And, as G.V. Sanjay Reddy recalls, our involvement didn’t end when the airport opened: “Siemens was very active in implementing the project from the begin-ning. The Company is solutions-oriented and views its tasks from a 360-degree perspective. That makes Siemens a strong, reliable and trustworthy partner.”
Our Company-wide Siemens One approach en-
ables us to offer complete, customized solutions –
systematically and across business areas – for
hotels, hospitals and airports, for instance. The
idea behind Siemens One is simple: at an inte-
grated technology company, the whole is greater
than the sum of its parts.
G.V. Sanjay Reddy, Managing Director of Bangalore International Airport Limited
“In Siemens, we’ve found a strong, reliable and trustworthy partner. The company’s technology
leadership – coupled with its strong focus on sustainability – has made its input into the
project invaluable.”

16
Increasing passenger numbers make expansion necessaryIn 2008, when the first flights took off from the new Bengaluru International Airport, Bangalore had about seven million inhabitants. Today, it has a popula-tion of nearly 8.5 million. And as the city has grown, so has its airport. In BIAL’s fiscal year 2010/2011, around twelve million travelers passed through the terminal – an increase of almost 12% over the year before. The original plans at the end of the 1990s were based on a figure of only 3.7 million passengers a year. An expansion is necessary, and we’re involved in this project too. The single-source infrastructure solutions for which we’re responsible include the provision of security and electrical systems – from design to commissioning.
As planned, we’re scaling back our own financial commitment in view of the airport’s successful business development. In fiscal 2012, we announced the sale of a 14% stake in BIAL to G.V. Sanjay Reddy’s GVK Power & Infrastructure Limited. However, we continue to hold a substantial 26% stake in the airport operator.
G.V. Sanjay Reddy is looking to the future. Throughout the continued expansion of Bengaluru International Airport, he intends to keep the focus on sustain-ability. “We as a company – and Siemens as well – have put a lot of emphasis on sustainability,” he notes. “For us, receiving the prestigious Golden Peacock Environment Award in 2012 is both a distinction and an incentive. It honors our joint activities in the past and sets a new benchmark for the future. We want to continue our efforts to maintain an environmental balance and minimize adverse
environmental impacts. And it’s here that Siemens is making a very valuable contribution.”
www.siemens.com/ar/proximity
www.siemens.com/ar/proximity-movie
aBove – Thanks to innovative Siemens tech-nologies, passengers can check in very quickly at Bengaluru International Airport.

17
Our intelligent infrastructure solutions are proving their value worldwide. The construction of Bengaluru International Airport is just one of many projects that have enabled us to impressively demonstrate our capabilities as an integrated technology company. In particular, our cross-Sector Key Account Management Program – as is usual in large-scale projects of this type – provides support for managers on site, from the initial planning phase to servicing and maintenance. Tapping the full extent of our knowhow, our Key Account Managers combine solutions from a wide range of Siemens Sectors and Divisions to create integrated, end-to-end solutions tailored to specific requirements – thus saving customers valuable time and ensuring outstanding customer support around the globe. We’ve bundled our extensive infrastructure portfolio in our Infrastructure & Cities Sector, which supplies integrated products, solutions and services from a single source – from mobility and logistics solutions to intelligent power distribution systems to highly efficient building technologies. Financial Services (SFS) is an international provider of financing solutions. With its financial and industry knowhow, SFS helps make infra-structure projects like Bengaluru International Airport a reality.
At the heart of our solutions for Bengaluru International Airport are our IT solutions, which network all the applications of the airport’s IT landscape and link independent IT solutions from different suppliers to create a structured, flexible whole. All participants profit from a simplified data exchange with optimized, accelerated processes.
Bengaluru International’s surveillance and alarm management systems are equipped with a Siemens danger management system, which bundles all the information provided by security and fire protection subsystems in a central control room. These subsystems include an access control system with 105 readers, an audio and voice evacuation system with 650 loudspeakers, a fire detection system with 1,800 smoke, heat and flame detectors, an intrusion protection system with 100 detectors and a video surveillance system with 60 cameras.
Single-Source infraStructure SolutionS from SiemenS
Not only do we have the necessary technologies in our portfolio; we also have decades of experience
acquired in bringing hundreds of major projects worldwide to successful completion.
Services
Building technologies
Security systems
Power supply
Financing solutions IT systems
Fire detection and alarm systems
Power distribution systems
Key account management
Siemens infrastructure solutions
Overall project management

18
To be a strong and reliable local partner to our customers worldwide – this is our aspiration. Siemens employees are working around the clock, in all the world’s time zones and on every continent to provide trailblazing products and solutions tailored to individual customer requirements. This dedication has been our formula for success for 165 years.
Active worldwide – At home around the globe
As a local supplier with a global presence, we’re a trusted partner everywhere we do business. Our ten largest Regional Companies alone employ people from some 140 different countries – experts working for the benefit of our partners, customers and shareholders worldwide.
Local commitment creates trust and lays the basis for long-term customer relationships. That’s why we’ve maintained l ocal development, procurement and manufacturing activities in many countries for decades. In addition to our more than 290 production facilities worldwide, we have office buildings, warehouses, R&D centers and sales offices in virtually every country in the world.
Over the years, we’ve captured outstanding competitive posi-tions in the industrialized countries. Now, through a wide range of measures, we want to further strengthen these posi-tions and expand our activities in the booming markets of the emerging countries.
Long-term customer relationships have been the hallmark of our business for 165 years. To support major customers, we’ve set up a Company-wide Key Account Management Program that enables us to tailor our products, solutions and services to local customer requirements and regional structures while ensuring that our Key Account Managers continuously expand and reinforce our customer relationships on a long-term basis. These managers, whose performance is measured in terms of
customer-specific growth, report to our cross-Company Market Development Boards and Vertical Market Management teams, which are focused, in turn, on the requirements of individual vertical markets. Staffed by experts from many different busi-ness units, these organizations leverage our entire port folio to provide a comprehensive range of industry-specific, single-source offerings for customers in the automobile, IT and power generation industries, for instance.
Worldwide responsibility for revenue and profit generation has been assigned to our individual operating units. This decen-tralization of business responsibility benefits customers of all sizes – particularly the small and medium-sized businesses and organizations that comprise the largest part of our customer base – by enabling us to provide locally based support every-where in the world. Our extensive international sales team, which is managed by our Regional Clusters and Regional Companies, ensures the implementation of business-specific sales strategies. For large-scale projects around the globe, direct customer support is provided via our headquarters units.
With 370,000 employees around the globe, we provide targeted and tailored
solutions to customers worldwide on a local basis – giving us a virtually
unparalleled competitive advantage.

19
As part of Siemens’ Executive Relationship Program, our 100 most important customers are personally supported by members of Siemens’ Managing Board. To determine if this program is actually meeting our customers’ expectations, we conduct annual surveys. For us, the results of these surveys are crucial since we want to strengthen our customers’ trust – everywhere in the world.
To gear our activities even more closely to the needs of our customers and markets worldwide, we’re breaking new ground with innovative projects like our new urban sustainability centers. These centers provide a common platform where our experts can work together with scientists, urban planners and city officials to develop the infrastructure solutions of tomor-row. Our first sustainability center, the Crystal, opened its doors in London in 2012. Two more centers – one in Shanghai and another in New York – are set to follow.
A strong worldwide presence coupled with the power of a global technology company – that’s what’s made us successful and the strong local partner that we are today – around the world and around the clock.
COMBINED MANAGEMENT REPORT, PAGES 63-64
SIEMENS AT A GLANCE, PAGES 6-7
www.SIEMENS.COM/wORLDwIDE
Global presence is the basis of our competitive-
ness. Active in some 190 countries, our Energy,
Healthcare, Industry and Infrastructure & Cities
Sectors occupy leading market and technology
positions worldwide.
1 Commonwealth of Independent States2 By customer location3 As of September 30, 20124 15 employees or more
222,000 employees (60% of total worldwide) 3
90 major R&D facilities (48% of total worldwide) 4119,000 employees (32% of total worldwide) 3
44 major R&D facilities (23% of total worldwide) 4
€ 39.909 billion in revenue (51% of total worldwide) 2€ 11.072 billion in revenue (14% of total worldwide) 2
€ 15.523 billion in revenue (20% of total worldwide) 2
63,000 employees (17% of total worldwide) 3
28 major R&D facilities (15% of total worldwide) 4
Asia, Australia
€ 22.864 billion in revenue (29% of total worldwide) 2
84,000 employees (23% of total worldwide) 3
Americas
therein: Germany
Europe, C.I.S.,1 Africa, Middle East
70 major R&D facilities (37% of total worldwide) 4

20

21
Trust based on ideas
“My son has new hope.”
Proximity: page 8
Ideas
Strength: page 34
Integration: page 54
Diversity: page 66
The integrated technology company
Fifteen-year-old Christian from the town of Beuren in south-west Germany has been diagnosed with cancer. In the summer of 2011, doctors discovered a tumor in his pancreas. A combina-tion of chemotherapy and radiation has given him new hope.
Our new Biograph mMR played a major role in Christian’s treat-ment. The combination of magnetic resonance imaging (MRI) and positron emission tomography (PET) technology enabled doctors at Tübingen University Hospital to observe the tumor’s shape and metabolism in detail and obtain vital information during the course of his therapy.
22
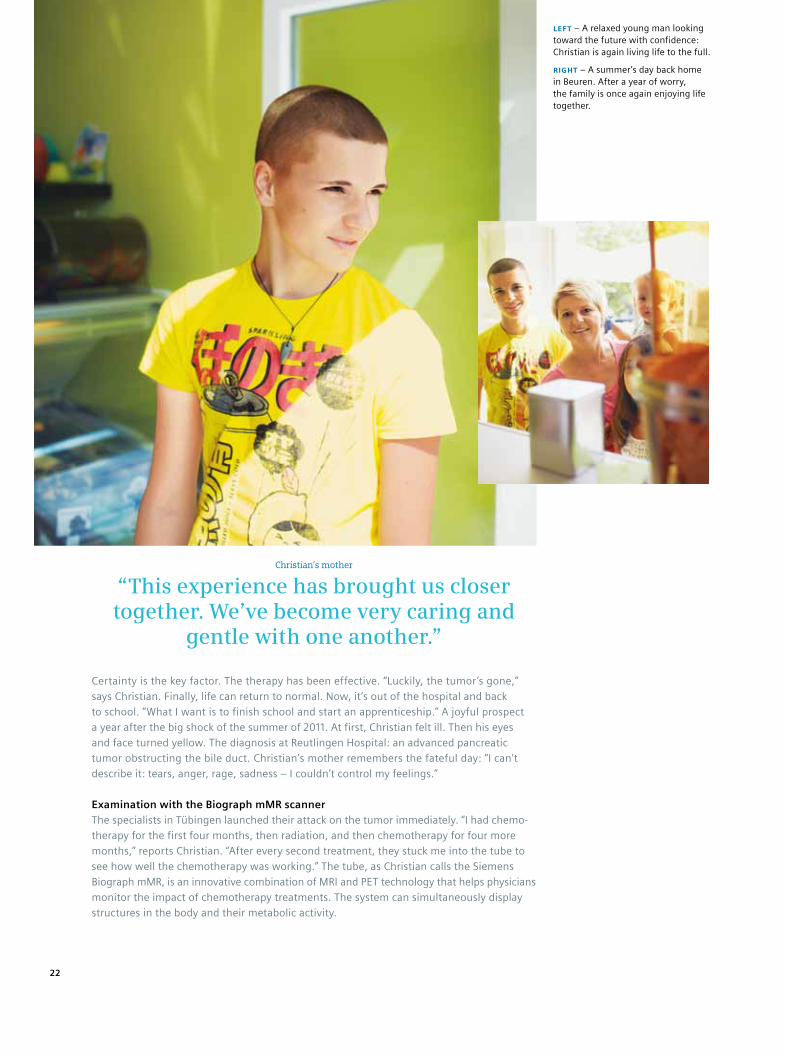
LEFT – A relaxed young man looking toward the future with confidence: Christian is again living life to the full.
RIGHT – A summer’s day back home in Beuren. After a year of worry, the family is once again enjoying life together.
Christian’s mother
“This experience has brought us closer together. We’ve become very caring and
gentle with one another.”
Certainty is the key factor. The therapy has been effective. “Luckily, the tumor’s gone,” says Christian. Finally, life can return to normal. Now, it’s out of the hospital and back to school. “What I want is to finish school and start an apprenticeship.” A joyful prospect a year after the big shock of the summer of 2011. At first, Christian felt ill. Then his eyes and face turned yellow. The diagnosis at Reutlingen Hospital: an advanced pancreatic tumor obstructing the bile duct. Christian’s mother remembers the fateful day: “I can’t describe it: tears, anger, rage, sadness – I couldn’t control my feelings.”
Examination with the Biograph mMR scannerThe specialists in Tübingen launched their attack on the tumor immediately. “I had chemo-therapy for the first four months, then radiation, and then chemotherapy for four more months,” reports Christian. “After every second treatment, they stuck me into the tube to see how well the chemotherapy was working.” The tube, as Christian calls the Siemens
Biograph mMR, is an innovative combination of MRI and PET technology that helps physicians monitor the impact of chemotherapy treatments. The system can simultaneously display structures in the body and their metabolic activity.

23
A summer’s day
SolidarityConfidence
FamilyJuly 9, 201210: 34 a. m. –– Having ice cream in Beuren

24
July 10, 20122 : 02 p.m. –– Preliminary discussion at Tübingen University Hospital
Diagnosis
Successful therapyExamination
Trust

25
The question now is: does Christian’s pancreas still contain tumor cells? And if so, how active are they? In their examinations, the Tübingen cancer specialists never lose sight of Christian’s particular situation. “Children aren’t just small versions of adults. That means we have to consider a wide range of factors when evaluating their symptoms and deter mining the length of their examinations,” says Christian’s doctor, Professor Dr. Jürgen Schäfer.
For Christian, the past year has been an anxious one, full of uncertainty. “I often wondered if the tumor was getting larger or smaller,” he says. “If it was smaller, that was good, of course, and a sign the chemo was working. That motivated me to keep fighting.” But he wasn’t going to give up anyway. After the first shock, Christian promised himself he’d stay optimistic no matter what. Fortunately, the examination results boosted his confidence. The images from the Biograph mMR showed the radiologist both how the tumor’s size had changed during treatment and how its metabolism was developing – key indicators of its activity.
Today, the young patient has a very important appointment: together with his mother and sister, he’s come to Tübingen University Hospital to find out if his cancer treatment has been effective. In his patterned hospital gown, Christian lies down on a table in the examining room before entering the Biograph mMR scanner once again.
FAR LEFT – Professor Dr. Jürgen Schäfer and Christian discuss the upcoming examination in the Siemens Biograph mMR. It will show if the tumor is still active.
LEFT – Christian with his mother and sister on the way to the exam-ination at Tübingen University Hospital.
26
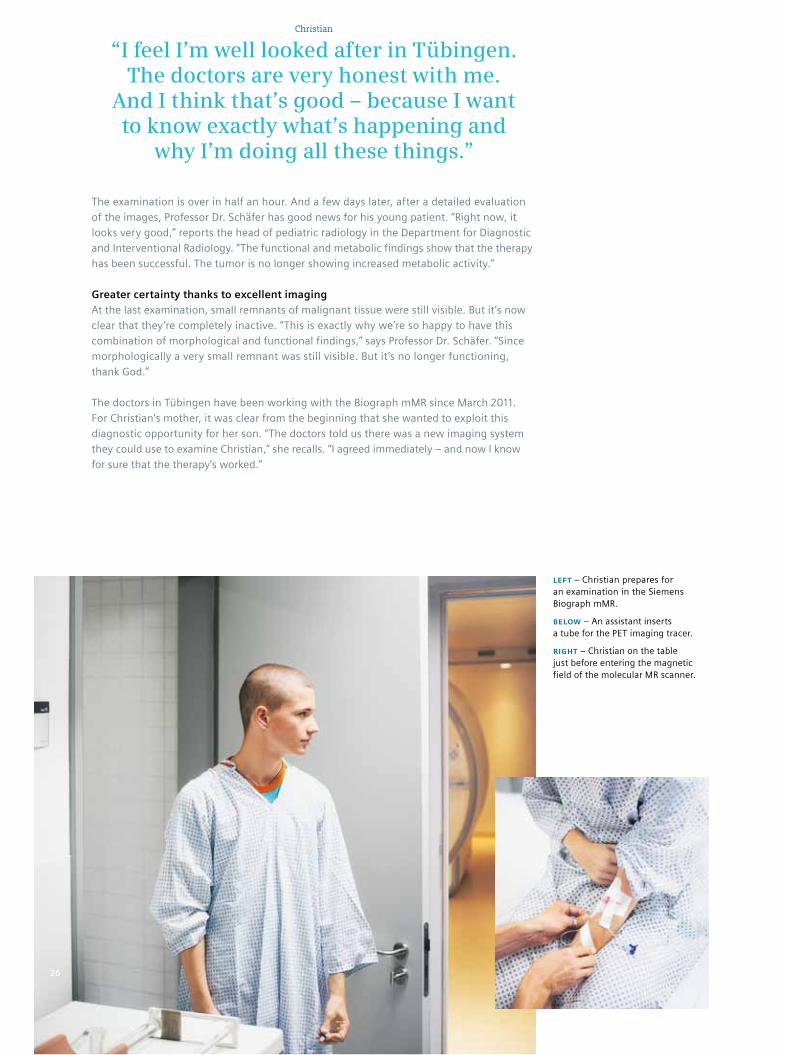
The examination is over in half an hour. And a few days later, after a detailed evaluation of the images, Professor Dr. Schäfer has good news for his young patient. “Right now, it looks very good,” reports the head of pediatric radiology in the Department for Diagnostic and Interventional Radiology. “The functional and metabolic findings show that the therapy has been successful. The tumor is no longer showing increased metabolic activity.”
Greater certainty thanks to excellent imagingAt the last examination, small remnants of malignant tissue were still visible. But it’s now clear that they’re completely inactive. “This is exactly why we’re so happy to have this combination of morphological and functional findings,” says Professor Dr. Schäfer. “Since morphologically a very small remnant was still visible. But it’s no longer functioning, thank God.”
The doctors in Tübingen have been working with the Biograph mMR since March 2011. For Christian’s mother, it was clear from the beginning that she wanted to exploit this diagnostic opportunity for her son. “The doctors told us there was a new imaging system they could use to examine Christian,” she recalls. “I agreed immediately – and now I know for sure that the therapy’s worked.”
Christian
“I feel I’m well looked after in Tübingen. The doctors are very honest with me.
And I think that’s good – because I want to know exactly what’s happening and
why I’m doing all these things.”
LEFT – Christian prepares for an examination in the Siemens Biograph mMR.
BELOW – An assistant inserts a tube for the PET imaging tracer.
RIGHT – Christian on the table just before entering the magnetic field of the molecular MR scanner.

27
July 10, 20124 : 17 p.m. –– Biograph mMR examination
Magnetic field
Contrast agent
Certainty
Monitoring

28
Professor Dr. Claus Claussen, Tübingen University Hospital
“Our cooperation with Siemens is based on enormous trust, which has grown continually
over the years.”

Professor Dr. Claussen, Tübingen University Hospital has been using the Siemens Biograph mMR since March 2011. In your experience, which appli cations is the system most suitable for?PROFEssOR DR. CLAussEn: There are currently three fields of application for the Biograph mMR. About 90 % of the applications relate to oncology, where we can identify what stage a tumor is in and monitor the course of treatment. The other fields are neurological diag-nostics – in particular, neurodegenerative disease – and metabolic changes near the heart muscle. The Biograph mMR provides simultaneous, detailed images of the changes and processes taking place in living organisms. This is a tremendous advance. The simultaneous acquisition of MR and PET offers precise morphological and functional insights into the human body and makes it possible to pinpoint even the smallest patho-logical changes – for example, in the liver, the brain and bone marrow.
How long had you been dreaming about combining MRI and PET in this way? PROFEssOR DR. CLAussEn: Computed tomography became well established in the 1970s, and ever since we’ve been dreaming of visualizing anatomical structures and forms in combination with their functions. Dynamic computed tomography, which involves injecting contrast agents, was developed in the early 1980s. This enabled us to monitor blood flow in organs and tumors. Positron emission tomography (PET) made it possi-ble to obtain images of specific metabolic activities in the body but afforded very poor spatial resolution. Results improved when CT and PET technologies were combined in PET-CT scanners. Then, about ten years ago, the enhanced contrast achieved in images of soft tissue by using MRI technology awakened hopes of further improvement – and today we have the Biograph mMR.
What is the special technical challenge of the Biograph mMR?PROFEssOR DR. CLAussEn: The strong magnetic field of the magnetic resonance imaging systems interfered with the operation of conventional PET detectors. That’s why new detectors had to be developed for use with magnetic resonance imaging systems. At our lab for preclinical imaging, Professor Dr. Bernd Pichler performed very important pre-paratory work before we and Siemens tried out and tested this new technology in a first combined MRI and PET head scanner. This example highlights how important it is for an industrial company like Siemens, which is geared to research and devel opment, to lever-age its customers’ potential and pursue open innovation through joint research projects.
Professor Dr. Claus Claussen is head of the Radiology Clinic at Tübingen University Hospital. Professor
Dr. Claussen discusses the prospects for the innovative technology below.
LEFT – Professor Dr. Claussen (left) and Professor Dr. Schäfer (right) at Tübingen University Hospital
LEFT ABOvE – Professor Dr. Claussen is head of the Radiology Clinic at Tübingen University Hospital.
RIGHT ABOvE – The images of Christian generated by the Biograph mMR show no tumor activity in the pancreas.
RIGHT – Professor Dr. Schäfer evaluates the images of Christian’s body produced by the Biograph mMR.

30
Tübingen University Hospital and Siemens have been cooperating for many years to develop innovative imaging technologies. How would you describe this partnership? PROFEssOR DR. CLAussEn: It’s based on enormous trust, which has continually grown over the years. We were one of the first university hospitals to conclude a cooperation agreement with Siemens. Since then, we’ve tested many new Siemens products. The experts were very skeptical at first about the leading-edge molecular MR process, but Siemens was convinced that the new technology would succeed, and that conviction is paying off.
Which patients profit most from the Biograph mMR?PROFEssOR DR. CLAussEn: Above all, this new system benefits children and young people since radiation exposure during imaging is substantially lower than with conventional exam methods. This is an enormous advantage since we have to monitor the effec tive-ness of medications frequently, particularly with young patients1, who are especially sensitive to radiation.
What new insights do you expect to gain for research?PROFEssOR DR. CLAussEn: It’s still too soon to foresee the full potential of this hybrid MRI and PET technology. We have new therapy options and can now determine much earlier which therapies are effective – in terms of treatment quality, this definitely represents a big step forward. But it will certainly be years before we can measure this innovation’s full impact on healthcare.
If you could make a wish, what would you want from Siemens for the next generation of diagnostic imaging systems?PROFEssOR DR. CLAussEn: Of course there are always things you can wish for – otherwise, we’d stop dreaming. The ability to visualize functional and physiological processes in living organisms is already an important advance. This was unimaginable just 20 years ago. However, we’re still just at the beginning, and that’s why I’d like the reliability of diag nostics to increase even more in the future. But the first step has already been taken. And that’s a major milestone for imaging and healthcare in general.
LEFT – The Siemens Biograph mMR is prepared for the next exam.
We’re inviting more than 100 radiologists, nuclear
medicine experts and physicists from around the
world to a meeting in December 2012 to discuss
their experiences with the Biograph mMR.
Innovative strength

31
The two imaging technologies complement one another perfectly: magnetic reso-nance imaging (MRI) provides millimeter-precise images of the body’s organs, while positron emission tomography (PET) displays, above all, the metabolic activity of cells. The Siemens Biograph mMR is the world’s first device to combine MRI and PET imag-ing in an integrated system – enabling clinicians to simultaneously capture data on organ function and metabolism as well as any changes in organs in a single scan.
For patients, this means diagnoses in less time and with less radiation exposure. Instead of having to perform several separate scans, clinicians can now acquire all images in a single process – thus shortening patient waiting times. The integration of MRI and PET technologies also reduces the amount of radiation that patients are exposed to, compared to conventional imaging technologies.
Until now, two separate devices were required for these examinations because the operation of conventional PET detectors is impaired by the strong magnetic fields gene rated by MRI scanners. Previously, the images generated had to be superimposed using special software. This second step reduced precision since patients – and thus organ positions – often shifted between scans. The Siemens Biograph mMR features new PET detectors whose operation is not disturbed by the MRI’s strong magnetic field. That’s why the innovative system can capture all data simultaneously, recording even the smallest details and functional processes. Healthcare facilities also profit from the Siemens Biograph mMR: the system streamlines processes and cuts costs for floor space and operation by eliminating the need for a second system. And that’s to the advantage of a growing number of patients around the world.
WWW.sIEmEns.COm/AR/IDEAs
WWW.sIEmEns.COm/AR/IDEAs-mOvIE
WWW.sIEmEns.COm/BIOGRAPHmmR
innovation in imaging siemens’ biograph mmr
60-centimeter-wide opening
Integrated MRI body coil
Biograph mMR Integrated PET detector
MRI gradient coil
Magnet with a field strength of three tesla
A pioneering achievement in medical imaging, the Biograph mMR combines two previously separate
technologies in a single system.
1 MR scanning has not been established as safe for imaging fetuses and infants less than two years of age. The responsible physician must evaluate the benefits of the MR examination compared to those of other imaging procedures.
The statements by Siemens’ customers described herein are based on results that were achieved in the customer’s unique setting. Since there is no “typical” hospital and many variables exist there can be no guarantee that other customers will achieve the same results.

32
For 165 years, we’ve been providing answers to the challeng-es of our day – in the areas of healthcare, energy, industry and infrastructure. Few companies have more researchers and developers working to create innovative products and solutions worldwide. In a record number of research partner-ships, our R&D employees are shaping technological progress more actively and openly than ever before.
For us, progress means placing trust in people with a pioneering spirit
Never completely satisfied, always looking for better solu-tions, taking personal responsibility for progress and blazing new trails in technology – this strategy has made us the powerhouse in electronics and electrical engineer-ing that we are today.
The latest figures confirm our power of innovation. Our R&D employees are now reporting more than twice as many inven-tions per day as in 2001. In fiscal 2012, we filed 8,900 invention reports, some 5% more than a year earlier. During the same period, we increased the number of our patent first filings by about 7% to 4,600, making us once again a leader in the world-wide patent statistics and No. 1 in Europe.
Our innovations impact many areas of life – transportation, industry and healthcare, for instance. Today, people all around the world rely on trains, metros and light-rail systems from Siemens to provide them with safe, ecofriendly transport to and from their homes and places of work. In industry, our product lifecycle management (PLM) software is making it possible to develop, simulate and test products in the virtual world and to model entire production processes before a single screw is manufactured in the real world. In hospitals, our innovative liver fibrosis test is enabling doctors to examine patients suffering from chronic liver disease without having to conduct time-consuming, potentially dangerous biopsies. And last but not least, innovations from Siemens are helping shape the future of energy.
Corporate Technology (CT), our central research department, has overall responsibility for our strategic and cross-unit research activities. More than 7,000 CT experts cooperate across team and national boundaries to ensure that we main-tain our technology leadership. Products with major profit potential on the world’s innovation-driven growth markets are developed and then incorporated into our day-to-day business operations. Our key research focuses today include electric mobility, sustainable urban development and next-generation biotechnology.
We’ve introduced a policy of open innovation. In more than 1,000 research partnerships, we’re facilitating targeted infor-mation exchange and cooperation with leading international universities and research institutes worldwide.
Technology and innovation – for us, that means securing our technological basis, helping shape the future with innovative solutions and strengthening our integrated technology com-pany. The pioneering spirit of our employees is making us strong – every day and all around the world.
combined management report, pages 98-101
siemens at a glance, pages 8-11
www.siemens.com/innovation
In fiscal 2012, we invested some €4.2 billion in research and development.

33
Patent applications: In 2011, we were No. 1 in
patent applications at the European Patent Office
and No. 3 at the German Patent and Trade Mark
Office – where we were among the most active
patent applicants. According to U.S. Patent and
Trademark Office (USPTO) statistics, as published by
the Intellectual Property Owners Association (IPO),
we were No. 10 in the U.S. in the number of
patents granted.
R&D employees: In fiscal 2012, Siemens had
roughly 29,500 R&D employees working at
some 188 locations in more than 30 countries
worldwide to create and develop new solutions
in the areas of energy, industry, infrastructure
and healthcare.
Inventions and patents: In fiscal 2012, Siemens
reported around 8,900 inventions and submit-
ted about 4,600 patent first filings – an average
of some 40 inventions and roughly 21 patents
on each of the 220 workdays in the year. These
inventions and patents were generated by all
our Sectors as well as Corporate Technology, our
central research department.
Siemens’ Environmental Portfolio: In fiscal
2012, our Environmental Portfolio, which fea-
tures a large number of innovations, gener-
ated revenue of €33.2 billion and enabled our
customers to cut their CO2 emissions by 332
million tons – an amount equal to about 41%
of the CO2 emissions generated in Germany
in 2010.
Major R&D facilities by region
in fiscal 2012
Siemens’ position in the 2011
patent statistics
No.10
European Patent Office
No.1German Patent and Trade Mark Office
No. 3U. S. Patent and
Trademark Office
8,900Invention reports
29,500R&D employees
4,600Patent first filings
Invention reports, patent first filingsand R&D employees (approximate)
in fiscal 2012
Revenue from Siemens’Environmental Portfolio
in fiscal 2012
Total Siemens revenue€78.3 billion
Revenue from Siemens’ Environmental Portfolio€33.2 billion
Americas37%
Europe, C.I.S., Middle East therein Germany (23%)
48%
Asia, Australia15%

34
Creating trust through strength
“We care deeply about the future of energy.”
Jens Hald Jensen believes the time has come to create a new energy system. Why? Because he’s convinced that the transition to a sustainable energy infrastructure can stop climate change. And because he wants to pass on to future generations a world worth living in. Jensen, a Siemens employee who’s project manager at the test center for wind turbines in the Danish town of Østerild, is working every day to make our energy supply a little bit greener – one step at a time.
Making a successful transition to a new energy system will require implementing a complex puzzle of measures. As an integrated technology company, we offer a virtually unrivaled portfolio of products and solutions spanning the entire Power Matrix. On the following pages, Jens Hald Jensen describes how he’s taking personal responsibility to help shape the future of energy. And in an interview with Dr. HansJosef Zimmer, Chief Technology Officer for our key customer EnBW Energie BadenWürttemberg AG, you’ll learn how one of Germany’s major utility companies views that future.

35
Proximity, page 8
Ideas, page 20
Strength
Networking, page 54
Diversity, page 66
The integrated technology company

36
Top – a logistical tour de force was required just to transport the siemens B75 rotor blades 320 kilo-meters from the Danish port of esbjerg to Østerild.
LefT – Clear instructions for the team: siemens engineer Jens hald Jensen (left) oversees the assembly of the wind turbine with the longest rotor blade currently in operation worldwide.
CenTer – the housing – or “nacelle” – for the gener-ating components of the siemens sWt 6.0 gearless wind turbine is 15 meters long and 6.5 meters wide.

37
“at 75 meters in length, the new rotor blades have nearly the wing-span of an airbus a380.” When Jens hald Jensen talks about his work, he makes generous use of superlatives. and today is a very fitting occasion for them: on this gorgeous august day, the siemens engineer is supervising the assembly of the world’s largest wind turbine rotor. sporting a white hardhat and neon-yellow safety vest, Jensen stands in the middle of a test center in the Danish town of Østerild, where we’re testing our latest products before they are commissioned on site. the test subjects arrived several days ago: our sWt 6.0 wind turbine, which has a capacity of six megawatts, and our B75 rotor blades, which, at 75 meters in length, are the longest blades of their kind currently in operation wordwide. and although Jens hald Jensen has worked in the wind industry ever since earning his university degree, he sees this test as the high-light of his career to date. “it’s simply incredible to stand here between these gigantic rotor blades – just look at these unbeliev-able dimensions,” exclaims the engineer from the Danish town of Brande. “it really is a technical tour de force to be able to manufac-ture something this imposing in one piece.”
More than just an impressive rotorFor decades, Jensen has dreamed of an energy infrastructure that relies more heavily on renewable sources such as wind. “the wind delivers an unbelievable amount of energy around the clock, espe-cially offshore,” says the engineer enthusiastically. “the transition to a new energy system is offering us the opportunity to help shape the future of energy – and that’s where i feel a very personal responsibility to future generations.”
it’s no wonder that Jensen is excited about combining the sWt 6.0 turbine with the B75 rotor blade: a single turbine will be able to supply green energy to 6,000 european households – emission-free and without the use of fossil fuels. and the first customers are already lining up to make large-scale use of the new technology: plans call for installing 300 sWt 6.0 turbines with a total capacity of 1,800 megawatts off the coast of the uK between 2014 and 2017.
Jens Hald Jensen, project manager at the wind turbine test center in Østerild, Denmark
“These rotor blades have a very special magic for me. I saw them while they were still on the ground,
I was there when they were raised up, and now I’m watching them rotate and produce energy –
it’s simply magical.”
transitioning to a new energy system will
require implementing diverse measures
that need to fit together like the pieces
of a puzzle. our engineers are continu-
ally developing and honing a wide variety
of solutions that promise to drive this
transition.

38
Years of offshore experienceonce the turbines and rotor blades have successfully completed the test phase, two giant cranes lift the housing for the sWt 6.0’s generating components into the air. under Jensen’s watchful eye, the housing – or the “nacelle” – is moved in slow motion to the top of the 120-meter tower. the culmination of more than 20 years of experience in offshore projects, the sWt 6.0 is remarkable not only for its output but also for its new drive technology, which is entirely gearless. such innovations have enabled our engineers to reduce the number of components by about 50%. the streamlined design facilitates maintenance while also cutting down on weight: the sWt 6.0 is by far the lightest wind turbine in its class. and this, in turn, lowers costs for the foundation and the tower – making wind energy more competitive and moving us a step closer to Jensen’s vision of a greener energy future.
BeLow – once installed, the gigantic rotor will sweep an area equivalent to two-and-a-half soccer fields. an enormous amount of space is also required for unload-ing the rotor blades and mounting them on the hub (pictured on the left).

39
Dr. Michael Süß, member of the Managing Board of Siemens AG and CEO of the Energy Sector
“The transition to a new energy system is Germany’s project of the century. It’s the right strategy, and it’s
feasible. But we still have a long way to go in order to make it happen. The greatest challenges are the
tight schedule and the required expansion of the power grid. The world is watching closely to see how
Germany tackles these challenges.”
40
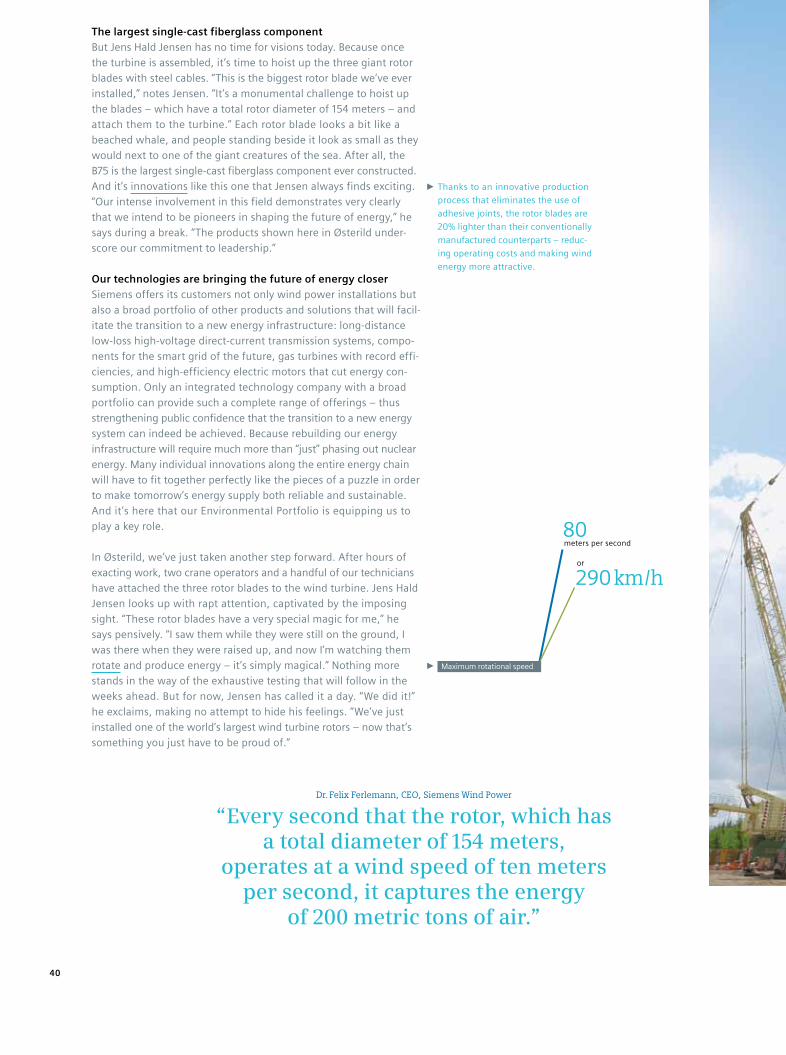
The largest single-cast fiberglass componentBut Jens hald Jensen has no time for visions today. Because once the turbine is assembled, it’s time to hoist up the three giant rotor blades with steel cables. “this is the biggest rotor blade we’ve ever installed,” notes Jensen. “it’s a monumental challenge to hoist up the blades – which have a total rotor diameter of 154 meters – and attach them to the turbine.” each rotor blade looks a bit like a beached whale, and people standing beside it look as small as they would next to one of the giant creatures of the sea. after all, the B75 is the largest single-cast fiberglass component ever constructed. and it’s innovations like this one that Jensen always finds exciting. “our intense involvement in this field demonstrates very clearly that we intend to be pioneers in shaping the future of energy,” he says during a break. “the products shown here in Østerild under-score our commitment to leadership.”
Our technologies are bringing the future of energy closersiemens offers its customers not only wind power installations but also a broad portfolio of other products and solutions that will facil-itate the transition to a new energy infrastructure: long-distance low-loss high-voltage direct-current transmission systems, compo-nents for the smart grid of the future, gas turbines with record effi-ciencies, and high-efficiency electric motors that cut energy con-sumption. only an integrated technology company with a broad portfolio can provide such a complete range of offerings – thus strengthening public confidence that the transition to a new energy system can indeed be achieved. Because rebuilding our energy infrastructure will require much more than “just” phasing out nuclear energy. Many individual innovations along the entire energy chain will have to fit together perfectly like the pieces of a puzzle in order to make tomorrow’s energy supply both reliable and sustainable. and it’s here that our environmental Portfolio is equipping us to play a key role.
in Østerild, we’ve just taken another step forward. after hours of exacting work, two crane operators and a handful of our technicians have attached the three rotor blades to the wind turbine. Jens hald Jensen looks up with rapt attention, captivated by the imposing sight. “these rotor blades have a very special magic for me,” he says pensively. “i saw them while they were still on the ground, i was there when they were raised up, and now i’m watching them rotate and produce energy – it’s simply magical.” nothing more stands in the way of the exhaustive testing that will follow in the weeks ahead. But for now, Jensen has called it a day. “We did it!” he exclaims, making no attempt to hide his feelings. “We’ve just installed one of the world’s largest wind turbine rotors – now that’s something you just have to be proud of.”
Dr. Felix Ferlemann, CEO, Siemens Wind Power
“Every second that the rotor, which has a total diameter of 154 meters,
operates at a wind speed of ten meters per second, it captures the energy
of 200 metric tons of air.”
thanks to an innovative production
process that eliminates the use of
adhesive joints, the rotor blades are
20% lighter than their conventionally
manufactured counterparts – reduc-
ing operating costs and making wind
energy more attractive.
290 km/hor
80meters per second
Maximum rotational speed
41
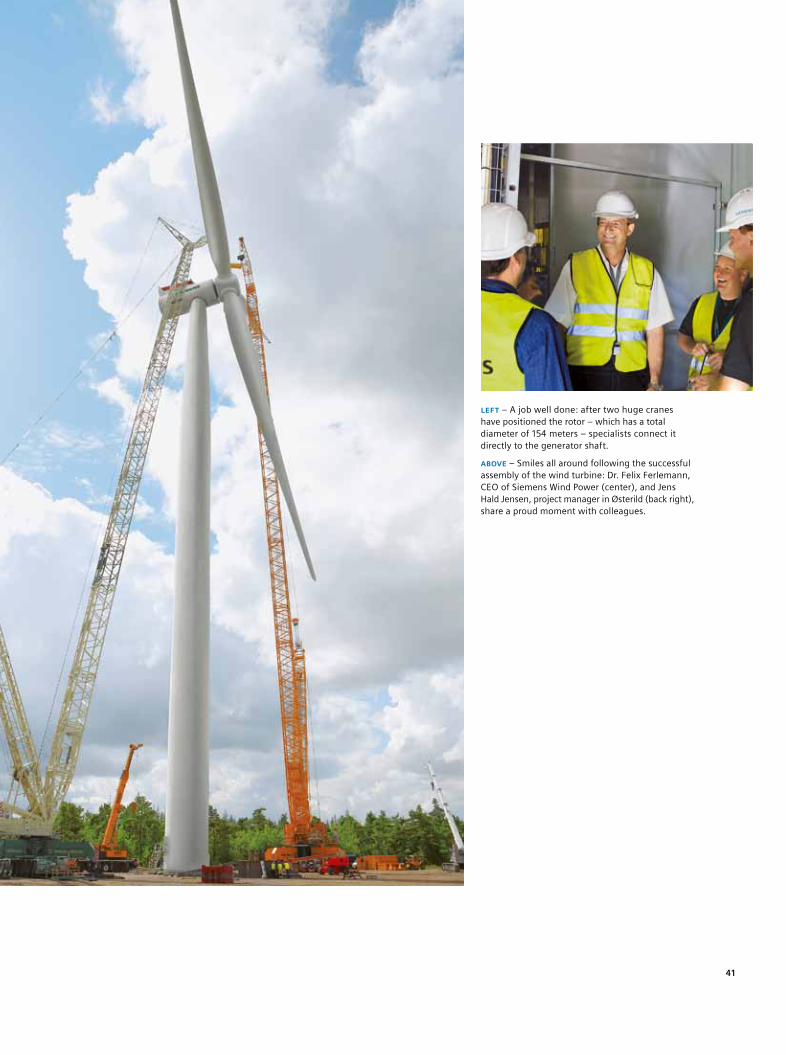
LefT – a job well done: after two huge cranes have positioned the rotor – which has a total diameter of 154 meters – specialists connect it directly to the generator shaft.
ABove – smiles all around following the successful assembly of the wind turbine: Dr. Felix Ferlemann, Ceo of siemens Wind Power (center), and Jens hald Jensen, project manager in Østerild (back right), share a proud moment with colleagues.

42
Dr. Hans-Josef Zimmer, Chief Technology Officer, EnBW
“Renewables will be a vital pillar of our future energy supply. As an energy company, we need strong,
reliable partners for the challenges ahead.”

43
Dr. Zimmer, the future of energy is currently a hot topic in Germany. What stance is EnBW taking?Dr. Zimmer: Building a new energy system is a huge challenge for Germany. And as one of the country’s largest energy companies, we’re tackling it head-on. In terms of our strategy, this means we’re continuing to safeguard our position as a low-carbon energy producer. In addition to supplying power from highly efficient conventional plants, we intend to double the amount of power we generate from renewable energies by 2020. We already have a relatively large share of hydropower-based renewables in our portfolio. By 2020, we want to further expand our installed capacity from renewables by about 3,000 megawatts.
One step in this direction is certainly the EnBW Baltic 1 wind farm, Germany’s first commercial offshore wind installation. Your company partnered with us on its construction in 2011. How did the idea for this project develop, and what conclusions have you drawn from the operation of the wind farm?Dr. Zimmer: We on EnBW’s executive board decided in fiscal 2007/2008 that we wanted to invest more heavily in renewable energies. Complementing our traditionally strong involvement in hydropower, we’ve defined wind energy as a further focus. Following extensive analyses, we concluded that wind turbines and wind farms, both onshore and offshore, could be particularly profitable. That’s why in 2008 we bought four licenses for offshore instal-lations – two in the Baltic Sea and two in the North Sea – and now we’re in the process of developing these projects. The EnBW Baltic 1 wind farm has 21 wind turbines from Siemens and a total capacity of up to 48.3 megawatts. We’re very satisfied with its current performance. Availability is very good, and we achieved quite gratifying overall results the first year.
How’s the partnership with Siemens worked out?Dr. Zimmer: When planning and implementing projects of this magnitude, we need reliable partners who keep their promises. Since the very beginning of the EnBW Baltic 1 project, the cooperation with our colleagues at Siemens has been characterized by great trust. And this trust is also based on our experi-ence in other major projects on which we have partnered.
EnBW Baltic 1 is quite far from your home region in southwestern Germany. How is the electricity generated there distributed through-out the country?Dr. Zimmer: Our wind farm in the Baltic feeds directly into the 50-hertz grid. From there, the energy is further distributed within Germany via an extensive interconnected grid. If we build more wind farms on the coast and offshore, where there’s lots of wind, we’ll have to transport large amounts of energy to the southern part of the country. By 2030, offshore wind farms operating off Germany’s coasts are expected to be supplying 25,000 megawatts of elec-tricity. That’s why we’ll also need low-loss high-voltage direct-current (HVDC) transmission in the future. The grid development plan prepared by our
“Building a new energy system is a huge challenge.”
Providing energy for the future will require innovative solutions and strong partnerships. Siemens and the energy company Energie Baden-Württemberg AG (EnBW) have been
cooperating closely for years. Dr. Hans-Josef Zimmer, Chief Technology Officer of EnBW, talks about the steps
that must be taken to usher in a new energy era.
With revenue of more than €18 billion
in 2011 and some 20,000 employees,
enBW is one of the largest energy
companies in germany and in europe.
Dr. hans-Josef Zimmer (54), Chief
technology officer of enBW, is a
mechanical engineer who has been
employed at enBW for 23 years. he’s
installed a solar-thermal system at
his own home to provide heat and
hot water. Zimmer was also one
of enBW’s first customers to opt for
a smart electricity meter – which
quickly showed him that power con-
sumption can be slashed by switch-
ing devices off rather than operating
them in standby mode.

44
subsidiary Transnet BW and three other grid operators foresees HVDC trans-mission lines along several corridors. However, I’m assuming the approval process will take a very long time. There are also technical challenges to be mastered – because, even though HVDC lines have already been installed in countries like China and India, that doesn’t mean such routes can be planned and implemented overnight in Germany. On the contrary, the process will take several years. But we must address this challenge if we want to succeed in restructuring the energy system.
In our view, highly efficient power plants like our combined cycle plants are another factor that can facilitate the transition to a new energy infrastructure: Stadtwerke Düsseldorf, a municipal utility in which EnBW holds a majority stake, plans to build just such a plant at the Lausward site in Düsseldorf. As with the EnBW Baltic 1 and 2 projects, Siemens will be the supplier. What criteria played a role in your investment decision? Dr. Zimmer: Combined cycle power plants of the type supplied by Siemens are highly efficient systems that generate low-carbon power. They have fast-start capability and are highly flexible in terms of startup and shutdown – which makes them particularly suitable for an energy market moving toward fluctuating renewable energies. Of course, in addition to boasting high effi-ciency and rapid startup, every new plant must also be economically viable.
Another concern is reducing energy consumption, in other words, saving electricity. What can an energy company like EnBW contribute here?Dr. Zimmer: A couple years ago, our slogan was “Empowered to cut consump-tion.“ Now you could, of course, say that a utility company should be happy if its customers use lots of energy. But quite the opposite is true: we want to help our customers conserve energy and boost energy efficiency. For years, we’ve been offering tailored solutions that make our customers’ operations more energy-efficient. One thing is clear to us: at EnBW, we can be compet-itive only if we provide our industry customers with energy that is so afford-able that they can keep their production in Germany.
Smart grids are one option for flattening consumption peaks. To what extent is EnBW involved here? Dr. Zimmer: We’ve been testing smart grids in trial communities for several years now. We’re also analyzing how our customers can benefit from intelli-gent electricity meters. We want to help our private, business and industry customers consume less energy. For example, appliances and equipment that require a lot of energy should be operated at night, when electricity is less expensive, rather during the day, when demand is high.
That sounds like a business field with lots of potential for EnBW. How can Siemens provide support here?Dr. Zimmer: Siemens is a technology leader in many fields. Since the entire development process for the production, distribution and consumption of energy is extremely complex, system providers like Siemens have major market opportunities.
In your view, what factors are most crucial for the successful transition to a new energy system? Dr. Zimmer: We need a wide range of technical solutions to make the new system a success. In addition, a very stable legal framework for marketing renewables must be in place. We also need to expand the grid so that energy from the generation centers, which in the future will be in northern Germany, can be transported to the consumption centers in the south. We’ll need a greater number of highly flexible power plants, such as the combined cycle plants I’ve already mentioned. In addition – and this is very important –
ABove – enBW has commissioned germany’s first commercial offshore wind farm, the enBW Baltic 1 project, using wind turbines from siemens. Comprising 21 turbines with a total capacity of 48.3 megawatts, the instal-lation is located in the Baltic sea, about 16 kilometers north of the german town of Zingst on the Darß peninsula.

45
we’ll need a public consensus to implement all of these things. Grid expan-sion will entail installing hundreds of kilometers of transmission lines all across Germany. And the construction of additional pumped-storage hydropower plants to store energy temporarily will also have an impact on the environ-ment. We have to convince people and make it clear that the transition to a new energy system cannot be accomplished from one day to the next but will require a great deal of patience, money and effort.
In which of these fields do you anticipate major advances?Dr. Zimmer: We need highly efficient plants, but it will take time to develop them. After all, Siemens didn’t develop its high-efficiency combined cycle plants overnight. And we’ll also need time to install HVDC transmission lines and smart grids throughout Germany. Until that happens, coal-fired plants will also be a component of the evolving energy system. While such power plants will still be necessary as a backup for many decades to come, they’ll be more efficient than before, delivering the same output while consuming much less fuel.
Now you’ve brought up the topic of the energy mix. How will the energy mix at EnBW look ten years from now? Dr. Zimmer: While EnBW will also still be operating conventional plants in ten years, we intend – compared to today – to double the share of renewables by 2020, expanding their capacity by about 3,000 megawatts. Renewable energy sources include offshore wind, onshore wind, photovoltaics, biogas and water. To obtain an economically viable mix, all types of renewable energies will have to be combined. That’s how the restructuring of the energy system will succeed.
What do you expect of Siemens in this context?Dr. Zimmer: We expect that Siemens will always be at the cutting edge of tech-nology and that we can count on Siemens as a technology leader who provides us with efficient solutions – solutions that make sense from both an eco-nomic and an environmental perspective. We value Siemens’ power of inno-vation. And we value the trust that we have in Siemens, which has evolved over many decades, just like the plants that we built together and are suc-cessfully operating today. We expect Siemens to continue pursuing this strat-egy and to offer us the best solutions on the market. And we at EnBW wish Siemens every success in this endeavor.
www.siemens.Com/Ar/sTrengTh
www.siemens.Com/Ar/sTrengTh-movie
LefT – Plans are far advanced for the con-struction of the world’s most efficient natural gas power plant – an order placed by stadt-werke Düsseldorf, a municipal utility in which enBW holds a majority stake. here enBW Chief technology officer hans-Josef Zimmer examines up-to-date project planning infor-mation from siemens. the plant is expected to begin supplying ecofriendly electricity and district heating in 2016.

49
strangford, ireLand
Northern Ireland’s Strangford Lough is home to the world’s first commercial tidal current power plant. Since November 2008, two turbines have been producing a combined output of 1.2 megawatts – enough electricity to meet the needs of 1,500 households. To date, the installation has fed more than five gigawatthours of electrical energy into the grid, making it the world’s largest tidal turbine project. Further tidal farms are now in the planning phase: the eightmegawatt Kyle Rhea project in Scotland and the tenmegawatt Anglesey Skerries project in Wales.
Making renewables competitive
düsseLdorf, germany
We’re building a recordbreaking combined cycle power plant in Düsseldorf, Germany. Boasting an electrical output of 595 megawatts, the facility will set a new world record for a single power plant in combined cycle operation. With a net efficiency of more than 61%, it will also surpass the previous world record of 60.75%. And the plant will set a third record as well: never before has it been possible to extract 300 megawatts of thermal energy from a single combined cycle plant for use in a district heating system.
Boosting the efficiency of conventional power plants
Combined cycle power plant85%
Electrical efficiency >61%
595 MW
Tidal current power plant
Electricity for 1,500 households
Two 600-kW turbines
In operation since 2008
Overall natural gas fuel utilization rate of
Electrical output of
46
The fuTure of energy – A complex puzzle of meAsures
Renewables
Power superhighwaysEfficient energy use
Financing
€
Security of supply
24 / 365hours / days
Demand management Energy storage
H2
Smart grids
Conventional power plants

50
aLfonsine, itaLy
Italy’s most advanced brickmaking plant, located in the town of Alfonsine, showcases the potential of energyefficient technologies. Thanks to our highly efficient asynchronous motors, the amount of power consumed by the factory’s electric drives – 170 motors with a total capacity of 1,065 kilowatts are in operation on the drying line alone – has been slashed by 500,000 kilowatthours. Investment costs were amortized within a short time. The result? Not only have costs been cut; the plant’s environmental footprint has also been reduced.
Saving electricity and using it more efficiently
irving, texas, u.s.
With more than 1,000 stores in North America, Michaels is the largest supplier of arts and crafts merchandise in the U.S. Energy is the company’s secondhighest lineitem expense, after labor costs. With this in mind, Michaels has equipped nearly all its stores with our RCS energy management platform. Intelligent sensors and software operate on a realtime basis to monitor and regulate heating, cooling, lighting and humidity – resulting in energy savings of some 25%.
Balancing supply and demand
hunterston / connah’s Quay, united Kingdom
We’re building the first submarine directcurrent grid connection in the Irish Sea. With a voltage of 600 kilovolts, this link will surpass the previous record of 500 kilovolts. The lowloss highvoltage directcurrent (HVDC) transmission system will connect Hunterston, near Glasgow on Scotland’s western coast, with Connah’s Quay, in northwestern England. The link, which will have a capacity of 2,200 megawatts, is scheduled to go into operation at the end of 2015.
Building low-loss power superhighways
Siemens RCS
Energy management for retailers
Option: adjust consumption to changing market prices
Perceived improvement of indoor climate
Electricity bills cut by 15% - 30%
Electric motors for a brick factory 500,000 kWh in annual savings
Cost amortization after only six months
Connected load of approximately
5,000 kW
Efficiency class I E2
Western link HVDC connection
47
Ensuring a reliable power supply
The foremost aim of all the measures that are bringing about sustainable change in the energy system must be to ensure the reliable availability of energy – at all times and at prices that are affordable for all. Blackouts must be avoided, and the international competitiveness of industry must not be endangered by excessive energy costs. That’s why the various measures comprising the pieces of the energy puzzle require careful planning and implementation. Only if these measures find broad public acceptance and fit together perfectly will the restructuring of the energy system be a success and the solutions deployed succeed on international markets.
Boosting the efficiency of conventional power plants
When the wind subsides or clouds cover the sun, fluctuations in power output must be offset fast – for example, by using combined cycle power plants. In less than 30 minutes, such plants can be generating enough power for a city the size of Berlin. As the world’s most efficient model – from Siemens – shows, combined cycle plants can reach an efficiency of almost 61% when converting natural gas into electricity, and waste heat can be used for heating. In many countries, coal will remain a key pillar of power generation for years to come. Coalfired plants can also be made much cleaner and more efficient. What’s more, CO2 can be separated from waste gas, stored underground or used for industrial purposes. Researchers are working on converting CO2 into methane and the raw materials needed to produce biofuels and bioplastics.
Balancing supply and demand
Often, it doesn’t matter if the power for a refrigerated warehouse or an air conditioning system is shut off briefly – just as it’s hardly noticeable if an elevator is moving a little more slowly than usual. These are just a few of the many possibilities for cutting energy consumption. Such demand management eases the burden on power grids. Our researchers are now developing building auto mation systems that adapt energy consumption to price fluctuations in real time, flattening demand peaks.
Offering intelligent financing solutions
If companies, towns and cities are to cut their energy consumption even when budgets are tight, they’ll need intelligent financing solutions. One proven approach is our energysaving performance contracting – a combination of consulting, installation and financing services. Customers are not required to make any upfront investment; project costs are amortized with the energy savings achieved. Using this model, we’ve upgraded more than 4,500 facilities worldwide – generating savings of roughly €1 billion.
Developing and expanding energy storage facilities
When the weather changes, so does the output of wind and solar installations. That’s why facilities that can store excess energy for hours or even weeks are indispensable. One promising technology is electrolysis, which uses surplus energy to produce hydrogen, an energy carrier that can be fed into the natural gas grid, stored in subterranean caverns, reconverted into electricity and used in industrial processes or fuelcell vehicles. Batteries in buildings and electric cars can also act as intermediate energy storage devices. We’re conducting research in all these fields.
Smart grids: Making power grids more intelligent
Fifteen years ago, there were only a few hundred energy producers in Germany. In the future, there will be thousands, generating power from solar, wind and biomass installations and residential cogeneration units. Energy consumers are increasingly becoming producers too – “prosumers.” This development, coupled with the growing use of fluctuating renewables, is making smart grids indispensable. Using sensors, variable network components and selforgan izing software modules, smart grids maintain a balance between production and consumption. We’re testing these grids in Germany’s Allgäu region, where private producers are generating over three times as much electricity as they use.
Making renewables competitive
If half of Germany’s energy is to come from renewable sources by 2030 (and some 80% by 2050), then these must be competitive without being subsidized. For wind power in particular, this goal will soon be reality. We’re currently pushing innovations that are expected to make electricity from wind power as economical as energy from coal. Our innovations range from scimitarshaped rotor blades and gearless turbines to adaptive software that optimally adjusts wind loads, automated production processes and the longest rotor blades currently in operation worldwide for the most efficient offshore wind turbines on the market.
Saving electricity and using it more efficiently
The cleanest energy is always the energy that’s not used. Industry offers considerable potential for savings. Electric motors – for pumps and drives, for example – account for nearly twothirds of industrial power consumption. Our energysaving motors and intelligent controls slash power consumption by up to 60% and pay for themselves in under two years. In the area of transportation, electric motors – in buses, trains and cars – are about three times as efficient as combustion engines. In buildings, which consume 40% of the power required worldwide, substantial savings can be achieved by using insulation, heat pumps, intelligent building technologies and efficient lighting systems. Household appliances also harbor huge savings potential. Today’s advanced models use less than half the power needed by their predecessors in the 1990s.
Building low-loss power superhighways
Renewable resources, like wind on the high seas and sun in warm regions, are best harvested where they’re most abundant. And that’s why longdistance transmission networks must be expanded – across national borders and via underground cables and highly efficient power superhighways based on highvoltage directcurrent (HVDC) transmission technology. An HVDC line we installed in China is showing how a link based on this technology can transport 5,000 megawatts – the output of five large power plants – across a distance of 1,400 kilometers with a loss of only about 5%. With conventional alternatingcurrent power lines, losses would be two to three times higher. And HVDC transmission technology can also be used offshore: an HVDC link is now transporting green electricity from the Spanish mainland to Mallorca.

48
We’re convinced that the transition to a new energy system will succeed. It will unleash a wave of innovation and create an exemplary energy infrastructure. Our technologies are making it possible to increase the share of renewables in the energy mix and slash greenhouse gas emissions. To make the transition a success, a variety of measures will have to be implemented – measures that fit together like the pieces of a puzzle. Here are some examples of how our technologies are already shaping the future of energy.
www.siemens.com/future-of-energy
our soluTions – shAping The fuTure of energy
Laufenburg, switzerLand
Our selflearning software system is stabilizing the power grid operated by Swissgrid in Laufenburg, Switzerland. The program can forecast the electrical output of renewable energy sources over a 72hour period with more than 90% accuracy. This information helps grid operators calculate power demand in their networks and achieve the greatest possible precision when determining the amount of additional electricity to be ordered in advance.
Ensuring a reliable power supply
24 / 365hours / days
munich, germany
We’ve partnered with Stadtwerke München, Munich’s municipal utility, to develop and implement a socalled virtual power plant in which a number of smallscale, decentralized power generation installations are networked and operated as a single system. In the first stage, cogeneration plants with a total output of eight megawatts were virtually combined with renewableenergy generating units with a capacity of 12 megawatts. The main aim of the virtual power plant is to improve the reliability of planning and forecasting for the decentralized power generation systems in the area served by Stadtwerke München. Operation is more efficient and economical than when the individual units are deployed separately. What’s more, the virtual power plant can serve as a key element of a smart grid, maximizing the benefits for both the operators of the decentralized energy installations and the power suppliers. The core component of this virtual interconnection is our Decentralized Energy Management System (DEMS), which is enabling the Munich utility not only to optimize the deployment and operation of decentralized power generation facilities and power loads but also to create value through enhanced marketing scope.
Grid forecast software
~90% predictive accuracy over a 72hour period
~€ 200,000 in annual savings
Better forecasts for electricity production
Smart grids: Making power grids more intelligent
Virtual power plant 5 hydropower plants
1 wind turbine assembly
Can be virtually expanded at any time
Current capacity 20 MW
6 cogeneration modules

49
strangford, ireLand
Northern Ireland’s Strangford Lough is home to the world’s first commercial tidal current power plant. Since November 2008, two turbines have been producing a combined output of 1.2 megawatts – enough electricity to meet the needs of 1,500 households. To date, the installation has fed more than five gigawatthours of electrical energy into the grid, making it the world’s largest tidal turbine project. Further tidal farms are now in the planning phase: the eightmegawatt Kyle Rhea project in Scotland and the tenmegawatt Anglesey Skerries project in Wales.
Making renewables competitive
düsseLdorf, germany
We’re building a recordbreaking combined cycle power plant in Düsseldorf, Germany. Boasting an electrical output of 595 megawatts, the facility will set a new world record for a single power plant in combined cycle operation. With a net efficiency of more than 61%, it will also surpass the previous world record of 60.75%. And the plant will set a third record as well: never before has it been possible to extract 300 megawatts of thermal energy from a single combined cycle plant for use in a district heating system.
Boosting the efficiency of conventional power plants
Combined cycle power plant85%
Electrical efficiency >61%
595 MW
Tidal current power plant
Electricity for 1,500 households
Two 600-kW turbines
In operation since 2008
Overall natural gas fuel utilization rate of
Electrical output of

50
aLfonsine, itaLy
Italy’s most advanced brickmaking plant, located in the town of Alfonsine, showcases the potential of energyefficient technologies. Thanks to our highly efficient asynchronous motors, the amount of power consumed by the factory’s electric drives – 170 motors with a total capacity of 1,065 kilowatts are in operation on the drying line alone – has been slashed by 500,000 kilowatthours. Investment costs were amortized within a short time. The result? Not only have costs been cut; the plant’s environmental footprint has also been reduced.
Saving electricity and using it more efficiently
irving, texas, u.s.
With more than 1,000 stores in North America, Michaels is the largest supplier of arts and crafts merchandise in the U.S. Energy is the company’s secondhighest lineitem expense, after labor costs. With this in mind, Michaels has equipped nearly all its stores with our RCS energy management platform. Intelligent sensors and software operate on a realtime basis to monitor and regulate heating, cooling, lighting and humidity – resulting in energy savings of some 25%.
Balancing supply and demand
hunterston / connah’s Quay, united Kingdom
We’re building the first submarine directcurrent grid connection in the Irish Sea. With a voltage of 600 kilovolts, this link will surpass the previous record of 500 kilovolts. The lowloss highvoltage directcurrent (HVDC) transmission system will connect Hunterston, near Glasgow on Scotland’s western coast, with Connah’s Quay, in northwestern England. The link, which will have a capacity of 2,200 megawatts, is scheduled to go into operation at the end of 2015.
Building low-loss power superhighways
Siemens RCS
Energy management for retailers
Option: adjust consumption to changing market prices
Perceived improvement of indoor climate
Electricity bills cut by 15% - 30%
Electric motors for a brick factory 500,000 kWh in annual savings
Cost amortization after only six months
Connected load of approximately
5,000 kW
Efficiency class I E2
Western link HVDC connection

51
veLLinge, sweden
The town of Vellinge, in southern Sweden, has implemented a selffinancing energy modernization project for its municipal properties. Thanks to our advanced building technology systems, energy consumption and costs for the town’s administrative buildings, schools, retirement homes and public swimming pools have been slashed. Under our energysaving performance contracting model, we covered all upfront costs. The community of Vellinge will pay for the modernization through contractually guaranteed energy cost savings within the next few years.
Offering intelligent financing solutions
€
erLangen, germany
It’s a promising solution for storing electricity generated by wind and solar power: electrolysis is used to split water into oxygen and hydrogen. The hydrogen is then stored and later used to power vehicles and turbines or for applications in industrial processes. A test unit with a peak power rating of 0.3 megawatts produces two to six kilograms of hydrogen an hour. When electricity from renewable sources is used for electrolysis, hydrogen production is virtually climateneutral. The next generation of electrolyzers, which will have a rated power of two megawatts, is expected to be ready for use in the medium term. Researchers are aiming to develop an electrolyzer that has up to a tripledigitmegawatt maximum power rating and can accommodate the surplus energy generated by a large wind farm.
Developing and expanding energy storage facilities
H2
Electrolyzers
Hydrogen as storage medium
Technology under development
Storing wind and solar power in the form of hydrogen
For example, using hydrogen to power fuelcell vehicles
Western link HVDC connection
Length 420 kmVoltage 600 kV
Output 2,200 MW
Project completion 2015
Energy performance contracting
Energy savings of
6,300 MWh / year
Selffinancing energysaving performance contract
2012 European Energy Service Award
CO2 emissions cut by
1,000 tons / year

52
The world is being transformed: the parameters of daily life and economic activity are changing faster than ever before. This development is providing us with tremendous opportuni-ties to continually improve our position in growth markets worldwide. Intensive portfolio management is enabling our innovation-driven Company to identify new business fields early on and capture leading market positions.
A strong portfolio – Geared to tomorrow’s growth markets
We can generate sustainable growth only if we focus on attractive future markets. That’s why we practice inten-sive, systematic portfolio management.
All our business activities have the same ambitious goal: we want to capture a No. 1 or No. 2 position in all our markets – be-cause that’s the only way to generate profitable growth and increase our Company’s value in the long term. A look at our past confirms that we’ve always been particularly successful when we’ve been a market and technology leader.
And we want our pioneering achievements to continue driving our business success in the future. With this in mind, we’re continually adapting our portfolio to major global trends through both organic growth and acquisitions, for which we apply strict criteria. Our policy of intensive portfolio manage-ment is enabling us to move into attractive future markets quickly and capture leading competitive positions.
In the IT field for example, we’re already one of the largest software companies in Europe – a position we’re steadily expanding through targeted acquisitions. In 2012, for instance, we acquired RuggedCom Inc. of Canada, a leading supplier of communications and network solutions for industry. This acquisition is strengthening our position in the areas of industrial Ethernet and industrial routers and switches.
Over the last few years, we’ve introduced a large number of energy- efficient, low-carbon solutions that enable customers to slash their CO2 emissions and, by reducing their energy costs, increase their competitiveness.
These solutions are part of our Environmental Portfolio which, like our activities in the IT field, is one of our strategic growth drivers. In fiscal 2012, we generated revenue of €33.2 billion with Portfolio offerings, an amount equal to around 42% of our total sales. Here, too, we’ve set ambitious targets: we want to achieve revenue of €40.0 billion with our green technologies by the end of fiscal 2014. And this target remains unchanged, although our planned disposals of OSRAM, our Water Tech-nologies Business Unit and our solar business will make its achievement considerably more challenging. We’re already one of the world’s largest suppliers of ecofriendly technologies. By rigorously pushing the development of these technologies, we’re making a major contribution to sustainable climate and environmental protection while ensuring our long-term
Our future-oriented portfolio strategy is strengthening our
Company’s profile and sharpening our focus on innovation-driven
growth markets.

53
business success. Our commitment to sustainable develop-ment is also being recognized by external observers: at the end of fiscal 2012, Siemens was named Supersector Leader in the Industrial Goods and Services category of the Dow Jones Sustainable Index (DJSI) for the first time. We also won the top spot for sustainability in the Diversified Industrials category.
As a technology leader, we’re helping shape the future of energy. The conventional energy chain – comprising the gen-eration, conversion, distribution and effective use of power – is evolving into a multi-layered system with many new par-ticipants. Power generation is becoming more decen tralized, with energy increasingly coming from renewable sources. At the same time, more power is being used by new consumers, for example, in the area of electric mobility. Our portfolio of-fers innovative and sustainable solutions for key areas of this new Power Matrix – solutions that will be vital to a successful transition to a new energy system.
IT, our Environmental Portfolio, our contribution to the future of energy: these are just three examples of how we’re actively gearing our portfolio to attractive growth markets while equip-ping our Company for market leadership and sustainable growth.
Combined management RepoRt, pages 63-64
www.siemens.Com/poRtfolio
The businesses and markets associated with the
energy system are a key focus of our portfolio management activities. Looking to the future,
the role of decentralized power generation will
continue to grow – as will the complexity of the
power grid. The linear energy chain is currently
evolving into a many-layered system with a large
number of new participants – we call it the
Power Matrix. This transformation is opening up
huge new market opportunities for us. With our
innovative products and solutions, we’re already
supplying key elements of the Power Matrix.
Centralized power generation from renew-able and fossil sources
Decentralized power generation from renew-able and fossil sources
Power trans mission and distribution
ProsumersStorage
>–
>–
>–
>–
>–
>–
>–
>–
>
>–
>–
>–
>–
>–
>–
>–
>–
>–
>–
>–
>–
>–
>–
>–
>–
>–
>
>–>–>–>–>–>–>–>–>
>–
>–
>–
>–
>
<–
>–
<–
>–
<
>–
>–
>–
>–
>–
>–
>–
>–
>
<–
>–
<–
>–
<–
>–
<–
>–
<–
>–
<–
>–
<–
>–
<–
>–
<–
>
>–>–>–>–>–>–>–>–> >
>–
>–
>–
>–
>–
>–
>–
>–
>–
>–
>–
>–
>–
>–
>–
>–
>–
>
>–
>–
>–
>–
>–
>–
>–
>–
>
>–
>–
>–
>–
>–
>–
>–
>–
>
Power consumption
<–
>–
<–
>–
<–
>–
<–
>–
<–
>–
<–
>–
<–
>–
<–
>–
<–
>
Fossil resources
Oil
Coal
Natural gas
Steam power plants
Combined cycle power plants
Hydropower
Pumped storage power plants
Hydrogen storage
Solar-thermal
Offshore technology
Battery storage
Power transmission
Photovoltaics
Gas turbine power plants
Biomass
Electric mobility
Trade and manufacturing
Micro wind power
Small-scale photovoltaics
Power distribution
Micro hydropower
Onshore wind power
Industry
Trade and commerce
Residential

54
Creating trust through networking
Everyone’s a winner
Downtime is every manufacturer’s nightmare – particularly when delivery schedules are tight. To minimize it, we’ve joined forces with customers to develop ePS Network Services – an IT-supported service offering that maximizes transparency in manufacturing processes and creates added value. With ePS, everyone’s a winner – as the network linking a German manufacturer of highly specialized machine tools with its Dutch partners illustrates. In the following report, Johannes Zuckschwerdt and Ton de Bruine talk about their experience with ePS.

55
Proximity, page 8
Diversity, page 66
ideas, page 20
strength, page 34
Networkingthe integrated technology company

56
No problems overnight Checking his machines first thing in the morning, Johannes Zuckschwerdt finds everything running smoothly: no error reports in the last few hours. Zuckschwerdt is responsible for developing new services at the medium-sized company schwäbische werkzeug maschinen (sw). headquartered in south-western germany, sw specializes in producing top-quality multi-spindle machining centers and manufacturing systems – primarily for customers in the automobile, hydraulics and aviation industries. specially designed for series production, these machining centers and manufacturing systems enable custom-ers to process, for example, the cast parts from which components like the high-precision hydraulic valve blocks installed in virtually all of today’s cars world-wide are manufactured. around-the-clock operation with minimal downtime is vital for optimal large-scale production.
availability and world-class service are the key factors in sw’s success. wher-ever the machines are – in Mexico, Brazil or China – Zuckschwerdt and his colleagues can monitor their operation precisely – thanks to siemens’ remote ePs network services, which permanently link sw’s machines to their develop-ers in germany via an encrypted internet connection. experts can now work proactively. “we can see early on when a part needs changing,” says Peter siegel, initiator of online services at sw. the company ’s specialists access the machines’ centrally-stored status information, initiate analyses and isolate problems online to forestall expensive failures. and this is just one side of the coin: sw also uses the collected data to help customers run their machines more efficiently.
ten years ago, siegel was searching for ways to expand sw’s services, improve customer support and intensify customer loyalty worldwide. then, in 2002, he met Jochen heinz from siemens. heinz had the solution siegel was looking for. “siemens’ ePs network services were market-ready at that point,” heinz explains. “we’ve continued developing them with partners like sw ever since.”
headquartered in southwestern germany,
schwäbische werkzeugmaschinen has around
300 employees and produces highly specialized
machine tools for customers in europe and
around the world.
Collecting and analyzing machine data enables users to enhance
machine productivity.
Lifecycle management
Scheduled maintenance– optimizes maintenance processes– schedules preventive and status-oriented
maintenance procedures– reduces machine failures– increases machine uptime– improves capacity utilization– prevents costly unplanned repairs
around-the-clock monitoring – lays the basis for reliable production
processes– detects faults early on and prevents
machine downtime– systematically manages improvements
diagnoStic ServiceS– optimize capacity utilization– accelerate fault processing– enable in-depth error diagnoses

57
Quickly spotting a chance to move to the forefront of it-supported services, Peter siegel put his trust in siemens. “Close collaboration was an obvious choice since siemens had already been a reliable partner for years,” he recalls. “we’ve been outfitting most of our machine tools with siemens controls for more than 20 years. For example, we’re currently using siMoDriVe and sinaMiCs converters and sinuMerik control systems.”
Competitive advantages thanks to Siemens technologysiemens’ online services provide sw with a key competitive edge – beyond maintenance and servicing. “using a machine’s diagnostic data, we can show customers how to increase their output by improving their processes, for example,” explains siegel. the payoff is closer customer relationships, increased revenue and valuable ideas for new machine development. and siemens profits too: “ePs enables us to support our customers and our custom-ers’ customers,” says Jochen heinz. the result: new business opportunities for everyone concerned.
left – sw equips most of its machine tools with our sinuMerik control systems, which operate perfectly with ePs network services.
BeloW – Jochen heinz from siemens (left) and Peter siegel from sw have been refining ePs network services for many years.

58
Mexico
aBove – ePs network services are mobile: whether at the company or on the road, Johannes Zuckschwerdt can access sw machine status data worldwide via tablet computer.
Johannes Zuckschwerdt, head of new services development at Schwäbische Werkzeugmaschinen
“As a highly specialized medium-sized company, we can’t maintain a local
presence worldwide. But with Siemens’ outstanding online services, we can still
keep very close to our customers.”
9,285 km

59
Schwäbische Werkzeugmaschinen
schwäbische werkzeugmaschinen (sw) supplies customers in 29 countries with innovative machining
centers, which are networked with the company ’s headquarters in southwestern germany via
siemens’ it-supported services.
BrazilIndonesia
Norway
7,56
2 km
China8,968 km
11,287 km
Siemens’ IT-supported servicesits partnership with siemens is enabling schwäbische werkzeugmaschinen to offer services worldwide. “as a highly specialized medium-sized company with around 300 employees, we obviously can’t provide local customer support in every country,” explains Johannes Zuckschwerdt. “But we don’t need to. thanks to ePs network services, we can support customers in China, the u.s. and everywhere else directly from our headquarters in germany.”
online diagnostic analysis saves time and money – especially in the very rare cases in which machines break down. in the past when this happened, a spe-cialist would have to be dispatched to the customer to conduct detailed on-site diagnostics. today, things are easier – instead of travelling halfway around the world, sw experts can analyze failures online. using log files, causes can be pinpointed and customers provided with precise instructions for remedying
defects. “this is how we boost reliability for our customers and help them maintain production around the clock,” notes Zuckschwerdt.
the idea is actually very simple. But putting it into practice required an intensive exchange of knowledge and a large measure of trust. “engaging in joint devel-opment with siemens, we’ve naturally had to share sensitive data about products and services,” says Zuckschwerdt. “however, this hasn’t been a problem for us. we’ve been working with siemens for a long time. so we’ve built a very close relationship based on trust. that’s the only way to create inno vative products that benefit both partners.”
1,252 km

60
Ton de Bruine, General Director of Brinks Metaalbewerking B. V.
“We have great trust in Schwäbische Werkzeugmaschinen’s online services and the
Siemens technology that backs them up. They’re making our processes more reliable
and our cost calculations more accurate.”
SW customer in the Netherlandsheadquartered in Vriezenveen in the netherlands, Brinks Metaalbewerking B.V. produces and supplies
components for carmakers and leading manufacturers of agricultural machinery.
Netherlands
650 km
Value-creating servicessiemens’ it-supported services also create value for sw’s customers. Brinks Metaalbewerking B. V., located in the Dutch town of Vriezenveen, is a prime example. the company’s 150 employees produce parts mainly for the car indus-try. Via systems suppliers, numerous top-of-the-line carmakers source com-ponents like valve blocks for convertible top controls and active spring systems from Brinks. Leading manufacturers of agricultural machinery are also on Brinks’ customer list.
operating around the clock, sw’s machines in Vriezenveen manufacture tens of thousands of identical components in series production – components that Brinks’ customers want at the right time and in the right quantities for their assembly lines. top quality is essential. “if one of our machines shuts down un-expectedly, we immediately have problems meeting our delivery deadlines,” says company owner ton de Bruine. “Because our production lines run 24 hours a day, there’s little extra machine capacity to compensate for any breakdowns that may occur.”
Brinks specializes in the machining of metals:
high-precision and high-volume drilling,
milling and thread cutting. For these opera-
tions alone, the company uses 17 machines
from schwäbische werkzeugmachinen.

61
so there’s no room for error. that’s why Brinks has been using sw’s online services for several years now. “it’s not just that sw provides us with immediate support from germany in the event of an acute problem,” explains de Bruine. “the company also helps us improve the scheduling of servicing and main-tenance for our machines across their entire lifecycles.” thanks to the detailed information that these services provide about the condition of spindles, axles and other key machine components, Brinks employees always know exactly when parts need replacing.
Planned downtime instead of unexpected failures – that means no missed delivery deadlines. “working closely with Johannes Zuckschwerdt over the last few years, we’ve learned to value the many possibilities that ePs offers,” says ton de Bruine. and even though he’s not a computer freak himself and doesn’t even have a PC on his desk, de Bruine doesn’t intend to dispense with the tried and tested services in the future. “we’re equipping all our machines with this system.” the issue of data security also played a key role in his decision. “i’m 100% sure that our data is in good hands with siemens and schwäbische werkzeugmaschinen.”
far left – thanks to ePs network services, Brinks employees can count on a smooth production process.
left – Brinks’ owner ton de Bruine – shown here with valve blocks used in active spring systems for automobiles – is proud of his company’s products.

62
Secure and reliable processes create trustother sw customers are also on board. “around 90% of our customers now rely on ePs network services,” reports Peter siegel, who’s now reaping the benefits of his early commitment to the innovative services. “with ePs, we can keep a close eye on machine status data and provide optimal customer support. the online services have proven to be a decisive factor in generating long-term customer loyalty over the past few years, helping us build up a solid customer base.” so it’s no wonder that sw intends to further enhance its competiveness in the areas of customer support, consulting and, above all, proactive services that help manufacturers keep their production lines running smoothly.
Jochen heinz, siegel’s siemens partner for many years, sees huge potential in online equipment monitoring. “using the system with machine tools has taught us which algorithms, architectures and business models we need,” he says, summing up his experience. “Precise, online equipment monitoring is important for many siemens customers. in the fields of industry, infrastructure, energy and healthcare, there are already a large number of similar applications that are making machines and systems more productive and more reliable.”
WWW.SiemenS.com/ar/netWorking
WWW.SiemenS.com/ar/netWorking-movie
left – Peter siegel (left) still has lots of ideas for sw’s online services. and Jochen heinz, his long-time siemens partner, is happy to hear them.
aBove – still uncommon today, but probably standard tomorrow: tablet computer access to machine tool status data.

63
Costs are a decisive factor across the entire lifecycle. Machine downtime and unplanned maintenance are much-feared cost drivers in manufacturing. Consequently, more and more industrial companies are basing their investment decisions on total operating costs. And it’s not just procurement and consumption costs that they’re taking into account. They’re also considering machine availability and productivity. Companies with technologically advanced and optimally organized maintenance and production processes have a clear competitive edge. That’s why Siemens provides its customers with comprehensive industry services like ePS Network Services.
Online platform with maximum data security. Offering customers an advanced status monitoring system, our ePS Network Services provide manufacturers with the information they need to improve service and maintenance processes worldwide and increase machine productivity and uptime. Service processes are managed via an under-lying online platform. A multilevel access protection system and high-availability serv-ers maximize data security and availability. Siemens’ ePS Network Services comprise:
> ePS Diagnostic Services, which enable manufacturers to monitor the status of their equipment worldwide. Machines automatically report their diagnostic and measure-ment data to the ePS server at regular intervals. Supported by appropriate algorithms and automatic features, manufacturers can identify and analyze the causes of faults more quickly.
> ePS Condition Monitoring, which closely monitors machine status and wear. Poten-tial faults can be detected at an early stage so that service personal have time to take appro priate action. Key parameters can be monitored online. When threshold values are exceeded, specialists are automatically notified by e-mail or text message. Com-plete machine overviews facilitate preventive and status-oriented maintenance. Main-tenance schedules can be optimized to increase system availability and productivity.
Everyone’s a winner. Our innovative IT-supported services benefit machine opera-tors as well as machine manufacturers. By making machine utilization more effective, enhancing competitiveness and enabling companies to tap lucrative new business fields, these services create value all along the value chain – for our customers and for our Company.
CREATING VAluE wITh SIEmENS ePS NETwoRk SERVICES
siemens ePs network
servicesmanufacturer
cuStomer
The data provided by ePS Network Services enable companies to calculate machine operating
costs for complete lifecycles.

64
By ensuring a continuous transfer of knowledge and infor-mation in all areas that concern Siemens as a whole, our cross-business activities are playing a vital role in our drive to unleash the full potential of our integrated technology company. Our commitment to expanding our service offer-ings via innovative IT solutions is just one example of how knowledge transfer is benefiting us and our customers.
Many areas, one goal – Optimal knowledge transfer Company-wide
We talk to each other. We learn from each other. And all of us get a little better every day thanks to our wide range of cross-business activities, initiatives and programs that address topics relevant for our entire organization.
Our search for the talented individuals we’ll need to conquer the markets of tomorrow is one of our key cross-business activ-ities. To assess our employees’ expertise and potential, we use transparent, uniform criteria across all our Sectors and Divi-sions and in all our businesses worldwide. Siemens’ Learning Campus (LC) – a Company-wide organization that fosters lifelong learning and personal development – is where it all begins. Our Divisions contribute their knowhow, and LC ensures that best practices are communicated to our people around the globe. Every year, more than 100,000 Siemens employees participate in seminars, training programs, work-shops and global e-learning initiatives, accelerating knowl-edge transfer within the Company and making us that much smarter. Our commitment to education is also receiving exter-nal recognition. In fiscal 2012, for example, we were again awarded the highest possible number of points in the Human Capital Development category of the Dow Jones Sustainability Index (DJSI) – the third time we’ve received this distinction.
Siemens Leadership Excellence is our continuing education program for managers. Here – as well as in the related Siemens Leadership Framework – we apply Company-wide standards
that help us foster the development of our future top managers in an individual, targeted manner, while motivating them to work toward our common goals.
One of our goals is to expand our businesses in the emerging countries, where the demand for economical products and solutions has not yet been completely met. For these coun-tries, we’ve launched our SMART (simple, maintenance-friendly, affordable, reliable and timely-to-market) initiative to develop new, entry-level products tailored to local require-ments – for the benefit of our entire Company. In the emerging markets, SMART has made our Healthcare Sector, for example, the leading supplier of entry-level imaging systems. In China, we’re the market leader in intelligent rail signaling systems – posting annual growth of some 25% over the last five years. As part of our Company-wide top+ initiative, we provide our business units with methods and tools for implementing the SMART initiative and systematically improving their business-es. The top+ initiative also entails organizing cross-Sector and cross-Division knowledge transfer and awarding prizes for outstanding projects.
Continuous knowledge transfer and information exchange are making
a vital contribution to our Company’s success.

65
Our responsibility doesn’t end when we complete a sale. With both conventional product services and new, trailblazing service offerings, we want to further increase customer loyalty. As a key component of our growth strategy, services generate reliable revenue with less capital intensity than other business activities. We’re rigorously exploiting our strengths as an inte-grated technology company in order to expand our innovative services.
We’re also exploiting our Company-wide expertise in the area of procurement. We’ve established a uniform system of supply chain management to realize synergies, cut costs, guarantee high quality, ensure on-time delivery, provide efficient logis-tics and better utilize our suppliers’ power of innovation. The system – which includes on-site reviews of supplier operations and an energy efficiency program for suppliers – is also help-ing us achieve our ambitious sustainability goals by mini-mizing sustainability-related risks and enabling us to actively leverage opportunities in our supply chain.
Company-wide cooperation across organizational boundaries creates a vast range of opportunities: close collaboration generates the trust we need to power our integrated techno-logy company faster and more effectively into the future.
COMBINED MANAGEMENT REPORT, PAGES 101-102 AND 126-127
Cross-business activities: To optimally lever-
age the potential of our integrated technology
company, we ensure that knowhow is conti n-
uously shared Company-wide in all areas that
concern our organization as a whole. A few
examples of our many cross-business activities
are highlighted in the illustration above.
Leadership Framework
Learning Campus
smart
Services
Supply chain management
top+
Cross-businessactivities
Infrastructure & CitiesEnergy Healthcare Industry

66

67
Proximity, page 8
Ideas, page 20
Strength, page 34
Networking, page 54
Diversity
Creating trust through diversity
Partnering across borders
The integrated technology company
Diversity provides inspiration, unleashes creative potential and expands horizons – all of which makes it vital to our success. That’s because people from different cultural and educational backgrounds approach problems completely differently – and when working together as a team, they often find the best solutions. Of course, it’s all the better when people find it easy to engage in dialogue across borders, lan-guages and cultures. At Siemens, our Teamcenter software solution is promoting international cooperation at many company locations.
What are the aims of Teamcenter? To better leverage the opportuni-ties presented by diversity, increase work efficiency, develop the best solutions and bring them to market faster. Allen Wang, James D. Palasek, Tesha Best and Christian Mellenthin (left to right) experience what this means in practice every day. Thanks to Teamcenter, they can work closely with colleagues around the world without leaving their offices in the U.S. city of Tucker, Georgia. Read on to learn how this software platform is making them feel even more closely inte-grated into the Siemens family.
teamcenter

68
On the ground in key markets worldwide“It doesn’t matter where at Siemens you work or what culture you call home: we all share the same goals. that’s probably the best thing you can learn at the Company.” James d. Palasek speaks from experi-ence. the engineer from tucker, georgia has worked at Siemens for twelve years, partnering closely with colleagues in Mexico, germany, China and India. his specialty is developing components and mod-ules for control cabinets. here – as in all our business fields – we’re aiming to achieve a leading position in all our markets worldwide. but only very few components are truly universal: technical regula-tions, industry standards and even climate conditions vary too much from place to place. that’s why we have developers working close to our customers, on site in key markets. and that includes tucker, georgia, one of the 15 worldwide locations of Control Components and Systems engineering (Ce).
Siemens Control Components and Systems
engineering (Ce) is a business unit in the
Industry automation (Ia) division of Siemens’
Industry Sector. Ce specializes in products for
industrial control systems, industry-specific
products and systems based on industry plat-
forms, and related services.
negotiating the order – atlanta
amber Sherman consults with an industry customer in florida about a cabinet that will house the controls for the electric motors at a production plant. the special challenge: only very little space is available.
teamcenter – Process chain
a sample process chain illustrates how an international project is completed using teamcenter. Since the software has not yet been fully implemented at Siemens Ce, some steps are still in the test phase.
Backgroundfollowing assignments in the german cities of erlangen and Nuremberg as well as in the viet-namese capital of hanoi, amber Sherman began managing Siemens key accounts in South Carolina, georgia, florida and the Caribbean in 2012. Sherman holds a master’s of international business in marketing degree from the university of erlangen and georgia State university in atlanta. She’s espe-cially proud to be working with major customers, for example, at the u.S. manufacturing plants of renowned european carmakers. What Sherman particularly appreciates about Siemens is the opportunity to collaborate on successful projects with colleagues in other countries.
Atlanta, Georgia, U.S.
Amber Sherman, Customer care

69
but like the employees at the other facilities, James d. Palasek is active beyond the borders of his home market. “our colleagues in germany help us market our u.S. products in europe, for example. by the same token, we reciprocate when they want to bring prod-ucts developed for europe to the u.S. market.”
Teamcenter – Collaborative softwarehelmut Staufer from Ce’s product management center in fürth, germany goes even further: “New and redesigned products should work in lots of markets or must be easily adaptable. I’m continu-ally discussing this issue with our international developers – by web conference, phone and e-mail.” In this context, optimizing the pushbuttons of our SIrIuS series for various markets is just one of many examples. Xu huihui, a development engineer in Suzhou,
Planning the technology – West chicago
Jayne beck configures control cabinets. upon determining that our 3Sb3 series does not have a suitable pushbutton with safety certification for the u.S. market, beck uses teamcenter to make inquiries at the product management center in fürth, germany.
teamcenter
Backgrounddegrees in general engineering from the uni-versity of Illinois and business administration from North Central College in Naperville, Illinois, make Jayne beck uniquely qualified to navigate the intersection of business and tech-nology. the enthusiastic teamcenter user has worked at Siemens for 24 years and is proud of her employer – especially since her colleagues around the world are intensely committed to generating customer satisfaction.
West Chicago, Illinois, U.S.
Jayne Beck, Technical order processing

70
near Shanghai in China, who’s been charged with this task, uses teamcenter to consult with Staufer and colleagues in different countries. teamcenter’s benefits immediately won over the eager networkers in fürth, tucker, Suzhou and elsewhere. Xu huihui is thrilled: “With teamcenter, I can work with anyone, anywhere, any-time, using a single platform. there’s no better way to share infor-mation, blueprints, Cad data and 3d views.” at Siemens in West Chicago, Illinois, u.S., Jayne beck has been using teamcenter from the very beginning. What she appreciates most are the uniform processes: “our development teams used to work with lots of differ-ent software solutions. that made data transfer much more diffi-cult. Now teamcenter gives us a single platform for sharing product and design data and managing the entire product lifecycle – from the initial idea to the design, manufacture and ongoing develop-ment of our products.”
to learn more, please see: teamcenter: turBo drive for teamWork, Page 75
clarifying availaBility – fürth
helmut Staufer looks into Jayne beck’s inquiry. and what does he find? Siemens produces a suitable pushbutton in China, but it lacks the ul safety certification that’s required in the u.S. via teamcenter, he asks his colleagues in Suzhou if it would be possible to obtain ul certification for the pushbutton. Jayne beck will automatically be kept up-to-date on any new developments.
ProPosing a solution – suzhou
Xu huihui uses teamcenter to call up the inquiry on his screen – including product data, blueprints and 3d views. he concludes that the pushbutton would meet all u.S. specifications if a different material were used and passes this information on to helmut Staufer and Jayne beck.
teamcenter
Backgroundhelmut Staufer is an electrical engineer who joined Siemens in 2010. he’s been responsible for control and signal devices at Ce’s global product management center since 2011. Staufer’s earlier assignments included a six-month stint in Suzhou, China, where he was inspired by the opti-mism and curiosity of his Chinese col-leagues and also pleased by their keen interest in european soccer.
Fürth, Germany
Helmut Staufer, Product management

71
Benefits across the board – for employees and customersWhat are the advantages of using teamcenter? Streamlined work-flows, no more reduplicated processes and even faster solutions. and something that wasn’t a primary objective but may just be teamcenter’s greatest benefit: a feeling of belonging that keeps on growing, transcending national and cultural boundaries. every day, all around the world, employees at Ce and many other Industry Sector units are experiencing how teamcenter improves collabora-tion among women and men with different skills, knowhow and qualifications – and enables them to get to know one another bet-ter. Jayne beck values diverse teams for yet another reason: “our customers, like our employees, come from a wide range of cultural backgrounds. all around the globe, we have colleagues who are especially good at putting themselves in our customers’ shoes. and their knowledge and insights equip us to develop better products and solutions.”
looking at the Bottom line – fürth
helmut Staufer brings in the responsible product manager, and they come to the conclusion that it would make good business sense to produce and certify the pushbutton for the u.S. market. Staufer then gives the green light for production to begin.
ordering PrototyPes – West chicago
Jayne beck uses product data and 3d views to virtually install the push-button in the control cabinet. once the customer’s order confirmation has been received, beck uses teamcenter to order prototypes from Suzhou for u.S. safety certification testing, which she assigns to the Siemens test lab in tucker.
BackgroundXu huihui was already testing software for Siemens when he was a student at yancheng Institute of technology. after earning a bache-lor’s degree in mechanical design, manufac-ture and automation, he joined Siemens in Suzhou in 2008. following various assign-ments in the field of It, Xu is currently work-ing in development. his experience here is that teamcenter is very easy to learn and is substantially improving international col-laboration.
Suzhou, China
lu guomin, local teamcentercoordinator (right)
Xu Huihui, Development (left)

72
Embracing diversity as an opportunityat Siemens, our unwavering commitment to diversity is firmly anchored in our corporate strategy. for a company that’s active in some 190 countries and generates more than two-thirds of its revenues outside its home market, diversity is more than simply a business necessity. our people see diversity as offering great oppor-tunities for their professional and personal development. “Working with colleagues around the world expands my horizons and changes my perspective. I can learn a lot at Siemens,” says Xu huihui’s col-league Wang yan Qin. helmut Staufer draws particular inspiration from working with his Chinese counterparts: “they’re always very optimistic, positive and committed to their work.” James d. Palasek also feels a very personal gain: “I learn a lot about other cultures and their working style and can apply these insights to my own work.” today, countless employees throughout our Company are passion-ate and motivated about networking and learning from one another in their day-to-day work.
Working out the details – suzhou
Xu huihui finalizes the design drawing and product description for the pushbutton. however, through the teamcenter data pool, he discovers that the material intended for use has not yet been approved for production at Siemens. Xu huihui uses teamcenter to initiate approval of the material by Wang yan Qin.
checking the material – suzhou
In teamcenter, Wang yan Qin has all the details at her fingertips. She determines that the material is suitable for the u.S. market. further review shows that the material can be processed problem-free using the equipment and machinery at our facility in Suzhou. Wang changes the status of the part in teamcenter to “approved.”
BackgroundWang yan Qin earned a master’s degree from hefei university of technology before joining Siemens in Suzhou in 2007. her responsibilities include vetting and evaluating suppliers and monitoring the quality of the components they supply. Wang yan Qin is very interested in other cultures. Since visiting germany, she raves about potato dumplings, even though they taste much different from the dumplings she’s familiar with from home.
lu guomin, local teamcenter coordinator (foreground),Xu huihui, develoPment (Background)
Suzhou, China
Wang Yan Qin, Supplier quality management (left)

73
The global Siemens familydespite all the differences in cultural and educational background, the members of the extended Siemens family have many things in common. helmut Staufer enjoys having a brief personal conversa-tion with his colleagues before every web conference. and James d. Palasek has even gotten swept up in european soccer fever: “I root for the german team, unless they happen to be playing against the united States.” Close collaboration strengthens the feeling of being part of the global Siemens family. amber Sherman from Industry Sales in atlanta experienced a sense of community at her interna-tional posts: “Wherever Siemens takes me today, I find that we basically speak the same language.” and that language isn’t german, english or Chinese. Philipp bierschneider, who is responsible for implementing teamcenter at Ce, comes from amberg, germany, but has experienced the language of the Siemens family at loca-tions around the world: “My colleagues are really friendly and very helpful. We work not so much on an organization-to-organization basis but more hand-in-hand and person-to-person.”
manufacturing PrototyPes – suzhou
Xu huihui is immediately notified via teamcenter that the new material has been granted internal approval. he then requests that prototypes be manufactured in Suzhou and sent to tucker.
checking ul conformity – tucker
the pushbutton prototypes have arrived. James d. Palasek tests them for ul conformity on the basis of the specifications stored in teamcenter. after the prototypes pass muster, Palasek saves the official ul certifica-tion for the u.S. market in teamcenter.
teamcenter
Backgroundafter several assignments at Siemens in the u.S. and Mexico, James d. Palasek currently heads a team of developers at Ce in tucker, georgia. Palasek holds a bachelor’s degree in industrial technology and engineering from Iowa State university and has been with Siemens since 2000. he’s always delighted when he encounters colleagues in europe who’ve read his favorite book, the cult classic The Hitchhiker’s Guide to the Galaxy. a few years ago, Palasek still had to send data and blueprints to China manually. today, team-center does the job automatically.
Tucker, Georgia, U.S.
James D. Palasek, Development and certification (left)

74
ordering the Product – West chicago
via teamcenter, Jayne beck is also notified of the ul certification for the u.S. market. She orders the necessary number of redesigned pushbuttons directly in Suzhou and sends the control cabinet blueprints to production.
adding the Product – fürth
helmut Staufer learns through teamcenter that the pushbutton now meets all requirements for the u.S. market. Staufer adds the button, together with all the relevant data and 3d views, to the global database of Siemens products. effective immediately, the new product can be officially ordered anywhere in the world.
comPleting the Project – West chicago
once the control cabinet has been shipped, Jayne beck closes her inquiry. together with her colleagues around the world, she will always have online access to all the details of the project through teamcenter. this will make it possible to respond quickly to requests for service, spare parts and follow-up orders, which in turn will increase customer satisfaction.
teamcenter
Brigitte Ederer, Member of the Managing Board of Siemens AG, Head of Corporate Human Resources and Labor Director
“The diversity of our people – with their wide range of backgrounds and skills –
fosters the wealth of ideas at our company and strengthens our power
of innovation.”
Backgroundas soon as she finished her bachelor’s degree in mechanical and electrical engineering at North-western university in evanston, Illinois, Jinglu Wen started gaining hands-on experience at Siemens in West Chicago, where her job involves con-structing various 3d models and modules. Jinglu uses teamcenter to discuss the results of her work with experienced colleagues around the world – and she’s very gratified to receive their strong support.
West Chicago, Illinois, U.S.
Jinglu Wen, Development (right)

75
Teamcenter is the name of the Siemens software that makes smart product lifecycle management (PLM) across borders and time zones a reality. Some seven million users around the world are already working with Teamcenter or other products from Siemens PLM Software in Plano, Texas, U.S. – including nearly all major automotive manufacturers. It comes as no surprise that we’re also deploying this successful software platform in-house. Roughly 20,000 employees at our Drive Technologies and Industry Automation Divisions will soon be using Teamcenter at 90 locations in 15 countries.
The IEC program is unique in its size, its complexity and its broad range of applications. That’s why Teamcenter developers are eagerly awaiting feedback from those who are intro-ducing and using the software. This feedback will be taken into account when developing the next generation of Teamcenter. And our interest is actually twofold, because at Siemens we don’t just sell our products and solutions; we use them.
WWW.siemens.com/ar/diversity
WWW.siemens.com/ar/diversity-movie
WWW.siemens.com/teamcenter
Reach the customer twice as fast. Produce and bring to market while the competition is still in the planning phase. Put innovation on the fast track. And all this with 280,000 prod-uct variants, 60,000 employees and production facilities around the world. This is the ambi-tious vision of our Drive Technologies and Industry Automation Divisions. Integrate Enable Collaborate (IEC) is what we call our program for greater speed and maximum efficiency. The goal for the years ahead is to bring new products to market much faster, in some cases even twice as fast as in the past.
This will require perfect teamwork: developers, product managers, designers, production planners and many other specialists will have to work as one. And they’ll have to enrich the data pool with their product and process knowhow – whether in the area of computer-aided design (CAD), office applications (such as word processing) or computer-aided manu-facturing (CAM). This is the only way to make all information available anywhere, any-time – including everything from the initial idea for a product to production planning, user instructions and service feedback. The cycle ends when development of the next product generation begins.
TeamcenTer – The Turbocharger for Teamwork
teamcenter makes it possible to store and process all the development and production process data for our products in a single central location that’s accessible worldwide. the system’s unique open architecture enables users to work with various specialized development tools, even those of other companies.
tools and systems from external suppliers
teaM-CeNter
Product data management
Software development
Cad electronics
Project management
Portfolio management
Idea management
requirements management
Cad mechanics, e.g. NX®
Simulation
digital productiondocumentation
management
Customer experience / feedback from the field

76
We’re mastering the major challenges of our time, continu-ously breaking new ground and making technology history. But these achievements are only possible because we have outstanding employees who – through their expertise, abilities and dedication – have made our Company the global power-house that it is today. That’s why lifelong learning, continuous personal development and the fostering of diversity and employee commitment are the foundations of our employee and management culture.
Employees – The source of our strength
Siemens is only as strong as its employees. We expect outstanding performance from our people. In return, we support them in unleashing their full potential.
Our employees’ creativity and pioneering spirit are the source of our strength. To build on this foundation and grow even further, we have to attract and retain the best minds in the world. By providing them with additional opportunities to increase their expertise, we also create an atmosphere of trust and constructive cooperation that enables us to break down professional, linguistic and national barriers throughout our organization.
To outperform our competitors in the global battle for talent, we’re partnering with the most prestigious universities in the world’s most important markets. Our Siemens Graduate Program, for example, provides top university graduates with an ideal springboard for launching their professional careers. We give these young talents – and all Siemens employees – the chance to continuously develop their capabilities, master new challenges and assume ever-greater responsibility. As part of our educational offerings, we’ve set up uniform Core Leaning Programs worldwide to make cooperation within our integrated technology company even more effective by en-hancing employee knowhow in key areas like project man-agement, software development, procurement and human resources. Our central intranet education portal alone offers
our global workforce more than 1,000 business-oriented courses and programs.
Our employees are as diverse as the customers we serve – all around the world. People from some 140 different countries work at our ten largest Regional Companies alone. Our employ-ees’ diverse languages, cultures and religions are a source of great strength. Multi-cultural teams with a broad range of expertise and perspectives promote the wealth of ideas within our Company and enhance our power of innovation.
To foster diversity throughout our organization, we’ve launched our Diversity Initiative, which bundles targeted measures and projects for ensuring and further enhancing diversity at all levels of our Company. Examples include our global network of about 160 Siemens Diversity Ambassadors, who identify diversity issues Company-wide, and our Global Leadership Organization of Women (GLOW). To help our employees better understand one another, we’ve also established intercultural training programs and initiatives aimed at eliminating unconscious prejudices.
With their wide array of skills, experience and qualifications,
our people give us a decisive competitive edge in the global arena.
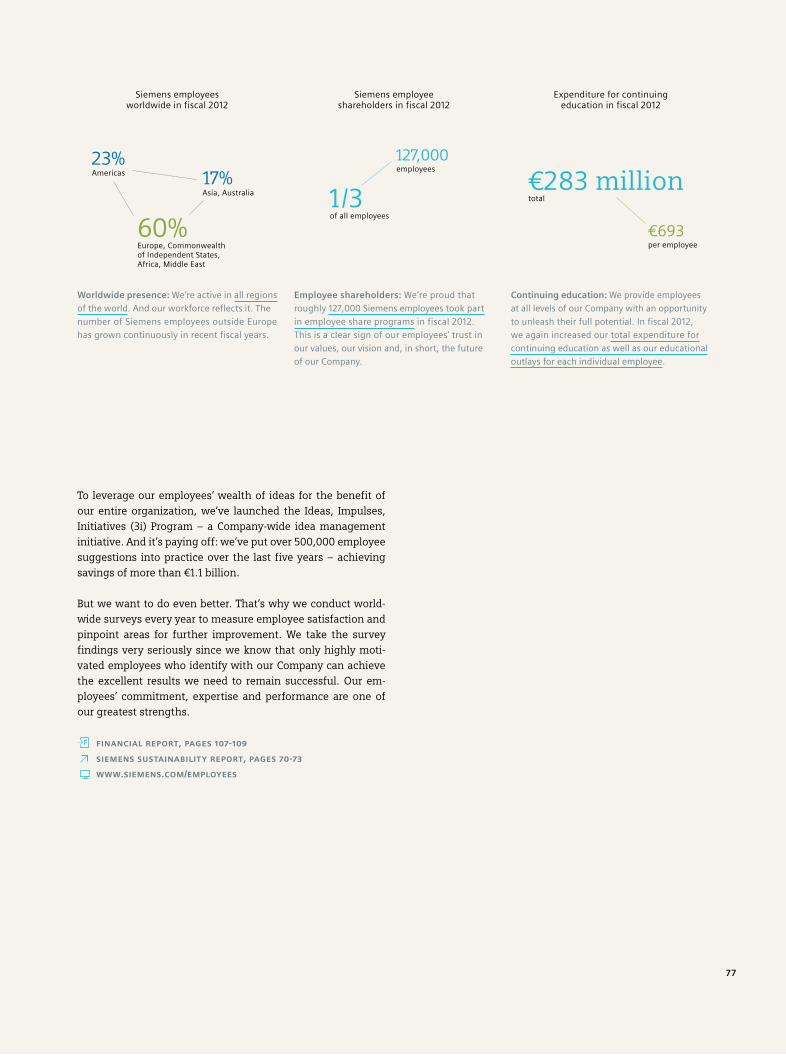
77
To leverage our employees’ wealth of ideas for the benefit of our entire organization, we’ve launched the Ideas, Impulses, Initiatives (3i) Program – a Company-wide idea management initiative. And it’s paying off: we’ve put over 500,000 employee suggestions into practice over the last five years – achieving savings of more than €1.1 billion.
But we want to do even better. That’s why we conduct world-wide surveys every year to measure employee satisfaction and pinpoint areas for further improvement. We take the survey findings very seriously since we know that only highly moti-vated employees who identify with our Company can achieve the excellent results we need to remain successful. Our em-ployees’ commitment, expertise and performance are one of our greatest strengths.
FINANCIAL REPORT, PAGES 107-109
SIEMENS SUSTAINABILITY REPORT, PAGES 70-73
www.SIEMENS.COM/EMPLOYEES
Worldwide presence: We’re active in all regions
of the world. And our workforce reflects it. The
number of Siemens employees outside Europe
has grown continuously in recent fiscal years.
Employee shareholders: We’re proud that
roughly 127,000 Siemens employees took part
in employee share programs in fiscal 2012.
This is a clear sign of our employees’ trust in
our values, our vision and, in short, the future
of our Company.
Continuing education: We provide employees
at all levels of our Company with an opportunity
to unleash their full potential. In fiscal 2012,
we again increased our total expenditure for
continuing education as well as our educational
outlays for each individual employee.
Siemens employee shareholders in fiscal 2012
Siemens employees worldwide in fiscal 2012
Expenditure for continuing education in fiscal 2012
€693per employee
€283 million total
60% Europe, Commonwealth of Independent States, Africa, Middle East
23% Americas 17%
Asia, Australia 1/3of all employees
127,000employees

78
As an integrated technology company, we have a strong setup. One Siemens – which defines metrics for revenue growth, capital efficiency, profitability and the optimization of our capital structure – is the framework for our Company’s sustainable development. www.siemens.com/one-siemens
One Siemens – Our path to sustainable value creation
Framework for sustainable value creation
To increase our revenue, use our capital more efficiently and more profitably and optimize our capital structure – these are our goals. Goals that we’ve further defined with the clear metrics of our One Siemens framework. Taken together, these metrics comprise a balanced system that provides the basis for generating a sustainable increase in value. We have three concrete objectives. First, we want our revenue growth to outpace that of our key competitors. Second, we want our growth to be capital efficient. That’s why we’ve defined an ambitious target corridor for return on capital employed. At the Sector level, we want to continuously achieve top margins compared to our competitors across industry cycles. And third, we’ve set a target for our capital structure that will enable us to achieve sustainable, strongly based profitability.
To learn more, please see: comBineD mAnAGemenT RePoRT, PAGes 64-65

79
Revenue growthGrowth > most relevant competitors
Focus on innovation-driven growth markets
Use the power of Siemens
Get closer to our customers
Capital structureAdjusted industrial net debt / EBITDA
Capital efficiency / ProfitabilityReturn on capital employed / top margins throughout business cycles

80
Focus on innovation-driven growth markets
Our pioneering spirit is a basis of our success. Our activities are focused on innovationdriven markets – markets with longterm growth potential. To play a leading role in these markets, we’re continuously strengthening our portfolio and further expanding our Environmental Portfolio.
Be a pioneer in technology-driven marketsWe’ve been delivering innovative engineering achievements for 165 years, continuously tapping new markets and occupying new growth fields. To enhance this special strength, we’re concentrating on innovation- and technology-driven growth markets – on markets with potential for our future core business. We’re strengthening our power of innovation by leveraging synergies worldwide and increasingly utilizing external expertise. We’ve opened our lab doors to universities, research institutes and industry partners. More than 1,000 cooperative research projects a year enable us to respond quickly to the new require-ments of local and global markets.
Strengthen our portfolioOnly by keeping our portfolio focused on attractive future-oriented markets can we achieve profitable long-term growth. That’s why we practice intensive, systematic portfolio man-agement. The cornerstone of our portfolio policy is the principle that our businesses must capture and maintain No. 1 or No. 2 positions in their respective markets. The prerequisites for profitability and growth, these leading positions enable us to sustainably increase Siemens’ value. As the history of our Company proves, we’ve always been successful when we’ve been at the forefront of technological innovation. Size alone is not enough to ensure long-term success. This is the guiding principle of all significant changes in our portfolio.
Provide a leading environmental portfolioOur Environmental Portfolio, which bundles products and solutions that contribute to environmental and climate protection, has captured an outstanding position on the tech-nology market worldwide and is one of our strategic growth drivers. In fiscal 2012, the Portfolio generated revenue of €33.2 billion and made a substantial contribution to climate protection. At the same time, our ecofriendly products and solutions enabled customers worldwide to slash their CO2 emissions by 332 million tons – an amount equal to some 41% of the CO2 emissions generated in Germany in 2010.
To learn more, please see: www.siemens.com/one-siemens
Provide a leading environ - mental portfolio
Be a pioneer in technology-driven markets
Strengthen our portfolio
Focus on innovation-
driven growth markets

81
Get closer to our customers
We want to be close to our markets and a strong local partner to our customers throughout the world. That’s why – besides playing a leading role in the industrial countries – we’re also successfully developing and producing more and more innovative products and solutions in the emerging countries. The professionalization and expansion of our service offerings is another of our strategic aims since innovative services harbor a wealth of new business opportunities and intensify customer loyalty.
Grow in emerging marketsThe so-called BRIC countries (Brazil, Russia, India and China) and the up-and-coming nations of Asia, South America and the Middle East are achieving high levels of economic growth, in which we intend to participate. Over the past few years, we’ve achieved strong growth in the emerging countries. The demand for economical products and solutions tailored to local customer requirements is particularly strong in these countries. To meet this challenge, we’ve launched our SMART (simple, maintenance-friendly, affordable, reliable and timely-to-market) initiative, which offers new products targeted for the entry-level segment.
Expand our service businessTo get closer to our customers – for us, this means providing outstanding services that increase customer value. With our comprehensive service offerings, we want to achieve the kind of long-lasting customer satisfaction that makes us the first choice for follow-up investment. It’s not only our sales organization that nurtures close relationships with our customers and fosters their loyalty: above all, it’s our local service employees, who – in some instances building on relationships that go back decades – have detailed knowledge of our customers’ needs and requirements. For these reasons, we want to consistently expand our service business in order to leverage additional potential for profitable growth.
Intensify our customer focusOur customers expect comprehensive, single-source consulting that’s geared to their individual needs. And it’s our goal and obligation to meet this expectation everywhere in the world. For us, a strong customer focus doesn’t just mean having an in-depth under-standing of our customers’ unique requirements; it also means providing them with customized solutions. Successful customer support requires excellent employees, an efficient setup and effective methods. Only when these three factors have been fully integrated to form a unified whole can we expand our strategic partnerships and create value for our customers.
Intensify our customer
focus
Grow in emerging markets
Expand our service
business
Get closer to our
customers
To learn more, please see: www.siemens.com/one-siemens

82
Use the power of Siemens
To rank among the best, you have to excel – in everything you do. And that means you need an outstanding team. At Siemens, we have extraordinarily dedicated employees. And we go to great lengths to continuously expand their knowledge while promoting equal opportunity and nurturing cooperation among men and women from different countries and cultural backgrounds. Our clear and unambiguous commitment to integrity guides us in our ongoing pursuit of business success. Our actions are governed by binding principles to which we expect our customers, suppliers and employees to adhere.
Encourage lifelong learning and developmentOne of our greatest strengths is our outstanding workforce. Our employees’ expertise, skills and dedication have made Siemens the company it is today. Building on this founda-tion, we’re aiming to grow even further. And one means to achieving this strategic end quickly and effectively is continuous learning, which not only enhances our people’s knowhow but also directly fosters their pioneering spirit, initiative and willingness to assume increasing responsibility. All around the world, we give our people at all levels the chance to fully develop their potential.
Empower our diverse and engaged people worldwideSiemens is a global powerhouse with a highly diverse workforce. People from some 140 countries work at our ten largest Regional Companies alone. That’s why we take a syste matic approach to diversity. Multifaceted teams of employees with a broad range of skills, experience and qualifications promote the wealth of ideas at our Company and strengthen our power of innovation. To find out how we can further boost workforce motivation, we regularly conduct employee surveys worldwide in 40 languages. The survey input is systematically applied to enhance our processes.
Stand for integrityWe’re committed to fair competition. In our efforts to succeed on the world’s markets, we aim to comply with all applicable laws and regulations. Ethical business conduct is a non-negotiable component of our corporate culture. We’ve formulated transparent and binding principles of behavior and taken a clear and unmistakable position in the battle against corruption. We also fulfill our responsibilities to society, the environment and our employees. For us, occupational safety, health management and the conservation of natural resources are all part of ethical business conduct.
Stand for integrity
Encourage lifelong
learning and development
Empower our diverse and engaged
people worldwide
Use the power
of Siemens
To learn more, please see: www.siemens.com/one-siemens

We will emerge from the current economic crisis with renewed strength. Supported by our new Companywide program to reduce costs, increase productivity, enhance efficiency and improve our processes and market access, One Siemens – our framework for sustainable value creation – is pointing the way forward.
As an integrated technology company, we have a virtually unparalleled position in our global markets – a position that’s made us a true partner of trust to our customers, our shareholders and our employees worldwide.
Trust unites us – Building strong partnerships for 165 years


Financial Report 2012
Trust unites us – Building strong partnerships for 165 years

key figures fiscal 2012 1, 2
in millions of €, except where otherwise stated
Basic earnings per share (in €) – continuing operations 4
FY 2012 5.77
FY 2011 8.23
income from continuing operationsFY 2012 5,184
FY 2011 7,376
capital efficiency FY 2012 FY 2011
Continuing operations
Return on capital employed (ROCE) (adjusted) 17.0% 25.3%
cash performance FY 2012 FY 2011
Continuing operations
Free cash flow 4,790 5,918
Cash conversion rate 0.92 0.80
Continuing and discontinued operations
Free cash flow 4,562 5,150
Cash conversion rate 0.99 0.81
liquidity and capital structure September 30, 2012 September 30, 2011
Cash and cash equivalents 10,891 12,468
Total equity (Shareholders of Siemens AG) 30,733 31,530
Net debt 9,292 4,995
Adjusted industrial net debt 2,396 (1,534)
employees (in thousands)
September 30, 2012 September 30, 2011
Continuing Continuingoperations Total 6 operations Total 6
Employees 370 410 359 402
Germany 119 130 116 127
Outside Germany 250 280 243 275
earnings FY 2012 FY 2011 % Change
Total Sectors
Adjusted EBITDA 9,471 10,404 (9)%
Total Sectors Profit 7,543 9,442 (20)%
in % of revenue (Total Sectors) 9.5% 12.8%
Continuing operations
Adjusted EBITDA 9,788 10,701 (9)%
Income from continuing operations 5,184 7,376 (30)%
Basic earnings per share (in €) 4 5.77 8.23 (30)%
Continuing and discontinued operations
Net income 4,590 6,321 (27)%
Basic earnings per share (in €) 4 5.09 7.04 (28)%
VolumeFY 2012 FY 2011 % Change
Actual Adjusted 3
Continuing operations
New orders 76,913 85,166 (10)% (13)%
Revenue 78,296 73,275 7% 3%
free cash flow – continuing operationsFY 2012 4,790
FY 2011 5,918(19)%
reVenue – continuing operationsFY 2012 78,296
FY 2011 73,2753% 3
(30)%
(30)%
new orders – continuing operationsFY 2012 76,913
FY 2011 85,166(13)% 3
adjusted industrial net deBt /adjusted eBitda – continuing operations 5
FY 2012 0.24
FY 2011 (0.14)
Target corridor: 0.5 – 1.0
roce (adjusted) – continuing operationsFY 2012 17.0%
FY 2011 25.3%
Target corridor: 15 – 20%
1 New orders; Adjusted or organic growth rates of revenue and new orders; Total Sectors Profit; ROCE (adjusted); Free cash flow and cash conversion rate; Adjusted EBITDA; Net debt and adjusted industrial net debt are or may be non-GAAP financial measures. Definitions of these supplemental financial measures, a discussion of the most directly comparable IFRS financial measures, infor mation regarding the usefulness of Siemens’ supplemental financial measures, the limitations associated with these measures and recon ciliations to the most comparable IFRS financial measures are available on our Investor Relations website under
www.siemens.com/nongaap
2 October 1, 2011 – September 30, 2012.
3 Adjusted for portfolio and currency translation effects.
4 Basic earnings per share – attributable to shareholders of Siemens AG. For fiscal 2012 and 2011 weighted aver age shares outstanding (basic) (in thousands) amounted to 876,053 and 873,098 shares, respectively.
5 Calculated by dividing adjusted industrial net debt as of September 30, 2012 and 2011 by adjusted EBITDA.
6 Continuing and discontinued operations.

Energy Revenue € 27.537 billion
Profit € 2.159 billion
Our Energy Sector offers a wide spectrum of products, services and solutions for the generation and transmission of power, and the extrac-tion, conversion and transport of oil and gas. It primarily addresses the needs of energy providers, but also serves industrial companies, particularly in the oil and gas industry.
Industry Revenue € 20.508 billion
Profit € 2.467 billion
Our Industry Sector offers a broad spectrum of products, services and solutions for the efficient use of resources and energy and im-provements of productivity and flexibility in industry. Its integrated technologies and holistic solutions address primarily industrial cus-tomers, such as process and manufacturing industries. The portfolio spans industry automation, industrial software and drives products and services, system integration and solutions for industrial plant businesses. After the close of fiscal 2012, the Sector decided to dispose of its business with mechanical, biological and chemical treatment and processing of water.
Financial Services Profit € 479 million
Total assets € 17.405 billion
Financial Services (SFS) provides a variety of financial services and products both to third parties and to other Siemens entities and their customers. SFS has three strategic pillars: supporting Siemens’ Sectors with financing solutions for their customers, manage financial risks of Siemens and offering third-party financing services and products.
Equity Investments Profit € (549) million
In general, the segment Equity Investments comprises equity stakes held by Siemens that are accounted for by the equity method, at cost or as current available-for-sale financial assets and are not allocated to a Sector, SFS, Centrally managed portfolio activities, Siemens Real Estate (SRE), Corporate items or Corporate Treasury for strategic reasons. Our main investments within Equity Investments are our stake of approximately 50.0% in Nokia Siemens Networks B.V. (NSN), our 50.0% stake in BSH Bosch und Siemens Hausgeräte GmbH (BSH) as well as our 49.0% stake in Enterprise Networks Holdings B.V. (EN).
Infrastructure & Cities Revenue € 17.585 billion
Profit € 1.102 billion
Our Infrastructure & Cities Sector offers a wide range of sustainable technologies for metropolitan centers and urban infrastructures worldwide, such as integrated mobility solutions, building and secu-rity systems, power distribution equipment, smart grid applications and low- and medium-voltage products.
Healthcare Revenue € 13.642 billion
Profit € 1.815 billion
Our Healthcare Sector offers customers a comprehensive portfolio of medical solutions across the treatment chain – ranging from medical imaging to in vitro diagnostics to interventional systems and clinical information technology systems – all from a single source. In addi-tion, the Sector provides technical maintenance, professional and consulting services, and, together with Financial Services (SFS), financing to assist customers in purchasing the Sector’s products.
segment information (as of september 30, 2012)

PDF version www.siemens.com/ar-pdf
Website www.siemens.com/annual-report
Mobile application www.siemens.com/ar-moBile
Annual Shareholders’ Meeting www.siemens.com/agm
The world of Siemens’ Annual Report
Ke
y fi
gu
res /
Seg
men
t in
form
atio
n

7
C
on
ten
ts F
inan
cial
Rep
ort
Contents FinanCial RepoRt
A. To our ShareholdersA.1 1 Letter to our ShareholdersA.2 10 Managing Board of Siemens AGA.3 12 Report of the Supervisory BoardA.4 18 The Siemens share / Investor relations
B. Corporate GovernanceB.1 22 Corporate Governance ReportB.2 28 Corporate Governance statement pursuant to
Section 289a of the German Commercial Code (part of the Combined Management Report)
B.3 29 Compliance ReportB.4 31 Compensation Report
(part of the Combined Management Report)B.5 44 Takeover-relevant information (pursuant to Sections 289 para. 4 and
315 para. 4 of the German Commercial Code) and explanatory report (part of the Combined Management Report)
C. Combined Management ReportC.1 50 Business and economic environmentC.2 64 Financial performance measuresC.3 69 Results of operationsC.4 82 Financial positionC.5 93 Net assets positionC.6 95 Overall assessment of the economic positionC.7 96 Subsequent eventsC.8 97 SustainabilityC.9 111 Report on expected developments and
associated material opportunities and risksC.10 129 Compensation Report, Corporate Governance statement
pursuant to Section 289a of the German Commercial Code, Takeover-relevant information and explanatory report
C.11 130 Siemens AG (Discussion on basis of German Commercial Code)C.12 134 Notes and forward-looking statements
D. Consolidated Financial StatementsD.1 136 Consolidated Statements of IncomeD.2 137 Consolidated Statements of Comprehensive IncomeD.3 138 Consolidated Statements of Financial PositionD.4 139 Consolidated Statements of Cash FlowD.5 140 Consolidated Statements of Changes in EquityD.6 142 Notes to Consolidated Financial StatementsD.7 232 Supervisory Board and Managing Board
E. Additional InformationE.1 240 Responsibility statementE.2 241 Independent Auditors’ ReportE.3 243 Statement of the Managing BoardE.4 244 Five-year summaryE.5 246 GlossaryE.6 248 IndexE.7 250 Further information and information resourcesE.8 251 Financial calendarE.9 252 Company structure 1
To move forward, we’ve launched a new Company-wide program. Presented in November 2012,
the initiative will enable us to make effective, concrete adjustments in our operations – changes
we’ll have to make if we’re to continue generating profitable growth of the kind we’ve achieved
in the last few years.
For my colleagues on the Managing Board and myself, the trust that you’ve placed in our Company
is an invaluable source of support. Your commitment creates trust, and trust unites us all: you, our
shareholders; our 370,000 employees worldwide; our customers in the industrial countries and
emerging markets; our partners in business, government and the scientific community; and, above
all, the countless people around the globe who use Siemens products and solutions every day.
Our strength – Customer proximity
This year, our Annual Report highlights the ways in which we’re creating trust by partnering closely
with our customers worldwide and developing innovative technologies that meet the needs of people
with different interests, from different cultures and with different aims and requirements. In five
special reports, we’d like to show you how our products and solutions are improving the lives of
people everywhere.
Fiscal 2012 was not an easy year for us. Even though we achieved one of our best results ever – despite the difficult economic environment worldwide – we didn’t fully attain our goals of outperforming the market and our competitors.
Dear shareholders,
A.1 Letter to our shArehoLders

PDF version www.siemens.com/ar-pdf
Website www.siemens.com/annual-report
Mobile application www.siemens.com/ar-moBile
Annual Shareholders’ Meeting www.siemens.com/agm
The world of Siemens’ Annual Report
Ke
y fi
gu
res /
Seg
men
t in
form
atio
n
2
Our first report takes us to Bangalore, India, where explosive growth is pushing the local infrastructure
to its limits. In planning a new airport for the booming South Asian metropolis and its surrounding
region, the operators selected Siemens to supply a complete tailor-made solution and provide long-
term technical support. This close partnership is a sign of enormous trust, since it entails tremendous
responsibility: the reliable operation of such vital infrastructure facilities is indispensible for the
Bangalore region’s further economic development.
From India, we move on to the town of Beuren in southern Germany, where our technology has helped
give a young cancer patient new hope. In a long-term partnership, our engineers cooperated with
doctors at Tübingen University Hospital to develop the Biograph mMR scanner, which enables physi-
cians to monitor the impact of cancer therapies while minimizing radiation exposure. To the relief of
15-year-old Christian and his family, the Biograph mMR showed that his treatment had been success-
ful. And we’re very pleased to report that – after a year of uncertainty – the young man is back in school
and again leading a normal life.
A third report provides impressive evidence of how our IT-based services are uniting people all around
the world. Johannes Zuckschwerdt is responsible for developing new services for a manufacturer
of highly specialized machine tools in southwestern Germany. His customer, Ton de Bruine, heads a
company that produces metal components in the Netherlands. Thanks to our ePS Network Services,
Zuckschwerdt can monitor the operation of de Bruine’s machines remotely, via an encrypted online
server. By notifying his customer when machine parts need to be replaced and indicating how work-
flows can be improved and production increased, Zuckschwerdt saves de Bruine time and money
while helping him meet tight deadlines and enhance the efficiency of his production processes.
In a fourth report, you’ll meet Jens Hald Jensen, head of the project team that’s assembling and testing
six-megawatt wind turbines in the Danish town of Østerild. These powerful turbines are just one of
the innovative products and solutions we’re creating to help shape the future of energy and tap the
opportunities that Germany ’s transition to a new energy system will provide in many other countries
worldwide. We want to pass on to our children a world that’s as healthy, bountiful and beautiful as
the one we’ve inherited. And we’re convinced that we’ll reach this goal if business leaders and govern-
ment policymakers work together to tackle the challenges ahead, taking a balanced, targeted approach
to achieving a reliable, clean and affordable energy supply.
I urge you to take a look at all five special reports. They ’ll provide you with an inside look at our day-to-
day operations and at the ways we’re leveraging our strengths as an integrated technology company,
increasing our customers’ competitiveness, reinforcing our own business success and improving the
lives of people worldwide through our investments in research and development – investments that
totaled €4.2 billion in fiscal 2012.

7
C
on
ten
ts F
inan
cial
Rep
ort
Contents FinanCial RepoRt
A. To our ShareholdersA.1 1 Letter to our ShareholdersA.2 10 Managing Board of Siemens AGA.3 12 Report of the Supervisory BoardA.4 18 The Siemens share / Investor relations
B. Corporate GovernanceB.1 22 Corporate Governance ReportB.2 28 Corporate Governance statement pursuant to
Section 289a of the German Commercial Code (part of the Combined Management Report)
B.3 29 Compliance ReportB.4 31 Compensation Report
(part of the Combined Management Report)B.5 44 Takeover-relevant information (pursuant to Sections 289 para. 4 and
315 para. 4 of the German Commercial Code) and explanatory report (part of the Combined Management Report)
C. Combined Management ReportC.1 50 Business and economic environmentC.2 64 Financial performance measuresC.3 69 Results of operationsC.4 82 Financial positionC.5 93 Net assets positionC.6 95 Overall assessment of the economic positionC.7 96 Subsequent eventsC.8 97 SustainabilityC.9 111 Report on expected developments and
associated material opportunities and risksC.10 129 Compensation Report, Corporate Governance statement
pursuant to Section 289a of the German Commercial Code, Takeover-relevant information and explanatory report
C.11 130 Siemens AG (Discussion on basis of German Commercial Code)C.12 134 Notes and forward-looking statements
D. Consolidated Financial StatementsD.1 136 Consolidated Statements of IncomeD.2 137 Consolidated Statements of Comprehensive IncomeD.3 138 Consolidated Statements of Financial PositionD.4 139 Consolidated Statements of Cash FlowD.5 140 Consolidated Statements of Changes in EquityD.6 142 Notes to Consolidated Financial StatementsD.7 232 Supervisory Board and Managing Board
E. Additional InformationE.1 240 Responsibility statementE.2 241 Independent Auditors’ ReportE.3 243 Statement of the Managing BoardE.4 244 Five-year summaryE.5 246 GlossaryE.6 248 IndexE.7 250 Further information and information resourcesE.8 251 Financial calendarE.9 252 Company structure 3
Peter LöscherPresident and CEO of Siemens AG

PDF version www.siemens.com/ar-pdf
Website www.siemens.com/annual-report
Mobile application www.siemens.com/ar-moBile
Annual Shareholders’ Meeting www.siemens.com/agm
The world of Siemens’ Annual Report
Ke
y fi
gu
res /
Seg
men
t in
form
atio
n
4
Our goal – Excellence
We’re closely connected with people everywhere – with workers in factories, with the operators and
users of infrastructure facilities, with engineers in laboratories and research centers. And it’s because
we’re so closely connected with people in so many different regions and environments that we’re also
able to precisely gauge their needs and their technology requirements. We know, for instance, that
customers across the board are increasingly demanding tailor-made IT applications and software
solutions. And we’re the ideal partner to provide these solutions, since we have the necessary industry
expertise and products – in areas ranging from power plant controls and building management systems
to healthcare solutions and manufacturing technologies. NASA, the U.S. space agency, utilized IT of
this kind to develop the Mars rover Curiosity, whose fascinating images are yet further testimony to
our engineering excellence. We know the challenges posed by the restructuring of the world’s energy
supply. And we know the challenges facing today ’s city planners. To address these urban challenges,
we’ve been showcasing future-oriented solutions for the world’s fast-growing cities at the Crystal, our
urban development center in London, since September 2012. As a company that’s been internationally
oriented since its founding, we also know the world’s new high-growth markets: the BRIC countries
and the so-called second-wave countries like South Africa, Indonesia and Turkey. We’ve been active in
all four BRIC countries for more than 100 years. In Russia and South Africa, we’ve had operations for
over 150 years. Long-term partnerships like these build trust and create opportunities to promote
sustainable development on a local basis while generating profitable growth for our Company. All four
of our Sectors are exploiting these opportunities worldwide by continuing to sharpen their focus on
the megatrends of our globalized age – climate change, demographic change and urbanization. Our
Healthcare Sector has also profited from the rigorous implemen tation of Agenda 2013, the efficiency-
boosting program we launched in November 2011.
All in all, Siemens is well positioned to seize the opportunities of the future – as we demonstrated
again in fiscal 2012. Continuing a decade of substantially improved performance, we posted a 7%
increase in revenue and generated €5.2 billion in income from continuing operations, one of our
largest profits ever. I would like to thank Siemens employees around the world for their commitment
and their contribution to this success. As fiscal 2012 also confirmed, our earnings per share have
considerably increased over the last decade as well: still just €2.92 in 2002, they now total more than
€5. And thanks to our tradition of foresighted financial policies, we can be sure that our operations
will continue to have a very stable basis in the future.
But fiscal 2012 makes clear that we haven’t always adapted flexibly enough to changes in our markets
and in our market position, and we haven’t placed sufficient emphasis everywhere on continuously
improving our Company and driving its efficiency. New orders declined 10% during the year, and,
although we increased our revenue, we didn’t meet the targets we’d set for profitability relative to our
competitors.
Our review of fiscal 2012 shows that we’re good – but not as good as we can be. Looking to the future,
this means we’ll have to intensify our efforts in order to outpace our competitors once again and
achieve the results that we as Siemens employees and you as our shareholders have a right to expect
of our Company.

7
C
on
ten
ts F
inan
cial
Rep
ort
Contents FinanCial RepoRt
A. To our ShareholdersA.1 1 Letter to our ShareholdersA.2 10 Managing Board of Siemens AGA.3 12 Report of the Supervisory BoardA.4 18 The Siemens share / Investor relations
B. Corporate GovernanceB.1 22 Corporate Governance ReportB.2 28 Corporate Governance statement pursuant to
Section 289a of the German Commercial Code (part of the Combined Management Report)
B.3 29 Compliance ReportB.4 31 Compensation Report
(part of the Combined Management Report)B.5 44 Takeover-relevant information (pursuant to Sections 289 para. 4 and
315 para. 4 of the German Commercial Code) and explanatory report (part of the Combined Management Report)
C. Combined Management ReportC.1 50 Business and economic environmentC.2 64 Financial performance measuresC.3 69 Results of operationsC.4 82 Financial positionC.5 93 Net assets positionC.6 95 Overall assessment of the economic positionC.7 96 Subsequent eventsC.8 97 SustainabilityC.9 111 Report on expected developments and
associated material opportunities and risksC.10 129 Compensation Report, Corporate Governance statement
pursuant to Section 289a of the German Commercial Code, Takeover-relevant information and explanatory report
C.11 130 Siemens AG (Discussion on basis of German Commercial Code)C.12 134 Notes and forward-looking statements
D. Consolidated Financial StatementsD.1 136 Consolidated Statements of IncomeD.2 137 Consolidated Statements of Comprehensive IncomeD.3 138 Consolidated Statements of Financial PositionD.4 139 Consolidated Statements of Cash FlowD.5 140 Consolidated Statements of Changes in EquityD.6 142 Notes to Consolidated Financial StatementsD.7 232 Supervisory Board and Managing Board
E. Additional InformationE.1 240 Responsibility statementE.2 241 Independent Auditors’ ReportE.3 243 Statement of the Managing BoardE.4 244 Five-year summaryE.5 246 GlossaryE.6 248 IndexE.7 250 Further information and information resourcesE.8 251 Financial calendarE.9 252 Company structure 5
We aren’t anticipating any substantial boost from economic developments worldwide – at least not
in fiscal 2013. For this reason, it’s all the more important that we ourselves take effective action to
enhance our productivity, maintain the strong financial basis that’s always been our hallmark and
better adapt to the challenges of our markets and the global economy.
And that’s why we’ve launched Siemens 2014, a Company-wide program that will help us recapture a
leading competitive position within the next two years and thus continue to pursue our One Siemens
targets. Siemens 2014 will strengthen the One Siemens system, drive its implementation and reinforce
our strategy for achieving profitable growth and generating annual revenue of up to €100 billion. It
will also keep us on the same track for success that we’ve followed in recent years and that enabled us
to achieve record results in fiscal 2011.
Our goal is to raise our total Sectors profit from the latest figure of 9.5% to 12% by increasing our gross
productivity by about €6 billion.
To help us reach these targets, Siemens 2014 will apply five levers:
> First, we want to cut costs. To this end, we’re optimizing our procurement operations, improving
our global capacities and activities and enhancing the quality and efficiency of our processes and
project management.
> Second, we want to continuously strengthen our core business activities by, among other things,
making targeted acquisitions in key areas and scrutinizing our less profitable businesses to ensure
that they don’t burden our long-term performance.
> Third, we want to refine our sales setup and optimize our local market access worldwide while mak-
ing our organization more flexible and adjusting operations to regional conditions and potential.
> Fourth, we want to simplify our internal processes and regulations in order to provide our business
units with greater leeway for independent entrepreneurial action and partnering with customers.
For example, we’re substantially reducing the number of Company- and Sector-wide regulations for
our global and regional businesses.
> And fifth, we’re streamlining our global support infrastructure by eliminating redundant functions
and duplicate processes.
Our capital – Trust
The measures we’ve defined have been very carefully considered. We’ve made no secret of our Company ’s
weaknesses, and we’ve set transparent goals. To boost our competitiveness, we’ve assigned clear
responsibilities and taken steps to ensure that Siemens 2014 will be rigorously executed. Some meas-
ures have already been taken. For example, we’ve decided to tighten the focus of our portfolio
in the area of renewable energies, to exit from the water technologies business, which is highly frag-
mented by region, and to reinforce our market position in the area of vertical IT through the purchase
of LMS International NV, a leading supplier of industry software for lifecycle management. As these
moves demonstrate, the new Company-wide program is already having an impact and strengthening
the trust that our customers, the capital markets and you, our shareholders, have placed in us.
Over the next two years, we’ll keep you regularly informed of the steps we’re taking to implement it.
PDF version www.siemens.com/ar-pdf
Website www.siemens.com/annual-report
Mobile application www.siemens.com/ar-moBile
Annual Shareholders’ Meeting www.siemens.com/agm
The world of Siemens’ Annual Report
Ke
y fi
gu
res /
Seg
men
t in
form
atio
n
6
With your interests in mind, we’re proposing that OSRAM be publicly listed via a spinoff. We’re
convinced that OSRAM Licht AG will be an attractive company for investors since, as an independent
entity, it will operate even more successfully than before.
The share buyback program that we finalized at the beginning of November 2012 was also in your
interest. In the course of the buyback, we repurchased Company shares with a total value of
€2.9 billion. We financed the program primarily through bonds, and the interest rates we paid were
the lowest to date on the European capital market – yet further proof of the great trust that our
Company enjoys within the business community and beyond.
The unchanged dividend proposal of €3.00 that the Managing Board and the Supervisory Board will
make to the 2013 Annual Shareholders’ Meeting is also a sign of trust and continuity. We want you
to profit from the positive developments at our Company – and we want you to continue placing your
trust in us. Because Siemens is and will remain a strong company – for our customers worldwide,
for our employees, for our partners in the business and scientific communities, for our stakeholders
in society and particularly for you, our shareholders.
I’m looking forward to the challenges of the year ahead and to our continuing dialogue.
Peter Löscher
President and CEO of Siemens AG
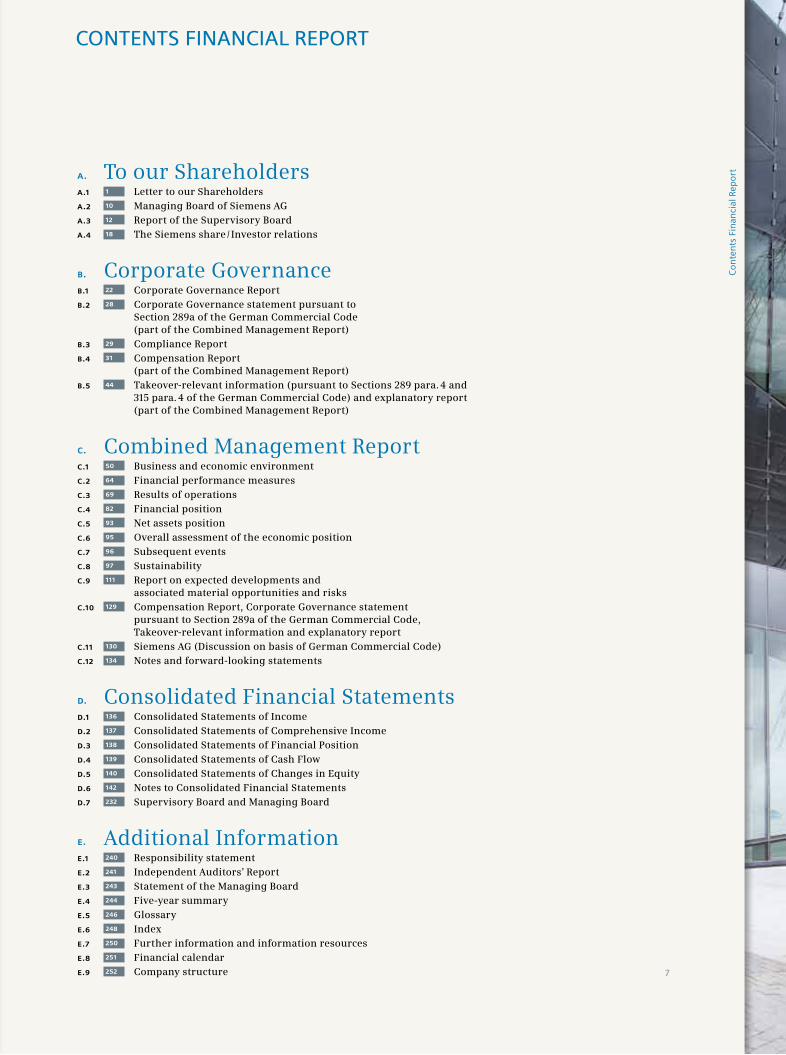
7
C
on
ten
ts F
inan
cial
Rep
ort
Contents FinanCial RepoRt
A. To our ShareholdersA.1 1 Letter to our ShareholdersA.2 10 Managing Board of Siemens AGA.3 12 Report of the Supervisory BoardA.4 18 The Siemens share / Investor relations
B. Corporate GovernanceB.1 22 Corporate Governance ReportB.2 28 Corporate Governance statement pursuant to
Section 289a of the German Commercial Code (part of the Combined Management Report)
B.3 29 Compliance ReportB.4 31 Compensation Report
(part of the Combined Management Report)B.5 44 Takeover-relevant information (pursuant to Sections 289 para. 4 and
315 para. 4 of the German Commercial Code) and explanatory report (part of the Combined Management Report)
C. Combined Management ReportC.1 50 Business and economic environmentC.2 64 Financial performance measuresC.3 69 Results of operationsC.4 82 Financial positionC.5 93 Net assets positionC.6 95 Overall assessment of the economic positionC.7 96 Subsequent eventsC.8 97 SustainabilityC.9 111 Report on expected developments and
associated material opportunities and risksC.10 129 Compensation Report, Corporate Governance statement
pursuant to Section 289a of the German Commercial Code, Takeover-relevant information and explanatory report
C.11 130 Siemens AG (Discussion on basis of German Commercial Code)C.12 134 Notes and forward-looking statements
D. Consolidated Financial StatementsD.1 136 Consolidated Statements of IncomeD.2 137 Consolidated Statements of Comprehensive IncomeD.3 138 Consolidated Statements of Financial PositionD.4 139 Consolidated Statements of Cash FlowD.5 140 Consolidated Statements of Changes in EquityD.6 142 Notes to Consolidated Financial StatementsD.7 232 Supervisory Board and Managing Board
E. Additional InformationE.1 240 Responsibility statementE.2 241 Independent Auditors’ ReportE.3 243 Statement of the Managing BoardE.4 244 Five-year summaryE.5 246 GlossaryE.6 248 IndexE.7 250 Further information and information resourcesE.8 251 Financial calendarE.9 252 Company structure

PDF version www.siemens.com/ar-pdf
Website www.siemens.com/annual-report
Mobile application www.siemens.com/ar-moBile
Annual Shareholders’ Meeting www.siemens.com/agm
The world of Siemens’ Annual Report
Ke
y fi
gu
res /
Seg
men
t in
form
atio
n
8
In September 2012, we opened our flagship sustainability center, the Crystal, in the heart of the London Docklands – a district that’s a pioneer in urban renewal.
The Crystal, London’s newest landmark, is home to an exhibition showcasing infrastructure solutions that are already making our cities more sustainable, environmentally friendly and livable. The moment you enter the Crystal, with its futuristic architecture and construction, you’ll see why this iconic structure is one of the most sustainable buildings in the world. Thanks to green technologies from our Environmental Portfolio, the Crystal meets the highest environmental standards, raising the bar for sustainable building.
Join us at the Crystal. Talk to our experts about the options and opportunities for sustainable city development. Explore some fascinating urban projects. And see for yourself what the future holds for the world’s metropolises.
www.thECrystAl.org
The Crystal – A vision of the urban future

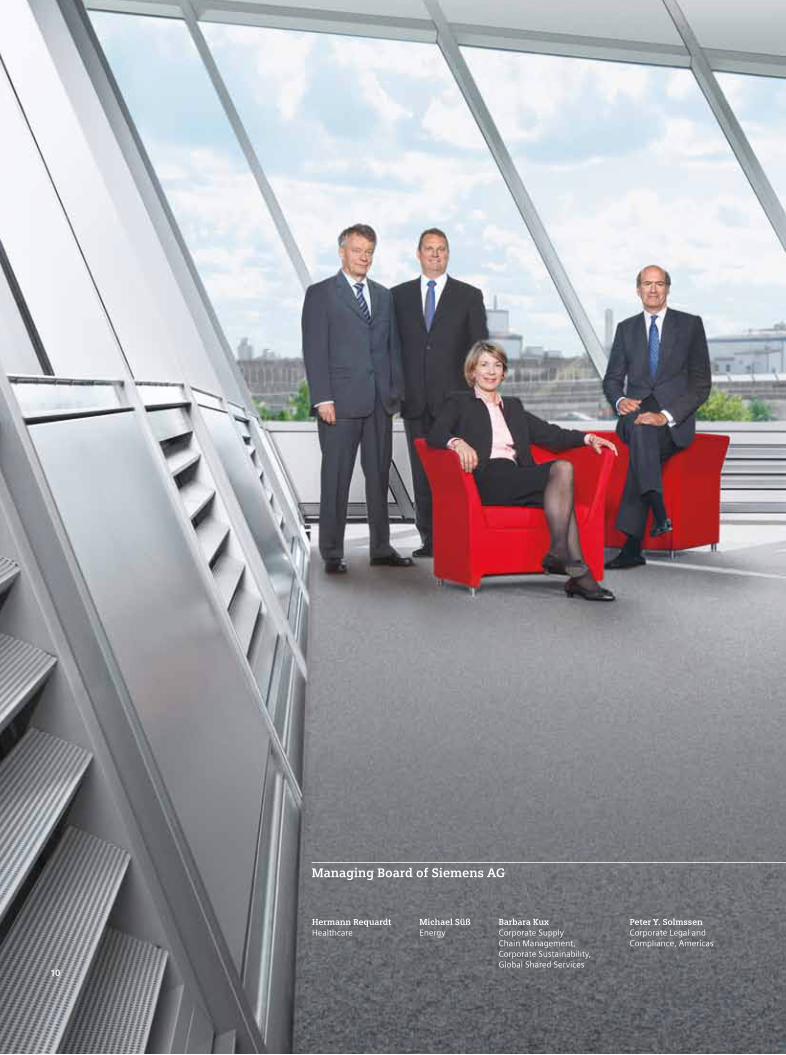
10
Barbara Kux Corporate Supply Chain Management, Corporate Sustainability, Global Shared Services
Michael SüßEnergy
Peter Y. Solmssen Corporate Legal and Compliance, Americas
Hermann RequardtHealthcare
Managing Board of Siemens AG

11
Joe Kaeser Corporate Finance and Controlling, Financial Services, Siemens Real Estate, Equity Investments
Peter Löscher – President and Chief Executive Officer Corporate Communications and Government Affairs, Corporate Development
Brigitte Ederer Corporate Human Resources, Europe, Commonwealth of Independent States
Siegfried Russwurm Industry, Corporate Information Technology, Africa, Middle East
Klaus Helmrich Technology, Corporate Technology
Roland Busch Infrastructure & Cities, Asia, Australia

12
In fiscal 2012, the Supervisory Board performed the duties assigned to it by law, the Siemens Articles
of Association and the Bylaws for the Supervisory Board. We regularly advised the Managing Board
on the management of the Company and monitored the Managing Board’s activities. We were directly
involved in all major decisions regarding the Company. In written and oral reports, the Managing
Board regularly provided us with timely and comprehensive information on Company planning and
business operations as well as on the strategic development and current state of the Company.
Deviations from business plans were explained to us in detail. The Managing Board coordinated with
us the Company ’s strategic orientation. On the basis of reports submitted by the Managing Board,
we considered in detail all business transactions of major significance to the Company. The proposals
made by the Managing Board were approved after detailed examination and consultation. We held
a total of six regular meetings.
In my capacity as Chairman of the Supervisory Board, I was in regular contact with the Managing Board
between Supervisory Board meetings and was kept up-to-date on current developments in the Com pany ’s
business situation and on key business transactions. At separate strategy meetings, I discussed with
the Managing Board the perspectives and future orientation of the Company ’s individual businesses.
Work in the Supervisory Board committees
To ensure the efficiency of its work, the Supervisory Board has a total of six standing committees, which
prepare the proposals for the Supervisory Board as well as the issues to be dealt with at the Board’s
plenary meetings. Where legally permissible, the Supervisory Board’s decision-making powers are also
delegated to these committees. The chairpersons of the committees report to the Supervisory Board
on the committees’ work at the subsequent Board meetings. The composition of the individual Super-
visory Board committees and the number of committee meetings and decisions are shown in chapter
D.7 SuperviSory BoarD anD Managing BoarD, pageS 234-235 below.
The Chairman’s Committee met six times in fiscal 2012. It also voted on five proposals using a
notional, or written, voting process. Between meetings, I discussed topics of particular importance
to the Com pany with the members of the Chairman’s Committee. The Committee dealt with corpo rate-
governance-related matters, including the Declaration of Conformity with the German Corporate
Governance Code, with the preparation of decisions concerning Managing Board compensation, with
the assump tion by Managing Board members of positions in other companies and institutions, and
Despite a difficult economic environment and special burdens in the project business, Siemens’ overall performance in fiscal 2012 was respectable.
Dear shareholders,
A.3 RepoRt of the supeRvisoRy boARd

13
A.3 RepoRt of the supeRvisoRy boARd
Dr. Gerhard Cromme Chairman

14
with a variety of personnel-related topics. The Committee endorsed a decision by the Managing Board
to issue warrant bonds with a value of up to US$5 billion and amended the Articles of Associa tion after
the Company ’s capital stock had been reduced as a result of the Managing Board’s decision to retire
treasury stock that had been acquired as part of a share buyback program.
The Mediation Committee was not required to meet in fiscal 2012.
The Finance and Investment Committee met three times. It also voted on five proposals using
a notional, or written, voting process. The focuses of its meetings included the preparation of the
decision regarding the budget for fiscal 2012, the further development of the Company ’s medium-
term strategy, the Company ’s pension system and the approval of Company investment projects.
The Audit Committee met six times. In the presence of the independent auditors, the President and
Chief Executive Officer, the Chief Financial Officer and the General Counsel, the Committee discussed
the financial statements and the Combined Management Report for Siemens AG and Siemens world-
wide, the proposal for the appropriation of net income and the Annual Report on Form 20-F for the
U.S. Securities and Exchange Commission (SEC). In addition, the Audit Committee made a recommen-
dation to the Supervisory Board regarding the Supervisory Board’s proposal to the Annual Shareholders’
Meeting concerning the election of the independent auditors. The Audit Committee also gave in-depth
consideration to the appointment of the independent auditors for fiscal 2012, to monitoring the audi-
tors’ independence and qualifications as well as the additional services they perform, to determining
their fee and to the audit reviews of the Company ’s quarterly financial reports and the half-year finan-
cial report. In addition, the Audit Committee dealt with the Company ’s financial reporting process
and risk management system and with the effectiveness, resources and findings of the internal audit
as well as with reports concerning potential and pending legal disputes. The Audit Committee also
focused on Company compliance with the provisions of Section 404 of the Sarbanes-Oxley Act (SOA)
and on the internal audit of the effectiveness of our internal controls, regulatory com pliance and the
integrity of our financial reporting.
The Compliance Committee met five times in fiscal 2012. At its meetings, which were generally attended
by Dr. Theodor Waigel in his capacity as Monitor, the Committee discussed primarily the quarterly reports
and the annual report submitted by the Chief Compliance Officer and the Chief Counsel Compliance.
The Committee also concerned itself with the preparation of the communications measures to be imple-
mented in connection with the conclusion of the Monitorship.
The Nominating Committee met six times in fiscal 2012 in order to prepare the election of the
Supervisory Board’s shareholder representatives by the Annual Shareholders’ Meeting of Siemens AG
on January 23, 2013. When preparing the list of candidates to be proposed to the Supervisory Board,
the Nominating Committee took into account the requirements of the German Stock Corporation Act,
the German Corporate Governance Code and the Bylaws for the Supervisory Board as well as the
goals that the Supervisory Board had set for its own composition. The Nominating Committee consid-
ered, in particular, the character, integrity, commitment, professionalism and independence of the
indivi duals recommended for nomination. With a view to the Company ’s international orientation,
the Nominating Committee attached particular importance to ensuring that a sufficient number of
members had extensive international experience. It also endeavored to ensure that the participation
of women was appropriate and that at least six shareholder representatives on the Supervisory Board

15
were independent in the meaning of Section 5.4.2 of the German Corporate Governance Code. The
Nominating Committee recommended that the Supervisory Board propose to the Annual Shareholders’
Meeting on January 23, 2013 that Dr. Gerhard Cromme, Dr. Josef Ackermann, Gerd von Brandenstein,
Michael Diekmann, Dr. Hans Michael Gaul, Prof. Dr. Peter Gruss and Dr. Nicola Leibinger-Kammüller be
reelected and that Gérard Mestrallet, Güler Sabancı and Werner Wenning be elected for the first time
to serve as shareholder representatives on the Supervisory Board. At an election held on September 25,
2012 in accordance with the provisions of the German Codetermination Act, the following indivi duals
were elected to serve as employee representatives on the Supervisory Board, effective the end of
the Annual Shareholders’ Meeting on January 23, 2013: Berthold Huber, Lothar Adler, Bettina Haller,
Hans-Jürgen Hartung, Robert Kensbock, Harald Kern, Jürgen Kerner, Dr. Rainer Sieg, Birgit Steinborn
and Sibylle Wankel.
Topics at the plenary meetings of the Supervisory Board
Regular topics of discussion at the Supervisory Board’s plenary meetings were revenue, profit and
employment development at Siemens AG, at the Sectors and at Siemens worldwide as well as the
Company ’s financial position, profitability and major investment and divestment projects. The Manag-
ing Board reported to us regularly and comprehensively on Company planning and on the Company ’s
strategic development, business operations and current situation.
At our meeting on November 9, 2011, we discussed the key financial figures for fiscal 2011 and approved
the budget for 2012. We also determined the compensation of Managing Board members for fiscal 2011
on the basis of their achievement of performance-related targets. The appropriateness of this compen-
sation was confirmed by an independent compensation consultant.
At our meeting on November 30, 2011, we primarily discussed the financial statements and the Com-
bined Management Report for Siemens AG and Siemens worldwide as of September 30, 2011 as well as
the agenda for the Annual Shareholders’ Meeting on January 24, 2012. We also discussed the Annual
Report for 2011 – in particular, the “Corporate Governance report” included therein – and established
the targets for Managing Board compensation in fiscal 2012.
At our meeting on January 23, 2012, the Managing Board reported on the Company ’s business and
financial position following the conclusion of the first quarter. We also conducted by-elections for the
Audit Committee and the Finance and Investment Committee.
At our meeting on April 24, 2012, the Managing Board reported on the Company ’s business and finan-
cial position following the conclusion of the second quarter of fiscal 2012. In addition, the Energy
Sector reported on the situation in its business. We also discussed profit protection measures with the
Managing Board.
At our meeting on July 25, 2012, we discussed the Company ’s business and financial position follow-
ing the conclusion of the third quarter and decided to approve the Managing Board’s plan to acquire
Siemens shares in order to retire them, offer them for purchase to employees, members of the govern-
ing bodies of Affiliated Companies and members of the Managing Board and / or use them to service
convertible bonds or warrant bonds. In addition, we concerned ourselves with the new version of the
German Corporate Governance Code of May 15, 2012. The Healthcare Sector also reported on the
situation in its business.

16
At our meeting on September 19, 2012, the Managing Board provided us with an overview of the
current state of the Company. On the occasion of the opening of an information and dialogue center
for urban development in London, the Infrastructure & Cities Sector reported on the situation in its
business. In addition, the Regional Company reported on business development in the UK. We were
also provided with an overview of the activities of Siemens Corporate Technology and approved the
acquisition of LMS International NV, Leuven (Belgium). LMS International NV is a leading provider of
industry software for the testing and mechatronic simulation of complex products.
Corporate Governance Code
The Supervisory Board concerned itself with the provisions of and amendments to the German Corpo-
rate Governance Code. At our meeting on July 25, 2012, we discussed the amendments to the German
Corporate Governance Code contained in the new version of May 15, 2012. At our subsequent meeting
on September 19, 2012, the Bylaws for the Supervisory Board were amended to take into account the
requirements of the new version of the Code. In addition, we adjusted the concrete goals for the Super-
visory Board’s composition – which are set out in chapter B.1 Corporate governanCe report, pageS 22-25
below – in order to take those requirements into account and determined that, in our estimation, the
Super visory Board had an appropriate number of independent members. Information on corporate
governance at the Company and a detailed report on the level and structure of the compensation paid
to the members of the Supervisory and Managing Boards is provided in chapter B.4 CoMpenSation
report, pageS 31-43 below. At their meetings on September 10 and 19, 2012, respectively, the Managing
Board and the Supervisory Board approved the issuance of an unqualified Declaration of Confor mity
pursuant to Section 161 of the German Stock Corporation Act (Aktiengesetz), stating that the Company
complies with all the recommendations of the German Corporate Governance Code in the version of
May 15, 2012 and will continue to do so in the future. The exception mentioned in the Declaration of
Conformity of October 1, 2011 – namely, that the current compensation rules for the Supervisory Board
do not stipulate a per formance-related compensation component – no longer applies since the new
version of the Code no longer includes a recommendation regarding the performance-related compen-
sation of supervisory board members. Siemens’ Declaration of Conformity with the German Corporate
Governance Code is permanently available to shareholders on the Company ’s website.
Detailed discussion of the financial statements
Ernst & Young GmbH Wirtschaftsprüfungsgesellschaft audited the Annual Financial Statements of
Siemens AG, the Consolidated Financial Statements of Siemens worldwide and the Combined Manage-
ment Report for Siemens AG and Siemens worldwide for the fiscal year ended September 30, 2012 in
accordance with the requirements of the German Commercial Code (HGB) and approved them without
reservation. The Annual Financial Statements of Siemens AG and the Combined Management Report
for Siemens AG and Siemens worldwide were prepared in accordance with the requirements of German
commercial law. The Consolidated Financial Statements of Siemens worldwide were prepared in
accordance with the International Financial Reporting Standards (IFRS), as adopted by the European
Union (EU), and with the additional requirements set out in Section 315a (1) of the German Commercial
Code (HGB). The financial statements also comply with the IFRS, as issued by the International
Accounting Standards Board (IASB). The independent auditors conducted their audit in accordance
with Section 317 of the HGB and in compliance with the generally accepted German standards for the
audit of financial statements promulgated by the Institut der Wirtschaftsprüfer (IDW) and with the
International Standards on Auditing (ISA). The above-mentioned documents as well as the Managing
Board’s proposal for the appropriation of net income were submitted to us by the Managing Board in a

17
timely manner. The Audit Committee discussed the Managing Board’s proposal for the appropriation of
net income in detail at its meeting on November 6, 2012. The Committee discussed the Annual Financial
Statements of Siemens AG, the Consolidated Financial Statements of Siemens worldwide and the
Combined Management Report in detail at its meeting on November 27, 2012.
The audit reports prepared by Ernst & Young GmbH Wirtschaftsprüfungsgesellschaft were distributed
to all members of the Supervisory Board and comprehensively reviewed at our meeting on November 28,
2012 in the presence of the independent auditors, who reported on the main findings of their audit.
The independent auditors also reported that there were no major weaknesses in the Company ’s internal
audit or risk management systems. At this meeting, the Managing Board explained the financial state-
ments of Siemens AG and Siemens worldwide as well as the Company ’s risk management system. The
independent auditors also discussed the scope, focal points and costs of the audit.
We concur with the results of the audit. Following the definitive findings of the examination by the
Audit Committee and our own examination, we have no objections. The Managing Board prepared the
Annual Financial Statements of Siemens AG and the Consolidated Financial Statements of Siemens
worldwide. We adopted the Annual Financial Statements and approved the Consolidated Financial State-
ments. We endorse the Managing Board’s proposal that the net income available for distribution be
used to pay out a dividend of €3.00 per share entitled to a dividend and that the amount of net income
attributable to shares of stock not entitled to receive a dividend for fiscal 2012 be carried forward.
Changes in the composition of the Supervisory and Managing Boards
Dieter Scheitor resigned from the Supervisory Board, effective the end of the regular Annual Share-
holders’ Meeting on January 24, 2012. Effective January 25, 2012, Jürgen Kerner was appointed to the
Supervisory Board by court order. At the Supervisory Board meeting on January 23, 2012, Mr. Kerner
was elected to succeed Mr. Scheitor as employee representative on the Audit Committee and the Finance
and Investment Committee, effective January 25, 2012. The Supervisory Board would like to thank
Mr. Scheitor for his many years of loyal support.
There were no changes in the composition of the Managing Board in fiscal 2012.
The Supervisory Board would like to thank the members of the Managing Board as well as the employees
and the employee representatives of all Siemens companies for their work.
For the Supervisory Board
Dr. Gerhard Cromme
Chairman
Berlin and Munich, November 28, 2012

1 A. To our Shareholders 49 C. Combined Management Report 21 B. Corporate Governance
1 A.1 Letter to our Shareholders 10 A.2 Managing Board of Siemens AG 12 A.3 Report of the Supervisory Board 18 A.4 The Siemens share / Investor relations
18
The Siemens share price developed positively over the course of fiscal 2012. However, the markets were volatile during this period due to ongoing uncertainty in the eurozone. After in-creasing at the beginning of the fiscal year, stock markets in general and the Siemens share price in particular declined for several months. Then, in June 2012, a positive stock market trend began. This trend continued until the end of fiscal 2012. In August 2012, the Company launched a share buyback program. From the start of the buyback program until the end of the fiscal year, the Siemens share price gained more than 13%.
In the last few years, we have increased our dividend several times – in some cases substantially – from €1.60 per share in fiscal 2009 to €3.00 per share in fiscal 2011. In line with the div-idend policy of the One Siemens framework, we intend for our shareholders to profit significantly from Siemens’ financial success again this year. As a result, the Managing Board and Supervisory Board will propose a dividend payment of €3.00 per share for fiscal 2012, representing a payout ratio of 56%. Siemens AG continues to have a very sound financial basis. In an environment in which the ratings of many countries have come under pressure, the Company continues to enjoy good investment-grade credit ratings. In the course of the above-mentioned share buyback program, we repurchased shares up to the end of November 2012 with a value of about €2.9 billion. In September 2012, the Company also retired some 33.2 million of its own shares, thereby reducing its capital stock from about 914 million shares to 881 million.
A.4.1 Stock markets – Siemens share price increases
Reflecting economic developments, the stock market envi-ronment was characterized by continuously increasing share prices during the first four months of fiscal 2012 (October 1, 2011 to January 31, 2012). These gains were then lost in the following months, with prices bottoming out in June 2012.
The markets subsequently recovered steadily from this trough, again reaching their previous high for the year toward the end of fiscal 2012.
Over the entire fiscal year, Siemens stock performed compara-tively well in this market environment, closing at €77.61 per share on September 30, 2012. For shareholders who reinvested their dividends, this amounted to a gain of 18.6% (fiscal 2011: a loss of 9.5%) compared to the closing price a year earlier. The Siemens share performed somewhat more weakly than the leading international index, MSCI World (which rose 21.6%), and remained noticeably behind the leading index of the German stock market, the DAX (which advanced 31.2%).
Long-term performance of SiemenS ShareScompared with Leading indiceS (AverAge AnnuAl performAnce with dividends reinvested)
Ten-year period FY 2003 – FY 2012
Siemens 11.3%
DAX® 10.1%
MSCI World 8.0%
A long-term comparison illustrates the strength of the Siemens share: the assets of an investor who acquired Siemens stock worth €1,000 at the beginning of fiscal 2003 and reinvested the dividends in additional Siemens shares would have in-creased to €2,911 by the end of fiscal 2012. This annual return of 11.3% is noticeably above the corresponding results for the DAX 30 (+10.1%) and MSCI World (+8.0%).
A.4.2 Stable dividend proposed
At the Annual Shareholders’ Meeting, the Managing Board and the Supervisory Board will propose a dividend payment of €3.00. After the substantial dividend increases in fiscal 2010
A.4 the siemens shAre / investor relAtions
change in the vaLue of an inveStment in SiemenS ShareS in fiScaL 2012 (with dividends reinvested; indexed)
in % September 30, 2011 September 30, 2012
140
130
120
110
100
90
80
70
Siemens DAX® MSCI World

135 D. Consolidated Financial Statements 239 E. Additional Information19
and fiscal 2011, this proposal reflects our earnings position in fiscal 2012 and is in strict accordance with our payout policy. Representing a payout ratio of 56%, this proposal continues our tradition of paying attractive dividends to our investors.
A.4.3 Share buyback program and reduction of capital stock
In August 2012, against the backdrop of favorable capital market conditions, Siemens optimized its capital structure and initiated a buyback of Company stock with a value of approximately €2.9 billion. Under this program, which was finalized on November 7, 2012, a total of about 38 million shares were acquired at an average price of €76.90 per share. The repur-chased shares can be used to cancel and reduce capital stock, to issue shares to employees, the board members of Affiliated Companies and members of the Managing Board and to service convertible bonds and warrant bonds. The share buyback was financed through long-term debt.
In addition to the share buyback program, the Company also retired approximately 33.2 million of its own shares in Septem-ber 2012, thereby reducing its capital stock from about 914 mil-lion shares to 881 million.
A.4.4 Shareholder structure
With some 740,000 shareholders, Siemens AG is one of the world’s largest publicly owned companies. An analysis of our shareholder structure conducted in August 2012 showed that shareholders in Germany hold the largest percentage of our share capital, about 30% of all outstanding shares. Sharehold-ers in the U.S. hold roughly 16% and shareholders in the U.K., around 9%, while investors in France and Switzerland hold 8% and 6%, respectively.
Some 59% of Siemens’ outstanding shares are currently held by institutional investors, about 20% by private shareholders and around 6% by members of the Siemens family.
A.4.5 Credit ratings
Siemens AG has good, investment-grade credit ratings: “Aa3/P-1/outlook stable” from Moody’s Investors Service and “A+/A-1+/outlook stable” from Standard & Poor’s are very posi-tive ratings – particularly when compared to those of our com-petitors in the industry segment. Our solid financial position gives us unrestricted access to the international financial and capital markets.
dividend
Fiscal year FY 2012 FY 2011 FY 2010 FY 2009 FY 2008
Dividend per share (in €) 3.001 3.00 2.70 1.60 1.60
Dividend yield (in %) 2 3.9 3.9 2.9 2.4 3.6
Ex-dividend date Jan. 24, 2013 Jan. 25, 2012 Jan. 26, 2011 Jan. 27, 2010 Jan. 28, 2009
Net income (in millions of €) 4,590 6,321 4,068 2,497 5,886
Total dividend payout (in millions of €) 2,5283 2,629 2,356 1,388 1,380
Payout ratio (in %) 4 56 41 58 56 23
1 To be proposed to the Annual Shareholders’ Meeting
2 Dividend payout / Siemens share price on day of Annual Shareholders’ Meeting; for fiscal 2012: dividend payout / Siemens share price at fiscal year-end
3 Based on currently estimated number of shares entitled to dividend payment
4 Excluding non-cash items in fiscal 2009 and fiscal 2010 (NSN and DX impairment charges), the payout ratio equaled 34% in fiscal 2009 and 46% in fiscal 2010
inveStor type and regionaL diStribution
1 This figure includes a 5.02% stake in Siemens’ capital stock held by BlackRock Holdco 2, Inc., Wilmington, U.S., a 5.01% stake in Siemens’ capital stock held by BlackRock, Inc., New York, U.S., and a 3.04% stake in Siemens’ capital stock held by the State of Qatar, Doha, Qatar (represented by the DIC Company Limited, George Town, Grand Cayman), as reported to us by these organizations.
2 This figure includes a 1.30% stake in Siemens capital stock for which the von Siemens-Vermögensverwaltung GmbH exercises voting rights under powers of attorney and a 3.03% stake held by the Werner von Siemens Stiftung, Zug, Switzerland, as reported to us by the Stiftung.
Rest of Europe: 7%
Germany: 30%
U.S.: 16%
U.K.: 9%
Unidentified: 15%
France: 8%
Switzerland: 6%
Unidentified investors: 15%
Institutional investors: 59% 1
Private investors: 20%
Siemens family members: 6% 2
Rest of world: 9%

20
At the end of fiscal 2012, the net debt of Siemens AG was €9,292 million, with cash and cash equivalents of €10,891 mil-lion. For further information on our credit ratings and financial obligations, please see note 28 to the conSoLidated financiaL
StatementS, pageS 190-191.
credit ratingS
September 30, 2012 September 30, 2011
Moody’sInvestors
ServiceStandard &
Poor’s
Moody’sInvestors
ServiceStandard &
Poor’s
Long-term debt Aa3 A + A1 A +
Short-term debt P -1 A -1+ P -1 A -1+
A.4.6 Siemens on the capital market
We take our responsibility to maintain an intensive dialogue with the capital market very seriously. Cultivating close con-tacts with our shareholders, we keep them informed of all ma-jor developments throughout Siemens.
As part of our investor relations work, we provide information on the Company’s development in quarterly, semiannual and annual reports. Our CEO and CFO also maintain close contact with investors through roadshows and conferences. In addi-tion, Siemens holds Sector Capital Market Days, at which the management of our Sectors informs investors and analysts about the Sectors’ business strategies and market environ-ments.
We also provide extensive information online. Quarterly, semi-annual and annual reports, analyst presentations, press re-leases and our financial calendar for the current year (please see financiaL caLendar, page 251), which includes all major publication dates as well as the date of the Annual Share-holders’ Meeting, are available at
www.SiemenS.com/inveStorS
Stock market information (in €, unless otherwise indicAted)
FY 2012 1 FY 2011 1
Stock price range (Xetra closing price)
High 79.71 99.38
Low 63.06 64.45
Fiscal year-end 77.61 68.12
Number of shares issued (September 30, in millions) 881 914
Market capitalization (in millions of €) 2 66,455 59,554
Basic earnings per share (from continuing operations) 3 5.77 8.23
Diluted earnings per share (from continuing operations) 3 5.71 8.14
Dividend per share 3.004 3.00
1 Fiscal year from October 1 to September 30
2 On the basis of outstanding shares
3 Regarding activities classified as discontinued operations, prior periods are presented on a comparable basis.
4 To be proposed to the Annual Shareholders’ Meeting
A.4.7 Profit-sharing culture/ Stock-based compensation programs
Siemens has set itself the goal of more intensively fostering a profit-sharing culture at the Company and encouraging em-ployees to become shareholders. That’s why we offer various share-based payment programs to our employees. In fiscal 2012, 5,225,138 Siemens shares were issued to service these programs, namely, the Stock Awards program, the Share Matching Program (including the Base Share Program, the Share Matching Plan and the Monthly Investment Plan) and the Jubilee Program. Non-vested and outstanding grants under the various plans will result in additional share issuances to em-ployees in the future. For more detailed information on share-based payment, please see note 33 to the conSoLidated
financiaL StatementS, pageS 208-211.
Our Company-wide Share Ownership Guidelines specify that the members of the Managing Board and roughly 550 senior executives must hold an interest in Siemens equal in value to between 50% and 300% of their base compensation for the period in which they hold office. For further information on our employee share programs, please see note 33 to the
conSoLidated financiaL StatementS, pageS 208-211.

22 B.1 Corporate Governance Report 22 B.1.1 Management and control structure
25 B.1.2 Purchase or sale of the Company’s shares
26 B.1.3 Shareholder relations
26 B.1.4 Significant differences between Siemens’ corporate governance and NYSE Corporate Governance Standards
28 B.2 Corporate Governance statement pursuant to Section 289a of the German Commercial Code (part of the Combined Management Report)
29 B.3 Compliance Report 29 B.3.1 Our compliance priorities
29 B.3.2 Integrity dialogue – Communication between managers and employees
30 B.3.3 Compliance risk assessments at business units
30 B.3.4 Collective action – Supporting business success through fair competition
31 B.4 Compensation Report (part of the Combined Management Report)
31 B.4.1 Remuneration of members of the Managing Board
42 B.4.2 Remuneration of members of the Supervisory Board
43 B.4.3 Other
44 B.5 Takeover-relevant information (pursuant to Sections 289 para. 4 and 315 para. 4 of the German Commercial Code) and explanatory report (part of the Combined Management Report)
B. Corporate Governance
B.
Co
rpo
rate
Go
vern
ance
1 A. To our Shareholders 21 B. Corporate Governance
22 B.1 Corporate Governance Report 28 B.2 Corporate Governance statement pursuant to
Section 289a of the German Commercial Code (part of the Combined Management Report)
29 B.3 Compliance Report
31 B.4 Compensation Report (part of the Combined Management Report)
44 B.5 Takeover-relevant information (pursuant to Sections 289 para. 4 and 315 para. 4 of the German Commercial Code) and explanatory report (part of the Combined Management Report)
22
Good corporate governance is the basis for our decision-mak-ing and control processes and comprises responsible, value-based management and monitoring focused on long-term suc-cess, goal-oriented and efficient cooperation between our Managing and Supervisory Boards, respect for the interests of our shareholders and employees, transparency and responsi-bility in all our entrepreneurial decisions and an appropriate risk management system.
Siemens AG fully complies with all recommendations of the German Corporate Governance Code (Code) in the version of May 15, 2012.
The Managing Board and the Supervisory Board of Siemens AG have discussed compliance with the Code’s recommendations in detail. Based on their deliberations, the boards have ap-proved the annual Declaration of Conformity as of October 1, 2012. This document is posted on our website and available on
page 28.
Siemens voluntarily complies with the Code’s non-binding suggestions, with the following exception:
> In fiscal 2011, the Supervisory Board decided to appoint Dr. Roland Busch, Klaus Helmrich and Dr. Michael Süß to the Managing Board, each for a term of five years, and therefore to no longer follow the suggestion set out in Section 5.1.2 para. 2 sentence 1 of the Code, according to which the maxi-mum possible appointment period of five years should not be the rule for first-time appointments to a managing board.
Our listing on the New York Stock Exchange (NYSE) subjects us to a number of provisions under U.S. securities laws (in-cluding the Sarbanes-Oxley Act (SOA) as well as to the rules and regulations of the U.S. Securities and Exchange Commis-sion (SEC) and the NYSE. To facilitate our compliance with the SOA, we have, among other things, a Disclosure Committee in place, comprising the heads of a number of our Corporate Units. This committee is responsible for reviewing certain fi-nancial and non-financial information and advising our Man-aging Board in its decisions regarding disclosure. We also have procedures in place that require the members of the manage-ment of our Sectors, Divisions, Financial Services, Cross-Sec-tor Services, Regional Clusters and certain Corporate Units – supported by certifications provided by the management of entities under their direction – to confirm to us the correct-ness of the financial data that they have reported to Siemens’ corporate headquarters and the effectiveness of the related control systems. Their confirmation provides a basis for our CEO and CFO to certify our financial statements to the SEC. Consistent with the requirements of the SOA, we have proce-
dures for handling accounting complaints in place as well as a Code of Ethics for Financial Matters. This Code of Ethics for Financial Matters was last updated in 2010.
B.1.1 Management and control structure
B.1.1.1 SUpeRVISORY BOaRDSiemens AG is subject to German corporate law. It has a two-tier board structure, consisting of a Managing Board and a Su-pervisory Board. As required by the German Codetermination Act (Mitbestimmungsgesetz), the Company ’s shareholders and its employees each select one-half of the Super visory Board’s members. The term of office of the current members of the Supervisory Board will expire at the close of the Annual Shareholders’ Meeting 2013.
The Supervisory Board first defined the objectives for its com-position in fiscal 2010. At its meeting on September 19, 2012, it modified these objectives in order to bring them into line with Section 5.4.1 of the amended Code of May 15, 2012 and reap-proved them as follows:
> The composition of the Supervisory Board of Siemens AG shall be such that qualified control and advising for the Managing Board is ensured. The candidates proposed for election to the Supervisory Board shall have the expertise, skills and professional experience necessary to carry out the functions of a Supervisory Board member in a multinational company and safeguard the reputation of Siemens in public. In particular, care shall be taken in regard to the personality, integrity, commitment, professionalism and independence of the individuals proposed for election. The goal is to en-sure that, in the Supervisory Board, as a group, all know-how and experience is available that is considered essential in view of Siemens’ activities.
> Taking the Company ’s international orientation into ac-count, care shall also be taken to ensure that the Super-visory Board has an adequate number of members with extensive international experience. The goal for the next Supervisory Board election in 2013 is to make sure that the present considerable share of Supervisory Board members with international background is maintained.
> In its election proposals, the Supervisory Board shall also pay particular attention to the appropriate participation of women. Qualified women shall already be included in the initial process of selecting potential candidates for new elec-tions or for the filling of Supervisory Board positions that have become vacant and shall be considered, as appropriate, in nominations. There are currently four women on our Supervisory Board. Our goal is, at the minimum, to maintain
B.1 Corporate GovernanCe report

49 C. Combined Management Report 239 E. Additional Information 135 D. Consolidated Financial Statements23
and, if possible, to increase this number at the next Super-visory Board election in 2013. It is also intended that a woman join the Nominating Committee following this Supervisory Board election.
> An adequate number of independent members shall belong to the Supervisory Board. Material and not only temporary conflicts of interest, such as organizational functions or ad-visory capacities with major competitors of the company, shall be avoided. Under the presumption that the mere exer-cise of Supervisory Board duties as an employee representa-tive gives no cause to doubt the compliance with the inde-pendence criteria pursuant to Section 5.4.2 of the Code, the Supervisory Board shall have a minimum of sixteen mem-bers who are independent in the meaning of the Code. In any case, the Supervisory Board shall be composed in such a way that a number of at least six independent shareholder representatives in the meaning of Section 5.4.2 of the Code is achieved. In addition, the Supervisory Board members shall have sufficient time to be able to devote the necessary regularity and diligence to their mandate.
> The age limitation established in the Bylaws of the Supervi-sory Board will be taken into consideration. In addition, no more than two former members of the Managing Board of Siemens AG shall belong to the Supervisory Board.
The status of implementation of these objectives can be sum-marized as follows: On September 25, 2012, three women were elected, pursuant to the German Codetermination Act’s provi-sions regarding the election of employee representatives to a supervisory board,to serve as employee representatives on Siemens’ Supervisory Board. Their terms of office will begin at the close of the Annual Shareholders‘ Meeting on January 23, 2013. In fiscal 2012, the Nominating Committee met six times in order to prepare the election of the Supervisory Board’s shareholder representatives by the Annual Shareholders’ Meet-ing 2013. In proposing candidates to the Supervisory Board, the Nominating Committee took into account not only the re-quirements of the German Stock Corporation Act, the Code and the Bylaws for the Supervisory Board but also the Super-visory Board’s objectives for its composition. On the basis of the Nominating Committee’s the Supervisory Board will pro-pose that the Annual Shareholders’ Meeting 2013 elect as shareholder representatives on the Supervisory Board several candidates who are currently engaged in international activi-ties and/or have many years of international experience. The candidates will include two women, one of whom is intended to join the Nominating Committee following the Supervisory Board election.
Some Supervisory Board members hold – or have held in the past year – high-ranking positions at other companies with
which Siemens does business. Nevertheless, transactions be-tween Siemens and such companies are carried out on an arm’s length basis. We believe that these transactions do not compromise the independence of the Supervisory Board mem-bers in question.
The Supervisory Board oversees and advises the Managing Board in its management of the Company ’s business. At regu-lar intervals, the Supervisory Board discusses business devel-opment, planning, strategy and implementation. It reviews the Annual Financial Statements of Siemens AG, the Consoli-dated Financial Statements of Siemens worldwide, Manage-ment Reports of these financial statements and the proposal for the appropriation of net income. It also discusses Siemens’ quarterly and half-yearly reports and approves the Annual Fi-nancial Statements of Siemens AG as well as the Consolidated Financial Statements of Siemens worldwide, taking into ac-count both the audit reports issued by the independent audi-tors thereon and the results of the review conducted by the Audit Committee. In addition, the Supervisory Board concerns itself with the Company ’s adherence to the statutory provi-sions, official regulations and internal Company policies (com-pliance). It also appoints the members of the Managing Board and determines each member’s duties. Important Managing Board decisions – such as those regarding major acquisitions, divestments and financial measures – require Supervisory Board approval, unless the Bylaws for the Supervisory Board specify that such authority be delegated to the Finance and In-vestment Committee of the Supervisory Board. In the Bylaws for the Managing Board, the Supervisory Board has established the rules that govern the work of the Managing Board – in par-ticular, the rules regarding the allocation of duties among indi-vidual Managing Board members, the matters reserved for the Managing Board as a whole and the quorum required for Man-aging Board decisions.
The Supervisory Board currently has six committees whose du-ties, responsibilities and procedures fulfill the requirements of the German Stock Corporation Act and the Code, reflect appli-cable SOA requirements and incorporate applicable NYSE rules as well as certain NYSE rules, with which Siemens AG com-plies voluntarily. Each committee’s chairperson provides the Supervisory Board with regular reports regarding the activities of his or her committee.
The Chairman’s Committee, which comprises the Chairman and Deputy Chairmen of the Supervisory Board as well as one further employee representative elected by the Supervisory Board, performs the collective tasks of a “nominating, compen-sation and corporate governance committee” to the extent that such tasks are not performed by the Nominating Commit-

1 A. To our Shareholders 21 B. Corporate Governance
22 B.1 Corporate Governance Report 28 B.2 Corporate Governance statement pursuant to
Section 289a of the German Commercial Code (part of the Combined Management Report)
29 B.3 Compliance Report
31 B.4 Compensation Report (part of the Combined Management Report)
44 B.5 Takeover-relevant information (pursuant to Sections 289 para. 4 and 315 para. 4 of the German Commercial Code) and explanatory report (part of the Combined Management Report)
24
tee and German law does not require that such tasks be per-formed by the full Supervisory Board. In particular, the Chair-man’s Committee makes proposals regarding the appointment and dismissal of Managing Board members, handles contracts with members of the Managing Board, prepares the determi-nation of Managing Board compensation and the review of the Managing Board compensation system to be conducted at the Supervisory Board’s plenary meetings. In preparing recom-mendations on the appointment of Managing Board members, the Chairman’s Committee takes into account a candidate’s professional qualifications, international experience and lead-ership qualities, the board’s long-range plans for succession as well as the board’s diversity and, in particular, the appropriate consideration of women. The Chairman’s Committee concerns itself with questions regarding the Company ’s corporate gov-ernance and prepares the resolution regarding the Declaration of Conformity with the Code to be approved by the Supervisory Board. Furthermore, the Chairman’s Committee submits rec-ommendations to the Supervisory Board regarding the compo-sition of Supervisory Board committees and decides whether to approve business transactions with Managing Board mem-bers and parties related to them.
The Audit Committee comprises the Chairman of the Supervi-sory Board, two of the Supervisory Board’s shareholder repre-sentatives and three of the Supervisory Board’s employee rep-resentatives. According to German law, the Audit Committee must include at least one independent Supervisory Board member with knowledge and experience in the application of accounting principles or the auditing of financial statements. The Chairman of the Audit Committee, Dr. Hans Michael Gaul, fulfills these German statutory requirements. The Supervisory Board has designated Dr. Hans Michael Gaul – in addition to Dr. Gerhard Cromme – as an “audit committee financial ex-pert,” as defined by the SOA and the regulations of the SEC. The Audit Committee oversees the accounting process. It also prepares the Supervisory Board’s recommendation to the An-nual Shareholders’ Meeting concerning the election of the in-dependent auditors and submits the corresponding proposal to the full Supervisory Board. Furthermore, in addition to the work performed by the independent auditors, the Audit Com-mittee discusses the Company ’s financial statements prepared quarterly, half-yearly and annually by the Managing Board. On the basis of the independent auditors’ report on the annual fi-nancial statements, the Audit Committee makes, after its own review, recommendations to the Supervisory Board regarding the approval of the Annual Financial Statements of Siemens AG and the Consolidated Financial Statements of Siemens worldwide. It concerns itself with the Company ’s risk monitor-ing system and oversees the effectiveness of the internal con-trol system as this relates, in particular, to financial reporting,
the risk management system and the internal audit system. The Internal Audit Department reports regularly to the Audit Committee. The Audit Committee awards the audit contract to the independent auditors elected by the Annual Shareholders’ Meeting and monitors the independent audit of the financial statements – including, in particular, the auditor’s indepen-dence, professional expertise and services – and performs other functions assigned to it under the SOA.
The Compliance Committee comprises the Chairman of the Supervisory Board, two of the Supervisory Board’s shareholder representatives and three of the Supervisory Board’s employee representatives. The Compliance Committee concerns itself, in particular, with the Company ’s adherence to the statutory pro-visions, official regulations and internal Company policies.
The Nominating Committee, which comprises the Chairman of the Supervisory Board and two of the Supervisory Board’s shareholder representatives, is responsible for making recom-mendations to the Supervisory Board’s shareholder represen-tatives regarding the shareholder candidates to be proposed for election to the Supervisory Board by the Annual Shareholders’ Meeting. In preparing these recommendations, the objectives specified by the Supervisory Board regarding its composition are to be taken into account as well as the required knowledge, abilities and experience of the proposed candidates; attention shall also to be paid to independence, diversity and, in particu-lar, the appropriate participation of women.
The Mediation Committee, which comprises the Chairman of the Supervisory Board, the First Deputy Chairman (who is elected in accordance with the German Codetermination Act), one of the Supervisory Board’s shareholder representatives and one of the Supervisory Board’s employee representatives, submits proposals to the Supervisory Board in the event that the Supervisory Board cannot reach the two-thirds majority re-quired for the appointment or dismissal of a Managing Board member.
The Finance and Investment Committee comprises the Chairman of the Supervisory Board, three of the Supervisory Board’s shareholder representatives and four of the Superviso-ry Board’s employee representatives. Based on the Company ’s overall strategy, which is the focus of an annual strategy meet-ing of the Supervisory Board, the Committee prepares the dis-cussions and resolutions of the Supervisory Board regarding questions relating to the Company ’s financial situation and structure as well as its fixed assets and financial investments. In addition, the Finance and Investment Committee has been authorized by the Supervisory Board to decide on the approval of transactions and measures that require Supervisory Board

49 C. Combined Management Report 239 E. Additional Information 135 D. Consolidated Financial Statements25
approval and have a value of less than €600 million. The Fi-nance and Investment Committee also exercises the right of the Supervisory Board pursuant to Section 32 of the German Codetermination Act to make decisions regarding the exercise of ownership rights resulting from interests in other compa-nies. Section 32 para 1 sentence 2 of the German Codetermina-tion Act stipulates that decisions made by the Finance and In-vestment Committee require only the votes of the shareholder representatives.
The composition of the Supervisory Board and its committees is presented in chapter D.7 SUpeRVISORY BOaRD anD managIng
BOaRD On pageS 232-235. Information on the work of this body is provided in the Report of the Supervisory Board on pageS
12-17. The compensation paid to the members of the Supervisory Board is explained in the Compensation Report on
pageS 42-43.
B.1.1.2 managIng BOaRDAs the Company ’s top management body, the Managing Board is committed to serving the interests of the Company and achieving sustainable growth in Company value. The mem-bers of the Managing Board are jointly responsible for the entire management of the Company and decide on the basic issues of business policy and corporate strategy as well as on the Company ’s annual and multi-year plans.
The Managing Board prepares the Company ’s quarterly and half-yearly reports, the Annual Financial Statements of Siemens AG and the Consolidated Financial Statements of Siemens worldwide. In addition, the Managing Board must en-sure that the Company adheres to the statutory provisions, of-ficial regulations and internal Company policies (compliance) and works to achieve compliance with these provisions and policies within the Siemens group. Further comprehensive in-formation on the compliance program and related activities in fiscal 2012 is available on pageS 29-30 (Compliance Report) and pageS 109-111. The Managing Board and the Supervisory Board cooperate closely for the benefit of the Company. The Managing Board informs the Supervisory Board regularly, com-prehensively and without delay on all issues of importance to the Company with regard to strategy, planning, business de-velopment, financial position, earnings, compliance and risks. When filling managerial positions at the Company, the Manag-ing Board takes diversity into consideration and, in particular, aims for an appropriate consideration of women.
The Bylaws for the Managing Board provide for the establish-ment of committees to deal with specific tasks. Currently, there is one Managing Board committee, the Equity and Employee Stock Committee. This committee comprises three members of
the Managing Board and oversees the utilization of authorized capital in connection with the issuance of employee stock and the implementation of certain capital measures. It also deter-mines the scope and conditions of the share-based compensa-tion components and / or programs for employees and manag-ers (with the exception of the Managing Board).
The composition of the Managing Board and its committee is presented in chapter D.7 SUpeRVISORY BOaRD anD managIng
BOaRD On pageS 236-238 of this Annual Report. Information on the compensation paid to the members of the Managing Board is provided in the Compensation Report on pageS 35-41.
B.1.1.3 SHaRe OWneRSHIpAs of October 12, 2012, the Managing Board’s current members held a total of 293,808 (2011: 248,137) Siemens shares repre-senting 0.03 (2011: 0.03)% of the capital stock of Siemens AG, which totaled 881,000,000 (2011: 914,203,421) shares.
As of the same day, the Supervisory Board’s current members of the Supervisory Board held Siemens shares representing less than 0.01 (2011: less than 0.01)% of the capital stock of Siemens AG, which totaled 881,000,000 (2011: 914,203,421) shares. These figures do not include the 11,454,464 (2011: 11,715,342) shares, or 1.30 (2011: 1.28)% of the capital stock of Siemens AG, which totaled 881,000,000 (2011: 914,203,421) shares, over which the von Siemens-Vermögensverwaltung GmbH (vSV), a German limited liability company, has voting control under powers of attorney based on an agreement between – among others – members of the Siemens family, including Gerd von Brandenstein, and vSV. These shares are voted together by vSV based on proposals by the family partnership established by the Siemens family or by one of its committees. Gerd von Brandenstein is the current chairman of the executive committee and has a deciding vote in cases of deadlock.
B.1.2 Purchase or sale of the Company ’s shares
Pursuant to §15a of the German Securities Trading Act (WpHG), members of the Managing Board and the Supervisory Board are legally required to disclose the purchase or sale of shares of Siemens AG or of financial instruments based thereon if the total value of such transactions entered into by a board mem-ber or any closely associated person reaches or exceeds €5,000 in any calendar year. All transactions reported to Siemens AG in accordance with this requirement have been duly published and can be found on the Company ’s website
WWW.SIemenS.cOm/DIRectORS-DealIngS

1 A. To our Shareholders 21 B. Corporate Governance
22 B.1 Corporate Governance Report 28 B.2 Corporate Governance statement pursuant to
Section 289a of the German Commercial Code (part of the Combined Management Report)
29 B.3 Compliance Report
31 B.4 Compensation Report (part of the Combined Management Report)
44 B.5 Takeover-relevant information (pursuant to Sections 289 para. 4 and 315 para. 4 of the German Commercial Code) and explanatory report (part of the Combined Management Report)
26
B.1.3 Shareholder relations
Siemens AG reports to shareholders on its business develop-ment, financial position and earnings on a regular basis four times a year. An ordinary Annual Shareholders’ Meeting, at which we also report on business development, normally takes place within the first four months of each fiscal year. The Managing Board facilitates shareholder participation in this meeting through electronic communications – in particular the Internet – and enables shareholders who are unable to at-tend the meeting to vote by proxy. Furthermore, shareholders may exercise their right to vote in writing or by means of elec-tronic communications (voting by mail). The Managing Board may enable shareholders to participate in the Annual Share-holders’ Meeting without the need to be present at the venue and without a proxy and to exercise some or all of their rights fully or partially by means of electronic communications. The reports, documents and information required by law, includ-ing the Annual Report, may be downloaded from our website. The same applies to the agenda for the Annual Shareholders’ Meeting and to possible counterproposals or shareholders’ nominations, if any, that are required to be disclosed.
The Annual Shareholders’ Meeting decides, among other things, on the appropriation of net income, the ratification of the acts of the Managing and Supervisory Boards, and the ap-pointment of the independent auditors. Amendments to the Articles of Association and measures that change the Compa-ny ’s capital stock are approved at the Annual Shareholders’ Meeting and are implemented by the Managing Board. Share-holders may submit proposals regarding the proposals of the Managing and Supervisory Boards and may contest decisions of the Annual Shareholders’ Meeting. Shareholders owning Siemens stock with an aggregate notional value of €100,000 or more may also demand the appointment of special auditors to examine specific issues.
As part of our investor relations activities, we inform our inves-tors comprehensively about developments within the Company. For communication purposes, Siemens makes extensive use of the Internet. We publish quarterly, half-yearly and annual reports, earnings releases, ad hoc announcements, analyst pre-sentations and press releases as well as the financial calendar for the current year, which contains the publication dates of significant financial communications and the date of the Annu-al Shareholders’ Meeting, at WWW.SIemenS.cOm/InVeStORS. Details of our investor relations activities are provided on
page 20 of this Annual Report.
B.1.3.1 cORpORate gOVeRnance gUIDelIneSOur Articles of Association, the Bylaws for the Supervisory Board and for its most important committees, the Bylaws for the Managing Board, all our Declarations of Conformity with the Code and a variety of other corporate-governance-related documents are posted on our website at WWW.SIemenS.cOm/
cORpORate-gOVeRnance
B.1.4 Significant differences between Siemens’ corporate governance and NYSE Corporate Governance StandardsCompanies listed on the NYSE are subject to the Corporate Governance Standards of Section 303A (NYSE Standards) of the NYSE Listed Company Manual. Under the NYSE Standards, Siemens AG, as a foreign private issuer, is permitted to follow its home-country corporate governance practices in lieu of the NYSE Standards, except that it must comply with the NYSE Standards in having an audit committee whose members are independent within the meaning of the SOA as well as with certain NYSE notification obligations. In addition, the NYSE Standards require that foreign private issuers disclose any sig-nificant differences between their own corporate governance practices and those that the NYSE Standards require of U.S. do-mestic companies.
As a company incorporated in Germany, Siemens AG must comply in the first instance with the German Stock Corpora-tion Act and the German Codetermination Act and voluntarily follows the recommendations of the German Corporate Gov-ernance Code as set out on pageS 22-25 above. Further-more, Siemens complies with all binding rules and regula-tions of the markets on which its securities are listed, such as the NYSE, and also voluntarily complies with many of the NYSE requirements that by their terms apply only to U.S. do-mestic issuers.
The significant differences between our governance practices and those of domestic U.S. NYSE issuers are as follows:
B.1.4.1 tWO-tIeR BOaRD StRUctUReThe German Stock Corporation Act requires Siemens AG to have a two-tier board structure, consisting of a Managing Board and a Supervisory Board. The two-tier structure is char-acterized by a strict separation of management and supervi-sion. The roles and responsibilities of each of the two boards are clearly defined by law. The composition of the Supervisory

49 C. Combined Management Report 239 E. Additional Information 135 D. Consolidated Financial Statements27
Board is determined in accordance with the German Codeter-mination Act, which stipulates that one-half of the required 20 Super visory Board members are to be elected by our em-ployees in Germany. The Chairman of the Supervisory Board is entitled to cast a deciding vote when the Supervisory Board is unable to reach a decision in two separate rounds of voting.
B.1.4.2 InDepenDenceIn contrast to the NYSE Standards, which require a board of directors to affirmatively determine the independence of the individual directors with reference to specific tests of indepen-dence, German law does not require the Supervisory Board to make such affirmative findings on an individual basis. German law requires an audit committee to include at least one in-dependent supervisory board member with knowledge and experience in the application of accounting principles or the auditing of financial statements. In addition, the Bylaws for Siemens’ Supervisory Board contain several provisions to help ensure the independence of our Supervisory Board’s advice and supervision. Furthermore, the members of our Super-visory and Managing Boards are strictly independent of one another: a member of one board is legally prohibited from be-ing concurrently active on the other. Our Supervisory Board members have independent decision-making authority and are legally prohibited from following any direction or instruc-tion. Moreover, they may not enter into consulting, service or certain other contracts with Siemens, unless approved by the Supervisory Board. We also use the independence criteria of the Code as guiding principles.
B.1.4.3 cOmmItteeSIn contrast to the NYSE Standards, which require the creation of several specific board committees, composed of indepen-dent directors and operating pursuant to written charters that define their tasks and responsibilities, the Supervisory Board of Siemens AG has assigned many of the functions of a nomi-nating, compensation and corporate governance committee to its Chairman’s Committee and has delegated part of the re-maining functions to its Nominating Committee. Neverthe-less, certain responsibilities – for example, the determination of the compensation of the members of the Managing Board – have not been delegated to a committee because German law requires that these functions be performed by the full Super-visory Board. The Audit Committee, the Chairman’s Committee and the Compliance Committee have written bylaws – adopted by the Supervisory Board – that define their respective tasks and responsibilities. The NYSE Standards were taken into con-sideration in drawing up these bylaws.
The Audit Committee of Siemens AG is subject to the require-ments of the SOA and the U.S. Securities Exchange Act of 1934, as these apply to a foreign private issuer, and performs – in co-operation with the Compliance Committee – functions similar to those assigned to an audit committee by the NYSE Stan-dards. Nevertheless, German law prohibits delegating certain responsibilities – such as the selection of independent audi-tors (who, under German law, must be elected at the share-holders’ meeting) – to a committee.
The Supervisory Board of Siemens AG also has a Finance and Investment Committee and a Mediation Committee, the latter of which is required under German law. Neither of these com-mittees is required by the NYSE Standards.
B.1.4.4 SHaReHOlDeR appROVal OF eQUItY cOmpenSatIOn planS; StOcK RepURcHaSeSThe NYSE Standards generally require that the domestic, i.e. U.S. companies listed on the NYSE obtain shareholder approv-al of all equity compensation plans (including stock option plans) and of any material revisions to such plans. Under German law, the creation of authorized or contingent capital in order to issue shares requires approval by our shareholders. Shareholders must also approve of the key points of a stock op-tion plan as part of a decision regarding the creation of contin-gent capital or the authorization to repurchase and use Siemens shares for servicing a stock option plan.
Under German law, share buybacks generally require prior shareholder authorization. Such authorization was last given at our Annual Shareholders’ Meeting on January 25, 2011, and this matter will, as a general rule, be voted upon at the expira-tion of each authorization.

1 A. To our Shareholders 21 B. Corporate Governance
22 B.1 Corporate Governance Report 28 B.2 Corporate Governance statement pursuant to
Section 289a of the German Commercial Code (part of the Combined Management Report)
29 B.3 Compliance Report
31 B.4 Compensation Report (part of the Combined Management Report)
44 B.5 Takeover-relevant information (pursuant to Sections 289 para. 4 and 315 para. 4 of the German Commercial Code) and explanatory report (part of the Combined Management Report)
28
The Corporate Governance statement pursuant to Section 289a of the German Commercial Code (Handelsgesetzbuch) is an integral part of the Combined Management Report. In accordance with Section 317 para. 2 sentence 3 of the German Commercial Code, the disclosures made within the scope of Section 289a of the German Commercial Code are not subject to the audit by the auditors.
Declaration of conformity with the German corporate Governance coDeThe Managing Board and the Supervisory Board of Siemens AG approved the following Declaration of Conformity pursuant to Section 161 of the German Stock Corporation Act as of October 1, 2012:
“Declaration of Conformity by the Managing Board and the Supervisory Board of Siemens Aktiengesellschaft with the German Corporate Governance Code
Siemens AG fully complies and will continue to comply with the recommendations of the German Corporate Governance Code (‘Code’) in the version of May 15, 2012, published by the Federal Ministry of Justice in the official section of the electronic Federal Gazette (‘elektronischer Bundesanzeiger’).
Since making its last Declaration of Conformity dated October 1, 2011, Siemens AG has complied with the recommendations of the Code in the prior version of May 26, 2010, with the exception stated and explained therein (that, contrary to the provisions of Section 5.4.6 para. 2 sentence 1 of the Code in the prior version of May 26, 2010, the rules for the compensation of the Supervisory Board members contain no performancerelated compensation components since, in our view, a purely fixed compensation reinforces the independence of the Supervisory Board). The deviation no longer applies, because the recommendation for performancerelated compensation for Supervisory Board members is no longer included in the new version of the Code.
Berlin and Munich, October 1, 2012
Siemens Aktiengesellschaft
The Managing Board The Supervisory Board“
information on corporate Governance practices Suggestions of the CodeSiemens voluntarily complies with the Code’s nonbinding suggestions, with the following exception:
In fiscal 2011, the Supervisory Board decided to appoint Dr. Roland Busch, Klaus Helmrich and Dr. Michael Süß to the
Managing Board, each for a term of five years, and therefore to no longer follow the suggestion set out in Section 5.1.2 para. 2 sentence 1 of the Code, according to which the maximum possible appointment period of five years should not be the rule for firsttime appointments to a Managing Board.
The Code can be downloaded from the Internet at: www.siemens.com/289a.
Further Corporate Governance Practices applied beyond legal requirements are contained in our Business Conduct Guidelines.
Our Company’s values and Business Conduct GuidelinesIn the 165 years of its existence, our Company has built an excellent reputation around the world. Technical performance, innovation, quality reliability, and international engagement have made Siemens one of the leading companies in electronics and electrical engineering. It is top performance with the highest ethics that has made Siemens strong. This is what the Company should continue to stand for in the future.
The Business Conduct Guidelines provide the ethical and legal framework within which we want to maintain successful activities. They contain the basic principles and rules for our conduct within our Company and in relation to our external partners and the general public. They set out how we meet our ethical and legal responsibility as a company and give expression to our corporate values of being “Responsible – Excellent – Innovative.”
The Business Conduct Guidelines can be downloaded from the Internet on: www.siemens.com/289a.
operation of the manaGinG BoarD, the supervisory BoarD, anD composition anD operation of their committeesThe composition of the committees of the Managing and Supervisory Boards is given under chapter D.7 supervisory BoarD
anD manaGinG BoarD on paGes 232-238, respectively of the Annual Report, as is a description of the composition of the Managing Board and the Supervisory Board. The compositions can be accessed via the Internet on: www.siemens.com/289a.
A general description of the functions and operation of the Managing Board and the Supervisory Board can be found under the heading “Management and control structure” under chapter B.1.1 corporate Governance report on paGes 22-25 and on: www.siemens.com/289a. Further details regarding the operation of the Managing and Supervisory Boards can be derived from the description of the committees as well as from the bylaws for the corporate bodies concerned. These documents can be found at: www.siemens.com/289a.
B.2 Corporate GovernanCe statement pursuant to seCtion 289a of the German CommerCial Code
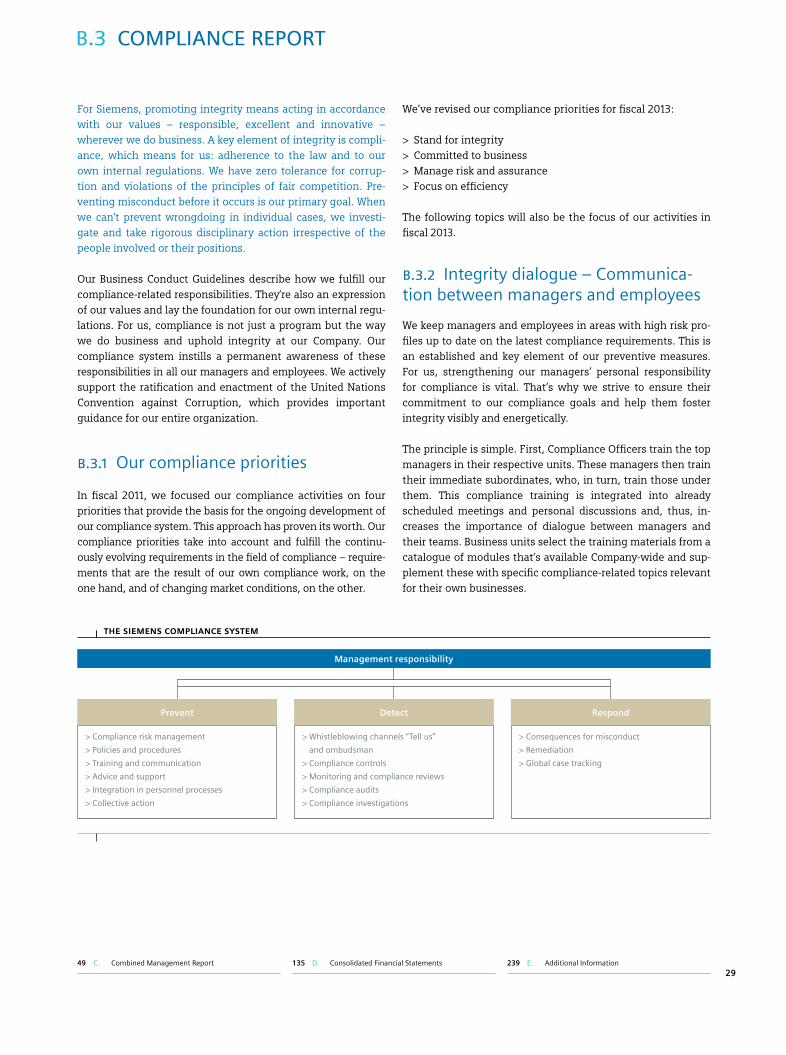
49 C. Combined Management Report 239 E. Additional Information 135 D. Consolidated Financial Statements29
For Siemens, promoting integrity means acting in accordance with our values – responsible, excellent and innovative – wherever we do business. A key element of integrity is compli-ance, which means for us: adherence to the law and to our own internal regulations. We have zero tolerance for corrup-tion and violations of the principles of fair competition. Pre-venting misconduct before it occurs is our primary goal. When we can’t prevent wrongdoing in individual cases, we investi-gate and take rigorous disciplinary action irrespective of the people involved or their positions.
Our Business Conduct Guidelines describe how we fulfill our compliance-related responsibilities. They’re also an expression of our values and lay the foundation for our own internal regu-lations. For us, compliance is not just a program but the way we do business and uphold integrity at our Company. Our compliance system instills a permanent awareness of these responsibilities in all our managers and employees. We actively support the ratification and enactment of the United Nations Convention against Corruption, which provides important guidance for our entire organization.
B.3.1 Our compliance priorities
In fiscal 2011, we focused our compliance activities on four priorities that provide the basis for the ongoing development of our compliance system. This approach has proven its worth. Our compliance priorities take into account and fulfill the continu-ously evolving requirements in the field of compliance – require-ments that are the result of our own compliance work, on the one hand, and of changing market conditions, on the other.
We’ve revised our compliance priorities for fiscal 2013:
> Stand for integrity > Committed to business > Manage risk and assurance > Focus on efficiency
The following topics will also be the focus of our activities in fiscal 2013.
B.3.2 Integrity dialogue – Communica-tion between managers and employees
We keep managers and employees in areas with high risk pro-files up to date on the latest compliance requirements. This is an established and key element of our preventive measures. For us, strengthening our managers’ personal responsibility for compliance is vital. That’s why we strive to ensure their commitment to our compliance goals and help them foster integrity visibly and energetically.
The principle is simple. First, Compliance Officers train the top managers in their respective units. These managers then train their immediate subordinates, who, in turn, train those under them. This compliance training is integrated into already scheduled meetings and personal discussions and, thus, in-creases the importance of dialogue between managers and their teams. Business units select the training materials from a catalogue of modules that’s available Company-wide and sup-plement these with specific compliance-related topics relevant for their own businesses.
B.3 ComplianCe report
The SiemenS ComplianCe SySTem
Management responsibility
> Compliance risk management
> Policies and procedures
> Training and communication
> Advice and support
> Integration in personnel processes
> Collective action
> Whistleblowing channels “Tell us”
and ombudsman
> Compliance controls
> Monitoring and compliance reviews
> Compliance audits
> Compliance investigations
> Consequences for misconduct
> Remediation
> Global case tracking
Prevent Detect Respond

1 A. To our Shareholders 21 B. Corporate Governance
22 B.1 Corporate Governance Report 28 B.2 Corporate Governance statement pursuant to
Section 289a of the German Commercial Code (part of the Combined Management Report)
29 B.3 Compliance Report
31 B.4 Compensation Report (part of the Combined Management Report)
44 B.5 Takeover-relevant information (pursuant to Sections 289 para. 4 and 315 para. 4 of the German Commercial Code) and explanatory report (part of the Combined Management Report)
30
B.3.4 Collective action – Supporting business success through fair competition
Siemens promotes ethical business practices and fair competi-tion beyond Company boundaries – this, too, is one of our key compliance priorities.
Going it alone can have only a limited impact in the fight against corruption. If real progress is to be made, as many stakeholders as possible must act in concert. That’s why we’ve joined forces with other organizations to combat corruption and promote ethical markets through collective action and through the Siemens Integrity Initiative.
Now that we’ve established collective action throughout the Company and involved a large number of our business units engaging with numerous partners in its implementation, we plan to focus our collective action activities in fiscal 2013 on our particular business requirements more intensively than in the past. There are many ways to do this. For example, future CRAs can increase the emphasis on defining collective action measures such as fair competition partnerships between bid-ders for large contracts or the voluntary self-commitment of industry federations to compliance standards that reduce com-pliance-related risks. As in the other areas described, close and trust-based cooperation between Compliance Officers, sales personnel and managers will play a key role here in identifying appropriate measures.
The further development of our compliance system entails continuously adapting it to the evolving requirements in the field of compliance. Our overall aim remains unchanged: we want to anchor compliance permanently throughout our glob-al Company in order to ensure that we continue making sound business decisions based on clear principles of integrity.
To learn more, please see: ChapTer C.8.10. of The Combined managemenT reporT
www.SiemenS.Com/ComplianCe
We’ll begin introducing our integrity dialogues Company-wide in fiscal 2013. Compliance Officers will support managers throughout the process. They’ll also support the business units in selecting the employees for whom participation in com pliance training programs and integrity dialogues is obligatory. Man-agers will select participants on the basis of Company-wide regulations, taking into account, among other things, the re-sults of compliance risk assessments (CRAs) – a process that will enhance both management responsibility for compliance and the business-specific and risk-related orientation and effi-ciency of our entire compliance system.
B.3.3 Compliance risk assessments at business units
Initiating effective measures to detect and minimize com-pliance-related risks in business operations at an early stage is the heart of a successful compliance system. Our assessment and monitoring processes are being further improved by our CRAs. In use since the beginning of fiscal 2012, the CRA pro-cess improves the links between compliance and business operations at Siemens.
Every year, the CEOs of our business units meet with other key managers and the relevant Compliance Officers to systemati-cally determine the compliance-related risks at their respective units. The compliance-related risks identified in the process are then assessed and measures for reducing them defined. The resulting analyses are incorporated into the Company-wide compliance risk analysis, which covers the material com-pliance-related risks for Siemens as a whole.
The accurate assessment of compliance-related risks depends on close and trust-based cooperation between the managers and specialists at our business units, on the one hand, and our Compliance Officers, on the other.

49 C. Combined Management Report 239 E. Additional Information 135 D. Consolidated Financial Statements31
The Compensation report outlines the principles underlying the determination of the total compensation of the members of the Managing Board of Siemens AG, and sets out the struc-ture and level of the remuneration of the Managing Board members. It also describes the policies governing, and levels of, the compensation paid to Supervisory Board members.
This section is based on the recommendations of the German Corporate Governance Code and includes disclosures in accor-dance with the requirements of the German Commercial Code (HGB), German Accounting Standards (DRS), and International Financial Reporting Standards (IFRS). The Compensation Report is an integral part of the Combined Management Report.
B.4.1 Remuneration of members of the Managing Board
B.4.1.1 REMUNERATION SYSTEM The remuneration system for the Managing Board at Siemens is intended to provide an incentive for successful corporate management with an emphasis on sustainability. Members of the Managing Board are expected to make a long-term commit-ment to and on behalf of the Company, and may benefit from any sustained increase in the Company’s value. In the interest
of that aim, a substantial portion of their total remuneration is linked to the performance of Siemens stock. A further aim is for their remuneration to be commensurate with the Company’s size and economic position. Exceptional achieve-ments are to be rewarded adequately, while falling short of goals is intended to result in an appreciable reduction in remu-neration. The Managing Board’s compensation is also struc-tured so as to be attractive in comparison to that of competi-tors, with a view to attracting outstanding managers to our Company and keeping them with us for the long term.
The system and levels for the remuneration of the Managing Board are determined and reviewed regularly by the Supervisory Board, based on proposals from the Chairman’s Committee. The Supervisory Board reviews remuneration levels annually to ensure that they are appropriate. In that process, the eco-nomic situation and the results of the Company as well as the performance of the individual Managing Board members are taken into account. In addition, the Supervisory Board consid-ers the adequacy of remuneration in comparison with stan-dard practice at similar companies and with the compensation structure valid elsewhere in the Company. The remuneration system that has been used for the Managing Board members since fiscal 2011 was approved by a large majority at the Annual Shareholders’ Meeting on January 25, 2011.
B.4 Compensation report
REMUNERATION SYSTEM fOR MANAgINg BOARd MEMBERS
Non-performance-based components
Performance-based components
Performance-based components with deferred payout
Share Ownership Guidelines Obligation to hold shares for duration of membership in Managing Board
Long-term compensation (target parameter: stock price compared to 5 competitors)Variability: 0 – 200%
Long-term compensation (target parameter: Ø earnings per share)Variability: 0 – 200%
Bonus (target parameters: revenue growth (organic), ROCE (adjusted), free cash flow) Variability: 0 – 200%
Stock Awards (forfeitable grants of stock)
Bonus Awards (non-forfeitable grants of stock)
Cash
Base compensation including other compensation
Stock-based compensation
Compensation TimingGranted in
Cash compensation
FY 2010 FY 2011 FY 2013 FY 2014 FY 2015FY 2012 FY 2016
Performance period: 3 years, including year of compensation; subsequent restriction period: 4 years
Performance period: Year of compensa-tion; subsequent waiting period: 4 years
Restriction period and period for target measurement: 4 years
Performance period: Year of compensation

1 A. To our Shareholders 21 B. Corporate Governance
22 B.1 Corporate Governance Report 28 B.2 Corporate Governance statement pursuant to
Section 289a of the German Commercial Code (part of the Combined Management Report)
29 B.3 Compliance Report
31 B.4 Compensation Report (part of the Combined Management Report)
44 B.5 Takeover-relevant information (pursuant to Sections 289 para. 4 and 315 para. 4 of the German Commercial Code) and explanatory report (part of the Combined Management Report)
32
In fiscal 2012, the remuneration system for the Managing Board had the following components:
Non-performance-based componentsBase compensation Base compensation is paid as a monthly salary. It is reviewed regularly, and revised if appropriate. The base compensation of President and CEO Peter Löscher was set at the time of his appointment on July 1, 2007, and has remained essentially unchanged since then. It is €2,000,000 per year. The base compensation of the other members of the Managing Board has been €900,000 per year since October 1, 2010.
Other compensationOther compensation includes costs, or the cash equivalent, of non-monetary benefits and perquisites, such as provision of a Company car, contributions toward the cost of insurance, reimbursement of fees for legal advice, tax advice and accom-modation and moving expenses, including a gross-up for any taxes that have to be borne in this regard, as well as costs relating to preventive medical examinations.
Performance-based componentsVariable compensation component (bonus) The variable compensation component (bonus) is based on the Company ’s business performance in the past fiscal year. The targets for the variable compensation component are de-rived from One Siemens, our target system for sustainably en-hancing corporate value. On the basis of this target system, the Supervisory Board at the beginning of each fiscal year defines specific targets for several parameters. These target parameters – in addition to other factors – also apply to senior executives, with a view to establishing a consistent target sys-tem throughout the Company.
For a 100% target attainment (target amount) the amount of the bonus equals the amount of base compensation. The bonus is subject to a ceiling (cap) of 200%. If targets are sub-stantially missed, the variable component may potentially not be paid at all.
The Supervisory Board is entitled to revise the amount result-ing from attaining targets, by as much as 20% upward or down-ward, at its duty-bound discretion (pflichtgemäßes Ermessen); the adjusted amount of the bonus paid can be as much as 240% of the target amount. In choosing the factors to be con-sidered in deciding on possible revisions of the bonus payouts (± 20%), the Supervisory Board takes account of incentives for sustainable corporate management. The revision option may also be exercised in recognition of Managing Board members’ individual achievements.
The bonus is paid half in cash, and half in the form of non-for-feitable stock commitments (Bonus Awards). After a four-year waiting period, the beneficiary will receive one share of Siemens stock for each Bonus Award. Instead of the transfer of Siemens stock, an equivalent cash settlement may be effected.
Long-term stock-based compensation Long-term stock-based compensation consists of a grant of forfeitable stock commitments (Stock Awards). The beneficiar-ies will receive one free share of Siemens stock for each Stock Award after a restriction period. Beginning with fiscal 2011, the restriction period for Stock Awards ends at the close of the sec-ond day after publication of the operating results for the fourth calendar year after the date of the award.
In the event of extraordinary unforeseen developments that have an impact on the stock price, the Supervisory Board may decide to reduce the number of promised Stock Awards retro-actively, or it may decide that in lieu of a transfer of Siemens Stock only a cash settlement in a defined and limited amount will be paid, or it may decide to postpone transfers of Siemens Stock for payable Stock Awards until the developments have ceased to have an impact on the stock price.
In the event of a 100% target attainment, the annual target amount for the monetary value of the Stock Awards commit-ment will be €2.5 million for the President and CEO, and €1 mil-lion for each of the other members of the Managing Board. Be-ginning with fiscal 2011, the Supervisory Board has the option of increasing, on an individual basis, the target amount for a member of the Managing Board who has been reappointed by as much as 75% above the amount of €1 million, for one fiscal year at a time. This option enables the Supervisory Board to take account of the Managing Board member’s individual ac-complishments and experience as well as the scope and de-mands of his or her function. This rule does not apply to the President and CEO.
The foundation for the performance-based component of long-term stock-based compensation is One Siemens, our target system for sustainably enhancing corporate value. The allo-cation rules for long-term stock-based compensation take this focus into account as follows:
> On the one hand, half of the annual target amount for the annual Stock Awards is linked to the average basic earnings per share (EPS) for the last three completed fiscal years (from continuing and discontinued operations). In principle, the target value is the average basic earnings per share (from continuing and discontinued operations) from the past three fiscal years completed prior to the year of compensation. At the end of each fiscal year, the Supervisory Board decides on

49 C. Combined Management Report 239 E. Additional Information 135 D. Consolidated Financial Statements33
a figure that represents that year’s target attainment, which may lie between 0% and 200% (cap). This target attainment will then determine the actual monetary value of the award and the resulting number of Stock Awards.
> On the other hand, the development of the performance of Siemens’ stock compared to its competitors is to have a di-rect effect on compensation. For this purpose, with respect to the other half of the annual target amount for the Stock Awards, the Supervisory Board will first grant a number of Stock Awards equivalent to the monetary value of half the target amount on the date of the award. The Supervisory Board will also decide on a target system (target value for 100% and target curve) for the performance of Siemens stock relative to the stock of competitors (at present ABB, General Electric, Philips, Rockwell, Schneider). The refer-ence period for measuring the target will be the same as the four-year restriction period for the Stock Awards. After this restriction period expires, the Supervisory Board will deter-mine how much better or worse Siemens stock has per-formed relative to the stock of its competitors. This determi-nation will yield a target attainment of between 0% and 200% (cap). If target attainment is above 100%, an additional cash payment corresponding to the outperformance is ef-fected. If target attainment is less than 100%, a number of Stock Awards equivalent to the shortfall from the target will expire without replacement.
With regard to the further terms of the Stock Awards, the same general principles apply for the Managing Board and for senior executives; these principles are discussed in more detail in
NOTE 33 IN d.6 NOTES TO CONSOlIdATEd fINANCIAl STATEMENTS. That note also includes further information about the stock-based employee investment plans.
Share Ownership GuidelinesThe Siemens Share Ownership Guidelines are an integral part of the remuneration system for the Managing Board and senior management. These guidelines require the members of the Managing Board – after a certain buildup phase – to hold Siemens stock worth a multiple of their base compensation (300% for the President and CEO, 200% for the other members of the Managing Board) during their term of office on the Man-aging Board. The determining figure in this context is the aver-age base compensation that the relevant member of the Man-aging Board has drawn over the four years of the buildup phase. Accordingly, changes that have been made to base com-pensation in the meantime are included. Non-forfeitable stock awards (Bonus Awards) are taken into account in determining compliance with the Share Ownership Guidelines.
Evidence that this obligation has been met must first be pro-vided after the buildup phase, and updated annually thereafter.
If the value of the accrued holdings declines below the mini-mum to be evidenced from time to time because the market price of Siemens stock has fluctuated, the member of the Managing Board must acquire additional shares.
Pension benefit commitmentsThe members of the Managing Board, like all Siemens AG em-ployees, are included in the Siemens Defined Contribution Benefit Plan (BSAV). Under the BSAV, members of the Manag-ing Board receive contributions that are credited to their per-sonal pension account. The amount of the annual contribu-tions is based on a predetermined percentage which refers to the base compensation and the target amount for the bonus. This percentage is decided annually by the Supervisory Board; it was set most recently at 28%. The non-forfeitability of pen-sion benefit commitments is in compliance with the provi-sions of the German Company Pensions Act (Betriebsrenten-gesetz). Special contributions may be granted to Managing Board members on the basis of individual decisions of the Supervisory Board. In the case of new appointments of mem-bers of the Managing Board from outside the Company, these contributions may be defined as non-forfeitable from their inception. If a member of the Managing Board had earned a pension benefit entitlement from the Company before the BSAV was introduced, a portion of his contributions went toward financing this prior commitment.
Members of the Managing Board are entitled to benefits under the BSAV on reaching the age of 60, at the earliest. They may choose to have their accrued pension benefit balance paid out as a pension, as a lump sum, or in a maximum of twelve annu-al installments. If the pension option is chosen, a decision must be made as to whether it should include pensions for surviving dependents. If a member of the Managing Board dies while receiving a pension, benefits will be paid to the member’s surviving dependents if the member has chosen such benefits. The Company will then provide a limited-term pension to sur-viving children until they reach age 27, or age 25 in the case of commitments made on or after January 1, 2007.
Benefits from the retirement benefit system that was in place before the BSAV was introduced are normally granted as pen-sion benefits with a surviving dependents’ pension. In this case as well, a payout in installments or a lump sum may be chosen instead of pension payments.
Members of the Managing Board who were employed by the Company on or before September 30, 1983, are entitled to transition payments for the first six months after retirement, equal to the difference between their final base compensa-tion and the retirement benefits payable under the corporate pension plan.

1 A. To our Shareholders 21 B. Corporate Governance
22 B.1 Corporate Governance Report 28 B.2 Corporate Governance statement pursuant to
Section 289a of the German Commercial Code (part of the Combined Management Report)
29 B.3 Compliance Report
31 B.4 Compensation Report (part of the Combined Management Report)
44 B.5 Takeover-relevant information (pursuant to Sections 289 para. 4 and 315 para. 4 of the German Commercial Code) and explanatory report (part of the Combined Management Report)
34
Commitments in connection with termination of Managing Board membership Managing Board contracts provide for a compensatory pay-ment if membership on the Managing Board is terminated pre-maturely by mutual agreement, without serious cause. The amount of this payment must not exceed the value of two years’ compensation (cap). The amount of the compensatory payment is calculated on the basis of the base compensation and the variable components of compensation actually re-ceived for the last fiscal year before termination. The compen-satory payment is payable in the month when the member leaves the Managing Board. In addition, a one-time exception-al contribution is made to the BSAV. The amount of this contri-bution is based on the BSAV contribution that the Board mem-ber received for the previous year, together with the remaining term of the appointment, but is limited to not more than two years’ contributions (cap). The above benefits are not paid if an amicable termination of the member’s activity on the Manag-ing Board is agreed upon at the member’s request, or if there is serious cause for the Company to terminate the employment relationship.
In the event of a change of control that results in a substantial change in the position of the Managing Board member (e.g., due to a change in corporate strategy or a change in the Man-aging Board member’s duties and responsibilities), the mem-ber of the Managing Board has the right to terminate his or her contract with the Company for good cause. A change of con-trol exists if one or more shareholders acting jointly or in con-cert acquire a majority of the voting rights in Siemens AG and exercise a controlling influence, or if Siemens AG becomes a dependent enterprise as a result of entering into an intercom-pany agreement within the meaning of Section 291 of the Ger-man Stock Corporation Act, or if Siemens AG is to be merged into an existing corporation or other entity. If this right of ter-mination is exercised, the Managing Board member is entitled to a severance payment in the amount of not more than two years’ compensation. The calculation of the annual compensa-tion includes not only the base compensation and the target amount for the bonus, but also the target amount for the Stock Awards, in each case based on the most recent completed fis-cal year prior to termination of the contract. The stock-based components for which a firm commitment already exists will remain unaffected. There is no entitlement to a severance pay-
ment if the Managing Board member receives benefits from third parties in connection with a change of control. Moreover, there is no right to terminate if the change of control occurs within a period of twelve months prior to a Managing Board member’s retirement.
Additionally, compensatory or severance payments cover non-monetary benefits by including an amount of 5% of the total compensation or severance amount. Compensatory or sever-ance payments will be reduced by 15% as a lump-sum allow-ance for discounted values and for income earned elsewhere. However, this reduction will apply only to the portion of the compensatory or severance payment that was calculated with-out taking account of the first six months of the remaining term of the Managing Board member’s contract.
If a member leaves the Managing Board, the variable compo-nent (bonus) is determined pro rata temporis after the end of the fiscal year in which the appointment was terminated and settled in cash at the usual payout or transfer date, as the case may be. If the employment contract is terminated in the course of an appointment period, the non-forfeitable stock awards (Bonus Awards) for which the waiting period is still in progress will remain in effect without restriction. If the employment agreement is terminated because of retirement, disability or death, a Managing Board member’s Bonus Awards will be set-tled in cash as of the date of departure from the Board.
By contrast, stock commitments that were made as long-term variable compensation (Stock Awards) and for which the re-striction period is still in progress will expire without replace-ment if the employment agreement is terminated in the course of an appointment period. The same applies if the employ-ment agreement is not extended after the end of an appoint-ment period, either at the Board member’s request or because there is serious cause that would have entitled the Company to revoke the appointment or terminate the contract. However, once granted, Stock Awards do not expire if the employment agreement is terminated because of retirement, disability, or death, or in connection with a spin-off, the transfer of an op-eration, or a change of activity within the corporate group. In this case, the Stock Awards will remain in effect upon termina-tion of the employment agreement and will be honored on ex-piration of the restriction period.

49 C. Combined Management Report 239 E. Additional Information 135 D. Consolidated Financial Statements35
B.4.1.2 REMUNERATION Of THE MEMBERS Of THE MANAgINg BOARd fOR fISCAl 2012On the basis of our One Siemens target system, at the begin-ning of the fiscal year the Supervisory Board set the targets and weighting for the unchanged parameters compared to the pre-vious year: organic revenue growth, return on capital em-ployed (ROCE) adjusted, and free cash flow, in each case on the basis of continuing operations, together with earnings per share (EPS) on the basis of continuing and discontinued opera-tions. The definition of these parameters and their weighting acknowledges a sustainable enhancement of corporate value. An internal review of the appropriateness of the Managing Board’s compensation for fiscal 2012 has confirmed that the re-muneration of the Managing Board resulting from the target at-tainment for fiscal 2012 is to be considered appropriate. Follow-ing the decision on determining the achievement of the targets set at the beginning of the fiscal year, the Supervisory Board decided at its meeting on November 7, 2012, to set the variable compensation component (bonus), the Stock Awards to be granted and the pension benefit contributions as follows:
Variable compensation component (bonus)In setting the targets for the variable compensation (bonus) at the beginning of fiscal 2012, the Supervisory Board took into account that the Company focuses on a sustainable apprecia-tion of value:
> The primary focus of the decision was capital-efficient growth; consequently, for fiscal 2012 more importance was attributed to the target parameters of organic revenue growth and return on capital employed (ROCE) adjusted.
> For ROCE adjusted, the target value from the prior year remained unchanged.
> The target for free cash flow was increased noticeably com-pared to the prior year.
As a consequence, the following targets were set and attained with respect to the variable compensation component:
The values measured for target attainment were not adjusted. The Supervisory Board decided, exercising its duty-bound discretion (pflichtgemäßes Ermessen), to individually adjust the bonus payout amounts resulting from target attainment upward or downward for single Managing Board members with business responsibility for Sector portfolios. In its deci-sion, the Supervisory Board reflected the attained performance of the Sectors.
Long-term stock-based compensationFor half of the annual target amount for the Stock Awards, an average basic EPS (from continuing and discontinued opera-tions) of €5.54 was determined for fiscal years 2010 through 2012, yielding a target attainment of 154%.
For the other half of the annual target amount for the Stock Awards, the Supervisory Board approved a number of Stock Awards equivalent to the monetary value of half the target amount on the award date. The amount by which these stock commitments must be adjusted – or an additional cash pay-ment must be made – after the end of the restriction period will depend on the performance of Siemens stock compared to the stock of five competitors (ABB, General Electric, Philips, Rockwell, Schneider) over the coming four years, and will therefore not be determined until after the end of fiscal 2016.
The number of stock commitments (Bonus Awards and Stock Awards) granted was based on the closing price of Siemens stock in Xetra trading on the date of commitment less the present value of dividends expected during the holding period, because beneficiaries are not entitled to receive dividends. This figure for determining the number of commitments amounted to €64.93 (prior year: €57.70).
Target parameter Weight 100% of target Actual 2012 figure Target attainment
Revenue growth (organic) 1 40 % 1% 3% 146.40%
ROCE adjusted 1 40% 16.1% 17.0% 123.75%
Free cash flow 1 20% €3,600 million €4,790 million 139.67%
Total target attainment 135.99%
1 Continuing operations

1 A. To our Shareholders 21 B. Corporate Governance
22 B.1 Corporate Governance Report 28 B.2 Corporate Governance statement pursuant to
Section 289a of the German Commercial Code (part of the Combined Management Report)
29 B.3 Compliance Report
31 B.4 Compensation Report (part of the Combined Management Report)
44 B.5 Takeover-relevant information (pursuant to Sections 289 para. 4 and 315 para. 4 of the German Commercial Code) and explanatory report (part of the Combined Management Report)
36
Total compensationOn the basis of the Supervisory Board decisions described above, Managing Board compensation for fiscal 2012 totaled €39.61 million, which is at the same level as in the previous year (2011: €39.61 million). Of this total amount, €17.45 million (2011: €18.94 million) was attributable to the cash compensa-tion components and €22.16 million (2011: €20.68 million) to stock-based compensation. Thus, more than half of the com-pensation was paid in the form of stock-based instruments with waiting or restriction periods of four years and therefore on a deferred basis.
The fair values of the granted stock-based compensation com-ponent shown in the following table do not represent a cash inflow for Managing Board members for fiscal 2012. They rep-
Non-performance-based components Performance-based components
without long-term incentive effect
non-stock-based
with long-term incentive effect
stock-based
Base compensation Other compensation 1 Variable compensation component (bonus) –
Cash component
Variable compensation component
(bonus) Bonus Awards2
Stock Awards 2 Total compensation 3
FY 2012 FY 2011 FY 2012 FY 2011 FY 2012 FY 2011 FY 2012 FY 2011 FY 2012 FY 2011 FY 2012 FY 2011
Target attainment depending on EPS for past
three fiscal years
Target attainment depending on future stock
performance
Target attainment depending on EPS for past
three fiscal years
Target attainment depending on future stock
performance
(Amounts in number of units or €) Shares Fair value 4 Shares Fair value 4 Shares Fair value 4 Shares Fair value 5 Shares Fair value 4 Shares Fair value 5
Managing Board members serving as of September 30, 2012
Peter Löscher 2,000,000 2,000,000 30,720 29,594 1,359,900 1,973,800 20,945 1,359,959 34,208 1,973,802 29,648 1,925,045 19,252 1,195,549 24,697 1,425,017 21,664 1,336,014 7,871,173 8,738,227
Dr. Roland Busch 6, 7 900,000 450,000 49,771 88,726 550,760 444,105 8,483 550,801 7,697 444,117 11,859 770,005 7,701 478,232 4,940 285,038 4,333 267,215 3,299,569 1,979,201
Brigitte Ederer 900,000 900,000 27,697 54,651 611,955 888,210 9,425 611,965 15,394 888,234 11,859 770,005 7,701 478,232 9,879 570,018 8,666 534,430 3,399,854 3,835,543
Klaus Helmrich 7 900,000 450,000 76,961 35,318 611,955 444,105 9,425 611,965 7,697 444,117 11,859 770,005 7,701 478,232 4,940 285,038 4,333 267,215 3,449,118 1,925,793
Joe Kaeser 8 900,000 900,000 72,935 72,411 611,955 888,210 9,425 611,965 15,394 888,234 20,754 1,347,557 13,477 836,922 9,879 570,018 8,666 534,430 4,381,334 3,853,303
Barbara Kux 900,000 900,000 33,960 168,176 611,955 888,210 9,425 611,965 15,394 888,234 11,859 770,005 7,701 478,232 9,879 570,018 8,666 534,430 3,406,117 3,949,068
Prof. Dr. Hermann Requardt 6 900,000 900,000 64,132 62,565 673,151 888,210 10,368 673,194 15,394 888,234 11,859 770,005 7,701 478,232 9,879 570,018 8,666 534,430 3,558,714 3,843,457
Prof. Dr. Siegfried Russwurm 900,000 900,000 42,146 41,303 611,955 888,210 9,425 611,965 15,394 888,234 11,859 770,005 7,701 478,232 9,879 570,018 8,666 534,430 3,414,303 3,822,195
Peter Y. Solmssen 9 900,000 900,000 33,498 64,720 611,955 888,210 9,425 611,965 15,394 888,234 11,859 770,005 7,701 478,232 9,879 570,018 8,666 534,430 3,405,655 3,845,612
Dr. Michael Süß 7 900,000 450,000 49,089 13,751 611,955 444,105 9,425 611,965 7,697 444,117 11,859 770,005 7,701 478,232 4,940 285,038 4,333 267,215 3,421,246 1,904,226
Former members of the Managing Board
Wolfgang Dehen 10 – 450,000 – 25,046 – 444,105 – – 7,697 444,117 – – – – 4,940 285,038 4,333 267,215 – 1,915,521
Total 10,100,000 9,200,000 480,909 656,261 6,867,496 9,079,480 105,771 6,867,709 157,360 9,079,674 145,274 9,432,642 94,337 5,858,327 103,731 5,985,277 90,992 5,611,454 39,607,083 39,612,146
1 Other compensation includes costs, or the cash equivalent, of non-monetary benefits and perquisites, such as provision of Company cars in the amount of €257,855 (2011: €212,641) contributions toward the cost of insurance in the amount of €87,429 (2011: €72,964), reimbursement of fees for legal advice, tax advice and accommodation and moving ex-penses, including any taxes that have been assumed in this regard as well as costs con-nected with preventive medical examinations, in the amount of €135,625 (2011: €370,656).
2 The expenses recognized for stock-based compensation (Bonus Awards and Stock Awards) and for the Share Matching Plan for members of the Managing Board in accordance with IFRS in fiscal 2012 and 2011 amounted to €15,995,543 and €15,193,559, respectively.The following amounts pertained to the members of the Managing Board in fiscal 2012: Peter Löscher €3,757,710 (2011: €4,042,438), Dr. Roland Busch €735,167 (2011: €285,356), Brigitte Ederer €950,250 (2011: €766,761), Klaus Helmrich €735,167 (2011: €285,356),
Joe Kaeser €1,781,626 (2011: €1,770,429 ), Barbara Kux €1,493,576 (2011: €1,290,005), Prof. Dr. Hermann Requardt €1,605,244 (2011: €1,741,299), Prof. Dr. Siegfried Russwurm €1,571,872 (2011: €1,701,676), Peter Y. Solmssen €1,566,372 (2011: €1,696,632) and Dr. Michael Süß €735,167 (2011: €285,356). The corresponding expenses for the former Board member Wolfgang Dehen amounted to €1,063,392 (2011: €1,328,251).
3 The total compensation reflects the current fair value of stock-based compensation components. On the basis of the current monetary values of stock-based compensation components, total compensation amounted to €39,874,058 (2011: €39,250,929).
4 For Bonus Awards as well as Stock Awards, whose target attainment depends on EPS for the past three fiscal years, the fair value on the award date is equivalent to the respec-tive monetary values.
resent the notional value of the Bonus Awards and Stock Awards granted in fiscal 2012 as calculated on the basis of re-porting standards. The transfer of one share per award will not take place until the expiration of the four-year waiting or re-striction period, or in other words, not until November 2016. The number of Stock Awards linked to the performance of the price of Siemens stock will be adjusted after the end of the restriction period, on the basis of the actual target attainment. Accordingly, the value of the actual shares transferred may be higher or lower than shown here, also depending on the stock price in effect at the time of transfer.
The following compensation was determined for each of the members of the Managing Board for fiscal 2012 (individualized disclosure):

49 C. Combined Management Report 239 E. Additional Information 135 D. Consolidated Financial Statements37
Non-performance-based components Performance-based components
without long-term incentive effect
non-stock-based
with long-term incentive effect
stock-based
Base compensation Other compensation 1 Variable compensation component (bonus) –
Cash component
Variable compensation component
(bonus) Bonus Awards2
Stock Awards 2 Total compensation 3
FY 2012 FY 2011 FY 2012 FY 2011 FY 2012 FY 2011 FY 2012 FY 2011 FY 2012 FY 2011 FY 2012 FY 2011
Target attainment depending on EPS for past
three fiscal years
Target attainment depending on future stock
performance
Target attainment depending on EPS for past
three fiscal years
Target attainment depending on future stock
performance
(Amounts in number of units or €) Shares Fair value 4 Shares Fair value 4 Shares Fair value 4 Shares Fair value 5 Shares Fair value 4 Shares Fair value 5
Managing Board members serving as of September 30, 2012
Peter Löscher 2,000,000 2,000,000 30,720 29,594 1,359,900 1,973,800 20,945 1,359,959 34,208 1,973,802 29,648 1,925,045 19,252 1,195,549 24,697 1,425,017 21,664 1,336,014 7,871,173 8,738,227
Dr. Roland Busch 6, 7 900,000 450,000 49,771 88,726 550,760 444,105 8,483 550,801 7,697 444,117 11,859 770,005 7,701 478,232 4,940 285,038 4,333 267,215 3,299,569 1,979,201
Brigitte Ederer 900,000 900,000 27,697 54,651 611,955 888,210 9,425 611,965 15,394 888,234 11,859 770,005 7,701 478,232 9,879 570,018 8,666 534,430 3,399,854 3,835,543
Klaus Helmrich 7 900,000 450,000 76,961 35,318 611,955 444,105 9,425 611,965 7,697 444,117 11,859 770,005 7,701 478,232 4,940 285,038 4,333 267,215 3,449,118 1,925,793
Joe Kaeser 8 900,000 900,000 72,935 72,411 611,955 888,210 9,425 611,965 15,394 888,234 20,754 1,347,557 13,477 836,922 9,879 570,018 8,666 534,430 4,381,334 3,853,303
Barbara Kux 900,000 900,000 33,960 168,176 611,955 888,210 9,425 611,965 15,394 888,234 11,859 770,005 7,701 478,232 9,879 570,018 8,666 534,430 3,406,117 3,949,068
Prof. Dr. Hermann Requardt 6 900,000 900,000 64,132 62,565 673,151 888,210 10,368 673,194 15,394 888,234 11,859 770,005 7,701 478,232 9,879 570,018 8,666 534,430 3,558,714 3,843,457
Prof. Dr. Siegfried Russwurm 900,000 900,000 42,146 41,303 611,955 888,210 9,425 611,965 15,394 888,234 11,859 770,005 7,701 478,232 9,879 570,018 8,666 534,430 3,414,303 3,822,195
Peter Y. Solmssen 9 900,000 900,000 33,498 64,720 611,955 888,210 9,425 611,965 15,394 888,234 11,859 770,005 7,701 478,232 9,879 570,018 8,666 534,430 3,405,655 3,845,612
Dr. Michael Süß 7 900,000 450,000 49,089 13,751 611,955 444,105 9,425 611,965 7,697 444,117 11,859 770,005 7,701 478,232 4,940 285,038 4,333 267,215 3,421,246 1,904,226
Former members of the Managing Board
Wolfgang Dehen 10 – 450,000 – 25,046 – 444,105 – – 7,697 444,117 – – – – 4,940 285,038 4,333 267,215 – 1,915,521
Total 10,100,000 9,200,000 480,909 656,261 6,867,496 9,079,480 105,771 6,867,709 157,360 9,079,674 145,274 9,432,642 94,337 5,858,327 103,731 5,985,277 90,992 5,611,454 39,607,083 39,612,146
5 The monetary values reflecting a target attainment of 100% amount to €6,125,302 (2011: €5,250,237). For the individual members of the Managing Board, that value was: Peter Löscher €1,250,032 (2011: €1,250,013), Dr. Roland Busch €500,026 (2011: €250,014), Brigitte Ederer €500,026 (2011: €500,028), Klaus Helmrich €500,026 (2011: €250,014), Joe Kaeser €875,062 (2011: €500,028), Barbara Kux €500,026 (2011: €500,028), Prof. Dr. Hermann Requardt €500,026 (2011: €500,028), Prof. Dr. Siegfried Russwurm €500,026 (2011: €500,028), Peter Y. Solmssen €500,026 (2011: €500,028) and Dr. Michael Süß €500,026 (2011: €250,014). The corresponding monetary value for the former Board member Wolfgang Dehen amounted to €0 (2011: €250,014).
6 The Supervisory Board adjusted the bonus payout amounts resulting from target attainment individually as follows: Dr. Roland Busch by 10% downward, equivalent to €122,391 and Prof. Dr. Hermann Requardt by 10% upward, equivalent to €122,391.
7 Dr. Roland Busch, Klaus Helmrich and Dr. Michael Süß were elected full members of the Managing Board effective April 1, 2011.
8 The Supervisory Board increased the annual target amount for the monetary value of the Stock Awards commitment for Joe Kaeser for fiscal 2012 by 75% to €1,750,000.
9 Peter Y. Solmssen will be reimbursed for relocation expenses incurred by him upon termination of his membership on the Managing Board of Siemens AG.
10 Wolfgang Dehen resigned from the Managing Board effective March 31, 2011.
Due to rounding, numbers presented may not add up precisely to totals provided.
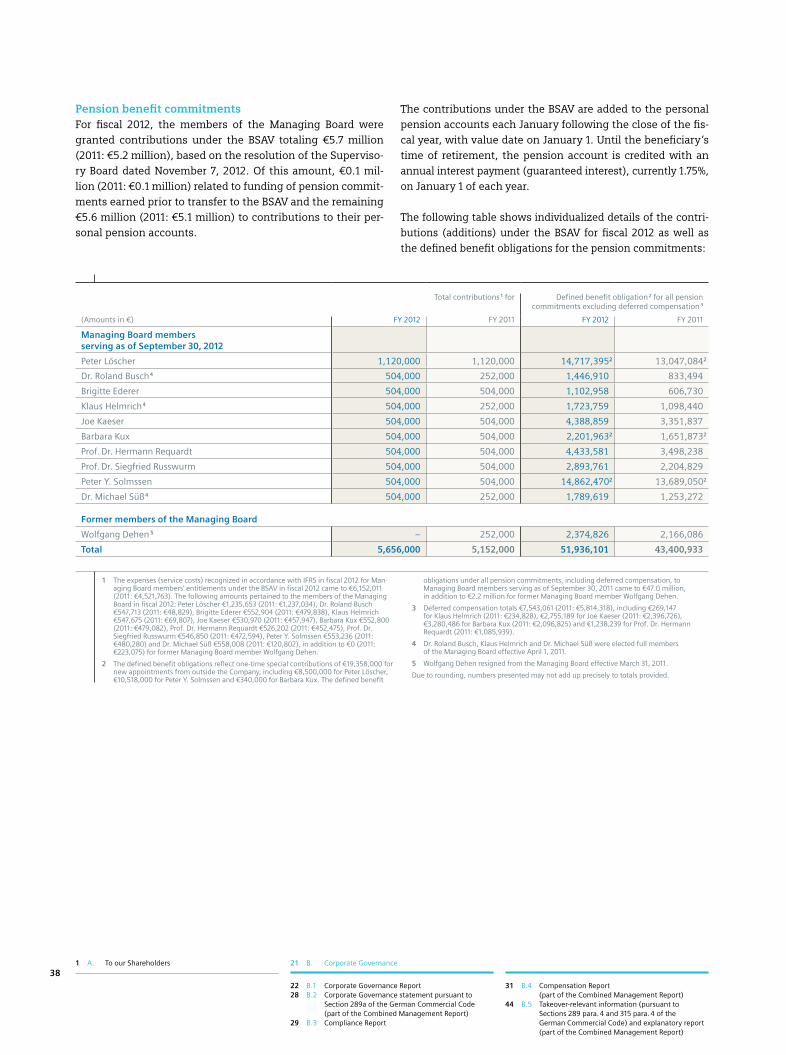
1 A. To our Shareholders 21 B. Corporate Governance
22 B.1 Corporate Governance Report 28 B.2 Corporate Governance statement pursuant to
Section 289a of the German Commercial Code (part of the Combined Management Report)
29 B.3 Compliance Report
31 B.4 Compensation Report (part of the Combined Management Report)
44 B.5 Takeover-relevant information (pursuant to Sections 289 para. 4 and 315 para. 4 of the German Commercial Code) and explanatory report (part of the Combined Management Report)
38
Pension benefit commitments For fiscal 2012, the members of the Managing Board were granted contributions under the BSAV totaling €5.7 million (2011: €5.2 million), based on the resolution of the Superviso-ry Board dated November 7, 2012. Of this amount, €0.1 mil-lion (2011: €0.1 million) related to funding of pension commit-ments earned prior to transfer to the BSAV and the remaining €5.6 million (2011: €5.1 million) to contributions to their per-sonal pension accounts.
The contributions under the BSAV are added to the personal pension accounts each January following the close of the fis-cal year, with value date on January 1. Until the beneficiary ‘s time of retirement, the pension account is credited with an annual interest payment (guaranteed interest), currently 1.75%, on January 1 of each year.
The following table shows individualized details of the contri-butions (additions) under the BSAV for fiscal 2012 as well as the defined benefit obligations for the pension commitments:
Total contributions 1 for Defined benefit obligation 2 for all pension commitments excluding deferred compensation 3
(Amounts in €) FY 2012 FY 2011 FY 2012 FY 2011
Managing Board members serving as of September 30, 2012
Peter Löscher 1,120,000 1,120,000 14,717,3952 13,047,0842
Dr. Roland Busch 4 504,000 252,000 1,446,910 833,494
Brigitte Ederer 504,000 504,000 1,102,958 606,730
Klaus Helmrich 4 504,000 252,000 1,723,759 1,098,440
Joe Kaeser 504,000 504,000 4,388,859 3,351,837
Barbara Kux 504,000 504,000 2,201,9632 1,651,8732
Prof. Dr. Hermann Requardt 504,000 504,000 4,433,581 3,498,238
Prof. Dr. Siegfried Russwurm 504,000 504,000 2,893,761 2,204,829
Peter Y. Solmssen 504,000 504,000 14,862,4702 13,689,0502
Dr. Michael Süß 4 504,000 252,000 1,789,619 1,253,272
Former members of the Managing Board
Wolfgang Dehen 5 – 252,000 2,374,826 2,166,086
Total 5,656,000 5,152,000 51,936,101 43,400,933
1 The expenses (service costs) recognized in accordance with IFRS in fiscal 2012 for Man-aging Board members’ entitlements under the BSAV in fiscal 2012 came to €6,152,011 (2011: €4,521,763). The following amounts pertained to the members of the Managing Board in fiscal 2012: Peter Löscher €1,235,653 (2011: €1,237,034), Dr. Roland Busch €547,713 (2011: €48,829), Brigitte Ederer €552,904 (2011: €479,838), Klaus Helmrich €547,675 (2011: €69,807), Joe Kaeser €530,970 (2011: €457,947), Barbara Kux €552,800 (2011: €479,082), Prof. Dr. Hermann Requardt €526,202 (2011: €452,475), Prof. Dr. Siegfried Russwurm €546,850 (2011: €472,594), Peter Y. Solmssen €553,236 (2011: €480,280) and Dr. Michael Süß €558,008 (2011: €120,802), in addition to €0 (2011: €223,075) for former Managing Board member Wolfgang Dehen.
2 The defined benefit obligations reflect one-time special contributions of €19,358,000 for new appointments from outside the Company, including €8,500,000 for Peter Löscher, €10,518,000 for Peter Y. Solmssen and €340,000 for Barbara Kux. The defined benefit
obligations under all pension commitments, including deferred compensation, to Managing Board members serving as of September 30, 2011 came to €47.0 million, in addition to €2.2 million for former Managing Board member Wolfgang Dehen.
3 Deferred compensation totals €7,543,061 (2011: €5,814,318), including €269,147 for Klaus Helmrich (2011: €234,828), €2,755,189 for Joe Kaeser (2011: €2,396,726), €3,280,486 for Barbara Kux (2011: €2,096,825) and €1,238,239 for Prof. Dr. Hermann Requardt (2011: €1,085,939).
4 Dr. Roland Busch, Klaus Helmrich and Dr. Michael Süß were elected full members of the Managing Board effective April 1, 2011.
5 Wolfgang Dehen resigned from the Managing Board effective March 31, 2011.
Due to rounding, numbers presented may not add up precisely to totals provided.

49 C. Combined Management Report 239 E. Additional Information 135 D. Consolidated Financial Statements39
Former members of the Managing Board and their surviving dependents received emoluments within the meaning of Sec-tion 314 para. 1 No. 6 b of the HGB totaling €15.8 million (2011: €15.0 million) in fiscal 2012, but no Stock Awards (2011: no Stock Awards).
The defined benefit obligation (DBO) of all pension commit-ments to former members of the Managing Board and their sur-viving dependents as of September 30, 2012, amounted to €181.6 million (2011: €161.9 million). This amount is included in
NOTE 23 IN d.6 NOTES TO CONSOlIdATEd fINANCIAl STATEMENTS.
OtherNo loans or advances from the Company are provided to mem-bers of the Managing Board.
B.4.1.3 AddITIONAl INfORMATION ON STOCK-BASEd COMPENSATION INSTRUMENTS IN fISCAl 2012This section provides information concerning the Stock Awards and stock options held by members of the Managing Board that were components of stock-based compensation in fiscal 2012 and prior years, and also about the Managing Board members’ entitlements to matching shares under the Siemens Share Matching Plan.
Stock CommitmentsThe following table shows the changes in the stock commit-ments (Bonus Awards and Stock Awards) held by Managing Board members in fiscal 2012:
Balance at beginning of fiscal 2012
Granted during fiscal year 1 Vested during
fiscal year
Forfeited during
fiscal year
Balance at end of fiscal 2012 2
Forfeitable commitments of Stock Awards
Non- forfeitable
commit-ments of
Bonus Awards
Forfeitable commit- ments of
Stock Awards
Non- forfeitable
commit-ments of
Bonus Awards
(Target attainment depending on EPS for past three
fiscal years)
(Target attainment depending
on future stock
performance)
Commit-ments of
Bonus Awards and
Stock Awards
Commit-ments of
Stock Awards
Non- forfeitable
commit-ments of
Bonus Awards
Forfeitable commit- ments of
Stock Awards(Amounts in number of units)
Managing Board members serving as of September 30, 2012
Peter Löscher – 144,180 34,208 24,697 21,664 66,402 – 34,208 124,139
Dr. Roland Busch 3 – 8,042 7,697 6,076 5,330 2,958 – 7,697 16,490
Brigitte Ederer – 12,422 15,394 9,879 8,666 4,179 – 15,394 26,788
Klaus Helmrich 3 – 11,816 7,697 6,540 5,737 4,257 – 7,697 19,836
Joe Kaeser – 57,673 15,394 9,879 8,666 26,561 – 15,394 49,657
Barbara Kux – 29,055 15,394 9,879 8,666 – – 15,394 47,600
Prof. Dr. Hermann Requardt – 57,673 15,394 9,879 8,666 26,561 – 15,394 49,657
Prof. Dr. Siegfried Russwurm – 57,673 15,394 9,879 8,666 26,561 – 15,394 49,657
Peter Y. Solmssen – 57,673 15,394 9,879 8,666 26,561 – 15,394 49,657
Dr. Michael Süß 3 – 20,435 7,697 7,118 6,244 8,884 – 7,697 24,913
Former members of the Managing Board
Wolfgang Dehen 4 – 57,673 7,697 4,940 4,333 26,561 – 7,697 40,385
Total – 514,315 157,360 108,645 95,304 219,485 – 157,360 498,779
1 The weighted average fair value as of the grant-date for fiscal 2012 was €58.75 per granted share.
2 Amounts do not include stock committments (Bonus Awards and Stock Awards) granted in November 2012 for fiscal 2012. For details, see PAgES 36-37. However, these amounts may include Stock Awards received as compensation by the Managing Board member before joining the Managing Board.
3 Dr. Roland Busch, Klaus Helmrich and Dr. Michael Süß were elected full members of the Managing Board effective April 1, 2011.
4 Wolfgang Dehen resigned from the Managing Board effective March 31, 2011. Because he changed positions within the Corporate group, his awards remain in effect under the applicable guidelines.

1 A. To our Shareholders 21 B. Corporate Governance
22 B.1 Corporate Governance Report 28 B.2 Corporate Governance statement pursuant to
Section 289a of the German Commercial Code (part of the Combined Management Report)
29 B.3 Compliance Report
31 B.4 Compensation Report (part of the Combined Management Report)
44 B.5 Takeover-relevant information (pursuant to Sections 289 para. 4 and 315 para. 4 of the German Commercial Code) and explanatory report (part of the Combined Management Report)
40
Stock optionsThe authorization to issue stock options expired in December 2006. On completion of a two-year vesting period, plan partici-pants were entitled to exercise their subscription rights within a three-year period. Allowing for the vesting period, the last options were exercised in fiscal 2011. Any options still unexer-cised expired that same year. Consequently no options were out-standing either as of September 30, 2012, or in the prior year.
Shares from the Share Matching PlanIn fiscal 2011, the members of the Managing Board were enti-tled for the last time to participate in the Siemens Share Match-ing Plan, and under the plan were entitled to invest up to 50% of the annual gross amount of their variable cash compensa-tion component (bonus) determined for fiscal 2010 in Siemens shares. After expiration of a vesting period of approximately three years, plan participants will receive one free matching share of Siemens stock for every three Siemens shares ac-quired and continuously held under the plan, provided the participants were employed without interruption at Siemens AG or a Siemens company until the end of the vesting period. The following table shows the development of the matching share entitlements of the individual members of the Managing Board in fiscal 2012.
Balance at beginning of fiscal 20121
Due during fiscal year
Forfeited during fiscal year
Balance at end of fiscal 2012 1, 2
Entitlement to matching shares
Entitlement to matching shares
Entitlement to matching shares
Entitlement to matching shares(Amounts in number of units)
Managing Board members serving as of September 30, 2012
Peter Löscher – – – –
Dr. Roland Busch 3 868 802 – 66
Brigitte Ederer 560 560 – –
Klaus Helmrich 3 1,131 1,128 – 3
Joe Kaeser 7,661 3,855 – 3,806
Barbara Kux 698 – – 698
Prof. Dr. Hermann Requardt 5,641 3,228 – 2,413
Prof. Dr. Siegfried Russwurm 5,459 4,926 – 533
Peter Y. Solmssen 6,051 6,051 – –
Dr. Michael Süß 3 – – – –
Former members of the Managing Board
Wolfgang Dehen 4 5,845 4,140 – 1,705
Total 33,914 24,690 – 9,224
1 Amounts may include entitlements acquired before the member joined the Managing Board.
2 The entitlements of the Managing Board members serving in fiscal 2012 had the follow-ing fair values: Peter Löscher €0 (2011: €0), Dr. Roland Busch €3,464 (2011: €21,039), Brigitte Ederer €0 (2011: €11,958), Klaus Helmrich €527 (2011: €25,059), Joe Kaeser €222,277 (2011: €305,003), Barbara Kux €33,282 (2011: €33,282), Prof. Dr. Hermann Requardt €140,823 (2011: €210,169), Prof. Dr. Siegfried Russwurm €25,487 (2011: €131,068), Peter Y. Solmssen €0 (2011: €129,588) and Dr. Michael Süß €0 (2011: €0). The entitlement of former Managing Board member Wolfgang Dehen has the following
fair value: €80,815 (2011: €169,623). The above fair values also take into account that the shares acquired under the Base Share Program as part of the Share Matching Plan were provided with a Company subsidy (for additional information on the Base Share Program see NOTE 33 IN d.6 Of THE NOTES TO CONSOlIdATEd fINANCIAl STATEMENTS).
3 Dr. Roland Busch, Klaus Helmrich and Dr. Michael Süß were elected full members of the Managing Board effective April 1, 2011.
4 Wolfgang Dehen resigned from the Managing Board effective March 31, 2011. Because he changed positions within the Corporate Group, his entitlements remain in effect under the applicable guidelines.
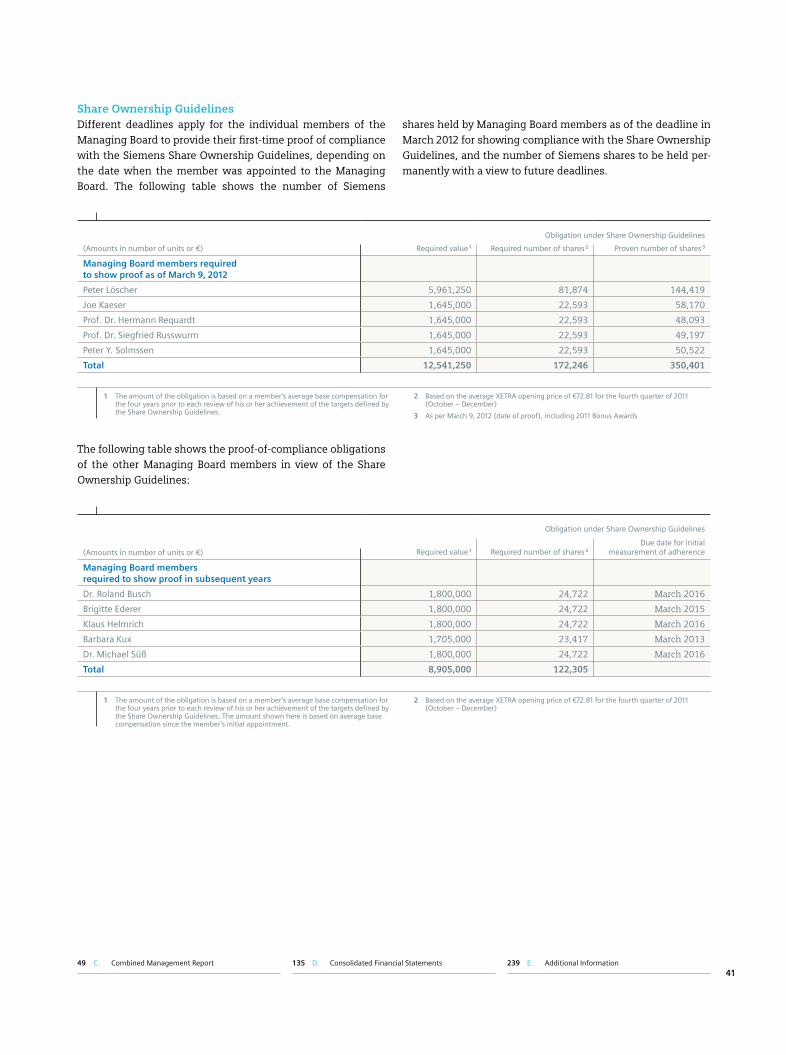
49 C. Combined Management Report 239 E. Additional Information 135 D. Consolidated Financial Statements41
Share Ownership GuidelinesDifferent deadlines apply for the individual members of the Managing Board to provide their first-time proof of compliance with the Siemens Share Ownership Guidelines, depending on the date when the member was appointed to the Managing Board. The following table shows the number of Siemens
shares held by Managing Board members as of the deadline in March 2012 for showing compliance with the Share Ownership Guidelines, and the number of Siemens shares to be held per-manently with a view to future deadlines.
The following table shows the proof-of-compliance obligations of the other Managing Board members in view of the Share Ownership Guidelines:
Obligation under Share Ownership Guidelines
(Amounts in number of units or €) Required value 1 Required number of shares 2 Proven number of shares 3
Managing Board members required to show proof as of March 9, 2012
Peter Löscher 5,961,250 81,874 144,419
Joe Kaeser 1,645,000 22,593 58,170
Prof. Dr. Hermann Requardt 1,645,000 22,593 48,093
Prof. Dr. Siegfried Russwurm 1,645,000 22,593 49,197
Peter Y. Solmssen 1,645,000 22,593 50,522
Total 12,541,250 172,246 350,401
1 The amount of the obligation is based on a member’s average base compensation for the four years prior to each review of his or her achievement of the targets defined by the Share Ownership Guidelines.
2 Based on the average XETRA opening price of €72.81 for the fourth quarter of 2011 (October – December)
3 As per March 9, 2012 (date of proof), including 2011 Bonus Awards
Obligation under Share Ownership Guidelines
Required value 1 Required number of shares 2Due date for initial
measurement of adherence (Amounts in number of units or €)
Managing Board members required to show proof in subsequent years
Dr. Roland Busch 1,800,000 24,722 March 2016
Brigitte Ederer 1,800,000 24,722 March 2015
Klaus Helmrich 1,800,000 24,722 March 2016
Barbara Kux 1,705,000 23,417 March 2013
Dr. Michael Süß 1,800,000 24,722 March 2016
Total 8,905,000 122,305
1 The amount of the obligation is based on a member’s average base compensation for the four years prior to each review of his or her achievement of the targets defined by the Share Ownership Guidelines. The amount shown here is based on average base compensation since the member’s initial appointment.
2 Based on the average XETRA opening price of €72.81 for the fourth quarter of 2011 (October – December)

1 A. To our Shareholders 21 B. Corporate Governance
22 B.1 Corporate Governance Report 28 B.2 Corporate Governance statement pursuant to
Section 289a of the German Commercial Code (part of the Combined Management Report)
29 B.3 Compliance Report
31 B.4 Compensation Report (part of the Combined Management Report)
44 B.5 Takeover-relevant information (pursuant to Sections 289 para. 4 and 315 para. 4 of the German Commercial Code) and explanatory report (part of the Combined Management Report)
42
B.4.2 Remuneration of members of the Supervisory Board
The current remuneration policies for the Supervisory Board were authorized at the Annual Shareholders’ Meeting held on January 25, 2011. Details are set out in Section 17 of the Articles of Association of Siemens AG. The remuneration of the Super-visory Board consists entirely of fixed compensation. The re-muneration of the members of the Supervisory Board reflects the responsibilities and scope of work of the Supervisory Board members. The Chairman and deputy chairmen of the Supervi-sory Board, as well as the Chairmen and members of the Audit Committee and the Chairman’s Committee, and – to a lesser degree – the Compliance Committee and the Finance and In-vestment Committee, receive additional compensation.
According to current rules, members of the Supervisory Board receive an annual base compensation of €140,000; the Chair-man of the Supervisory Board receives a base compensation of €280,000, and each of the deputy chairmen receives €220,000.
The members of the Supervisory Board committees receive the following additional fixed compensation for their work on those committees: The Chairman of the Audit Committee re-ceives €160,000, and each of the other members receives €80,000; the Chairman of the Chairman’s Committee receives €120,000, and each of the other members receives €80,000; the Chairman of the Finance and Investment Committee re-ceives €80,000, and each of the other members receives €40,000; the Chairman of the Compliance Committee receives
€80,000, and each of the other members receives €40,000. However, no additional compensation is paid for work on the Compliance Committee if a member of that committee is al-ready entitled to compensation for work on the Audit Committee.
If a Supervisory Board member does not attend a meeting of the Supervisory Board, one third of the aggregate compensa-tion due to that member is reduced by the percentage of Supervisory Board meetings not attended by the member in relation to the total number of Supervisory Board meetings held during the fiscal year.
In addition, the members of the Supervisory Board are entitled to receive a meeting attendance fee of €1,500 for each meeting of the Supervisory Board and its committees that they attend.
The members of the Supervisory Board are reimbursed for out-of-pocket expenses incurred in connection with their duties and for any value-added tax to be paid on their remu-neration. For the performance of his duties, the Chairman of the Supervisory Board is furthermore entitled to an office with secre tarial support and use of the Siemens carpool service.
No loans or advances from the Company are provided to mem-bers of the Supervisory Board.
The following compensation was determined for each of the members of the Supervisory Board for fiscal 2012 (individual-ized disclosure):

49 C. Combined Management Report 239 E. Additional Information 135 D. Consolidated Financial Statements43
B.4.3 Other
The Company provides a group insurance policy for board and committee members and certain employees of the Siemens organization that is taken out for one year and renewed annu-ally. The insurance covers the personal liability of the insured in the case of a financial loss associated with employment
functions. The insurance policy for fiscal 2012 includes a deductible for the members of the Managing Board and the Supervisory Board in compliance with the requirements of the German Stock Corporation Act and the German Corporate Governance Code.
FY 2012 FY 2011
Base compensation
Additional com-pensation for
committee work1 TotalBase
compensation
Additional com-pensation for
committee work Total(Amounts in €)
Supervisory Board members serving as of September 30, 2012
Dr. Gerhard Cromme 280,000 280,000 560,000 280,000 280,000 560,000
Berthold Huber 2 220,000 80,000 300,000 210,833 76,667 287,500
Dr. Josef Ackermann 207,778 75,556 283,333 210,833 76,667 287,500
Lothar Adler 2 140,000 160,000 300,000 140,000 160,000 300,000
Jean-Louis Beffa 132,222 37,778 170,000 140,000 40,000 180,000
Gerd von Brandenstein 140,000 40,000 180,000 134,167 38,333 172,500
Michael Diekmann 140,000 – 140,000 134,167 – 134,167
Dr. Hans Michael Gaul 140,000 160,000 300,000 140,000 160,000 300,000
Prof. Dr. Peter Gruss 140,000 – 140,000 128,333 – 128,333
Bettina Haller 2 140,000 80,000 220,000 140,000 80,000 220,000
Hans-Jürgen Hartung 2 140,000 – 140,000 140,000 – 140,000
Harald Kern 2 140,000 – 140,000 140,000 – 140,000
Jürgen Kerner 2, 3 105,000 90,000 195,000 – – –
Dr. Nicola Leibinger-Kammüller 132,222 – 132,222 128,333 – 128,333
Werner Mönius 2 140,000 40,000 180,000 140,000 40,000 180,000
Håkan Samuelsson 140,000 40,000 180,000 128,333 36,667 165,000
Dr. Rainer Sieg 140,000 – 140,000 140,000 – 140,000
Birgit Steinborn 2 140,000 120,000 260,000 140,000 120,000 260,000
Lord Iain Vallance of Tummel 140,000 80,000 220,000 140,000 80,000 220,000
Sibylle Wankel 2 140,000 40,000 180,000 140,000 40,000 180,000
Former Supervisory Board members
Dieter Scheitor 2, 3 46,667 40,000 86,667 140,000 120,000 260,000
Total 3,083,889 1,363,333 4,447,2224 3,034,999 1,348,334 4,383,3334
1 Dr. Gerhard Cromme as Chairman of the Supervisory Board and of the Chairman’s Committee, the Compliance Committee, and the Finance and Investment Committee, as well as a member of the Audit Committee; Berthold Huber as Deputy Chairman of the Supervisory Board and member of the Chairman’s Committee; Dr. Josef Ackermann as Deputy Chairman of the Supervisory Board and member of the Chairman’s Commit-tee; Lothar Adler as member of the Chairman’s Committee, the Compliance Committee and the Finance and Investment Committee; Jean-Louis Beffa as member of the Finance and Investment Committee; Gerd von Brandenstein as member of the Finance and Investment Committee; Dr. Hans Michael Gaul as Chairman of the Audit Committee and member of the Compliance Committee; Bettina Haller as member of the Audit Committee and the Compliance Committee; Jürgen Kerner as member of the Audit Committee and the Finance and Investment Committee; Werner Mönius as member of the Finance and Investment Committee; Håkan Samuelsson as member of the Finance and Investment Committee; Dieter Scheitor as member of the Audit Commit-tee and the Finance and Investment Committee; Birgit Steinborn as member of the Audit Committee and the Finance and Investment Committee; Lord Iain Vallance of Tummel as member of the Audit Committee and the Compliance Committee; and Sibylle Wankel as member of the Compliance Committee, each received an additional fixed compensation for their committee work.
2 Both the employee representatives on the Supervisory Board who represent the employees pursuant to Section 3 para. 1 No. 1 of the German Codetermination Act (Mitbestimmungsgesetz, MitbestG) and the representatives of the trade unions on the Supervisory Board declared their readiness to transfer their compensation to the Hans Boeckler Foundation, in accordance with the guidelines of the Confederation of German Trade Unions (DGB).
3 Jürgen Kerner succeeded Dieter Scheitor on the Supervisory Board by court-ordered appointment as of the end of the day of the Annual Shareholders’ Meeting on January 24, 2012.
4 In addition, the members of the Supervisory Board are entitled to receive a meeting attendance fee of €1,500 (2011: €1,500) for each meeting of the Supervisory Board and its committees that they attend. In fiscal 2012, Dr. Gerhard Cromme received meeting fees of €48,000 (2011: €46,500), Dr. Hans Michael Gaul received meeting fees of €34,500 (2011: €30,000), Lothar Adler received meeting fees of €30,000 (2011: €34,500), Bettina Haller received meeting fees of €25,500 (2011: €30,000), Lord Iain Vallance of Tummel received meeting fees of €25,500 (2011: €28,500), Dr. Josef Ackermann received meeting fees of €22,500 (2011: €19,500), Birgit Steinborn received meeting fees of €22,500 (2011: €30,000), Berthold Huber received meeting fees of €18,000 (2011: €19,500), Sibylle Wankel received meeting fees of €16,500 (2011: €18,000), Gerd von Brandenstein received meeting fees of €13,500 (2011: €16,500), Werner Mönius received meeting fees of €13,500 (2011: €18,000), Håkan Samuelsson received meeting fees of €13,500 (2011: €13,500), Jürgen Kerner received meeting fees of €12,000 (2011: €0), Dieter Scheitor received meeting fees of €10,500 (2011: €30,000), Jean-Louis Beffa received meeting fees of €9,000 (2011: €16,500), Michael Diekmann received meeting fees of €9,000 (2011: €10,500), Prof. Dr. Peter Gruss received meeting fees of €9,000 (2011: €9,000), Hans-Jürgen Hartung received meeting fees of €9,000 (2011: €12,000), Harald Kern received meeting fees of €9,000 (2011: €12,000), Dr. Rainer Sieg received meeting fees of €9,000 (2011: €12,000) and Dr. Nicola Leibinger-Kammüller received meeting fees of €7,500 (2011: €9,000).
Due to rounding, numbers presented may not add up precisely to totals provided.

1 A. To our Shareholders 21 B. Corporate Governance
22 B.1 Corporate Governance Report 28 B.2 Corporate Governance statement pursuant to
Section 289a of the German Commercial Code (part of the Combined Management Report)
29 B.3 Compliance Report
31 B.4 Compensation Report (part of the Combined Management Report)
44 B.5 Takeover-relevant information (pursuant to Sections 289 para. 4 and 315 para. 4 of the German Commercial Code) and explanatory report (part of the Combined Management Report)
44
The Takeover-Relevant Information pursuant to Sections 289 para. 4 and 315 para. 4 of the German Commercial Code (Han dels gesetzbuch) and Explanatory Report are part of the Combined Management Report.
B.5.1 Composition of common stock
As of September 30, 2012, the Company ’s common stock totaled €2.643 billion (2011: €2.743 billion) divided into 881 million (2011: 914,203,421) registered shares with no par value and a notional value of €3.00 per share. The shares are fully paid in. In accordance with Section 4 para. 3 of the Company ’s Articles of Association, the right of shareholders to have their owner-ship interests evidenced by document is excluded, unless such evidence is required under the regulations of a stock exchange on which the shares are listed. Collective share certificates may be issued. Pursuant to Section 67 para. 2 of the German Stock Corporation Act (Aktiengesetz), only those persons re-corded in the Company ’s stock register will be recognized as shareholders of the Company. For purposes of recording the shares in the Company ’s stock register, shareholders are re-quired to submit to the Company the number of shares held by them and their e-mail address if they have one and, in the case of individuals, their name, address and date of birth, or in the case of legal entities, their company name, business address and registered offices.
All shares confer the same rights and obligations. At the Annual Shareholders’ Meeting, each share of stock has one vote and accounts for the shareholders’ proportionate share in the Company ’s net income. Excepted from this rule are treasury shares held by the Company, which do not entitle the Company to any rights. The shareholders’ rights and obligations are gov-erned by the provisions of the German Stock Corporation Act, in particular by Sections 12, 53a et seq., 118 et seq. and 186 of this German Stock Corporation Act.
B.5.2 Restrictions on voting rights or transfer of shares
Shares issued to employees worldwide under the stock scheme implemented since the beginning of fiscal 2009, in particular the Share Matching Plan, are freely transferable. However, participants are required to own and hold the shares issued to them under the rules of the Plan for a vesting period of about three years, during which the participants have to have been continuously employed by Siemens AG or another Siemens company, in order to receive one matching share free
of charge for each three shares provided. The right to receive matching shares forfeits, if the underlying shares are sold, transferred, hedged on, pledged or hypothecated in any way during the vesting period.
The von Siemens-Vermögensverwaltung GmbH (vSV) has, on a sustained basis, powers of attorney allowing it to vote, as of October 12, 2012, 11,454,464 shares on behalf of members of the Siemens family, whereby aforementioned shares consti-tute a part of the overall number of shares held by members of the Siemens family. The vSV is a German limited liability com-pany and party to an agreement with, among others, members of the Siemens family (family agreement). In order to bundle and represent their interests, the members of the Siemens family established a family partnership. This family partner-ship makes proposals to the vSV with respect to the exercise of the voting rights at Shareholders’ Meetings of the Company, which are taken into account by the vSV when acting within the bounds of its professional discretion. Pursuant to the fami-ly agreement, the shares under powers of attorney are voted by the vSV collectively.
B.5.3 Equity interests exceeding 10% of voting rights
We are not aware of, nor have we been notified of, any share-holder directly or indirectly holding 10% or more of the voting rights.
B.5.4 Shares with special rights conferring powers of control
There are no shares with special rights conferring powers of control.
B.5.5 System of control of any employee share scheme where the control rights are not exercised directly by the employees
Shares of stock issued by Siemens AG to employees under its employee stock scheme are transferred directly to the employ-ees. The beneficiary employees who hold shares of employee stock may exercise their control rights in the same way as any other shareholder directly in accordance with applicable laws and the Articles of Association.
B.5 Takeover-relevanT InformaTIon (pursuanT To secTIons 289 para. 4 and 315 para. 4 of The German commercIal code) and explanaTory reporT

49 C. Combined Management Report 239 E. Additional Information 135 D. Consolidated Financial Statements45
B.5.6 Legislation and provisions of the articles of association applicable to the appointment and removal of members of the Managing Board and governing amendment to the Articles of Association
The appointment and removal of members of the Managing Board is subject to the provisions of Sections 84 and 85 of the German Stock Corporation Act and Section 31 of the German Codetermination Act (Mitbestimmungsgesetz). According to these provisions, members of the Managing Board are appoint-ed by the Supervisory Board for a maximum term of five years. They may be reappointed or have their term of office extended for one or more terms of up to a maximum of five years each. Pursuant to Section 31 para. 2 of the German Codetermination Act, a majority of at least two thirds of the members of the Supervisory Board is required to appoint members of the Man-aging Board. If such majority is not achieved, the Mediation Committee shall give, within one month after the first round of voting, a recommendation for the appointments to the Man-aging Board. The Supervisory Board will then appoint the members of the Managing Board with the votes of the majority of its members. If such appointment fails as well, the Chairman of the Supervisory Board shall have two votes in a new round of voting.
According to Section 8 para. 1 of the Articles of Association, the Managing Board is comprised of several members, the number of which is determined by the Supervisory Board. Pur-suant to Section 84 of the German Stock Corporation Act and Section 9 of the Articles of Association, the Supervisory Board may appoint a President of the Managing Board as well as a Vice President. If a required member of the Managing Board has not been appointed, the necessary appointment shall be made, in urgent cases, by a competent court upon motion by any party concerned, in accordance with Section 85 of the German Stock Corporation Act. Pursuant to Section 84 para. 3 of the German Stock Corporation Act, the Supervisory Board may revoke the appointment of an individual as member of the Managing Board or as President of the Managing Board for good cause.
According to Section 179 of the German Stock Corporation Act, any amendment to the Articles of Association requires a reso-lution of the Annual Shareholders’ Meeting. The authority to adopt purely formal amendments to the Articles of Association was transferred to the Supervisory Board under Section 13 para. 2 of the Articles of Association. In addition, by resolution of the Annual Shareholders’ Meetings on January 27, 2009 and January 25, 2011, the Supervisory Board has been authorized to amend Section 4 of the Articles of Association in accordance
with the utilization of the Authorized Capital 2009 and the Authorized Capital 2011, and after expiration of the then-appli-cable authorization period.
Resolutions of the Annual Shareholders’ Meeting require a simple majority vote, unless a greater majority is required by law. Pursuant to Section 179 para. 2 of the German Stock Corporation Act, amendments to the Articles of Association require a majority of at least three-fourth of the capital stock represented at the voting round, unless another capital major-ity is prescribed by the Articles of Association.
B.5.7 Powers of the Managing Board to issue and repurchase shares
The Managing Board is authorized to increase, with the approval of the Supervisory Board, the capital stock until Jan-uary 26, 2014 by up to €520.8 million through the issuance of up to 173.6 million registered shares of no par value against cash contributions and/or contributions in kind (Authorized Capital 2009). The Managing Board is authorized to exclude, with the approval of the Supervisory Board, preemptive rights of shareholders in the event of capital increases against con-tributions in kind. In addition, preemptive rights of sharehold-ers may be excluded in the event of capital increases against cash contributions, (1) to make use of any fractional amounts, (2) in order to grant holders of conversion or option rights is-sued by the Company or any of its subsidiaries, as protection against the effects of dilution, preemptive rights to subscribe for new shares, and (3) if the issue price of the new shares is not significantly lower than their stock market price and the total of the shares issued in accordance with Section 186 para. 3 sentence 4 of the German Stock Corporation Act (against cash contributions not significantly below the stock market price, with shareholders’ subscription rights excluded) to-gether with other shares issued or disposed of by direct or mutatis mutandis application of this statutory regulation dur-ing the effective period of this authorization until the date of using this authorization does not exceed 10% of the capital stock at that point in time.
Furthermore, the Managing Board is authorized to increase, with the approval of the Supervisory Board, the capital stock until January 24, 2016 by up to €90 million through the issu-ance of up to 30 million registered shares of no par value against contributions in cash (Authorized Capital 2011). Pre-emptive rights of existing shareholders are excluded. The new shares shall be issued under the condition that they are offered exclusively to employees of Siemens AG and its subsidiaries. The new shares may also be issued to a suitable bank that as-sumes the obligation to use these shares for the sole purpose

1 A. To our Shareholders 21 B. Corporate Governance
22 B.1 Corporate Governance Report 28 B.2 Corporate Governance statement pursuant to
Section 289a of the German Commercial Code (part of the Combined Management Report)
29 B.3 Compliance Report
31 B.4 Compensation Report (part of the Combined Management Report)
44 B.5 Takeover-relevant information (pursuant to Sections 289 para. 4 and 315 para. 4 of the German Commercial Code) and explanatory report (part of the Combined Management Report)
46
of granting them to employees of Siemens AG and any of its consolidated subsidiaries. To the extent permitted by law, em-ployee shares may also be issued in such a manner that the contribution to be paid on such shares is covered by that part of the annual net income which the Managing Board and the Supervisory Board may allocate to other retained earnings under Section 58 para. 2 of the German Stock Corporation Act.
As of September 30, 2012, the total unissued authorized capital of Siemens AG therefore consisted of €610.8 million nominal that may be issued in installments with varying terms by issu-ance of up to 203.6 million registered shares of no par value. For details, please refer to Section 4 of the Articles of Association.
By resolution of the Annual Shareholders’ Meeting of January 26, 2010, the Managing Board was authorized until January 25, 2015 to issue bonds in an aggregate principal amount of up to €15 billion with conversion rights or with warrants attached, or a combination of these instruments, entitling the holders to subscribe to up to 200 million new registered shares of Siemens AG of no par value, representing a pro rata amount of up to €600 million of the capital stock. The bonds under this authori-zation are to be issued against cash or non-cash contributions.
Besides, by resolution of the Annual Shareholders’ Meeting of January 25, 2011, the Managing Board was authorized until January 24, 2016 to issue bearer or registered bonds in an ag-gregate principal amount of up to €15 billion with conversion rights or with bearer or registered warrants attached or a com-bination of these instruments, entitling the holders to sub-scribe to up to 90 million new registered shares of Siemens AG of no par value, representing a pro rata amount of up to €270 million of the capital stock. The bonds under this authoriza-tion are to be issued against cash contributions.
For further details of the authorizations please refer to the re-spective resolutions of the Annual Shareholders’ Meetings. In particular, the bonds are, as a matter of principle, to be offered to shareholders for subscription, including the possibility of is-suing them to banks with the obligation that they must be of-fered to shareholders for subscription. However, the Managing Board is authorized to exclude shareholders’ subscription rights with the approval of the Supervisory Board (1) provided that the issue price of the bonds is not significantly lower than their theoretical market price computed in accordance with generally accepted actuarial methods, (2) to the extent the ex-clusion is necessary with regard to fractional amounts result-ing from the subscription ratio, (3) in order to grant holders of conversion or option rights or conversion or option obligations on Siemens shares subscription rights as compensation against the effects of dilution, and (4) to the extent that bonds were is-sued against non-cash contributions, in particular within the
context of business combinations or when acquiring compa-nies or interests therein.
In order to grant shares of stock to holders of convertible bonds or warrant bonds issued until January 25, 2015 by the Company or any of its consolidated subsidiaries in accordance with the authorization of the Managing Board adopted by the Annual Shareholders’ Meeting on January 26, 2010, the capital stock was conditionally increased by €600 million through the issu-ance of up to 200 million no-par value shares registered in the names of the holders (Conditional Capital 2010). In order to grant shares of stock to holders or creditors of convertible bonds or warrant bonds issued until January 24, 2016 by the Company or any of its consolidated subsidiaries in accordance with the authorization of the Managing Board adopted by the Annual Shareholders’ Meeting on January 25, 2011, the capital stock was conditionally increased by €270 million through the issuance of up to 90 million no-par value shares registered in the names of the holders (Conditional Capital 2011).
The total of the shares to be issued on the basis of bond issues under these authorizations pursuant to Section 186 para. 3 sen-tence 4 of the German Stock Corporation Act, in combination with other shares issued or sold by direct or mutatis mutandis application of this statutory regulation during the effective pe-riod of these authorizations, does not exceed 10% of the capital stock at the date of using these authorization. This limit also includes shares of stock issued up to this point in time against non-cash contributions, under exclusion of shareholders’ sub-scription rights, on the basis of the Authorized Capital 2009. In addition, the issue of convertible bonds and/or warrant bonds pursuant to both authorizations shall be limited to convertible bonds and/or warrant bonds that entitle or oblige to subscribe to a maximum number of 200 million Siemens shares repre-senting a pro rata amount of €600 million of the capital stock while both authorizations are simultaneously effective.
In February 2012 Siemens issued bonds with warrant units with a volume of US$3 billion. The bonds with warrant units with a minimum per-unit denomination of US$250,000 were offered exclusively to institutional investors outside the U.S. Pre-emptive rights of Siemens shareholders were excluded. The bonds issued by Siemens Financieringsmaatschappij N.V. are guaranteed by Siemens AG and complemented with war-rants issued by Siemens AG. The warrants entitle their holders to receive Siemens shares against payment of the exercise price in Euros. At issuance, the warrants resulted in option rights relating to a total of about 21.7 million Siemens shares. The terms and conditions of the warrants enable Siemens to service exercised option rights also by delivering treasury stock as well as to buy back the warrants. The bonds with war-rant units were issued in two tranches with maturities of

49 C. Combined Management Report 239 E. Additional Information 135 D. Consolidated Financial Statements47
5.5 and 7.5 years, respectively. The maturities refer to both the bonds and the related warrants. After issuance, the warrants can be detached from the bonds, the option period com-menced on March 28, 2012. The bonds with warrant units, the bonds detached from warrants and the warrants detached are listed by Deutsche Bank AG in the Open Market segment of the Frankfurt Stock Exchange (Freiverkehr).
On January 25, 2011, the Annual Shareholders’ Meeting autho-rized the Company to acquire until January 24, 2016 up to 10% of its 914,203,421 shares of stock existing at the date of adopt-ing the resolution or – if this value is lower – as of the date on which the authorization is exercised. The aggregate of shares of stock of Siemens AG repurchased under this authorization and any other Siemens shares previously acquired and still held in treasury by the Company or attributable to the Compa-ny pursuant to Sections 71d and 71e of the German Stock Cor-poration Act, may at no time exceed 10% of the then existing capital stock. Any repurchase of Siemens shares shall be ac-complished at the discretion of the Managing Board either (1) by acquisition over the stock exchange or (2) through a public share repurchase offer.
The Managing Board is additionally authorized, with the ap-proval of the Supervisory Board, to complete the repurchase of Siemens shares in accordance with the authorization de-scribed above, with the use of certain equity derivatives (put options, call options, forward purchases and by using a combi-nation of these derivatives). In exercising this authorization, all stock repurchases based on the equity derivatives are limit-ed to a maximum volume of 5% of the capital stock of 914,203,421 shares existing at the date of adopting the resolu-tion at the Annual Shareholders’ Meeting. An equity deriva-tive’s term of maturity must, in each case, not exceed 18 months and must be chosen in such a way that the repurchase of Siemens shares upon exercise of the equity derivative will take place no later than January 24, 2016.
Besides selling them over the stock exchange or through a public sales offer to all shareholders, the Managing Board was authorized by resolution of the Annual Shareholders’ Meeting on January 25, 2011 to also use Siemens shares repurchased on the basis of this or any previously given authorization as fol-lows: such Siemens shares may be (1) retired; (2) offered for purchase to individuals currently or formerly employed by the Company or any of its consolidated subsidiaries as well as to board members of any of the Company ’s consolidated subsid-iaries, or awarded and / or transferred to such individuals with a vesting period of at least two years, provided that the em-ployment relationship or board membership existed at the time of the offer or award commitment; (3) offered and trans-ferred, with the approval of the Supervisory Board, to third
parties against non-cash contributions, particularly in connec-tion with business combinations or the acquisition of compa-nies, businesses, parts of businesses or interests therein; (4) sold, with the approval of the Supervisory Board, to third par-ties against payment in cash if the price at which such Siemens shares are sold is not significantly lower than the market price of Siemens stock at the time of selling, or (5) used to meet ob-ligations or rights to acquire Siemens shares arising from, or in connection with, convertible bonds or warrant bonds issued by the Company or any of its consolidated subsidiaries. The ag-gregate volume of shares used under the authorization pursu-ant to (4) and (5) by mutatis mutandis application of the provi-sions of Section 186 para. 3sentence 4 of the German Stock Corporation Act together with other shares issued or sold by direct or mutatis mutandis application of this statutory regula-tion during the effective period of this authorization until the date of using this authorization must not exceed 10% of the capital stock at that point in time.
Furthermore, the Supervisory Board was authorized by resolu-tion of the Annual Shareholders’ Meeting on January 25, 2011 to use shares acquired on the basis of this or any previously given authorization to meet obligations or rights to acquire Siemens shares that were or will be agreed with members of the Managing Board of Siemens AG within the framework of rules governing Managing Board compensation. In particular, repurchased shares may be offered for acquisition, or awarded and / or transferred subject to a restriction period, by the Super-visory Board to the members of the Managing Board, provided that Managing Board membership existed at the time of the offer or award commitment.
In August 2012, Siemens announced a share buy back amount-ing to up to €3 billion, using the authorization given by the An-nual Shareholders’ Meeting on January 25, 2011. The shares re-purchased may be used for the purposes of cancellation and reduction of capital stock, issuance to employees, board mem-bers of affiliated companies and members of the Managing Board as well as to meet obligations arising under and in con-nection with convertible bonds and warrant bonds. The share buy back was completed on November 7, 2012, after repurchas-ing 37,949,286 shares, the total consideration paid for the shares amounting to about €2,9 billion (excluding incidental transaction charges). Additionally, the Managing Board decid-ed to cancel 33,203,421 treasury shares, which reduced the common stock from 914,203,421 to 881 million shares. As of September 30, 2012, the Company held 24,725,674 (2011: 39,952,074) shares of stock in treasury.
For further information on the authorized and conditional capi-tals and on the treasury stock of the Company as of September 30, 2012 see note 26 in D.6 notes to ConsoliDateD FinanCial
statements.

48
B.5.8 Significant agreements which take effect, alter or terminate upon a change of control of the Company following a takeover bid
Siemens AG maintains two lines of credit in an amount of €4 billion and an amount of US$4 billion respectively which pro-vide its lenders with a right of termination in the event that (1) Siemens AG becomes a subsidiary of another company or (2) a person or a group of persons acting in concert acquires effec-tive control over Siemens AG by being able to exercise decisive influence over its activities (Art. 3(2) of Council Regulation (EC) 139/2004). In addition, Siemens AG has a bilateral credit line at its disposal in the amount of €450 million which may be termi-nated by the lender if major changes in Siemens AG’s corpo-rate legal situation occur that jeopardize the orderly repay-ment of the credit.
Framework agreements concluded by Siemens AG under Inter-national Swaps and Derivatives Association Inc. documentation (ISDA Agreements) grant the counterparty a right of termina-tion upon the occurrence of the following events: (i) the Company consolidates with, merges into, or transfers at least substantially all its assets to a third party and (1) the resulting entity ’s creditworthiness is materially weaker than the Company ’s immediately prior to such event, or (2) the resulting entity fails to simultaneously assume the Company ’s obliga-tions under the ISDA Agreement; or (ii) additionally some ISDA Agreements grant the counterparty a right of termination upon a third party acquiring the beneficial ownership of equity secu-rities having the power to elect a majority of the Company ’s Supervisory Board or otherwise acquiring the power to control the Company ’s material policy-making decisions and the credit-worthiness of the Company is materially weaker than it was im-mediately prior to such event. In either situation, ISDA Agree-ments are designed such that upon termination all outstanding payment claims documented under them are to be netted.
In February 2012 Siemens issued bonds with warrant units with a volume of US$3 billion. In case of a “Change of Control”, the terms and conditions of these warrants enable their hold-ers to receive a higher number of Siemens shares in accor-dance with an adjusted strike price if they exercise their option rights within a certain period of time after the Change of Con-trol. This period of time shall end either (1) not less than 30 days and no more than 60 days after publication of the notice of the issuer regarding the Change of Control, as deter-
mined by the issuer or (2) 30 days after the Change of Control becomes first publicly known. The strike price adjustment de-creases depending on the remaining term of the warrants and is determined in detail in the terms and conditions of the war-rants. In this context, a Change of Control occurs if a person or persons acting in concert, respectively, acquires or acquire control of the Company.
B.5.9 Compensation agreements with members of the Managing Board or employees in the event of a takeover bidIn the event of a change of control – that is if one or several shareholders acting jointly or in concert acquire a majority of the voting rights in Siemens AG and exercise a controlling in-fluence, or if Siemens AG becomes a dependent enterprise as a result of entering into an intercompany agreement within the meaning of Section 291 of the German Stock Corporation Act, or if Siemens AG is to be merged into another company – any member of the Managing Board has the right to terminate the contract of employment if such change of control results in a substantial change in position (for example due to a change in corporate strategy or a change in the Managing Board mem-ber’s duties and responsibilities). If this right of termination is exercised, the Managing Board member is entitled to a sever-ance payment in the amount of not more than two years’ com-pensation. The calculation of the annual compensation in-cludes not only the base compensation and the target amount for the bonus, but also the target amount for the Stock Awards. This calculation will be based on the last contractual year be-fore the termination of the contract. Additionally, the sever-ance payments cover non-monetary benefits by paying an amount of 5% of the compensation or severance total. Further-more, compensatory or severance payments will be reduced 15% as a lump-sum allowance for discounted values and for in-come earned elsewhere. However, this reduction will apply on-ly to the portion of the compensatory or severance payment that was calculated without taking account of the first six months of the remaining term of the Managing Board mem-ber’s contract. The stock-based compensation components for which a firm commitment already exists remain unaffected. No severance payments are made to the extent the Managing Board member receives benefits from third parties on the occa-sion of, or in connection with, a change of control. A right of termination does not exist if the change of control occurs within a period of twelve months prior to a Managing Board member’s retirement.

C. Combined Management Report
Due to rounding, numbers presented throughout this Combined Management Report may not add up precisely to the totals provided and percentages may not precisely reflect the absolute figures.
C.
Co
mb
ine
d M
anag
em
en
t R
ep
ort
50 C.1 Business and economic environment 50 C.1.1 The Siemens Group
58 C.1.2 Economic environment
63 C.1.3 Strategy
64 C.2 Financial performance measures 64 C.2.1 Revenue growth
64 C.2.2 Capital efficiency and profitability
65 C.2.3 Capital structure
65 C.2.4 Dividend
66 C.2.5 Additional measures
66 C.2.6 Additional information for financial performance measures
69 C.3 Results of operations 69 C.3.1 Results of Siemens
72 C.3.2 Segment information analysis
80 C.3.3 Reconciliation to adjusted EBITDA (continuing operations)
82 C.4 Financial position 82 C.4.1 Principles and objectives
of financial management
83 C.4.2 Capital structure
84 C.4.3 Cash flows
86 C.4.4 Capital resources and requirements
93 C.5 Net assets position
95 C.6 Overall assessment of the economic position
96 C.7 Subsequent events
97 C.8 Sustainability 97 C.8.1 Sustainability at Siemens
98 C.8.2 Research and development
101 C.8.3 Supply chain management
102 C.8.4 Production
103 C.8.5 Quality management
103 C.8.6 Distribution and customer relations
104 C.8.7 Environmental Portfolio
106 C.8.8 Environmental performance
107 C.8.9 Employees
109 C.8.10 Compliance
111 C.8.11 Corporate citizenship
111 C.9 Report on expected developments and associated material opportunities and risks
111 C.9.1 Report on expected developments
116 C.9.2 Risk management
118 C.9.3 Risks
126 C.9.4 Opportunities
127 C.9.5 Significant characteristics of the accounting-related internal control and risk management system
129 C.10 Compensation Report, Corporate Governance statement pursuant to Section 289a of the German Commercial Code, Takeover-Relevant Information and Explanatory Report
130 C.11 Siemens AG (Discussion on basis of German commercial code) 130 C.11.1 Business and economic environment
130 C.11.2 Results of operations
132 C.11.3 Net assets and financial position
133 C.11.4 Employees
133 C.11.5 Risks and opportunities
133 C.11.6 Outlook
134 C.12 Notes and forward-looking statements

1 A. To our Shareholders 21 B. Corporate Governance 49 C. Combined Management Report
50 C.1 Business and economic environment 64 C.2 Financial performance measures 69 C.3 Results of operations 82 C.4 Financial position 93 C.5 Net assets position
95 C.6 Overall assessment of the economic position 96 C.7 Subsequent events 97 C.8 Sustainability 111 C.9 Report on expected developments and
associated material opportunities and risks
50
C.1.1 The Siemens Group
C.1.1.1 OrganizatiOn and basis Of presentatiOnWe are a globally operating, integrated technology company with core activities in the fields of energy, healthcare, industry, and infrastructure, and we occupy leading market positions worldwide in the majority of our businesses. We can look back on a successful history spanning 165 years, with groundbreak-ing and revolutionary innovations such as the invention of the dynamo, the first commercial light bulb, the first electric streetcar, the construction of the first public power plant, and the first images of the inside of the human body. On a continu-ing basis, we have around 370,000 employees as of September 30, 2012 and business activities in approximately 190 countries and reported consolidated revenue of €78.296 billion in fiscal 2012. We operate in excess of 290 major production and manu-facturing plants worldwide. In addition, we have office build-ings, warehouses, research and development facilities or sales offices in almost every country in the world.
Siemens comprises Siemens AG, a stock corporation under the Federal laws of Germany, as the parent company and a to-tal of about 1,000 legal entities, including minority invest-ments. Our Company is incorporated in Germany, with our corporate headquarters situated in Munich. Siemens operates under the leadership of its Managing Board, which comprises the Chief Executive Officer (CEO) and Chief Financial Officer (CFO) as well as the heads of selected corporate functions and the CEOs of the Sectors.
Our fundamental organizational principles are:
> the CEO principle, > the end-to-end business responsibility of the Sectors, Divisions and Business Units, and
> the unrestricted right of selected corporate functions to issue instructions in relation to a function to the extent legally permissible.
The Siemens Managing Board is the sole management body and has overall business responsibility in accordance with the German Stock Corporation Act (Aktiengesetz). At all other orga-nizational levels within our Company, management responsi-bility is assigned to individuals who make decisions and as-sume personal responsibility (CEO principle). This principle es-tablishes clear and direct responsibilities and fosters efficient decision-making.
Our Sectors, Divisions, Business Units and Financial Services (SFS) are “global entrepreneurs” and have end-to-end business responsibility worldwide, including with regard to their operat-ing results. They therefore have “right of way” over the regional units (Clusters and Countries) in business matters. The Clusters and Countries are responsible for the local customer relation-ship management and for implementing the business strate-gies of the Sectors and SFS as well as the requirements set by the corporate functions.
In addition to their particular authority to issue binding com-pany-wide guidelines and to their monitoring and coordinating responsibilities, the heads of selected corporate functions (Fi-nance and Controlling, Legal and Compliance, Human Resources and Supply Chain Management, for example) have an unrestrict-ed right to issue instructions in relation to a function across all parts of the Company to the extent legally permissible.
Below the Managing Board, Siemens is structured organiza-tionally into Sectors, SFS which acts as business partner for the Sectors and also conducts its own business with external customers, Cross-Sector Services that support other Siemens units, Corporate Units with specific corporate functions, and regional Clusters. The Sectors are principally broken down into Divisions and these in turn into Business Units.
During fiscal 2011, we initiated a change in the organizational structure of our Sectors which became effective October 1, 2011. Beginning with fiscal 2012, we formed a fourth Sector, Infra-structure & Cities, in addition to our existing three Sectors, Ener-gy, Healthcare and Industry, in order to benefit from the growth of urban centers and the demand for infrastructure solutions. The Infrastructure & Cities Sector comprises the activities of the former Industry Sector’s Divisions Building Technologies and Mobility and the former Energy Sector’s activities of the Power Distribution Division, including Smart Grid applications. Results for prior years are presented on a comparable basis.
Following this change in the organizational structure, our busi-ness activities focus on four Sectors, Energy, Healthcare, Indus-try and Infrastructure & Cities. These Sectors form four of our re-portable segments. In addition to our four Sectors, we have two additional reportable segments: Equity Investments and SFS.
C.1 Business and eConomiC environment

135 D. Consolidated Financial Statements 239 E. Additional Information
130 C.11 Siemens AG (Discussion on basis of German Commercial Code)
134 C.12 Notes and forward-looking statements
129 C.10 Compensation Report, Corporate Governance statement pursuant to Section 289a of the German Commercial Code, Takeover-relevant information and explanatory report
51
Within this combined management report, we provide finan-cial measures for our four Sectors and for two Businesses, each combining two Divisions within a Sector as well as for eight Di-visions of our Sectors. These financial measures include: new orders, revenue, profit and profit margin. Divisions within a Sector may do business with each other, leading to corre-sponding new orders and revenue. Such orders and revenues are only eliminated on a Sector level. Furthermore, our report-able segments may do business with each other, leading to corresponding new order and revenue. Such orders and reve-nues are eliminated on the Siemens level within Eliminations, Corporate Treasury and other reconciling items and are not in-cluded in new orders and revenue with external customers (external orders and external revenue, respectively) reported in this document. Free cash flow and further information is re-ported for each reportable segment in the Notes to Consolidat-ed Financial Statements.
For information related to the definition of these financial measures and to the reconciliation of segment financial mea-sures to the Consolidated Financial Statements, see C.12
nOtes and fOrward-lOOking statements and nOte 36 in d.6
nOtes tO COnsOlidated finanCial statements.
On a geographic basis, Siemens is subdivided into 14 Regional Clusters, which are in turn assigned to one of our three reporting regions. We report financial measures for these three regions:
In addition, we report financial information at group level for certain major countries within each region, including Germany (within the region Europe, C.I.S., Africa, Middle East), the U.S. (within the region Americas), and China and India (within the region Asia, Australia).
basis Of presentatiOn as Of september 30, 2012
Reporting structure
Fossil Power Generation
Wind Power Oil & Gas Power Transmission
Diagnostics Industry Automation Drive Technologies
Transportation & Logistics
Power Grid Solutions & Products
Building Technologies
Reconciliation to Consolidated Financial Statements
Energy Sector
Healthcare Sector
Industry Sector
Infrastructure & Cities Sector
Equity Investments
Financial Services
Centrally managedportfolio activities
Siemens Real Estate Corporate itemsand pensions
Eliminations,Corporate Treasury andother reconciling items
regiOnal struCture as Of september 30, 2012
1 Commonwealth of Independent States.
Regional structure
Europe, C.I.S.1, Africa, Middle East
AmericasAsia,
Australia

1 A. To our Shareholders 21 B. Corporate Governance 49 C. Combined Management Report
50 C.1 Business and economic environment 64 C.2 Financial performance measures 69 C.3 Results of operations 82 C.4 Financial position 93 C.5 Net assets position
95 C.6 Overall assessment of the economic position 96 C.7 Subsequent events 97 C.8 Sustainability 111 C.9 Report on expected developments and
associated material opportunities and risks
52
C.1.1.2 business desCriptiOnEnergyThe Energy Sector offers a wide spectrum of products, services and solutions for the generation and transmission of power, and the extraction, conversion and transport of oil and gas. It primar-ily addresses the needs of energy providers, but also serves in-dustrial companies, particularly in the oil and gas industry.
External revenue of the Sector was €27.302 billion in fiscal 2012, representing 35% of Siemens revenue. The following chart provides a geographic breakdown of the Sector’s exter-nal revenue in fiscal 2012.
At the end of fiscal 2012, the Energy Sector comprised the fol-lowing five Divisions: Fossil Power Generation; Wind Power; Oil & Gas; Power Transmission and Energy Service. In the fourth quarter of fiscal 2012, Siemens decided to divest its so-lar thermal business and photovoltaic business (solar busi-ness). Following the decision the solar thermal and photovol-taic businesses are reported as discontinued operations for all periods covered in this annual report. Energy formed a new Sector-led unit, Hydro & Storage. This unit comprises the Sec-tor’s hydro power generation activities including its minority stake in Voith Hydro Holding GmbH & Co. KG as well as its en-ergy storage devices.
The Fossil Power Generation Division offers high-efficiency products and solutions for fossil-based power generation. The offering extends from gas and steam turbines and generators to complete turnkey power plants. The Division concentrates on gas and steam turbines and turbo generators, including control systems, in the larger power range, with an emphasis on combined-cycle (gas and steam) power plants, heat recov-ery steam generators, steam power plants and conventional is-lands for nuclear power plants. It also develops solutions for instrumentation and control systems for all types of power plants and for use in power generation, including information technology solutions providing management applications from the plant to the enterprise level and is working on the de-velopment and production of systems based on emerging technologies such as integrated gasification and carbon cap-ture and storage. In fiscal 2012, the Division acquired the
NEM B.V. business, a specialist in heat recovery steam genera-tors for combined-cycle power plants. To further expand its global gas turbine manufacturing network, Fossil Power Gener-ation launched a subsidiary, Siemens Gas Turbine Technologies Holding B.V. in fiscal 2012. The Division has a 65% stake in the subsidiary. As part of the transaction, Fossil Power Generation completed the sale of its 25% interest in OAO Power Machines, Russia. The Division is represented in a number of joint ventures in China, including Shanghai Electric Power Generation Equip-ment in which Fossil Power Generation holds a stake of 40%.
The Wind Power Division manufactures wind turbines with a power rating ranging from 2.3 megawatts to 6.0 megawatts and rotor diameters spanning 82 to 154 meters for on- and off-shore applications. It also provides services to off- and onshore wind farms. The Division holds a 49% equity stake in a joint venture with Dong Energy A/S, A2Sea A/S, a supplier of installa-tion services for the construction of offshore wind-farms. In fiscal 2012, the Division entered into agreements for two joint ventures with Shanghai Electric Group (SEG) for the produc-tion and sales of wind turbines in China.
The Oil & Gas Division supplies highly efficient small and me-dium gas and steam turbines for industrial power generation and mechanical drives as well as turbo compressors for a broad range of applications to the oil and gas industries, the process industry and other industries. The Oil & Gas Division further of-fers a variety of automation and electrical products, systems and solutions for field, production and management levels, en-terprise intelligence solutions for safe and reliable operation, planning, scheduling and life-cycle services, including feasibil-ity studies, as well as design and performance enhancement programs. In addition, the Division offers a broad range of wa-ter treatment, (re-)injection and management systems for on-shore installations and for fixed and floating facilities offshore. Recent acquisitions, including all of the shares of five entities constituting the Connectors & Measurements business of Expro Holdings UK 3 Ltd., help the Division to strategically expand its range of products, solutions and consulting services for sub-sea activities.
The Energy Service Division offers comprehensive services, including parts and components, for complete power plants including on- and offshore wind farms as well as rotating ma-chines such as gas and steam turbines, generators and com-pressors. It provides these services using advanced plant diag-nostics and systems engineering. The Division also offers pow-er plant maintenance and operation services and emissions control services and systems. Financial results relating to the Energy Service Division are reflected in the Fossil Power Gen-eration Division, the Oil & Gas Division and the Wind Power Division and are therefore not reported separately.
revenue share in % (loCation of Customer)
1 Commonwealth of Independent States.
Europe, C.I.S.1, Africa, Middle East: 51%
therein Germany: 7%
Asia, Australia: 19%
Americas: 30%
therein U.S.: 20%
135 D. Consolidated Financial Statements 239 E. Additional Information
130 C.11 Siemens AG (Discussion on basis of German Commercial Code)
134 C.12 Notes and forward-looking statements
129 C.10 Compensation Report, Corporate Governance statement pursuant to Section 289a of the German Commercial Code, Takeover-relevant information and explanatory report
53
The Power Transmission Division covers high-voltage trans-mission solutions, power and distribution transformers, high-voltage switching and non-switching products and systems, and innovative alternating and direct current transmission systems. The Division supplies energy utilities and large indus-trial power users with equipment, systems and services used to process and transmit electrical power from the source, typi-cally a power plant, to various points along the power trans-mission network. The Division is working with joint ventures in China with different partners and has a joint venture with Infineon Technologies in Germany for design, manufacturing and sale of high performance semiconductors.
The Energy Sector distributes its products and services through its own dedicated sales force, supported by Siemens’ world-wide network of regional companies. Additional sales chan-nels include joint ventures and license partners, especially in markets requiring a high degree of local knowledge.
Overall, the Sector’s principal customers are large power utili-ties and independent power producers. Because certain signifi-cant areas of the Sector’s business, such as power plant con-struction, involve working on medium- or longer-term projects for customers who may not require the Sector’s services again in the short term, the Sector’s most significant customers tend to vary significantly from year to year.
The Energy Sector’s business activities vary widely in size from component delivery and comparatively small projects to turn-key contracts for the construction of new power plants with contract values of more than €0.5 billion each. The large size of some of the Sector’s projects occasionally exposes it to risks re-lated to technical performance, a customer or a country. The Sector has experienced, and may continue to experience signifi-cant losses on individual projects in connection with such risks. Moreover, the Sector generates an increasing portion of its rev-enue from oil and gas activities and industrial customers in the developing world. While this region represents a growth market for power generation, and transmission products and systems, the Sector’s activities in that region expose it to risks associated with economic, financial and political disruptions that could result in lower demand or affect customers’ abilities to pay.
While the Sector historically competed primarily with large in-dustrial companies from western countries, emerging market competitors have become more and more important, as they are increasingly expanding their operations beyond the borders of their home markets. The Sector’s competitors vary by Division.
The Fossil Power Generation Division’s market consists of a rel-atively small number of companies, some with very strong positions in their domestic markets. Its principal competitors
in gas turbines are Alstom, General Electric and Mitsubishi Heavy Industries, whereas its main competitors in steam tur-bines are Alstom, Bharat Heavy Electricals Limited, General Electric and Toshiba. In China, manufacturers are mainly focused on their large home market, but have recently begun to transform from local to international suppliers. The Division aims to participate in growth through a Chinese joint venture. Korean engineering and procurement companies offer a large product and solutions range and establish themselves as one-stop-shops which offer customer solutions out of one hand. In instrumentation and controls, ABB and Emerson Electric are the Division’s principal competitors.
The principal competitors in the market served by the Wind Power Division are Enercon, Gamesa, General Electric, Gold-wind, Sinovel, Suzlon and Vestas. The competitive situation differs between the market segments. In the market for on-shore wind-farms, competition is widely dispersed, without any one company holding a dominant share of the market. In contrast, there are only a few major players in the market for technologically more complex offshore wind-farms. Overall, the industry currently suffers from overcapacity and is largely regarded as being in an early stage of consolidation.
The principal competitors of the Oil & Gas Division vary by prod-uct; in automation and electrical equipment, they are ABB and Honeywell above all, whereas in compressors and steam and gas turbines, they are Dresser Rand, General Electric, MAN Diesel & Turbo and Solar Turbines. Overall, competition in the markets served by the Oil & Gas Division is characterized by a relatively small number of companies, some with a very strong position in the markets and some with a regional focus, playing key roles.
The primary competitors of the Power Transmission Division are a small group of large, multinational companies offering a wide variety of products, systems and services. Its key global competitors are ABB and Alstom. Further competition comes from emerging countries, regional and niche manufacturers, such as XD from China, Crompton Greaves from India, HHI from Korea and Mitsubishi Electric from Japan. Power Transmission Division entered into several joint ventures in China, which is the Sector’s largest national power transmission market.
HealthcareThe Healthcare Sector offers customers a comprehensive portfolio of medical solutions across the treatment chain – ranging from medical imaging to in-vitro diagnostics to inter-ventional systems and clinical information technology sys-tems – all from a single source. In addition, the Sector provides technical maintenance, professional and consulting services, and, together with Financial Services (SFS), financing to assist customers in purchasing the Sector’s products.

1 A. To our Shareholders 21 B. Corporate Governance 49 C. Combined Management Report
50 C.1 Business and economic environment 64 C.2 Financial performance measures 69 C.3 Results of operations 82 C.4 Financial position 93 C.5 Net assets position
95 C.6 Overall assessment of the economic position 96 C.7 Subsequent events 97 C.8 Sustainability 111 C.9 Report on expected developments and
associated material opportunities and risks
54
External revenue of the Sector was €13.600 billion in fiscal 2012, representing 17% of Siemens revenue. The following chart provides a geographic breakdown of the Sector’s exter-nal revenue in fiscal 2012.
The Healthcare Sector comprises the following three Divisions, one Operational Unit and one separate sector-led Business Unit. In addition to the financial results for the Sector, financial results are also reported externally for the Diagnostics Division.
The Imaging & Therapy Systems Division provides a broad range of medical devices for diagnostic imaging and for therapy solutions. Imaging equipment includes computer tomographs, magnetic resonance imaging equipment, and positron emission tomography. Siemens is a market leader in this field. Therapy solutions mainly comprise angiography systems, particle thera-py systems, and minimally invasive procedures. These systems are closely linked with imaging equipment, in particular in the area of therapy planning. The Division leverages synergies be-tween imaging equipment and therapy solutions in order to strengthen its leading position in these markets. Starting in fiscal 2011, the Division shifted the focus of certain particle ther-apy projects primarily to research. In fiscal 2012, the Sector re-structured its radiation oncology business and stopped the sales of linear accelerators as of January 1, 2012.
The Clinical Products Division mainly comprises the business with ultrasound and X-ray equipment including mammogra-phy. In addition to providing innovative high-end solutions, the Clinical Products Division focuses on the development of cost-efficient, less complex equipment that meets essential custom-er requirements, particularly in emerging economies. The Clini-cal Products Division also comprises the internal supplier Com-ponents and Vacuum Technology which also provides compo-nents to the Imaging & Therapy Systems Division.
The Diagnostics Division offers products and services in the area of in-vitro diagnostics. In-vitro diagnostics is based on the analysis of bodily fluids such as blood or urine and supplies vital information for the detection and management of disease as well as an individual patient’s risk assessment. The Division’s product portfolio represents a comprehensive range of diagnos-
tic testing systems and consumables, including clinical chemis-try and immunodiagnostics, molecular diagnostics (i.e., testing for nucleic acids), hematology, hemostasis, microbiology, point-of-care testing and clinical laboratory automation solutions.
The Sector’s Operational Unit Customer Solutions manages the sales and service organization as well as the Business Unit covering hospital information systems. Audiology Solutions provides hearing aids and is a sector-led Business Unit.
The customers of the Healthcare Sector include healthcare pro-viders such as hospital groups and individual hospitals, group and individual medical practices, reference and physician office laboratories and outpatient clinics. The Sector sells the majori-ty of its products and services through in-house sales staff, which is grouped in its Customer Solutions Operational Unit, supported by dedicated product specialists. In some countries, it also uses dealers, particularly for the sale of low-end products (such as low-end ultrasound and X-ray equipment). A small portion of the Sector’s revenue derives from the delivery of products and components to competitors on an original equip-ment manufacturer (OEM) basis. The Sector’s products are ser-viced primarily by its own dedicated personnel.
As a large part of Healthcare’s revenue stems from recurring business, the Sector’s business activities are to a certain extent resilient to short-term economic trends but are dependent on regulatory and policy developments around the world. The Healthcare Sector faces market risks in connection with ongo-ing health care reform efforts. In the U.S., a health care reform was enacted in the spring of 2010. In particular in connection with this reform, it is currently expected that an excise tax will be charged on certain medical devices from 2013 onwards. Siemens believes that this tax will impact all businesses ex-cept of Audiology.
The Healthcare Sector’s principal competitors in medical imag-ing are General Electric, Philips, Toshiba, Hitachi and Hologic. Other competitors include Roche, Abbott and Danaher for in-vitro diagnostics, McKesson and Cerner for healthcare infor-mation technology systems and Sonova, GN Resound, William Demant and Starkey for audiology (hearing aids). The trend to-ward consolidation in the Sector’s industry continues. Compe-tition among the leading companies in the field is strong, in-cluding with respect to price.
In fiscal 2012, the Healthcare Sector launched Agenda 2013, a global initiative to grow its innovative capacity and make itself more competitive. Agenda 2013 is the Sector’s proactive re-sponse to the challenges emerging from a changing market en-vironment. To meet these challenges, Agenda 2013 includes measures targeting innovation, regional presence, competitive-
revenue share in % (loCation of Customer)
1 Commonwealth of Independent States.
Europe, C.I.S.1, Africa, Middle East: 34%
therein Germany: 8%
Asia, Australia: 24%
Americas: 42%
therein U.S.: 35%

135 D. Consolidated Financial Statements 239 E. Additional Information
130 C.11 Siemens AG (Discussion on basis of German Commercial Code)
134 C.12 Notes and forward-looking statements
129 C.10 Compensation Report, Corporate Governance statement pursuant to Section 289a of the German Commercial Code, Takeover-relevant information and explanatory report
55
ness, and human resource development. These include focused investments in product development and expanded sales activ-ities in growth markets. Agenda 2013 also encompasses a re-alignment of the radiation therapy business unit that includes rightsizing measures. In addition, Agenda 2013 includes a pro-gram to improve the cost position in the Diagnostics Division.
IndustryThe Industry Sector offers a broad spectrum of products, servic-es and solutions for the efficient use of resources and energy and improvements of productivity and flexibility in industry. Its integrated technologies and holistic solutions address primarily industrial customers, such as process and manufacturing indus-tries. The portfolio spans industry automation, industrial soft-ware and drives products and services, system integration and solutions for industrial plant businesses. After the close of fiscal 2012, the Sector decided to dispose of its business of mechani-cal, biological and chemical treatment and processing of water.
External revenue of the Sector was €18.872 billion in fiscal 2012, representing 24% of Siemens revenue. The following chart provides a geographic breakdown of the Industry Sec-tor’s external revenue in fiscal 2012.
The Industry Sector consists of the three Divisions Industry Automation, Drive Technologies and Customer Services as well as the sector-led Metals Technologies Business Unit. Financial results relating to the Customer Services Division are reflected in the Industry Automation Division, the Drive Technologies Division and the Metals Technologies Business Unit and are therefore not reported separately.
The Industry Automation Division offers automation systems such as programmable logic controllers and process control systems, sensors such as process instrumentation and analyt-ics, and industrial software such as product lifecycle manage-ment and manufacturing execution systems software. The Division’s portfolio ranges from standard products and systems for the manufacturing, processing and construction industries to solutions for entire industrial vertical markets, including au-tomation solutions for entire automobile production facilities and chemical plants. Furthermore, the Division’s offerings in
fiscal 2012 comprised equipment and related services for indus-trial process water, industrial and municipal wastewater treat-ment such as water purification systems, clarification systems and systems and solutions for water recycling and reuse. As not-ed above, Industry has decided to divest its business of mechan-ical, biological and chemical treatment and processing of water. The Division will continue to offer efficient solutions for the control, management and instrumentation of water processes. In fiscal 2012, Industry Automation completed the acquisitions of RuggedCom Inc., a provider of robust, industrial-quality eth-ernet communication products and network solutions as well as several other acquisitions to enhance its offerings for industrial software. After the close of fiscal 2012, the Division announced the acquisition of LMS International, a provider of mechatronic simulation software that expands and complements the Divi-sion’s product lifecycle management portfolio.
The Drive Technologies Division offers integrated technolo-gies that cover a wide range of drive applications with electri-cal components such as standard motors and drives for con-veyor belts, pumps and compressors, heavy duty motors and drives for rolling steel mills, compressors for oil and gas pipe-lines and mechanical components such as gears for wind tur-bines and cement mills. With its e-Car business, the Division develops motors and inverters for electric cars for the automo-tive industry. Drive Technologies offers products such as auto-mation systems and services for production machinery and machine tools. The Division’s portfolio includes standard prod-ucts as well as industry-specific control and drive solutions for wind power, metal forming, printing and electronic manufac-turing as well as solutions for manufacturers of glass, wood, plastic, ceramic, textile and packaging equipment and crane systems. In addition, the Division offers integrated drive and automation solutions especially for the marine and shipbuild-ing, minerals and pulp and paper industries, including related services over the lifecycle of the solutions.
The Customer Services Division offers a comprehensive portfo-lio of services and supports industrial customers in their efforts to increase their productivity. The portfolio includes product- related services which seek to enhance reliability, profitability, efficiency and environmental compatibility of industrial plants.
The Sector-led Metals Technologies Business Unit offers en-gineering and plant-building services for the iron and steel in-dustry, as well as for the rolling sector of the aluminum and non-ferrous industries. The Business Unit provides technolo-gies, solutions, and services for metallurgical plants, integrat-ed steelworks and minimills. Its vertically integrated supply capability includes mechanical equipment, drives, motors, electrics, automation, mechatronics, technological packages and all environmental systems.
revenue share in % (loCation of Customer)
1 Commonwealth of Independent States.
Europe, C.I.S.1, Africa, Middle East: 52%
therein Germany: 24%
Asia, Australia: 25%
Americas: 23%
therein U.S.: 15%

1 A. To our Shareholders 21 B. Corporate Governance 49 C. Combined Management Report
50 C.1 Business and economic environment 64 C.2 Financial performance measures 69 C.3 Results of operations 82 C.4 Financial position 93 C.5 Net assets position
95 C.6 Overall assessment of the economic position 96 C.7 Subsequent events 97 C.8 Sustainability 111 C.9 Report on expected developments and
associated material opportunities and risks
56
The Industry Sector’s principal customers are industrial cus-tomers in a broad range of markets, including transportation and logistics, metals and mining, machinery, utilities and au-tomotive. The Sector is active globally, including in emerging markets, especially those in the Asia, Australia region, which Sector management believes have a long-term growth poten-tial. Apart from the Siemens brand, the Sector markets some parts of its portfolio under different brand names (such as Flender for gears or Winergy for wind turbine components), depending on geography and technology.
The Sector sells its products primarily through dedicated per-sonnel in Siemens’ worldwide network of regional sales units. In addition, it uses original equipment manufacturers, solu-tion providers, installers, general contractors, third-party dis-tributors and independent agents.
The large size of some of the Sector’s projects occasionally ex-poses it to risks related to technical performance or specific customers or countries. In the past, the Sector has experi-enced significant losses on individual projects in connection with such risks. For additional information on these risks, see
C.9 repOrt On expeCted develOpments and assOCiated material,
OppOrtunities and risks.
The Sector has manufacturing locations worldwide, especially throughout North and South America, Western and Eastern Europe, and Asia, allowing it to stay close to its major customers and keep shipping charges low. In recent years, material costs have been negatively affected by significant price increases for metals, energy and other raw materials. The Sector continues to work on reducing the use of hazardous materials (e.g., lead) and to replace them in its products and processes. Sustainable products and processes, such as coking coal free iron produc-tion processes (COREX), energy efficient motors and energy management play a major role in its innovation strategy.
Average product lifetimes in the Sector’s product businesses tend to be short (typically ranging from one to five years from in-troduction) and are even shorter where software and electronics play an important role. The lifecycles in the solutions businesses tend to be longer, as the Sector supports its customers with sig-nificant services through the whole life of their infrastructures. The timing and extent to which a Division of the Industry Sector is affected by economic cycles depends largely on the kind of business activities it conducts. Business activities that tend to re-act very quickly to changes in the overall economic environment include many of the business activities of Industry Automation and those business activities of Drive Technologies that serve customers in the manufacturing industries. Business activities that are generally affected later by the changes in the overall economic environment include those business activities of Drive
Technologies that serve customers in process industries as well as in the energy and infrastructure sector.
The competitors of our Industry Sector can be grouped into multinational companies that offer a relatively broad portfolio and companies that are active only in certain of the geographic or product markets served by the Industry Sector. The Sector’s principal competitors with broad portfolios are multinational companies such as ABB, Emerson Electric and Schneider Elec-tric. In the industries in which the Sector is active consolida-tion is occurring on several levels. In particular, suppliers of automation solutions have supplemented their activities with actuator or sensor technology, while suppliers of components and products have supplemented their portfolio with comple-mentary products for their sales channels.
Asian competitors are generally focused on large-scale produc-tion and cost cutting. European competitors are focused on high quality lifecycle service. Nevertheless, most major com-petitors have established global bases for their businesses. In addition, competition in the field has become increasingly fo-cused on technological improvements and price. Intense com-petition, budget constraints and rapid technical progress with-in the industry place significant downward pressure on prices. In addition, competitors continuously shift their production to low-cost countries.
The main competitors of the Industry Automation Division are ABB, Schneider Electric, Rockwell and Emerson Electric. Within its product lifecycle management business, the Division also competes with, among others, Dassault Systemes and PTC. Competitors of the Drive Technologies Division include compa-nies with broad business portfolios such as ABB, Emerson Elec-tric and Mitsubishi Electric but also specialist companies such as Fanuc and SEW. The main competitors of our Metals Tech-nologies Business Unit are Danieli and SMS.
Infrastructure & CitiesThe Infrastructure & Cities Sector offers a wide range of sus-tainable technologies for metropolitan centers and urban infra-structures worldwide, such as integrated mobility solutions, building and security systems, power distribution equipment, smart grid applications and low- and medium-voltage products.
revenue share in % (loCation of Customer)
1 Commonwealth of Independent States.
Europe, C.I.S.1, Africa, Middle East: 60%
therein Germany: 17%
Asia, Australia: 14%
Americas: 26%
therein U.S.: 19%
135 D. Consolidated Financial Statements 239 E. Additional Information
130 C.11 Siemens AG (Discussion on basis of German Commercial Code)
134 C.12 Notes and forward-looking statements
129 C.10 Compensation Report, Corporate Governance statement pursuant to Section 289a of the German Commercial Code, Takeover-relevant information and explanatory report
57
External revenue of the Sector was €16.731 billion in fiscal 2012, representing 21% of Siemens revenue. The following chart provides a geographic breakdown of the Infrastruc-ture & Cities Sector’s external revenue in fiscal 2012.
The Sector consists of five Divisions: Rail Systems; Mobility and Logistics; Low and Medium Voltage; Smart Grid; and Building Technologies. Financial results of the Rail Systems and the Mo-bility and Logistics Divisions are reported together in the Trans-portation & Logistics Business. Financial results of the Divisions Low and Medium Voltage and Smart Grid are reported together in the Power Grid Solutions & Products Business.
The Rail Systems Division comprises Siemens’ rail vehicle business. The Division’s activities consist mainly of the busi-nesses relating to rail vehicles for mass transit, regional and long-distance transportation, driverless systems, locomotives for passengers or rail freight, traction systems, bogies and on-board power supplies.
The Mobility and Logistics Division primarily provides prod-ucts, solutions (including IT solutions) and services in operating systems for rail transportation such as central control systems, interlockings and automated train controls, for road traffic in-cluding traffic detection, information and guidance, for airport logistics including cargo tracking and baggage handling and for postal automation including letter and parcel sorting.
The Low and Medium Voltage Division supplies electrical grid operators and large industrial electricity consumers with medium- and low-voltage equipment. Furthermore, the Divi-sion provides systems and services for the distribution of elec-trical power from high-voltage transmission grid access to me-dium or low-voltage grids directing the electrical energy to end consumers and their access points.
The Smart Grid Division provides energy automation solutions, smart grid applications, transmission and distribution services, applications for electromobility solutions and rail infrastructure electrification solutions for mainline and mass transit applica-tions. In fiscal 2012, the Division acquired the U.S.-based com-pany eMeter in order to position the Division to expand its ener-gy information and meter data management solutions.
The Building Technologies Division offers products, services and solutions for commercial, industrial, public and residential buildings, including building automation, comfort, building safety and security and building operations. In addition, the Division offers energy solutions aiming to improve a building’s energy cost, reliability and performance, while minimizing its impact on comfort and the environment. The Division’s offer-ings include heating and ventilation controls, security systems
and devices such as intruder detection, video surveillance and building access control, fire safety solutions such as fire detec-tion, protection alarm systems and non-water based fire extin-guishing.
The Infrastructure & Cities Sector also holds the Atos S.A. (AtoS) shares and the convertible bond, which Siemens received fol-lowing the sale of Siemens IT Solutions and Services to AtoS.
The Infrastructure & Cities Sector distributes its products and services through its own dedicated sales force, supported by Siemens’ worldwide network of regional companies. In addi-tion, the Divisions of the Sector use, to varying degrees, third-party distributors, panel builders, original equipment manufac-turers, value added partners, installers and general contractors.
Overall, the Sector’s principal customers are railway operators, public utilities, industrial and infrastructure customers, elec-trical grid operators, construction and real estate customers and manufacturers of heating, ventilation and air-conditioning solutions. The timing and extent to which a Division of the Infrastructure & Cities Sector is affected by economic cycles de-pends largely on the kind of business activities it conducts. Business activities that tend to react very quickly to changes in the overall economic environment include Low and Medium Voltage. Divisions where business activities are generally af-fected later by the changes in the overall economic environ-ment include Smart Grid and Building Technologies. The de-velopment of markets served by our Rail Systems Division and Mobility and Logistics Division is primarily driven by public spending. Customers of these Divisions usually have multi-year planning and implementation horizons. They therefore tend to be independent of short-term economic trends.
The Sector is globally active in a broad range of markets, in-cluding construction and real estate, transportation and logis-tics and utilities. The Sector’s activities include emerging mar-kets, e.g., those in the Asia, Australia region. While the Sector believes that these markets offer significant growth potential, the Sector’s activities in that region expose it to risks associat-ed with economic, financial and political disruptions that could result in lower demand or affect customers’ abilities to pay. Some markets, such as those served by our Divisions Rail Systems, Mobility and Logistics and Smart Grid, are signifi-cantly influenced by public spending. The large size of some of the Sector’s projects (especially in the following Divisions: Rail Systems, Mobility and Logistics and in parts of Building Tech-nologies) occasionally exposes it to risks related to technical performance or specific customers or countries. In the past, the Sector has experienced significant losses on individual projects in connection with such risks. For additional informa-tion on these risks, see C.9 repOrt On expeCted develOpments
and assOCiated OppOrtunities and risks.

1 A. To our Shareholders 21 B. Corporate Governance 49 C. Combined Management Report
50 C.1 Business and economic environment 64 C.2 Financial performance measures 69 C.3 Results of operations 82 C.4 Financial position 93 C.5 Net assets position
95 C.6 Overall assessment of the economic position 96 C.7 Subsequent events 97 C.8 Sustainability 111 C.9 Report on expected developments and
associated material opportunities and risks
58
The Sector’s principal competitors are multinational companies such as ABB, Alstom, Ansaldo, Bombardier, General Electric, Honeywell, Johnson Controls, Schneider Electric and Tyco. The Sector’s competitors vary by Division. The main competitors of the Rail Systems Division and the Mobility and Logistics Divi-sion are Alstom, Ansaldo, Bombardier and General Electric. The primary competitors of the Low and Medium Voltage Division are ABB, General Electric, Honeywell and Schneider Electric. The principal competitors of the Smart Grid Division are ABB, Alstom, General Electric, and Schneider Electric. The main com-petitors of the Building Technologies Division are Honeywell, Johnson Controls, Schneider Electric and Tyco. Infrastruc-ture & Cities also faces competition from niche competitors and from new entrants, such as utility companies and consulting firms, exploiting the fragmented energy efficiency market. The Sector’s solution businesses also compete with engineering, procurement and construction (ECP) providers while competi-tors in the service field often include small local players.
Equity InvestmentsIn general, the segment Equity Investments comprises equity stakes held by Siemens that are accounted for by the equity method, at cost or as current available-for-sale financial assets and are not allocated to a Sector, SFS, Centrally managed port-folio activities, Siemens Real Estate (SRE), Corporate items or Corporate Treasury for strategic reasons. Our main investments within Equity Investments are our stake of approximately 50.0% in Nokia Siemens Networks B.V. (NSN), our 50.0% stake in BSH Bosch und Siemens Hausgeräte GmbH (BSH) as well as our 49.0% stake in Enterprise Networks Holdings B.V. (EN).
Financial ServicesFinancial Services (SFS) provides a variety of financial servic-es and products both to third parties and to other Siemens en-tities and their customers. SFS has three strategic pillars: sup-porting Siemens Sectors with financing solutions for their cus-tomers, manage financial risks of Siemens and offering third-party financing services and products. To better achieve this goal, Financial Services intends to grow its business in a profit-able, controlled manner.
SFS’ business can be divided into capital business and fee busi-ness. The capital businesses support activities for Siemens’ sales as well as third party vendors and customers and consist of leasing, loans, asset-based lending and equity investments (both in infrastructure projects and corporate venture capital). The fee businesses comprise support and advisory activities concerning financial risk and investment management, proj-ect & export financing, and arranging of project financing for Siemens’ projects, treasury & financing services, pension asset / investment management, insurance brokerage as well as re-in-surance of Siemens risks.
SFS conducts its business through seven Business Units: Com-mercial Finance; Project and Structured Finance Energy; Proj-ect-, Structured and Leveraged Finance Healthcare; Project- and Structured Finance Infrastructure and Cities & Industry; Trea-sury; Financing Services & Investment Management and Insur-ance. In addition, one Business Segment (Venture Capital) is di-rectly assigned to SFS’ CEO. The SFS functions Trade Finance Advisory and Corporate Pensions provide advisory and assis-tance services to the entire Siemens Company. In addition, SFS host a number of functions to support its own business.
In its transactions with Siemens and third parties, SFS acts consistently with banking industry standards in the interna-tional financial markets that are both applicable and mandato-ry for these transactions. In December 2010, the Siemens Bank GmbH was granted a license by the German Federal Financial Supervisory Authority (Bundesanstalt für Finanzdienstleis-tungsaufsicht – BaFin) to engage in banking business. In par-ticular, the license covers engaging in loan, guarantee busi-ness and deposit taking. Siemens Bank GmbH was established to support the operational businesses of Siemens’ Sectors by providing financing solutions and the license enables the bank to gain access to the deposit and refinancing facilities of the European Central Bank.
SFS’ competition mainly includes commercial finance opera-tions of banks, independent commercial finance companies, captive finance companies and asset management companies. International competitors include BNP Paribas Equipment Finance, De Lage Landen, General Electric Commercial Finance, Macquarie and Société Générale Equipment Finance. Particu-larly in the commercial finance business, SFS’ competitors are often local financial institutions and competition therefore varies from country to country.
C.1.2 Economic environment
C.1.2.1 wOrldwide eCOnOmiC envirOnmentGrowth in the global economy continues to slow down in 2012, with real global gross domestic product (GDP) expected to rise by only 2.5% compared to 3.0% in 2011. Above all, the unstable economic situation in Europe burdens economic activity worldwide. Concerns about the stability of the banking sector, the sovereign debt crisis and the fragile economy continue to hamper private-sector investment and consumer spending. Moreover, austerity policies to cut government deficits and bring down debt levels in Europe have led to a significant re-duction of government spending. In addition, the U.S. economy remains sluggish and growth in emerging markets has cooled down due to spillover effects from advanced economies and various country-specific factors.

135 D. Consolidated Financial Statements 239 E. Additional Information
130 C.11 Siemens AG (Discussion on basis of German Commercial Code)
134 C.12 Notes and forward-looking statements
129 C.10 Compensation Report, Corporate Governance statement pursuant to Section 289a of the German Commercial Code, Takeover-relevant information and explanatory report
59
From a regional perspective, the slowdown is sharpest in Europe, with economic growth coming to a standstill in 2012. Restrictive fiscal policies, rising unemployment, large capital outflows to northern countries and the sovereign debt crisis have all deepened the contraction in the southern periphery economies. This in turn increasingly hampers growth in the core northern countries such as Germany. On top of that, the uncertain economic situation in Europe keeps consumer spending and private-sector investments on a low level. Gross fixed investment, one way in which gross domestic product is used, is expected to decline by 2.1% in 2012 compared to 2011. To foster the stability of the Eurozone, European governments have taken important measures. The establishment of the per-manent European Stability Mechanism (ESM) as a substitute for the temporary European Financial Stability Facility is aimed at ensuring the financial solvency of the Eurozone countries. Moreover, in order to bring down government bond yields and to ensure the functioning of monetary operations in every country of the monetary union, the European Central Bank (ECB) has declared its willingness to buy sovereign bonds on the secondary market without limit if a country meets the cri-teria of the ESM. This announcement calmed financial markets and reduced yields of Italian and Spanish bonds, making refi-nancing cheaper for these countries. Economic development in the Middle East is still affected by severe geopolitical ten-sions involving Iran and ongoing violence and unrest in Yemen and Syria, where the economy is contracting rapidly. In con-trast, growth in other oil-exporting countries remains robust, due to high oil prices. Growth in Africa is surprisingly strong in 2012. But the continent still suffers from an unstable politi-cal environment, and economic growth in many countries is highly dependent on raw material prices. The C.I.S. countries have to deal with relatively low growth of 3.6% in 2012. The whole region is negatively affected by the European sovereign debt crisis due to financial and trade linkages.
In the Americas, GDP growth is expected to slow slightly in 2012, to 2.3%. On one hand, the growth rate in Latin America is expected to decrease to 2.9%, due in part to lower export de-mand from a weak global economy. Furthermore, the global slowdown also causes some commodity prices to fall, which strongly affects Latin America as a major seller of commodi-ties. Hence, investment spending has slowed down consider-ably. Representative for the economic development in Latin America is Brazil, which is expected to grow by only 1.6% in 2012. On the other hand, the U.S. is expected to grow slightly faster year-over-year, with 2.1% growth compared to 1.8% in 2011. U.S. investment growth is expected to be particularly strong: 5.6% in 2012 compared to 3.4% in 2011. Additionally, the American housing market seems to be stabilizing towards the end of the year. Nevertheless, the U.S. faces a high level of debt and low employment growth. Moreover, the country ’s political gridlock creates economic uncertainty particularly re-garding tax increases and spending cuts that will take place automatically at the beginning of 2013 if no agreement can be reached (the so-called fiscal cliff).
In Asia, Australia growth is accelerating slightly in 2012, al-though China’s and India’s extraordinarily high growth levels are expected to cool down to 7.4% and 5.1%, respectively. China, a leading exporter, is significantly affected by the decrease in global demand, so gross fixed investments are trending in line with slower GDP growth. The Chinese govern-ment has implemented expansionary fiscal and monetary measures in order to support the economy. The Indian econo-my is negatively affected by strong credit linkages with a struggling Europe and weaker capital inflows. Moreover, India was also hit by a series of major electricity failures throughout the whole country. Japan’s economy started to recover from the consequences of the earthquake and tsunami in March 2011. Its expected growth rate of 2.3% is caused mainly by in-creased government spending, with a boost from stronger
wOrld real gdp grOwth (in % Compared to prior year) 1
2008 2009 2010 2011 2012 2
1 According to IHS Global Insight as of October 15, 2012; growth rates provided by calendar year.
2 Estimate for calendar year 2012.
1.6
(2.0)
3.0
4.2
2.5
real gdp grOwth per regiOn (Change in % Compared to prior year) 1
World Europe, C.I.S.3, Africa,
Middle East
Americas Asia, Australia
5
4
3
2
1
2012 2 2011
1 According to IHS Global Insight as of October 15, 2012; growth rates provided by calendar year.
2 Estimate for calendar year 2012.
3 Commonwealth of Independent States.
2.5
0.9
2.3
4.64.7
3.02.4 2.4

1 A. To our Shareholders 21 B. Corporate Governance 49 C. Combined Management Report
50 C.1 Business and economic environment 64 C.2 Financial performance measures 69 C.3 Results of operations 82 C.4 Financial position 93 C.5 Net assets position
95 C.6 Overall assessment of the economic position 96 C.7 Subsequent events 97 C.8 Sustainability 111 C.9 Report on expected developments and
associated material opportunities and risks
60
household spending. Furthermore, Indonesia, Thailand and Vietnam continue to grow rapidly and support the economy ’s growth of the Asia, Australia region of 4.7% in 2012.
A key factor for Siemens as a manufacturer is real manufac-turing value added, a component used in calculating gross domestic product by means of the production approach. De-spite accelerating growth in both the Asia, Australia and Americas regions, growth in manufacturing value added on a global basis is expected to decline in 2012 to 4.1% from 4.5% in 2011. This is due to significantly slower growth in the Europe, C.I.S., Africa, Middle East region, including a slight decline in Europe.
The partly estimated figures presented here for gross domestic product, gross fixed investments and manufacturing value add-ed are drawn from an IHS Global Insight report dated October 15, 2012. Siemens has not independently verified this data.
In addition to the common currency of the European Mone-tary Union (the euro, €) another key currency for Siemens is the US$. Following an appreciation of the € against the US$ at the beginning of fiscal 2012, concerns over the sovereign debt crisis in a number of southern European member states of the European Monetary Union led to decline of € against the US$. For the remainder of fiscal 2012, the value of the € relative to the US$ remained below its level at the end of fiscal 2011. Dur-ing July 2012, the value of the € against the US$ reached its lowest levels of the fiscal year. Only at the end of fiscal 2012 did the value of the € begin to recover somewhat. Among the contributing factors were the German constitutional court’s rejection of applications to block the ESM and the ECB’s an-nouncement of the modalities of a new government bond purchase program. Nevertheless at September 30, 2012, the value of the € against the US$ was around 4% below the level a year earlier.
Our businesses are dependent on the development of raw mate-rial prices. Key materials to which we have significant cost ex-posure include copper, various grades and formats of steel and aluminum. In addition, within stainless steel we have consider-able exposure related to nickel and chrome alloy materials.
The average monthly price of copper (denominated in € per metric ton) for September 2012 was 4% higher than the aver-age monthly price in September 2011; this reversed a previous-ly negative trend year-over-year and was due to the release of financial and fundamental stimulus programs. Prices on a fis-cal-year average were 8% lower in fiscal 2012 than the average for fiscal 2011. Prices for copper are still supported by tight sup-ply and demand fundamentals and by speculative influences in the commodity markets. Nevertheless, because copper is produced in multiple locations and traded, such as across the London Metal Exchange, the risk to Siemens is primarily a price risk rather than a supply risk.
Average monthly prices of aluminum traded at the London Metal Exchange faced more pressure year-over-year, losing 4% in September 2012 compared to September 2011. While, among other factors, high energy costs put upward pressure on alumi-num, these were more than offset by oversupply. As with cop-per, we see developments in the aluminum market as posing a price risk, rather than a supply risk.
The average monthly steel prices for September 2012 came down by 3% compared to the average monthly prices in Sep-tember 2011. Especially at the end of fiscal 2012, steel markets and prices for upstream raw materials (e.g. iron ore) softened significantly (source: CRU, an independent business analysis and consultancy group focused on, among other things, the mining and metals sectors).
exChange rate develOpment Of the us$ per € (index: Beginning of fisCal 2008 = 100)
FY 2008 FY 2009 FY 2010 FY 2011 FY 2012
140
130
120
110
100
90
80
70
Source: Bloomberg

135 D. Consolidated Financial Statements 239 E. Additional Information
130 C.11 Siemens AG (Discussion on basis of German Commercial Code)
134 C.12 Notes and forward-looking statements
129 C.10 Compensation Report, Corporate Governance statement pursuant to Section 289a of the German Commercial Code, Takeover-relevant information and explanatory report
61
In addition to the above-mentioned raw materials, we have ex-posure related to rare earth metals and magnets. The market situation for buyers improved considerably throughout fiscal 2012, with respect to both price and availability. Nevertheless, we track these factors closely as they could still pose signifi-cant price or supply risks for technology manufacturers, in-cluding Siemens.
Our main exposure to the prices of copper and related prod-ucts, and to steel and stainless steel, is in the Sectors Energy, Industry and Infrastructure & Cities. Our main price exposure related to aluminum is in the Energy Sector. In addition, Siemens is generally exposed to energy and fuel prices, both directly (electricity, gas, oil) and indirectly (energy used in the manufacturing processes of suppliers). Some of our continu-ing operations face price and supply risks related to rare earth metals, particularly the Industry Sector’s Drive Technologies Division and the Energy Sector’s Wind Power Division.
Siemens employs various strategies to reduce the price risk in its project and product businesses, such as long-term contract-ing with suppliers, physical and financial hedging and price escalation clauses with customers.
C.1.2.2 market develOpmentAccording to an analysis published by IHS Global Insight on Ju-ly 20, 2012, investments in 2012 are expected to continue to grow in nominal terms compared to 2011. But the pace of growth for 2012 is expected to slow down considerably com-pared to the prior year in almost all of the market segments that are significant for our Sectors. This is due largely to the sovereign debt crisis in the euro zone, especially in countries affected by bank solvency risks, credit availability and austerity measures, and also to repercussions of the sovereign debt cri-sis in other regions, particularly including emerging markets.
In markets significant for the Energy Sector, investments in power utilities are expected to grow by around 5% in 2012, slightly down from around 6% in 2011. Within these numbers, investments in many emerging markets are expected to con-tinue to grow clearly or significantly in 2012 compared to 2011 – yet the expected growth rates in the majority of these countries are still slower than a year earlier. Demand in Europe is particularly weak. Following a recovery in 2011, power utility investments are expected to show a decline in nearly all Euro-pean countries in 2012, especially in countries affected by the sovereign debt crisis. In contrast, investments in the U.S. are expected to grow moderately in 2012, following a decline a year earlier. Investments in the oil and gas markets are expect-ed to grow around 6% year-over-year, down markedly from around 17% in 2011. Some of the most important countries in this market, including the U.S., Russia and Saudi Arabia, which increased their investments in 2011 substantially year-over-year, are expected to either clearly reduce investment growth in 2012 or to keep investments on the prior-year level. In the chemical industry, which is particularly sensitive to changes in current economic conditions, growth in investments is also expected to slow considerably year-over-year, down to around 5% in 2012 compared to around 17% a year earlier. This includes lower growth in China, the world’s largest national market, and shrinking investments year over-year in other major coun-tries, among them Japan and Germany. In contrast, the growth rate in the U.S. is expected to remain nearly steady.
Investments within the international healthcare markets, served by our Healthcare Sector, are expected to increase by around 2% in 2012, following a rise of around 10% in the year before. This decline in growth includes reduced investments not only in many European countries, but also in some emerg-ing markets such as Brazil. Furthermore, growth in other large emerging markets, is expected to slow down year-over-year,
develOpment Of raw material priCes (index: Beginning of fisCal 2008 = 100)
FY 2008 FY 2009 FY 2010 FY 2011 FY 2012
200
175
150
125
100
75
50
Copper Aluminum (HG) Steel HRC
Source: London Metal Exchange (LME) for copper and aluminum, CRU HRC Germany for steel; cash prices in € per ton.

1 A. To our Shareholders 21 B. Corporate Governance 49 C. Combined Management Report
50 C.1 Business and economic environment 64 C.2 Financial performance measures 69 C.3 Results of operations 82 C.4 Financial position 93 C.5 Net assets position
95 C.6 Overall assessment of the economic position 96 C.7 Subsequent events 97 C.8 Sustainability 111 C.9 Report on expected developments and
associated material opportunities and risks
62
such as in China and Russia, or come to a halt, as in India. In the U.S. market, which is particularly significant for our Health-care Sector, growth in investments is expected to increase slightly in 2012 compared to the prior year.
The Industry Sector is influenced by the development in some of the markets mentioned for the Energy Sector, including by the oil and gas markets and the chemical industry. In other markets significant for the Industry Sector, investments in the automotive industry are expected to grow by around 5% in 2012, down from growth in investments of around 15% a year earlier. This change includes all major countries, which are showing either significantly slower growth or declining invest-ments year-over-year. These factors are particularly evident in Europe. Investment growth is declining also in a number of emerging markets, where investments were recently driven by strong demand for vehicles. Notable examples include China, which is experiencing significantly lower growth, and India, where investments are declining year-over-year following strong expansion a year earlier. Against this trend, growth in investments year-over-year is expected to accelerate in Japan. Even in the food and beverage industry, which is usually less susceptible to fluctuations in the economy, growth in invest-ments is expected to decline significantly in 2012 to around 5%, down from around 15% a year earlier. This is due to signifi-cant declines in investments in many European countries, es-pecially those affected by high unemployment and low con-sumer confidence. Investments are also expected to decline in a number of emerging markets as their populations are affect-ed by rising food prices. Investments in the minerals sector are expected to grow by around 5% in 2012, sharply lower than growth of around 19% a year earlier. Within this sector, growth in investments in the largest industry, mining, is expected to contract most significantly: from around 21% in 2011 to around 5% in 2012. Among major countries in industrial mining, this decline in growth includes sharply lower growth in China and Canada and a reduction in investments in India year-over-year, while growth in investments in Australia is expected to come down only slightly. Investments in the machine building in-dustry are expected to grow by around 7% year-over-year in 2012, compared to around 18% a year earlier. Growth in invest-ments in the last few years was driven by exceptionally rapid expansion in China, which is by far the world’s most important investor in machine building. In contrast, growth in China is expected to slow markedly in 2012 as demand weakens in the country ’s manufacturing sector. For the pharmaceutical indus-try, investment growth is estimated to decline to around 6% in 2012, after around 15% in 2011. Within these numbers, the larg-est investors, China and Japan, are expected to continue to in-crease their investments in 2012 but at a slower pace than in 2011. Against this trend, the U.S. shows increasing growth in investments year-over-year. Investments in the pulp and paper
sector are expected to grow by around 4% in 2012, following in-vestment growth of around 13% a year earlier. The develop-ment within the largest markets is expected to be mixed. While investment growth in China is slowing significantly and growth in Japan is nearly coming to a halt, investments in the U.S. are growing moderately following a decline in the prior year. In the metals industry, investments in 2012 are expected to grow by around 5% compared to around 16% a year earlier. Growth in China is expected to slow to single digits, and India is forecast to reduce its investments following a substantial in-crease a year earlier. Investment growth in Japan and South Korea is expected to decline less significantly year-over-year. Investments in water and wastewater utilities are expected to grow by around 4% in 2012 compared to around 8% in 2011. While investment growth in China is expected to be higher in 2012 compared to the prior year, and the U.S. is expected to in-crease investments in 2012 following a decline a year earlier, many other major countries, especially in Europe, are forecast to reduce their investments in 2012.
The Infrastructure & Cities Sector is influenced by develop-ments in a number of markets mentioned above for the Sec-tors Energy, Healthcare and Industry, including power utilities, oil and gas, healthcare and pharmaceuticals. In other markets important to the Sector, investments in both, the transporta-tion infrastructure and transportation services markets, are ex-pected to grow by around 5% in 2012. The pace of growth in the prior year was around 15% in transportation infrastructure, faster than growth of around 8% in transportation services. For transportation infrastructure, investments are expected to slow in the large Chinese market and shrink in some of the larger European countries, including France and Germany. The U.S. and Russia are expected to keep investment growth near the prior-year level. Overall growth in transportation service is held back by declining investments in Europe, even as China is expected to clearly increase investments in 2012 following a decline in investments a year earlier. Growth in investments in the public, research and education sector is expected to de-cline to around 3% in 2012, down from around 9% in 2011. While the large majority of European countries and also a number of emerging countries including Brazil and India are expected to reduce investments in 2012 compared to 2011, the U.S. is forecast to expand its public investments year-over-year. For construction and real estate, investments are expected to grow around 3% in 2012 compared to the prior year. A year ear-lier, growth in investments was around 12%. While these mar-kets are depressed in Europe, growth in the U.S. is accelerat-ing, as these industries are benefiting from low mortgage rates and improved consumer confidence. In the post and logistics sector, investment growth in 2012 is forecast to slow to around 2% year-over-year, compared to around 13% a year earlier. While growth in fiscal 2012 is particularly burdened by shrink-

135 D. Consolidated Financial Statements 239 E. Additional Information
130 C.11 Siemens AG (Discussion on basis of German Commercial Code)
134 C.12 Notes and forward-looking statements
129 C.10 Compensation Report, Corporate Governance statement pursuant to Section 289a of the German Commercial Code, Takeover-relevant information and explanatory report
63
ing investment in large parts of Europe, the change year-over-year is particularly strong in Brazil, where sharp growth a year earlier is expected to be followed by a clear decline in invest-ments. In the wholesale and retail sector, investment growth is expected to decline to around 3% year-over-year, down from around 13% a year earlier, following the same pattern as invest-ments in post and logistics.
C.1.3 Strategy
C.1.3.1 glObal megatrendsGlobal megatrends are long-term developments that are expect-ed to have an impact on all humanity. We at Siemens view demographic change, urbanization, climate change and global-ization as megatrends that will drive global demand in coming decades. We have aligned our strategy with these developments and accordingly have organized our business into four Sectors: Energy, Healthcare, Industry, and Infrastructure & Cities.
Demographic change includes two major trends: the world’s population continues to grow rapidly, and it continues to get older. Together, these two trends will challenge the ability of future healthcare systems to make affordable healthcare avail-able to everyone. Urbanization refers to the growing number of large, densely-populated cities around the world. This trend intensifies the already strong demand for sustainable and ener-gy-efficient infrastructures for buildings, transportation sys-tems, energy and water. Climate change is a fact. The average global surface temperature increased by 0.76°C between 1850 and the beginning of the 21st century. The reduction of green-house gas emissions is vital to avoiding increasingly drastic effects on our ecosystem. There is a strong need for innovative technologies to increase efficiency and reduce the emissions related to energy generation and consumption. Globalization refers to the increasing integration of the world’s economies, politics, culture and other areas of life. Globalization leads to increased competitive pressure and demand for economical, timely-to-market, high-quality products and solutions.
C.1.3.2 strategy Of the siemens grOupOur vision is to be a pioneer in
> energy efficiency, > industrial productivity, > affordable and personalized healthcare, and > intelligent infrastructure solutions.
Our company strategy guides us in turning our vision into real-ity. We are aiming to be a market and technology leader in our businesses, based on our values – to be responsible, excel-lent and innovative. We believe that this will position us to
achieve sustainable, profitable growth and thereby continually increase our company value. As an integrated technology com-pany, we intend to profit from the megatrends described above.
Our strategy comprises what we call our three strategic direc-tions:
> focusing on innovation-driven growth markets, > getting closer to our customers, and > using the power of Siemens.
One Siemens is our framework for sustainable value creation, with a financial target system for capital-efficient growth and the goal of continuous improvement relative to the market and our competitors.
The financial target system of One Siemens defines financial key performance indicators for revenue growth, for capital ef-ficiency and profitability, and for the optimization of our capi-tal structure. In addition, we set hurdle rates that generally need to be considered before acquisitions are executed. Fur-ther, we defined an indicator targeted at an attractive dividend policy. We believe that these indicators will play a key role in driving the value of our Company. For further information, see
C.2 finanCial perfOrmanCe measures.
To achieve our One Siemens goal of sustainably enhancing the value of Siemens and of exploiting the full potential of our in-tegrated technology company, we have defined three concrete focus areas along each of the three strategic directions set forth above, which we aim to address in the years ahead.
In the strategic direction of focusing on innovation-driven growth markets, our first focus area is to be a pioneer in tech-nology-driven markets. Here, we intend to concentrate on mar-kets that are believed to have future growth potential, for ex-ample, in vertical IT and software. Our second focus area is to strengthen our portfolio. We are actively and systematically managing our portfolio with the principal aim of achieving or maintaining a No. 1 or No. 2 position in our current and future markets. To provide a leading environmental portfolio is our third focus area: Our Environmental Portfolio enhances our Company ’s revenue and makes a significant contribution to cli-mate protection.
In the second strategic direction of getting closer to our cus-tomers, one of our focus areas is to grow in emerging markets while maintaining our position in our established markets. We plan to offer more products, solutions and services for the rap-idly growing entry-level segments, which are more price-sen-sitive and mostly found in emerging markets. A second focus

1 A. To our Shareholders 21 B. Corporate Governance 49 C. Combined Management Report
50 C.1 Business and economic environment 64 C.2 Financial performance measures 69 C.3 Results of operations 82 C.4 Financial position 93 C.5 Net assets position
95 C.6 Overall assessment of the economic position 96 C.7 Subsequent events 97 C.8 Sustainability 111 C.9 Report on expected developments and
associated material opportunities and risks
64
area is to expand our service business. We believe that the large installed base of our products and solutions at our clients provides promising growth opportunities for our service busi-ness. Services play a key role in profitability at Siemens and, in addition, long-term service agreements are less likely to be im-pacted by economic fluctuations. To intensify our customer fo-cus is our third focus area. We believe that customer proximity and local presence are important factors in being able to re-spond quickly to changing market requirements.
In the strategic direction of using the power of Siemens, our first focus area is to encourage lifelong learning and develop-ment of our employees. We invest continuously in expanding the expertise of our people through demanding training and education programs. We aim to develop our employees world-wide by identifying talent and offering challenging tasks. To empower our diverse and engaged people worldwide is our second focus area. We believe that the strong potential of our employees’ skills, experience and qualifications can give us a clear competitive advantage in our global markets. The third focus area is to stand for integrity. On the basis of our values, we have formulated clear and binding principles of conduct that cover all aspects of our entrepreneurial activities.
Beginning with fiscal 2013, we are implementing “Siemens 2014,” a company-wide program supporting the One Siemens framework for sustainable value creation. The goal of the pro-gram is to reduce cost, increase competitiveness, and become faster and less bureaucratic. We intend to improve profitability through five key enablers: cost reduction, strengthening core activities, go-to-market, optimizing our infrastructure, and simplifying governance. The program is aimed at raising Total Sectors profit margin to at least 12% by fiscal 2014. To achieve this goal, we are targeting substantial productivity gains over the next two fiscal years from the activities just mentioned. In the area of cost reduction, which is expected to yield the ma-jority of these gains, we want to, for example, enhance prod-uct design by better integrating engineering, development, manufacturing and purchasing pro cesses; improve global ca-pacity utilization and presence; and increase process efficiency and quality. To achieve these results, our Sectors are undertak-ing a broad range of measures that are expected to result in charges to earnings in the next two fiscal years.
This section on financial performance measures describes several measures that are or may be non-GAAP financial mea-sures. Other companies that report or describe similarly titled financial measures may calculate them differently.
As of the beginning of fiscal 2011, we introduced One Siemens – our framework for sustainable value creation; for further information see C.1.3 strategy. As part of One Siemens, we have developed a financial target system for capi-tal-efficient growth that we believe will increase the value of our Company. Our goal is to achieve continuous improvement relative to the market and our competitors. The financial target system defines indicators for revenue growth, capital efficien-cy and profitability, the optimization of our capital structure, and our dividend policy. In addition, we set hurdle rates that generally must be considered before we make acquisitions.
C.2.1 Revenue growth
We believe that an important driver for increasing our Compa-ny ’s value over the long term is profitable revenue growth. Spe-cifically, our goal is to grow our revenue faster than the average revenue growth of our most relevant competitors. For purposes of comparison to the revenue growth of our competitors, our revenue growth is calculated as the growth rate of reported rev-enue as presented in the Consolidated Financial Statements.
C.2.2 Capital efficiency and profitability
Our aim is to work profitably and as efficiently as possible with the capital of our shareholders and lenders. We monitor our cap-ital efficiency using adjusted return on capital employed, or ROCE (adjusted), which is reported on a continuing operations basis. This measure assesses our generated income from the point of view of our shareholders and lenders. ROCE (adjusted) is defined as income from continuing operations before interest after tax divided by average capital employed. Our target is to achieve a ROCE (adjusted) of 15% to 20%. ROCE (adjusted) in
C.2 finanCial performanCe measures
revenue grOwth
Actual
FY 2012 7%
FY 2011 6%
Revenue current period – 1 × 100%
Revenue prior-year period

135 D. Consolidated Financial Statements 239 E. Additional Information
130 C.11 Siemens AG (Discussion on basis of German Commercial Code)
134 C.12 Notes and forward-looking statements
129 C.10 Compensation Report, Corporate Governance statement pursuant to Section 289a of the German Commercial Code, Takeover-relevant information and explanatory report
65
the fiscal years 2012 and 2011 was 17.0% and 25.3%, respective-ly. Siemens’ weighted average cost of capital (WACC) is cur-rently 7.5%.
Our financial indicator for measuring capital efficiency at Financial Services (SFS) is return on equity after tax, or ROE (after tax), in line with common practice in the financial ser-vices industry. We define ROE (after tax) as SFS’ profit after tax, divided by SFS’ average allocated equity. For purposes of calcu-lating ROE (after tax), the relevant income tax is calculated on a simplified basis, by applying an assumed 30% flat tax rate to SFS’ profit, excluding income (loss) from investments account-ed for using the equity method, net, which is basically net of tax already, and tax-free income components and other com-ponents which have already been taxed or are generally tax-free. Our goal is to achieve ROE (after tax) of 15% to 20% at SFS.
Our goal is to achieve margins comparable to the best compet-itors within our industries throughout the entire business cycle. We therefore seek to maintain or improve the profitabili-ty of our businesses as appropriate. Our measure in this regard is adjusted EBITDA margins, defined as the ratio of adjusted EBITDA (as presented in C.3.3 reCOnCiliatiOn tO adjusted
ebitda (COntinuing OperatiOns)) to revenue. We have defined adjusted EBITDA margin ranges for the respective industries of our four Sectors. Adjusted EBITDA target margin ranges for the Sectors, and their performance in fiscal 2012, are shown in the chart below. The adjusted EBITDA margin for Energy was 9.3%,
compared to 15.1% a year earlier. Healthcare’s adjusted EBITDA margin was 18.5%, up from 15.7% in fiscal 2011. The adjusted EBITDA margin for our Industry Sector was 14.9%, down from 16.8% in the prior year. The adjusted EBITDA margin for Infra-structure & Cities was 7.5%, compared to 8.3% a year earlier.
C.2.3 Capital structure
Sustainable revenue and profit development can be achieved only on the basis of a healthy capital structure. A key consider-ation for us in this regard is maintaining ready access to the capital markets through various debt products and preserv-ing our ability to repay and service our debt obligations over time. Therefore, we use the ratio of adjusted industrial net debt to adjusted EBITDA for optimizing our capital structure. For information on this calculation and its components see
C.4.2 Capital struCture. Our goal is to achieve a ratio in the range of 0.5 – 1.0.
C.2.4 Dividend
At the Annual Shareholders’ Meeting, the Managing Board, in agreement with the Supervisory Board, will submit the follow-ing proposal to allocate the unappropriated net income of Siemens AG for the fiscal year ended September 30, 2012: to distribute a dividend of €3.00 on each no-par value share enti-tled to the dividend for fiscal year 2012 existing at the date of the Annual Shareholders’ Meeting, with the remaining amount to be carried forward. Payment of the proposed dividend is
return On Capital emplOyed (rOCe) (adjusted) (Continuing operations)
FY 2012 17.0%
FY 2011 25.3%
Target range: 15 – 20%
Income from continuing operations before interest after tax × 100%
Average capital employed
return On equity (rOe) (after tax)
FY 2012 21.9%
FY 2011 22.6%
Target range: 15 – 20%
SFS’ profit after tax × 100%
SFS’ average allocated equity
adjusted ebitda margins fy 2012
Margin Target range
Energy 9.3% 10 – 15%
Healthcare 18.5% 15 – 20%
Industry 14.9% 11 – 17%
Infrastructure & Cities 7.5% 8 – 12%
Adjusted EBITDA margins of respective markets throughout business cycle.
Capital struCture (Continuing operations)
FY 2012 0.24
FY 2011 (0.14)
Target range: 0.5 – 1.0
Adjusted industrial net debt
Adjusted EBITDA

1 A. To our Shareholders 21 B. Corporate Governance 49 C. Combined Management Report
50 C.1 Business and economic environment 64 C.2 Financial performance measures 69 C.3 Results of operations 82 C.4 Financial position 93 C.5 Net assets position
95 C.6 Overall assessment of the economic position 96 C.7 Subsequent events 97 C.8 Sustainability 111 C.9 Report on expected developments and
associated material opportunities and risks
66
(in millions of €) 09/30/2012 06/30/2012 03/31/2012 12/31/2011 09/30/2011
Capital employed Fiscal 2012
Total equity 31,302 32,313 32,142 33,947 32,156
Plus: Long-term debt 16,880 15,234 14,731 14,566 14,280
Plus: Short-term debt and current maturities of long-term debt 3,826 5,236 4,799 2,841 3,660
Less: Cash and cash equivalents (10,891) (8,963) (8,424) (8,977) (12,468)
Plus: Pension plans and similar commitments 9,926 9,060 7,492 6,774 7,307
Less: SFS Debt (14,558) (13,644) (13,303) (13,424) (12,075)
Less: Fair value hedge accounting adjustment 1 (1,670) (1,638) (1,474) (1,544) (1,470)
Capital employed (continuing operations and discontinued operations) 2 34,817 37,597 35,962 34,182 31,391
Less: Assets classified as held for disposal presented as discontinued operations (4,694) (4,696) (4,894) (4,969) (4,667)
Plus: Liabilities classified as held for disposal presented as discontinued operations 2,016 1,925 1,685 1,669 1,756
Capital employed (continuing operations) 2 32,138 34,825 32,753 30,882 28,479
1 Debt is generally reported with a value representing approximately the amount to be repaid. However for debt designated in a hedging relationship (fair value hedges), this amount is adjusted by changes in market value mainly due to changes in interest rates. Accordingly, we deduct these changes in market value in order to end up with an amount of debt that approximately will be repaid, which we believe is a more mean-
ingful figure for the calculation presented above. For further information on fair value hedges see nOte 31 in d.6 nOtes tO COnsOlidated finanCial statements.
2 Average capital employed for a fiscal year is determined as a five-point average in capital employed of the respective quarters starting with the capital employed as of September 30 of the previous fiscal year.
contingent upon approval by Siemens shareholders at the Annual Shareholders’ Meeting on January 23, 2013. The prior-year dividend was €3.00.
We intend to provide an attractive return to shareholders. We previously set a target range for our dividend payout percent-age of 30% to 50% of net income. The proposed dividend of €3.00 per share for fiscal 2012 represents a total payout of €2.569 billion based on shares outstanding as of September 30, 2012. Based on net income of €4.590 billion for fiscal 2012, the dividend payout percentage would be 56%. The percentage for fiscal 2011 was 42%, based on a total dividend payout of €2.629 billion and net income of €6.321 billion.
We intend in the years ahead to propose a dividend payout which – combined with outlays for share buybacks during the fiscal year – results in a sum representing 40% to 60% of net in-come, which for this purpose we may adjust to exclude excep-tional non-cash effects. As in the past, we intend to fund the dividend payout from free cash flow.
C.2.5 Additional measures
In addition to the financial performance measures discussed above, we use several other metrics to assess the economic success of our business activities. To determine whether a par-ticular investment is likely to generate value for Siemens, we use net present value or economic value added (EVA™). EVA™ considers the cost of capital in calculating value creation by comparing the expected earnings of an investment against the cost of capital employed. EVA™ is also an indicator for measur-ing capital efficiency in our Sectors and at SFS.
To measure liquidity management of our operating activities, we analyze net operating working capital turns. In addition, we set hurdle rates that generally must be considered before we make acquisitions. In particular, acquisitions should have the potential to be accretive to EVA™ within three years after the integration and generate a 15% cash return within five years. Cash return is defined as Free cash flow divided by aver-age capital employed.
C.2.6 Additional information for financial performance measures
C.2.6.1 return On Capital emplOyed (rOCe) (adjusted)As part of One Siemens, we monitor our capital efficiency us-ing the indicator return on capital employed ROCE (adjusted) (continuing operations). The following tables report this finan-cial indicator as defined under One Siemens.
dividend payOut perCentage
FY 2012 56%
FY 2011 42%
Total dividend payout × 100%
Net income

135 D. Consolidated Financial Statements 239 E. Additional Information
130 C.11 Siemens AG (Discussion on basis of German Commercial Code)
134 C.12 Notes and forward-looking statements
129 C.10 Compensation Report, Corporate Governance statement pursuant to Section 289a of the German Commercial Code, Takeover-relevant information and explanatory report
67
(in millions of €) 09/30/2011 06/30/2011 03/31/2011 12/31/2010 09/30/2010
Capital employed Fiscal 2011
Total equity 32,156 31,542 31,483 32,057 29,096
Plus: Long-term debt 14,280 14,191 14,196 15,656 17,497
Plus: Short-term debt and current maturities of long-term debt 3,660 4,971 5,016 4,051 2,416
Less: Cash and cash equivalents (12,468) (13,006) (14,973) (15,662) (14,108)
Plus: Pension plans and similar commitments 7,307 5,997 5,845 7,234 8,464
Less: SFS Debt (12,075) (10,384) (10,037) (9,925) (10,028)
Less: Fair value hedge accounting adjustment 1 (1,470) (808) (719) (1,037) (1,518)
Capital employed (continuing operations and discontinued operations) 2 31,391 32,503 30,812 32,374 31,819
Less: Assets classified as held for disposal presented as discontinued operations (4,667) (5,636) (5,148) – –
Plus: Liabilities classified as held for disposal presented as discontinued operations 1,756 3,121 2,966 – –
Capital employed (continuing operations) 2 28,479 29,987 28,630 32,374 31,819
1 Debt is generally reported with a value representing approximately the amount to be repaid. However for debt designated in a hedging relationship (fair value hedges), this amount is adjusted by changes in market value mainly due to changes in interest rates. Accordingly, we deduct these changes in market value in order to end up with an amount of debt that approximately will be repaid, which we believe is a more mean-
ingful figure for the calculation presented above. For further information on fair value hedges see nOte 31 in d.6 nOtes tO COnsOlidated finanCial statements.
2 Average capital employed for a fiscal year is determined as a five-point average in capital employed of the respective quarters starting with the capital employed as of September 30 of the previous fiscal year.
Year ended September 30,
(in millions of €) 2012 2011
Income from continuing operations before interest after tax
Net income 4,590 6,321
Less/Plus: Other interest expense/income, net (471) (376)
Less/Plus: SFS Other interest expense/income 1 462 371
Plus: Interest cost on Pension plans and similar commitments 2 333 356
Less: Taxes on interest adjustments 3 (93) (81)
Income before interest after tax 4,821 6,590
Less/Plus: Income/loss from discontinued operations, net of income taxes 595 1,055
Income from continuing operations before interest after tax 5,416 7,645
Return on capital employed (ROCE) (adjusted) (continuing operations)
(I) Income from continuing operations before interest after tax 5,416 7,645
(II) Average capital employed (continuing operations) 31,816 30,258
(I) / (II) ROCE (adjusted) (continuing operations) 17.0% 25.3%
1 SFS Other interest income/expense is included in Other interest income/expense, net. Adding back SFS Other interest income/expense in the numerator corresponds to the adjustment for SFS Debt in the denominator.
2 For fiscal 2012 and 2011, interest cost on Pension plans and similar commitments is calculated using the weighted average discount rate of our pension benefit plans for the fiscal year ended September 30, 2011 (4.5%) and September 30, 2010 (4.2%)
(both as reported in Notes to Consolidated Financial Statements) applied to Pension plans and similar commitments as reported in the Consolidated Statements of Financial Position as of September 30, 2011 and 2010, respectively.
3 Effective tax rate for the determination of taxes on interest adjustments is calculated by dividing Income taxes through Income from continuing operations before income taxes, both as reported in d.1 COnsOlidated statements Of inCOme.

1 A. To our Shareholders 21 B. Corporate Governance 49 C. Combined Management Report
50 C.1 Business and economic environment 64 C.2 Financial performance measures 69 C.3 Results of operations 82 C.4 Financial position 93 C.5 Net assets position
95 C.6 Overall assessment of the economic position 96 C.7 Subsequent events 97 C.8 Sustainability 111 C.9 Report on expected developments and
associated material opportunities and risks
68
C.2.6.3 definitiOns Of Other finanCial perfOrmanCe measuresWe also use other financial performance measures in addition to the measures described above, such as new orders and order backlog for the assessment of our future revenue potential. We define and calculate new orders and order backlog as follows:
Under its policy for the recognition of new orders, Siemens generally recognizes the total contract amount for a new order when we enter into a contract that we consider legally effec-tive and compulsory based on a number of different criteria.
The contract amount is the agreed price or fee for that portion of the contract for which the delivery of goods and / or the pro-vision of services has been irrevocably agreed. Future reve-nues from service, maintenance and outsourcing contracts are recognized as new orders in the amount of the total contract value only if there is adequate assurance that the contract will remain in effect for its entire duration (e.g., due to high exit barriers for the customer). New orders are generally recog-nized immediately when the relevant contract is considered legally effective and compulsory. The only exceptions are or-ders with short overall contract terms. In this case, a separate reporting of new orders would provide no significant addition-al information regarding our performance. For orders of this type the recognition of new orders thus occurs when the cor-responding revenue is recognized.
Order backlog represents an indicator for the future revenues of our Company resulting from already recognized new orders. Order backlog is calculated by adding the new orders of the current fiscal year to the balance of the order backlog as of the end of the prior fiscal year and by subtracting the revenue rec-ognized in the current fiscal year. If the amount of an order al-ready recognized in the current or the previous fiscal years is modified or if an order from the current fiscal year is cancelled, Siemens adjusts its new orders for the current quarter and also its order backlog accordingly, but does not retroactively adjust previously published new orders. However, if an order from a previous fiscal year is cancelled, new orders of the current quarter and, accordingly, the current fiscal year are generally not adjusted, instead, the existing order backlog is revised di-rectly. Aside from cancellations, the order backlog is also sub-ject to portfolio effects and to currency translation effects.
There is no standard system for compiling and calculating new orders and order backlog information that applies across com-panies. Accordingly, Siemens’ new orders and order backlog measures may not be comparable with new orders and order backlog reported by other companies. Siemens subjects its new orders and its order backlog to internal documentation and review requirements. Siemens may change its policies for recognizing new orders and order backlog in the future with-out previous notice.
Year ended September 30,
(in millions of €) 2012 2011
Calculation of income taxes of Financial Services (SFS)
Profit of SFS (Income before Income Taxes, IBIT) 479 428
Less/Plus: Income/loss from investments accounted for using the equity method, net of SFS 1 (168) (92)
Less: Tax-free income components and others 2 57 (16)
Tax basis 368 319
Tax rate (flat) 30% 30%
Calculated income taxes of SFS 110 96
Profit after tax of SFS
Profit of SFS (IBIT) 479 428
Less: Calculated income taxes of SFS (110) (96)
Profit after tax of SFS 368 332
ROE (after tax) of SFS
(I) Profit after tax of SFS 368 332
(II) Average allocated equity of SFS 3 1,681 1,468
(I) / (II) ROE (after tax) of SFS 21.9% 22.6%
1 For information on Income (loss) from investments accounted for using the equity method, net of SFS, see C.3.3 reCOnCiliatiOn tO adjusted ebitda (COntinuing OperatiOns).
2 Tax-free income components include forms of financing which are generally exempted from income taxes. Others comprise result components related to the (partial) sale/divestment of equity investments, which are reclassified from at equity to available- for-sale financial assets and are therefore not included in the (Income) loss from investments accounted for using the equity method, net. Such results are already taxed or generally tax free. Others may also comprise an adjustment for material taxable Income (loss) from investments accounted for using the equity method, net.
3 Average allocated equity of SFS for a fiscal year is determined as a five-point average in allocated equity of SFS of the respective quarters starting with the allocated equity of SFS as of September 30 of the previous fiscal year.
C.2.6.2 return On equity (rOe) (after tax)The following table reports the calculation of ROE (after tax) of SFS as defined under One Siemens.

135 D. Consolidated Financial Statements 239 E. Additional Information
130 C.11 Siemens AG (Discussion on basis of German Commercial Code)
134 C.12 Notes and forward-looking statements
129 C.10 Compensation Report, Corporate Governance statement pursuant to Section 289a of the German Commercial Code, Takeover-relevant information and explanatory report
69
C.3.1 Results of Siemens
The following discussion presents selected information for Siemens for the fiscal year ended September 30, 2012:
C.3.1.1 new Orders and revenueRevenue increased steadily quarter by quarter throughout fis-cal 2012 and came in at €78.296 billion, up 7% from the prior-year period. Revenue growth included increases in all Sectors and all three reporting regions, supported by Siemens’ strong order backlog. Slowing growth in the world economy was evi-dent in the development of new orders, which decreased 10% year-over-year primarily due to substantially lower volume from large orders compared to the prior-year period. This re-sulted in a book-to-bill ratio of 0.98 for Siemens in fiscal 2012. On an organic basis, excluding currency translation and port-folio effects, orders decreased 13% and revenue came in 3% above the prior year. The order backlog (defined as the sum of order backlogs of our Sectors) was €98 billion as of September 30, 2012, up from €97 billion a year earlier, including positive currency translation effects of €3 billion.
Orders related to external customers in fiscal 2012 declined 10% overall, with results varying among the Sectors. Orders for Healthcare were up 5%, with most of its businesses contribut-ing increases, and were level in Industry. Order intake declined in Energy and Infrastructure & Cities due to substantially lower volumes from large orders compared to the prior-year period, which included a number of orders for large wind-farms in Energy and a €3.7 billion order for trains in Germany won by Infrastructure & Cities. Orders from emerging markets on a glob-al basis, as these markets are defined by the International Mon-etary Fund, declined 7%, less than orders overall, and accounted for €26.244 billion, or 34%, of total orders for fiscal 2012.
In the region Europe, C.I.S., Africa, Middle East, orders de-clined 17% including double-digit decreases in Infrastructure & Cities and Energy, which were due to the high basis of compari-son from large orders mentioned above. This high basis of com-
C.3 results of operations
parison was also the primary factor in the order decline in Germany. Orders for Industry in the region were level compared to the prior-year period and Healthcare’s orders came in slightly below the level of fiscal 2011. In the Americas, order intake rose slightly on increases in three of the four Sectors. The Energy Sector showed a slight decrease due in part to a lower volume from large orders compared to the prior-year period. Order intake in the Asia, Australia region showed a slight decrease in fiscal 2012. Double-digit order growth in Healthcare was more than offset by decreases in the other Sectors. Order intake in India de-creased sharply compared to the prior-year period, due primarily to a major contract win at Energy in the prior-year period.
As previously disclosed, Siemens has decided that, subject to certain limited exceptions, it will not enter into new contracts with customers in Iran and has issued group-wide policies establishing the details of its general decision. Under the origi-nal version of the policies, among other exceptions, which have been previously disclosed, products and services required to maintain the installed base (e.g. deliveries of spare parts, maintenance and assembly services) were permitted to be pro-vided. However, in the beginning of calendar year 2012, Siemens resolved to amend the policies to provide that no new business with respect to products and services destined to maintain the installed base in Iran’s oil & gas sector may be en-tered into under any circumstances. In addition, even outside the oil & gas sector, products and services for the installed base in Iran may be provided only in strictly limited circumstances which can be demonstrated to satisfy humanitarian purposes or private purposes serving the common good (e.g. water sup-ply and healthcare of the civilian population). In the fourth quarter of fiscal 2012, Siemens revised its credit risk assess-ment for Iran. In accordance with project accounting princi-ples, Siemens therefore revised project calculations for the af-fected projects that were still permitted to be provided under these policies. The change in credit risk assessment resulted in an earnings impact of €347 million. We expect further profit impacts related to Iran in fiscal 2013. For additional informa-tion, see C.9.3 risks.
new Orders (loCation of Customer)
Year ended September 30, % Change vs. previous year therein
(in millions of €) 2012 2011 Actual Adjusted 1 Currency Portfolio
Europe, C.I.S.2, Africa, Middle East 38,655 46,711 (17)% (19)% 1% 1%
therein Germany 9,894 17,353 (43)% (43)% 0% 0%
Americas 22,271 22,077 1% (5)% 5% 1%
therein U.S. 15,403 15,732 (2)% (9)% 6% 1%
Asia, Australia 15,987 16,378 (2)% (7)% 4% 0%
therein China 6,037 6,241 (3)% (11)% 8% 0%
therein India 1,689 3,310 (49)% (45)% (4)% 0%
Siemens 76,913 85,166 (10)% (13)% 2% 1%
1 Excluding currency translation and portfolio effects. 2 Commonwealth of Independent States.

1 A. To our Shareholders 21 B. Corporate Governance 49 C. Combined Management Report
50 C.1 Business and economic environment 64 C.2 Financial performance measures 69 C.3 Results of operations 82 C.4 Financial position 93 C.5 Net assets position
95 C.6 Overall assessment of the economic position 96 C.7 Subsequent events 97 C.8 Sustainability 111 C.9 Report on expected developments and
associated material opportunities and risks
70
revenue (loCation of Customer)
Year ended September 30, % Change vs. previous year therein
(in millions of €) 2012 2011 Actual Adjusted 1 Currency Portfolio
Europe, C.I.S.2, Africa, Middle East 39,909 38,448 4% 2% 1% 0%
therein Germany 11,072 10,810 2% 2% 0% 0%
Americas 22,864 20,470 12% 5% 6% 1%
therein U.S. 16,670 14,368 16% 7% 8% 1%
Asia, Australia 15,523 14,357 8% 3% 5% 0%
therein China 6,348 6,389 (1)% (7)% 7% (1)%
therein India 2,311 2,353 (2)% 4% (5)% 0%
Siemens 78,296 73,275 7% 3% 3% 0%
1 Excluding currency translation and portfolio effects. 2 Commonwealth of Independent States.
Revenue related to external customers rose 7% compared to fiscal 2011, including increases in all Sectors. Strong conver-sion from the Sectors’ order backlogs played a major role in broad-based revenue growth. Energy revenue increased 12% in fiscal 2012 and Healthcare revenue increased 9%. Revenue in Industry and Infrastructure & Cities showed a moderate growth compared to the prior-year period. On a global basis, emerging markets grew 7%, and accounted for €25.652 billion, or 33%, of total revenue in fiscal 2012.
On a geographic basis, revenue increased in all three reporting regions, led by double-digit growth in the Americas. In the Eu-rope, C.I.S., Africa, Middle East region, revenue increased 4% year-over-year, including increases in all Sectors. In the Ameri-cas, higher revenue included double-digit increases in Energy, Industry and Infrastructure & Cities, due to revenue growth of 16% in the U.S. In the Asia, Australia region, revenue rose 8% on substantial increases in Energy and Healthcare, which were partly offset by decreases in Infrastructure & Cities and Industry.
new Orders and revenue by quarter (in millions of €)
New orders Revenue Book-to-bill ratio
Q4 12 21,495 Q4 12 21,703 0.99
Q3 12 17,769 Q3 12 19,502 0.91
Q2 12 17,857 Q2 12 19,235 0.93
Q1 12 19,792 Q1 12 17,856 1.11
Q4 11 21,059 Q4 11 20,285 1.04
Q3 11 22,879 Q3 11 17,782 1.29
Q2 11 20,582 Q2 11 17,633 1.17
Q1 11 20,647 Q1 11 17,575 1.17

135 D. Consolidated Financial Statements 239 E. Additional Information
130 C.11 Siemens AG (Discussion on basis of German Commercial Code)
134 C.12 Notes and forward-looking statements
129 C.10 Compensation Report, Corporate Governance statement pursuant to Section 289a of the German Commercial Code, Takeover-relevant information and explanatory report
71
C.3.1.2 COnsOlidated statements Of inCOme
Year ended September 30, % Change
(in millions of €) 2012 2011
Gross profit 22,204 22,229 0%
as percentage of revenue 28.4% 30.3% –
Research and development expenses (4,238) (3,899) 9%
as percentage of revenue 5.4% 5.3% –
Marketing, selling and general administrative expenses (11,162) (10,239) 9%
as percentage of revenue 14.3% 14.0% –
Other operating income 516 547 (6)%
Other operating expense (276) (374) (26)%
Income (loss) from invest-ments accounted for using the equity method, net (266) 210 n/a
Interest income 2,234 2,200 2%
Interest expense (1,728) (1,716) 1%
Other financial income (expense), net (5) 649 n/a
Income from continuing operations before income taxes 7,279 9,608 (24)%
Income taxes (2,094) (2,232) (6)%
as percentage of income from continuing operations before income taxes 29% 23% –
Income from continuing operations 5,184 7,376 (30)%
Loss from discontinued operations, net of income taxes (595) (1,055) (44)%
Net income 4,590 6,321 (27)%
Net income attributable to non-controlling interests 132 176 –
Net income attributable to shareholders of Siemens AG 4,458 6,145 (27)%
In fiscal 2012, we achieved Income from continuing opera-tions of €5.184 billion. While this was one of our highest re-sults ever, it was substantially lower than in the prior year. The primary factors in the decline were cost of goods sold; research and development expenses; marketing, selling and general ad-ministrative expenses; and income (loss) from investments ac-counted for using the equity method, net. In addition, the pri-or year included substantially higher financial income associ-ated with a major divestment. Each of these factors is described in more detail below. Other line items in the Consolidated Statements of Income are discussed in nOtes 5, 6 and 8 in
d.6 nOtes tO COnsOlidated finanCial statements.
While revenue for fiscal 2012 rose 7% year-over-year as dis-cussed earlier, gross profit was nearly unchanged from the pri-or-year level and declined as a percent of revenue. Industry, Energy and Infrastructure & Cities all dealt with a less favorable revenue mix year-over-year, which reduced their gross profit margins. Gross profit in Energy included €570 million in proj-ect charges related to offshore grid-connection projects. The majority of Healthcare’s charges for its Agenda 2013 initiative also impacted gross profit. In fiscal 2011, Healthcare’s €381 mil-lion in charges in the third quarter related to particle therapy were included in gross profit.
Furthermore, all Sectors increased their spending for market-ing, selling and administrative expenses and research and de-velopment expenses in anticipation of an improving global economic environment in the second half of the fiscal year. In fact, global economic growth slowed instead of picking up in the second half, leaving the Sectors with cost positions that adversely affected income. For more details on our research and development activities, including a split of research and development expenses for the Sectors, see C.8.2 researCh
and develOpment.
Income (loss) from investments accounted for using the equity method, net swung from a positive €210 million in fiscal 2011 to a negative €266 million in fiscal 2012. The primary factor was Nokia Siemens Networks B.V. (NSN), which took substan-tial restructuring charges in connection with repositioning its business. This in turn led to an equity investment loss of €741 million associated with NSN, compared to a loss of €280 mil-lion in the prior year. For additional information, see nOte 7
in d.6 nOtes tO COnsOlidated finanCial statements.
Income from continuing operations in fiscal 2011 benefited from a gain of €1.520 billion on the sale of Energy ’s interest in Areva NP S.A.S. (Areva NP), partly offset by the negative im-pact of €682 million related to an adverse arbitration decision associated with our decision to exit our nuclear power joint venture with Areva S.A. (Areva). The net effect of these factors is included in Other financial income (expense) net. For addi-tional information, see nOte 8 in d.6 nOtes tO COnsOlidated
finanCial statements.
In the current period, Income from continuing operations included €148 million in gains related to changes in other post-employment benefits (OPEB) in the U.S., more than off-set by profit impacts of €347 million, primarily in the Energy Sector, related to a change in credit risk assessment for Iran. These gains and impacts were distributed among various line items.
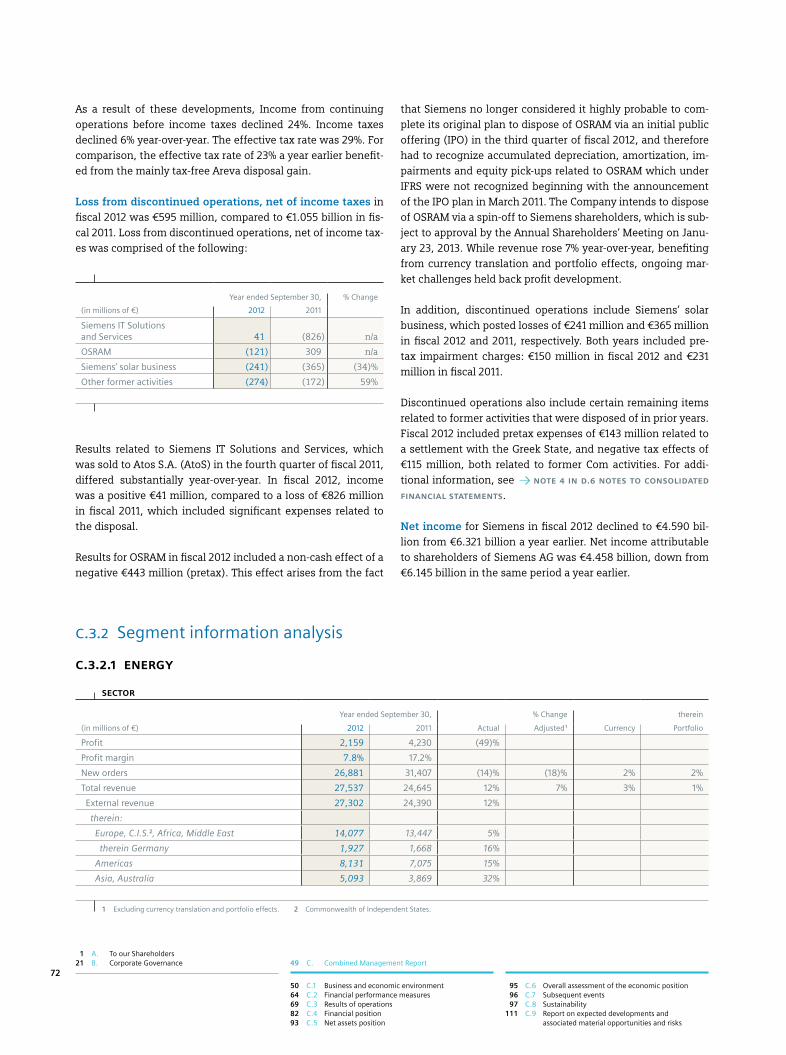
1 A. To our Shareholders 21 B. Corporate Governance 49 C. Combined Management Report
50 C.1 Business and economic environment 64 C.2 Financial performance measures 69 C.3 Results of operations 82 C.4 Financial position 93 C.5 Net assets position
95 C.6 Overall assessment of the economic position 96 C.7 Subsequent events 97 C.8 Sustainability 111 C.9 Report on expected developments and
associated material opportunities and risks
72
As a result of these developments, Income from continuing operations before income taxes declined 24%. Income taxes declined 6% year-over-year. The effective tax rate was 29%. For comparison, the effective tax rate of 23% a year earlier benefit-ed from the mainly tax-free Areva disposal gain.
Loss from discontinued operations, net of income taxes in fiscal 2012 was €595 million, compared to €1.055 billion in fis-cal 2011. Loss from discontinued operations, net of income tax-es was comprised of the following:
Year ended September 30, % Change
(in millions of €) 2012 2011
Siemens IT Solutions and Services 41 (826) n/a
OSRAM (121) 309 n/a
Siemens’ solar business (241) (365) (34)%
Other former activities (274) (172) 59%
Results related to Siemens IT Solutions and Services, which was sold to Atos S.A. (AtoS) in the fourth quarter of fiscal 2011, differed substantially year-over-year. In fiscal 2012, income was a positive €41 million, compared to a loss of €826 million in fiscal 2011, which included significant expenses related to the disposal.
Results for OSRAM in fiscal 2012 included a non-cash effect of a negative €443 million (pretax). This effect arises from the fact
that Siemens no longer considered it highly probable to com-plete its original plan to dispose of OSRAM via an initial public offering (IPO) in the third quarter of fiscal 2012, and therefore had to recognize accumulated depreciation, amortization, im-pairments and equity pick-ups related to OSRAM which under IFRS were not recognized beginning with the announcement of the IPO plan in March 2011. The Company intends to dispose of OSRAM via a spin-off to Siemens shareholders, which is sub-ject to approval by the Annual Shareholders’ Meeting on Janu-ary 23, 2013. While revenue rose 7% year-over-year, benefiting from currency translation and portfolio effects, ongoing mar-ket challenges held back profit development.
In addition, discontinued operations include Siemens’ solar business, which posted losses of €241 million and €365 million in fiscal 2012 and 2011, respectively. Both years included pre-tax impairment charges: €150 million in fiscal 2012 and €231 million in fiscal 2011.
Discontinued operations also include certain remaining items related to former activities that were disposed of in prior years. Fiscal 2012 included pretax expenses of €143 million related to a settlement with the Greek State, and negative tax effects of €115 million, both related to former Com activities. For addi-tional information, see nOte 4 in d.6 nOtes tO COnsOlidated
finanCial statements.
Net income for Siemens in fiscal 2012 declined to €4.590 bil-lion from €6.321 billion a year earlier. Net income attributable to shareholders of Siemens AG was €4.458 billion, down from €6.145 billion in the same period a year earlier.
seCtOr
Year ended September 30, % Change therein
(in millions of €) 2012 2011 Actual Adjusted 1 Currency Portfolio
Profit 2,159 4,230 (49)%
Profit margin 7.8% 17.2%
New orders 26,881 31,407 (14)% (18)% 2% 2%
Total revenue 27,537 24,645 12% 7% 3% 1%
External revenue 27,302 24,390 12%
therein:
Europe, C.I.S.2, Africa, Middle East 14,077 13,447 5%
therein Germany 1,927 1,668 16%
Americas 8,131 7,075 15%
Asia, Australia 5,093 3,869 32%
1 Excluding currency translation and portfolio effects. 2 Commonwealth of Independent States.
C.3.2 Segment information analysis
C.3.2.1 energy

135 D. Consolidated Financial Statements 239 E. Additional Information
130 C.11 Siemens AG (Discussion on basis of German Commercial Code)
134 C.12 Notes and forward-looking statements
129 C.10 Compensation Report, Corporate Governance statement pursuant to Section 289a of the German Commercial Code, Takeover-relevant information and explanatory report
73
Energy reported a profit of €2.159 billion in fiscal 2012, a sharp decrease compared to fiscal 2011. Sector profit was held back by project charges related to offshore grid connection projects totaling €570 million. In the fourth quarter of fiscal 2012, Siemens revised its credit risk assessment for Iran. In accor-dance with project accounting principles, we therefore revised project calculations for the affected contracts. The change in credit risk assessment resulted in earnings impacts totaling €327 million mainly at Oil & Gas. Energy also recorded burdens of €152 million associated with the Olkiluoto project in Fin-land. In addition, Energy ’s business expansion strategy result-ed in higher marketing, selling and general administrative ex-penses as well as higher research and development expenses, and profit development was also held back by a less favorable revenue mix. For comparison, profit of €4.230 billion in fiscal 2011 benefited from the Areva NP gain of €1.520 billion men-tioned earlier, only partly offset by the €682 million profit im-pact related to the arbitration decision discussed earlier and the Sector’s €60 million share of special employee remunera-tion costs. The Sector expects further profit impacts related to Iran in fiscal 2013.
Revenue rose on conversion from the Sector’s strong order backlog in all three reporting regions, including a substantial increase in Asia, Australia. Orders came in 14% lower compared to the prior year, when the Sector recorded a substantially larg-er volume from major orders. This comparison effect was par-ticularly notable in Europe, C.I.S., Africa, Middle East. Energy ’s book-to-bill ratio for fiscal 2012 was 0.98 and its order backlog was €55 billion at the end of the period.
Fossil Power Generation generated profit of €1.933 billion on strong profit contributions from the service and products businesses, while results from the solutions business were significantly lower due to a less favorable project mix com-pared to a year earlier. Profit benefited from a €87 million gain from the sale of the 25% interest in OAO Power Machines. In addition, the Division recorded higher expenses for market-ing and selling year-over-year. For comparison, profit a year earlier included the €1.520 billion Areva NP gain and a more favorable project mix in the component business, partly off-set by the €682 million Areva arbitration impact. Profit in both years was burdened by charges related to the Olkiluoto proj-
new Orders by businesses
Year ended September 30, % Change therein
(in millions of €) 2012 2011 Actual Adjusted 1 Currency Portfolio
Fossil Power Generation 11,116 12,487 (11)% (17)% 2% 4%
Wind Power 4,932 6,461 (24)% (26)% 2% 0%
Oil & Gas 5,307 5,551 (4)% (10)% 2% 3%
Power Transmission 5,824 7,271 (20)% (21)% 1% 0%
1 Excluding currency translation and portfolio effects.
prOfit and prOfit margin by businesses
Profit Profit margin
Year ended September 30, Year ended September 30,
(in millions of €) 2012 2011 % Change 2012 2011
Fossil Power Generation 1,933 2,837 (32)% 17.3% 27.8%
Wind Power 304 357 (15)% 6.0% 9.7%
Oil & Gas 218 467 (53)% 4.3% 9.9%
Power Transmission (302) 566 n/a (4.6)% 8.9%
revenue by businesses
Year ended September 30, % Change therein
(in millions of €) 2012 2011 Actual Adjusted 1 Currency Portfolio
Fossil Power Generation 11,161 10,203 9% 5% 3% 2%
Wind Power 5,066 3,686 37% 29% 8% 0%
Oil & Gas 5,115 4,719 8% 3% 2% 3%
Power Transmission 6,593 6,334 4% 2% 2% 0%
1 Excluding currency translation and portfolio effects.

1 A. To our Shareholders 21 B. Corporate Governance 49 C. Combined Management Report
50 C.1 Business and economic environment 64 C.2 Financial performance measures 69 C.3 Results of operations 82 C.4 Financial position 93 C.5 Net assets position
95 C.6 Overall assessment of the economic position 96 C.7 Subsequent events 97 C.8 Sustainability 111 C.9 Report on expected developments and
associated material opportunities and risks
74
ect in Finland, amounting to €152 million in the current year and €87 million a year ago. Revenue rose 9% year-over-year, with substantial growth in Asia, Australia and significant growth in the Americas more than offsetting a moderate de-cline in Europe, C.I.S., Africa, Middle East. Due to a lower vol-ume from major orders, fiscal 2012 orders came in 11% lower than a year earlier, including a substantial decline in Europe, C.I.S., Africa, Middle East.
Profit at Wind Power was lower year-over-year. Positive contri-butions from substantially higher revenue were offset by high-er expenses for research and development, marketing and sell-ing associated with expansion, a less favorable revenue mix, and increased pricing pressure. In addition, earnings came in lower due to a €32 million provision related to a wind turbine component from an external supplier and a charge of €20 mil-lion related to capacity adjustment. Revenue rose 37% year-over-year, due to conversion of large orders into current busi-ness mainly in Europe, C.I.S., Africa, Middle East, and, to a less-er degree, in the Americas and Asia, Australia. Revenue growth was supported clearly by positive currency translation effects. New orders were down 24% due primarily to a lower volume from large offshore orders in Germany. New order intake in the U.S. was down compared to fiscal 2011. With the expected near-term expiration of tax incentives in the U.S., orders in that country nearly ceased towards the end of fiscal 2012. Giv-en market developments in the U.S., Wind Power announced plans to reduce its production capacity. Challenging market conditions at Wind Power, including pricing pressure, are ex-pected to continue in coming quarters.
Profit at Oil & Gas declined sharply year-over-year from the prior year due primarily to €275 million in earnings impacts
stemming from the change in credit risk assessment for Iran mentioned above. In other respects, Oil & Gas performed well, including a higher earnings contribution from its services business as well as from its turbines business. Revenue in-creased clearly due primarily to growth in Asia, Australia. Or-ders decreased substantially in Asia, Australia, taking orders lower for the Division overall.
Power Transmission reported a loss of €302 million for fiscal 2012, compared to profit of €566 million for fiscal 2011. The major factor was €570 million in project charges related pri-marily to technically complex grid connections to offshore wind-farms in Germany. These charges were due to project delays resulting from a complex regulatory environment and the projects’ complex marine environment, which required revised estimates of resources and personnel. In addition, profit was impacted by charges totaling €66 million to address structural issues in the transformers business. Earnings were also held back by a less favorable revenue mix, due in part to low-margin orders booked during prior periods with signifi-cant pricing pressure. These factors were only partly offset by the release of a provision of €64 million related to a successful project completion. For comparison, prior-year period profit included charges of €57 million, including for staff reduction measures, associated with optimizing the Division’s global manufacturing footprint. Order intake decreased 20% com-pared to the prior year, which included a higher volume from large orders and a sharp drop in orders in the solutions busi-ness due in part to more selective order intake. All three reporting regions saw lower orders. The Division expects con-tinuing challenges, including the technically complex grid-connection projects mentioned above and structural issues in certain businesses.
C.3.2.2 healthCare
seCtOr
Year ended September 30, % Change therein
(in millions of €) 2012 2011 Actual Adjusted 1 Currency Portfolio
Profit 1,815 1,334 36%
Profit margin 13.3% 10.7%
New orders 13,806 13,116 5% 0% 4% 0%
Total revenue 13,642 12,517 9% 4% 4% 0%
External revenue 13,600 12,463 9%
therein:
Europe, C.I.S.2, Africa, Middle East 4,593 4,489 2%
therein Germany 1,056 992 6%
Americas 5,692 5,233 9%
Asia, Australia 3,315 2,741 21%
1 Excluding currency translation and portfolio effects. 2 Commonwealth of Independent States.

135 D. Consolidated Financial Statements 239 E. Additional Information
130 C.11 Siemens AG (Discussion on basis of German Commercial Code)
134 C.12 Notes and forward-looking statements
129 C.10 Compensation Report, Corporate Governance statement pursuant to Section 289a of the German Commercial Code, Takeover-relevant information and explanatory report
75
The healthcare market environment reflected continuing pres-sure on public health budgets in developed countries while healthcare spending increased in emerging market countries, particularly including China. In fiscal 2012, the Healthcare Sector launched “Agenda 2013”, which is a global initiative tar-geting innovation, regional presence, competitiveness, and human resource development. The initiative encompasses a realignment of the radiation therapy business that includes rightsizing measures and a program to improve the cost posi-tion at Diagnostics.
The Healthcare Sector delivered €1.815 billion in profit in fiscal 2012, led by continued strong earnings performance from its imaging and therapy systems businesses. Results for the year were influenced by “Agenda 2013”, including €184 million in charges. The Sector expects additional charges in coming quarters. Profit development also included higher expenses for research and development as well as higher marketing, selling and general administrative expenses, due in part for investments in product development and expand-ed sales activities in emerging markets. These effects were partly offset by the Sector’s €49 million portion of the OPEB-gain in the U.S. mentioned earlier and a net gain of €34 mil-lion from the successful pursuit of a patent infringement claim. For comparison, Healthcare profit in fiscal 2011 was held back by negative impacts related to particle therapy projects, primarily including €381 million in the third quarter when the Sector shifted the focus of certain projects primar-ily to research. Within this impact was a negative effect of approximately €100 million related to reducing revenue from prior periods. In addition the Sector took €32 million in charges stemming from increased cost estimates for com-pleting particle therapy contracts in the first quarter. Fiscal
2011 profit was held back also by the Sector’s €43 million share of the special employee remuneration allocation men-tioned earlier and a loss of €32 million on the sale of a health-care IT business in France.
Profit at Diagnostics came in at €314 million compared to €300 million a year earlier, driven primarily by higher revenue. In connection with the “Agenda 2013” initiative, Diagnostics took €80 million in charges in fiscal 2012 related to improving its cost position. For comparison, profit at Diagnostics in fiscal 2011 was impacted by an increase in valuation allowances for receivables triggered by a debt rating downgrade related to Greece. Purchase price allocation (PPA) effects related to past acquisitions at Diagnostics were €173 million in fiscal 2012. A year earlier, Diagnostics recorded €169 million in PPA effects.
Revenue for Healthcare in fiscal 2012 increased 9% compared to the prior-year period, including growth on a broad basis among its businesses. Revenue a year earlier included the neg-ative revenue effect of approximately €100 million related to particle therapy projects mentioned above. Orders came in 5% higher, with most businesses contributing increases. On a geographic basis, Asia, Australia and the Americas drove reve-nue and order growth, due to increases in China and the U.S. The book-to-bill ratio was 1.01, and Healthcare‘s order backlog was €7 billion at the end of fiscal 2012.
The Sector’s Diagnostics business contributed to overall growth. Revenue and orders were up 8%, both reaching €3.969 billion from €3.667 billion and €3.678 billion, respectively, in the prior-year period. Diagnostics showed the same develop-ment as the Sector with regard to the regions. On an organic basis, both revenue and orders rose 4%.
C.3.2.3 industry
seCtOr
Year ended September 30, % Change therein
(in millions of €) 2012 2011 Actual Adjusted 1 Currency Portfolio
Profit 2,467 2,752 (10)%
Profit margin 12.0% 14.0%
New orders 19,985 20,184 (1)% (3)% 2% 0%
Total revenue 20,508 19,590 5% 2% 3% 0%
External revenue 18,872 18,124 4%
therein:
Europe, C.I.S.2, Africa, Middle East 9,789 9,376 4%
therein Germany 4,487 4,293 5%
Americas 4,280 3,801 13%
Asia, Australia 4,802 4,947 (3)%
1 Excluding currency translation and portfolio effects. 2 Commonwealth of Independent States.

1 A. To our Shareholders 21 B. Corporate Governance 49 C. Combined Management Report
50 C.1 Business and economic environment 64 C.2 Financial performance measures 69 C.3 Results of operations 82 C.4 Financial position 93 C.5 Net assets position
95 C.6 Overall assessment of the economic position 96 C.7 Subsequent events 97 C.8 Sustainability 111 C.9 Report on expected developments and
associated material opportunities and risks
76
In fiscal 2012, profit at Industry declined 10% year-over year as market conditions for the Sector became less favorable in the second half of the period. This was particularly evident in China and to a lesser extent in Germany, two of the Sector’s most important national markets. Profit development in fiscal 2012 was also held back by a less favorable business mix as well as higher marketing, selling, general and administrative expenses associated with innovation and growth opportuni-ties. Furthermore, profit at Industry was impacted by market challenges for its renewable energy offerings. The Sector took €28 million in charges related to severance programs for ad-justing capacity and adapting its portfolio primarily related to those offerings. These factors were only partially offset by In-dustry ’s €30 million portion of the OPEB gain mentioned earli-er. For comparison, profit in fiscal 2011 was burdened by Indus-try ’s €75 million share of a special remuneration allocation.
Revenue in fiscal 2012 for Industry rose moderately year-over-year on broad-based increases across its businesses. Industry ’s orders declined slightly compared to the prior fiscal year as higher orders at Industry Automation were more than offset by a decrease at Drive Technologies and the metal technologies business. On a regional basis, revenue was up in the Americas and Europe, C.I.S., Africa, Middle East, more than offsetting a decline in Asia, Australia. The decline in orders was due pri-marily to lower demand from Asia, Australia. Revenue and or-der development in fiscal 2012 benefited from positive curren-
cy translation effects. On a book-to-bill ratio of 0.97, Industry ’s order backlog was €11 billion at the end of fiscal 2012, un-changed from a year earlier.
Profit at Industry Automation declined 5% year-over year. The decline compared to the prior fiscal year was due mainly to a less favorable business mix, higher marketing and selling, general and administrative expenses and lower earnings from the Division’s offerings for renewable energy. On growth in all three reporting regions, revenue for the Division was up 7% and orders increased 6% year-over-year. Both fiscal years under review included PPA effects from the acquisition of UGS Corp., acquired in fiscal 2007. PPA effects were €149 million in fiscal 2012 and €137 million a year earlier.
Profit at Drive Technologies in fiscal 2012 came in at €970 mil-lion, down significantly from a year earlier also due mainly to a less favorable business mix, lower earnings from its offerings for renewable energy, and higher research and development as well as marketing, selling and general administrative costs compared to fiscal 2011. The Division’s portion of the severance charges mentioned for the Sector was €20 million. While reve-nue for Drive Technologies grew moderately compared to fiscal 2011, orders declined clearly year-over year. On a regional basis, revenue growth was driven by the Americas and supported by moderate growth in Europe, C.I.S, Africa, Middle East. The de-cline in orders was due to weak demand from Asia, Australia.
revenue by businesses
Year ended September 30, % Change therein
(in millions of €) 2012 2011 Actual Adjusted 1 Currency Portfolio
Industry Automation 9,563 8,974 7% 3% 3% 0%
Drive Technologies 9,640 9,179 5% 3% 2% 0%
1 Excluding currency translation and portfolio effects.
new Orders by businesses
Year ended September 30, % Change therein
(in millions of €) 2012 2011 Actual Adjusted 1 Currency Portfolio
Industry Automation 9,547 8,983 6% 4% 3% 0%
Drive Technologies 9,395 9,995 (6)% (8)% 2% 0%
1 Excluding currency translation and portfolio effects.
prOfit and prOfit margin by businesses
Profit Profit margin
Year ended September 30, Year ended September 30,
(in millions of €) 2012 2011 % Change 2012 2011
Industry Automation 1,335 1,411 (5)% 14.0% 15.7%
Drive Technologies 970 1,158 (16)% 10.1% 12.6%

135 D. Consolidated Financial Statements 239 E. Additional Information
130 C.11 Siemens AG (Discussion on basis of German Commercial Code)
134 C.12 Notes and forward-looking statements
129 C.10 Compensation Report, Corporate Governance statement pursuant to Section 289a of the German Commercial Code, Takeover-relevant information and explanatory report
77
C.3.2.4 infrastruCture & Cities
Profit at Infrastructure & Cities came in at €1.102 billion, down slightly year-over-year. While the Power Grid Solutions & Prod-ucts business and the Building Technologies Division both im-proved profit year-over-year, profit at Transportation & Logistics declined substantially due mainly to €86 million in charges at a rolling stock project in Germany. Profit development for the Sector was also held back by €42 million in charges related to severance programs. These negative effects were partly offset by a positive €50 million contribution from the Sector’s inter-est in AtoS and the Sector’s €30 million portion of the OPEB gain mentioned earlier. For comparison, profit in fiscal 2011 was burdened by the Sector’s €63 million share of a special employee remuneration allocation.
seCtOr
Year ended September 30, % Change therein
(in millions of €) 2012 2011 Actual Adjusted 1 Currency Portfolio
Profit 1,102 1,126 (2)%
Profit margin 6.3% 6.6%
New orders 17,150 21,348 (20)% (22)% 2% 0%
Total revenue 17,585 16,976 4% 1% 3% 0%
External revenue 16,731 16,166 3%
therein:
Europe, C.I.S.2, Africa, Middle East 10,121 9,590 6%
therein Germany 2,880 2,938 (2)%
Americas 4,344 3,882 12%
Asia, Australia 2,267 2,694 (16)%
1 Excluding currency translation and portfolio effects. 2 Commonwealth of Independent States.
Revenue grew moderately year-over-year, as higher revenue in the regions America and Europe, C.I.S., Africa, Middle East more than offset a decline in Asia, Australia. Revenue growth was driven by Power Grid Solutions & Products and Building Technologies. Revenue at Transportation & Logistics declined slightly year-over-year. Orders for the Sector decreased 20% compared to the prior year, which included a sharply higher volume from major orders at Transportation & Logistics. This included Siemens’ largest-ever train order in Germany, worth €3.7 billion, and a major order for high-speed trains in the U.K. As a result, fiscal 2012 orders came in substantially lower in Europe, C.I.S., Africa, Middle East. Order intake was also clearly lower in Asia, Australia, only partly offset by a slight increase in the Americas. On a book-to-bill ratio of 0.98, Infrastruc-ture & Cities’ order backlog was €24 billion at the end of fiscal 2012, unchanged from a year earlier.
new Orders by businesses
Year ended September 30, % Change therein
(in millions of €) 2012 2011 Actual Adjusted 1 Currency Portfolio
Transportation & Logistics 5,382 10,052 (46)% (48)% 1% 0%
Power Grid Solutions & Products 6,275 5,905 6% 4% 2% 0%
Building Technologies 5,809 5,597 4% 0% 3% 0%
1 Excluding currency translation and portfolio effects.
revenue by businesses
Year ended September 30, % Change therein
(in millions of €) 2012 2011 Actual Adjusted 1 Currency Portfolio
Transportation & Logistics 5,969 6,041 (1)% (4)% 2% 0%
Power Grid Solutions & Products 6,068 5,657 7% 5% 2% 0%
Building Technologies 5,820 5,468 6% 3% 3% 0%
1 Excluding currency translation and portfolio effects.

1 A. To our Shareholders 21 B. Corporate Governance 49 C. Combined Management Report
50 C.1 Business and economic environment 64 C.2 Financial performance measures 69 C.3 Results of operations 82 C.4 Financial position 93 C.5 Net assets position
95 C.6 Overall assessment of the economic position 96 C.7 Subsequent events 97 C.8 Sustainability 111 C.9 Report on expected developments and
associated material opportunities and risks
78
Profit at the Transportation & Logistics business declined 35% year-over-year. This decline was due mainly to the above-men-tioned €86 million in charges related to delays in fulfilling a rolling stock order in Germany. In addition, the revenue mix in fiscal 2012 was less favorable due to lower margins associated with large, long-term contracts from prior periods which Transportation & Logistics began to convert into current busi-ness in fiscal 2012. Revenue came in slightly lower year-over-year, as higher revenue in the Europe, C.I.S., Africa, Middle East region was more than offset by lower revenue in Asia, Australia and the Americas. Order intake decreased 46% year-over-year, due to the sharply higher volume from large orders a year earlier. This comparison effect was particularly evident in the Europe, C.I.S., Africa, Middle East region, where Transpor-tation & Logistics won the above-mentioned large orders in fis-cal 2011 for trains in Germany and the U.K.
The profit improvement at Power Grid Solutions & Products was driven by the business’ low and medium voltage activities. Profit from smart grid activities was held back by higher re-search and development, marketing, selling and general ad-ministrative expenses for growth initiatives. Revenue and or-ders increased clearly year-over-year, particularly including double-digit growth in the Americas.
Profit at Building Technologies increased moderately year-over-year. Profit development in fiscal 2012 was held back by higher research and development, marketing, selling and gen-eral administrative expenses associated with growth initia-tives. Growth in revenue and orders was driven by demand for the Division’s energy efficiency solutions. On a regional basis, revenue and orders were up in all three reporting regions.
C3.2.5 equity investments
In fiscal 2012, Equity Investments recorded a loss of €549 mil-lion compared to a loss of €26 million in fiscal 2011. The differ-ence year-over-year is due mainly to a sharply higher equity in-vestment loss related to our share in NSN, which increased to €741 million in fiscal 2012 compared to a loss of €280 million a year earlier. NSN reported to Siemens that it took restructuring charges and associated items totaling €1.059 billion in fiscal 2012 up from €151 million in the prior fiscal year. In fiscal 2012, NSN started implementing its previously announced global re-structuring program aimed at maintaining its long-term com-petitiveness and improving profitability. Equity investment loss related to our share in EN declined to €23 million in fiscal 2012 compared to €46 million a year earlier. Losses in both fiscal years were partly offset by income from equity investments related to our share in BSH. Furthermore, results from Equity Investments in fiscal 2011 benefited from a €90 million gain on the sale of our share in KMW. Results at Equity Investments are expected to remain volatile in coming quarters.
C.3.2.6 finanCial serviCes (sfs)
(in millions of €)
Year ended September 30, % Change
2012 2011
Income before income taxes 479 428 12%
Total assets 17,405 14,602 19%
In fiscal 2012, SFS recorded a higher profit (defined as income before income taxes) year-over-year. While both interest result and operating expenses associated with SFS’ growth strategy increased year-over-year, the current period was primarily af-fected by a €78 million gain on the sale of a stake in Bangalore International Airport Limited, a public-private partnership, re-ducing SFS’ equity participation from 40% to 26%. This gain was
prOfit and prOfit margin by businesses
Profit Profit margin
Year ended September 30, Year ended September 30,
(in millions of €) 2012 2011 % Change 2012 2011
Transportation & Logistics 236 365 (35)% 4.0% 6.0%
Power Grid Solutions & Products 457 413 11% 7.5% 7.3%
Building Technologies 379 364 4% 6.5% 6.7%

135 D. Consolidated Financial Statements 239 E. Additional Information
130 C.11 Siemens AG (Discussion on basis of German Commercial Code)
134 C.12 Notes and forward-looking statements
129 C.10 Compensation Report, Corporate Governance statement pursuant to Section 289a of the German Commercial Code, Takeover-relevant information and explanatory report
79
partly offset by higher credit hits. The growth strategy at SFS has led to a significant build-up in total assets, from €14.602 bil-lion at the end of fiscal 2011 to €17.405 billion at the end of fiscal 2012, including positive currency translation effects.
The following table provides further information on the capital structure of SFS as of September 30, 2012 and 2011:
(in millions of €)
Year ended September 30,
2012 2011
Allocated equity 1,790 1,593
Total debt 14,558 12,075
therein intragroup financing 14,510 12,066
therein debt from external sources 47 9
Debt to equity ratio 8.13 7.58
Cash and cash equivalents 116 178
Both Moody ’s and Standard & Poor’s view SFS as a captive finance company. These rating agencies generally recognize and accept higher levels of debt attributable to captive finance subsidiaries in determining long-term and short-term credit ratings.
The allocated equity for SFS is mainly determined and influ-enced by the size and quality of its portfolio of commercial finance as well as project and structured finance assets (pri-marily loans and leases) and equity investments. This alloca-tion is designed to cover the risks of the underlying business and is in line with common risk management standards. The actual risk of the SFS portfolio is evaluated and controlled on a regular basis. The allocated equity is calculated quarterly.
C.3.2.7 reCOnCiliatiOn tO COnsOlidated finanCial statementsReconciliation to Consolidated Financial Statements includes Centrally managed portfolio activities, Siemens Real Estate (SRE) and various categories of items which are not allocated to the Sectors and to SFS because the Company ’s management has determined that such items are not indicative of the Sectors’ and SFS’ respective performance.
Centrally managed portfolio activitiesCentrally managed portfolio activities reported a loss of €29 million in fiscal 2012, compared to a loss of €40 million in fiscal 2011.
Siemens Real EstateIncome before income taxes at SRE was €115 million in fiscal 2012, compared to €150 million in fiscal 2011. This decrease is due in part to lower income related to the disposal of real es-tate. SRE expects to continue with real estate disposals de-pending on market conditions.
Corporate items and pensionsCorporate items and pensions totaled a negative €302 million in fiscal 2012 compared to a negative €257 million a year earlier.
The difference was due mainly to centrally carried pension ex-pense, which totaled a negative €47 million in fiscal 2012, com-pared to a positive €75 million in the prior year. The change is due primarily to a negative effect resulting from a lower ex-pected return on plan assets and higher interest costs.
Corporate items were a negative €255 million in fiscal 2012 compared to a negative €331 million in fiscal 2011. The amount for fiscal 2012 benefited from positive effects related to legal and regulatory matters, compared to net expenses, including a provision of regional risks of €99 million, related to such mat-ters in the prior year. In addition, fiscal 2012 includes an amount of €103 million related to reimbursements to AtoS, compared to €53 million in the prior year. It also includes a net gain of €19 million related to a major asset retirement obliga-tion, compared to a net loss of €28 million in fiscal 2011. The prior year benefited from management’s allocation of €267 million of personnel-related costs related to special employee remuneration, which had been accrued in Corporate items in fiscal 2010. Within this amount, €240 million was allocated to the Sectors.
Eliminations, Corporate Treasury and other reconciling itemsIn fiscal 2012, income before income taxes from Eliminations, Corporate Treasury and other reconciling items was a positive €23 million, compared to a negative €90 million a year earlier. The main factor of the improvement was Corporate Treasury activities, due mainly to positive changes in the fair market value of interest rate derivatives not qualifying for hedge accounting used for interest rate management, partly offset by negative currency effects relating to corporate financing activities.

1 A. To our Shareholders 21 B. Corporate Governance 49 C. Combined Management Report
50 C.1 Business and economic environment 64 C.2 Financial performance measures 69 C.3 Results of operations 82 C.4 Financial position 93 C.5 Net assets position
95 C.6 Overall assessment of the economic position 96 C.7 Subsequent events 97 C.8 Sustainability 111 C.9 Report on expected developments and
associated material opportunities and risks
80
The following table gives additional information on topics in-cluded in Profit and Income before income taxes and provides a reconciliation to adjusted EBITDA based on continuing opera-tions. We report adjusted EBIT and adjusted EBITDA as a per-formance measure. The closest comparable GAAP figure under
IFRS is Net income as reported in our “Consolidated Statements of Income.” For further information regarding adjusted EBIT and adjusted EBITDA, please see C.12 nOtes and fOrward-
lOOking statements.
fOr the fisCal years ended september 30, 2012 and 2011
Profit 1 Income (loss) from investments accounted for using the equity
method, net 2
Financial income(expense), net 3
Adjusted EBIT 4 Amortization 5 Depreciation and impairments of property,
plant and equipmentand goodwill 6
Adjusted EBITDA Adjusted EBITDA margin
(in millions of €) 2012 2011 2012 2011 2012 2011 2012 2011 2012 2011 2012 2011 2012 2011 2012 2011
Sectors
Energy Sector 2,159 4,230 87 75 39 827 2,033 3,327 97 60 426 343 2,557 3,730 9.3% 15.1%
therein: Fossil Power Generation 1,933 2,837 41 33 67 823 1,825 1,981 21 15 142 125 1,988 2,121
Wind Power 304 357 6 (3) (5) (3) 303 364 27 9 100 63 430 435
Oil & Gas 218 467 – – (4) (3) 222 470 38 26 71 63 330 560
Power Transmission (302) 566 25 35 (20) 10 (308) 520 11 10 109 87 (187) 617
Healthcare Sector 1,815 1,334 8 9 2 3 1,804 1,322 377 320 349 324 2,530 1,967 18.5% 15.7%
therein: Diagnostics 314 300 – – 9 5 305 295 232 188 226 219 763 702
Industry Sector 2,467 2,752 12 19 (15) (2) 2,469 2,735 268 249 323 309 3,060 3,292 14.9% 16.8%
therein: Industry Automation 1,335 1,411 2 8 (8) (1) 1,340 1,403 209 193 137 129 1,687 1,725
Drive Technologies 970 1,158 10 7 (6) (1) 966 1,152 48 45 172 163 1,187 1,360
Infrastructure & Cities Sector 1,102 1,126 25 18 29 (28) 1,048 1,136 112 115 165 163 1,324 1,414 7.5% 8.3%
therein: Transportation & Logistics 236 365 15 11 (16) (7) 236 361 13 15 46 44 296 421
Power Grid Solutions & Products 457 413 9 7 (4) (4) 452 409 39 41 71 71 562 521
Building Technologies 379 364 1 1 (2) (1) 381 365 60 58 47 48 488 471
Total Sectors 7,543 9,442 133 121 55 800 7,355 8,521 854 744 1,262 1,139 9,471 10,404
Equity Investments (549) (26) (568) (44) 7 13 12 5 – – – – 12 5
Financial Services (SFS) 479 428 168 92 385 299 (73) 37 7 9 264 256 197 303
Reconciliation to Consolidated Financial Statements
Centrally managed portfolio activities (29) (40) 7 12 – – (36) (52) 4 3 2 4 (31) (44)
Siemens Real Estate (SRE) 115 150 – – (112) (82) 227 232 2 2 325 271 553 504
Corporate items and pensions (302) (257) – – 29 94 (331) (350) 16 12 51 47 (264) (290)
Eliminations, Corporate Treasury and other reconciling items 23 (90) (5) 29 137 10 (109) (129) – – (41) (50) (151) (179)
Siemens 7,279 9,608 (266) 210 501 1,133 7,043 8,264 882 770 1,862 1,667 9,788 10,701
1 Profit of the Sectors as well as of Equity Investments and Centrally managed portfolio activities is earnings before financing interest, certain pension costs and income taxes. Certain other items not considered performance indicative by Management may be excluded. Profit of SFS and SRE is Income before income taxes. Profit of Siemens is Income from continuing operations before income taxes. For a reconciliation of Income from continuing operations before income taxes to Net income see d.1 COnsOlidated statements Of inCOme.
2 Includes impairments and reversals of impairments of investments accounted for using the equity method.
3 Includes impairment of non-current available-for-sale financial assets. For Siemens, Financial income (expense), net comprises Interest income, Interest expense and Other financial income (expense), net as reported in the Consolidated Statements of Income.
C.3.3 Reconciliation to adjusted EBITDA (continuing operations)

135 D. Consolidated Financial Statements 239 E. Additional Information
130 C.11 Siemens AG (Discussion on basis of German Commercial Code)
134 C.12 Notes and forward-looking statements
129 C.10 Compensation Report, Corporate Governance statement pursuant to Section 289a of the German Commercial Code, Takeover-relevant information and explanatory report
81
fOr the fisCal years ended september 30, 2012 and 2011
Profit 1 Income (loss) from investments accounted for using the equity
method, net 2
Financial income(expense), net 3
Adjusted EBIT 4 Amortization 5 Depreciation and impairments of property,
plant and equipmentand goodwill 6
Adjusted EBITDA Adjusted EBITDA margin
(in millions of €) 2012 2011 2012 2011 2012 2011 2012 2011 2012 2011 2012 2011 2012 2011 2012 2011
Sectors
Energy Sector 2,159 4,230 87 75 39 827 2,033 3,327 97 60 426 343 2,557 3,730 9.3% 15.1%
therein: Fossil Power Generation 1,933 2,837 41 33 67 823 1,825 1,981 21 15 142 125 1,988 2,121
Wind Power 304 357 6 (3) (5) (3) 303 364 27 9 100 63 430 435
Oil & Gas 218 467 – – (4) (3) 222 470 38 26 71 63 330 560
Power Transmission (302) 566 25 35 (20) 10 (308) 520 11 10 109 87 (187) 617
Healthcare Sector 1,815 1,334 8 9 2 3 1,804 1,322 377 320 349 324 2,530 1,967 18.5% 15.7%
therein: Diagnostics 314 300 – – 9 5 305 295 232 188 226 219 763 702
Industry Sector 2,467 2,752 12 19 (15) (2) 2,469 2,735 268 249 323 309 3,060 3,292 14.9% 16.8%
therein: Industry Automation 1,335 1,411 2 8 (8) (1) 1,340 1,403 209 193 137 129 1,687 1,725
Drive Technologies 970 1,158 10 7 (6) (1) 966 1,152 48 45 172 163 1,187 1,360
Infrastructure & Cities Sector 1,102 1,126 25 18 29 (28) 1,048 1,136 112 115 165 163 1,324 1,414 7.5% 8.3%
therein: Transportation & Logistics 236 365 15 11 (16) (7) 236 361 13 15 46 44 296 421
Power Grid Solutions & Products 457 413 9 7 (4) (4) 452 409 39 41 71 71 562 521
Building Technologies 379 364 1 1 (2) (1) 381 365 60 58 47 48 488 471
Total Sectors 7,543 9,442 133 121 55 800 7,355 8,521 854 744 1,262 1,139 9,471 10,404
Equity Investments (549) (26) (568) (44) 7 13 12 5 – – – – 12 5
Financial Services (SFS) 479 428 168 92 385 299 (73) 37 7 9 264 256 197 303
Reconciliation to Consolidated Financial Statements
Centrally managed portfolio activities (29) (40) 7 12 – – (36) (52) 4 3 2 4 (31) (44)
Siemens Real Estate (SRE) 115 150 – – (112) (82) 227 232 2 2 325 271 553 504
Corporate items and pensions (302) (257) – – 29 94 (331) (350) 16 12 51 47 (264) (290)
Eliminations, Corporate Treasury and other reconciling items 23 (90) (5) 29 137 10 (109) (129) – – (41) (50) (151) (179)
Siemens 7,279 9,608 (266) 210 501 1,133 7,043 8,264 882 770 1,862 1,667 9,788 10,701
4 Adjusted EBIT is Income from continuing operations before income taxes less Financial income (expense), net and Income (loss) from investments accounted for using the equity method, net.
5 Amortization and impairments, net of reversals, of intangible assets other than goodwill.
6 Depreciation and impairments of property, plant and equipment, net of reversals. Includes impairments of goodwill of € – million in the current period and € – million in the prior-year period, respectively.

1 A. To our Shareholders 21 B. Corporate Governance 49 C. Combined Management Report
50 C.1 Business and economic environment 64 C.2 Financial performance measures 69 C.3 Results of operations 82 C.4 Financial position 93 C.5 Net assets position
95 C.6 Overall assessment of the economic position 96 C.7 Subsequent events 97 C.8 Sustainability 111 C.9 Report on expected developments and
associated material opportunities and risks
82
C.4.1 Principles and objectives of financial management
Siemens is committed to a strong financial profile, which pro-vides the financial flexibility to achieve growth and portfolio optimization goals largely independent of capital market con-ditions.
Financial management at Siemens is executed according to applicable laws and internal guidelines and regulations. It in-cludes the following activities:
C.4.1.1 Liquidity managementOur principal source of financing is cash inflows from operat-ing activities. Corporate Treasury generally manages cash and cash equivalents for Siemens and has primary responsibility for raising funds in the capital markets for Siemens through various debt products, with the exception of countries with conflicting capital market controls. The relevant consolidated subsidiaries in these countries obtain financing primarily from local banks. Siemens follows a prudent borrowing policy that is aimed towards a balanced financing portfolio, a diversified maturity profile and a comfortable liquidity cushion. On Sep-tember 30, 2012, Siemens held €10.891 billion in cash and cash equivalents, mainly in euro, which were predominantly man-aged by Corporate Treasury. Especially since the beginning of the global financial markets crisis, Siemens monitors funding options available in the capital markets, trends in the availabil-ity of funds and the cost of such funding very closely to evalu-ate possible strategies regarding its financial and risk profile.
Corporate Treasury enters into reverse repurchase agreements with financial institutions with investment grade credit rat-ings. Siemens holds securities as collateral under these agree-ments via a third party (Euroclear) and is permitted to sell or re-pledge the securities. The extent to which Siemens engages in transactions involving reverse repurchase agreements de-pends on its liquidity management needs and the availability of cash and cash equivalents which varies from time to time. For further information on reverse purchase agreements see
note 30 in d.6 notes to ConsoLidated FinanCiaL statements.
C.4.1.2 Cash management Cash management comprises the management of bank part-ner relationships and bank accounts as well as the execution of payments, including the administration of cash pools, on a global level. Siemens strives to raise efficiency and transparency through a high level of standardization and continuous ad-vancement of payment processes. Where permissible, the exe-cution of intercompany and third party payments is effected centrally through group-wide tools with central controls to en-sure compliance with internal and external guidelines and re-quirements. To ensure efficient management of Siemens’ funds, Corporate Treasury has established a central cash manage-ment approach: to the extent legally and economically feasi-ble, funds are pooled and managed centrally by Corporate Treasury. Conversely, funding needs within Siemens are cov-ered centrally by Corporate Treasury via intercompany current accounts and / or loans where legally and economically feasible.
C.4.1.3 FinanCiaL risk management Investments of cash and cash equivalents are subject to credit requirements and counterparty limits. Corporate Treasury pools and centrally manages Siemens’ interest rate, certain commodity and currency risk exposures and uses financial de-rivative instruments in transactions with external financial in-stitutions to offset such concentrated exposures. Especially since the beginning of the global financial market crisis, Siemens monitors counterparty risk in its financial assets and financial derivative instruments very closely. For more detailed information about financial risk management at Siemens see
note 32 in d.6 notes to ConsoLidated FinanCiaL statements.
C.4.1.4 management oF pension pLan FundingSiemens’ funding policy for its pension funds is part of its over-all commitment to sound financial management, which in-cludes a continuous analysis of the structure of its pension liabilities. For more detailed information about Siemens’ pen-sion plan funding see C.4.4.3 Funding oF pension pLans and
simiLar Commitments.
C.4.1.5 CapitaL struCture management and Credit rating To effectively manage its capital structure, Siemens seeks to maintain ready access to the capital markets through various debt products and to preserve its ability to repay and service its debt obligations over time. For more detailed information about Siemens’ capital structure, see below.
C.4 FinanCial Position

135 D. Consolidated Financial Statements 239 E. Additional Information
130 C.11 Siemens AG (Discussion on basis of German Commercial Code)
134 C.12 Notes and forward-looking statements
129 C.10 Compensation Report, Corporate Governance statement pursuant to Section 289a of the German Commercial Code, Takeover-relevant information and explanatory report
83
A key factor in maintaining a strong financial profile is our credit rating which is affected by, among other factors, our capital structure, profitability, ability to generate cash flow, geographic and product diversification as well as our competi-tive market position. Our current corporate credit ratings from Moody ’s Investors Service (Moody ’s) and Standard & Poor’s Ratings Services (S&P) are noted as follows:
Moody ’s S&P
Long-term debt Aa3 A+
Short-term debt P-1 A-1+
On June 5, 2012 Moody ’s raised its long-term Siemens’ credit rating from “A1” to “Aa3.” The rating classification “Aa” is the second highest rating within Moody ’s debt ratings category. The numerical modifier “3” indicates a ranking in the lower end of that rating category. At the same time Moody ’s revised its outlook for our credit rating from “positive” to “stable.” The Moody ’s rating outlook is an opinion regarding the likely direc-tion of an issuer’s rating over the medium-term. Rating out-looks of Moody ’s fall into the following six categories: “posi-tive,” “negative,” “stable,” “developing,” “ratings under review” and “no outlook.” Moody ’s announced that the rating action was prompted by the higher levels of profitability and cash flow leverage that the company has been able to achieve over the past few years, and Moody ’s assessment that these levels are likely to be sustainable through economic cycles, including the current period of economic weakness in Europe.
Moody ’s rating for our short-term corporate credit and commer-cial paper is “P-1,” the highest available rating in the prime rating system, which assesses issuers’ ability to honor senior financial obligations and contracts. It applies to senior unsecured obliga-tions with an original maturity of less than one year. On June 5, 2012 Moody ’s affirmed our “P-1” short-term rating.
On November 14, 2012, S&P revised its outlook for Siemens’ credit rating from “positive” to “stable”. At the same time, S&P affirmed the “A+” long-term corporate rating and the “A-1+” short-term rating, which is the highest short-term rating with-in the S&P’s short-term rating scale.
The outlook revision to “stable” captures the contraction of op-erating margin during fiscal 2012 as well as Siemens’ pursuit of more shareholder friendly actions in the form of a share buy-back and a revision of the shareholder distribution policy from 30%-50% payout range to 40%-60% including share buybacks. Within S&P’s long-term credit rating definitions “A” has the
third highest long-term rating category. The modifier “+” indi-cates that our long-term debt ranks in the upper end of the “A” category. A rating outlook indicates the potential direction of a long-term credit rating over the medium-term. Rating outlooks of S&P’s fall into the following four categories: “positive,” ”neg-ative,” ”stable” and “developing.”
The U.S. Securities and Exchange Commission granted Moody ’s and S&P the status of nationally recognized statistical rating or-ganizations (NRSROs). Siemens does not have any agreements with other nationally recognized statistical rating organiza-tions to provide long-term and short-term credit ratings.
We believe that our high credit rating for our long-term debt applied by Moody ’s and S&P’s allows us to raise funds in the capital markets with attractive conditions or to obtain flexible financing from banks. A high credit rating generally leads to lower credit spreads and therefore our rating also positively af-fects our funding costs. We expect no impact on our funding costs as a consequence of the revised rating outlook by S&P on November 14, 2012.
Security ratings are not a recommendation to buy, sell or hold securities. Credit ratings may be subject to revision or with-drawal by the rating agencies at any time and each rating should be evaluated independently of any other rating.
C.4.2. Capital structure
Given the favorable capital market conditions at the end of fis-cal 2012, Siemens announced in August 2012 that it would ad-just its capital structure through share buybacks amounting to up to €3 billion by December 30, 2012. The shares repurchased may be used for the purposes of cancellation and reduction of capital stock, issuance to employees, board members of affili-ated companies and members of the Managing Board as well as to meet obligations arising under and in connection with convertible bonds and warrant bonds. In fiscal 2012, the Com-pany repurchased 23,202,500 treasury shares at a weighted av-erage share price of €76.14. Additionally, the Managing Board decided to cancel 33,203,421 treasury shares, which reduced common stock from 914 million shares to 881 million shares. After the end of fiscal 2012 Siemens repurchased additional 14,746,786 treasury shares at a weighted average price of €78.14 and completed this share buyback program in Novem-ber 2012.
In September 2012, Siemens issued €1.4 billion and £1.0 billion (€1.3 billion) in fixed-rate instruments, which were partly used to finance this share buyback program.

1 A. To our Shareholders 21 B. Corporate Governance 49 C. Combined Management Report
50 C.1 Business and economic environment 64 C.2 Financial performance measures 69 C.3 Results of operations 82 C.4 Financial position 93 C.5 Net assets position
95 C.6 Overall assessment of the economic position 96 C.7 Subsequent events 97 C.8 Sustainability 111 C.9 Report on expected developments and
associated material opportunities and risks
84
Considering the above mentioned transactions and the chang-es in equity and debt described in C.5 net assets position, the capital structure changed as follows:
(in millions of €)
Year ended September 30, % Change
2012 2011
Total equity attributable to shareholders of Siemens AG 30,733 31,530 (3)%
As percentage of total capital 60% 64%
Short-term debt and current maturities of long-term debt 3,826 3,660
Long-term debt 16,880 14,280
Total debt 20,707 17,940 15%
As percentage of total capital 40% 36%
Total capital (total equity and total debt) 51,440 49,470 4%
We have commitments to sell or otherwise issue common shares in connection with established share-based compensa-tion plans. In fiscal 2012, commitments for share-based com-pensation were fulfilled through treasury shares. In fiscal 2013, we may again fulfill commitments for share-based compensa-tion through treasury shares. Amongst other purposes men-tioned above we may therefore repurchase additional treasury shares in fiscal 2013. For additional information with respect to share-based compensation see note 33 in d.6 notes to Con-
soLidated FinanCiaL statements.
As part of our One Siemens framework for sustainable value creation, Siemens decided to continue to use an indicator to evaluate its capital structure. For further information, see
C.2 FinanCiaL perFormanCe measures. A key consideration in this regard is maintenance of ready access to the capital mar-kets through various debt products and preservation of our ability to repay and service our debt obligations over time. Siemens set a capital structure target range of 0.5 – 1.0. The ratio is defined as the item Adjusted industrial net debt divid-ed by the item Adjusted EBITDA (continuing operations). The calculation of the item Adjusted industrial net debt is set forth in the table below. Adjusted EBITDA (continuing opera-tions) is defined as adjusted earnings before income taxes (EBIT) before amortization (defined as amortization and im-pairments, net of reversals, of intangible assets other than goodwill) and depreciation and impairments of property, plant and equipment and goodwill. Adjusted EBIT is defined as the line item Income from continuing operations before in-come taxes less the line item Interest income, less the line item Interest expense less the line item Other financial in-come (expense), net as well as less the line item Income
(loss) from investments accounted for using the equity method, net. For further information, see C.3.3 reConCiLia-
tion to ConsoLidated FinanCiaL statements.
(in millions of €)
Year ended September 30,
2012 2011
Short-term debt and current maturities of long-term debt 1 3,826 3,660
Plus: Long-term debt 1 16,880 14,280
Less: Cash and cash equivalents (10,891) (12,468)
Less: Current available-for-sale financial assets (524) (477)
Net debt 9,292 4,995
Less: SFS Debt 2 (14,558) (12,075)
Plus: Pension plans and similar commitments 3 9,926 7,307
Plus: Credit guarantees 326 591
Less: 50% nominal amount hybrid bond 4 (920) (883)
Less: Fair value hedge accounting adjustment 5 (1,670) (1,470)
Adjusted industrial net debt 2,396 (1,534)
Adjusted EBITDA (continuing operations) 9,788 10,701
Adjusted industrial net debt / adjusted EBITDA (continuing operations) 0.24 (0.14)
1 The item Short-term debt and current maturities of long-term debt as well as the item Long-term debt included in total fair value hedge accounting adjustments of €1,670 million and €1,470 million for the fiscal year ended September 30, 2012 and 2011, respectively.
2 The adjustment considers that both Moody’s and S&P’s view SFS as a captive finance company. These rating agencies generally recognize and accept higher levels of debt attributable to captive finance subsidiaries in determining credit ratings. Following this concept, we exclude SFS Debt in order to derive an adjusted industrial net debt which is not affected by SFS’s financing activities.
3 To reflect Siemens’ total pension liability, adjusted industrial net debt includes line item Pension plans and similar commitments as presented in d.3 ConsoLidated statements oF FinanCiaL position.
4 The adjustment for our hybrid bond considers the calculation of this financial ratio applied by rating agencies to classify 50% of our hybrid bond as equity and 50% as debt. This assignment reflects the characteristics of our hybrid bond such as a long maturity date and subordination to all senior and debt obligations.
5 Debt is generally reported with a value representing approximately the amount to be repaid. However for debt designated in a hedging relationship (fair value hedges), this amount is adjusted by changes in market value mainly due to changes in inter-est rates. Accordingly we deduct these changes in market value in order to end up with an amount of debt that approximately will be repaid. We believe this is a more meaningful figure for the calculation presented above. For further information on fair value hedges see note 31 in d.6 notes to ConsoLidated FinanCiaL statements.
C.4.3 Cash flows
The following discussion presents an analysis of our cash flows from operating, investing and financing activities for fis-cal 2012 and 2011 for both continuing and discontinued opera-tions. Discontinued operations include primarily OSRAM and Siemens IT Solutions and Services, which were classified as discontinued operations during the second quarter of fiscal 2011, and the solar business, which was classified as discontin-ued operations during the fourth quarter of fiscal 2012. Siemens IT Solutions and Services was sold to AtoS in the fourth quarter of fiscal 2011.

135 D. Consolidated Financial Statements 239 E. Additional Information
130 C.11 Siemens AG (Discussion on basis of German Commercial Code)
134 C.12 Notes and forward-looking statements
129 C.10 Compensation Report, Corporate Governance statement pursuant to Section 289a of the German Commercial Code, Takeover-relevant information and explanatory report
85
Cash FLows
Continuing operations Discontinued operations Continuing and discontinued operations
Year ended September 30, Year ended September 30, Year ended September 30,
(in millions of €) 2012 2011 2012 2011 2012 2011
Net cash provided by (used in):
Operating activities 6,996 8,081 (24) (314) 6,972 7,767
Investing activities (5,034) (2,739) (650) (1,305) (5,685) (4,044)
therein: Additions to intangible assets and property, plant and equipment (2,206) (2,163) (204) (454) (2,410) (2,617)
Free cash flow 1 4,790 5,918 (228) (768) 4,562 5,150
Financing activities (3,591) (7,062) 674 1,619 (2,916) (5,443)
1 The closest comparable financial measure of Free cash flow under IFRS is Net cash provided by (used in) operating activities. Net cash provided by (used in) operating activities from continuing operations as well as from continuing and discontinued
operations is reported in d.4 ConsoLidated statements oF Cash FLow. Other companies that report Free cash flow may define and calculate this measure differently.
We report Free cash flow as a supplemental liquidity measure, which is defined as net cash provided by (used in) operating activities less cash used for additions to intangible assets and property, plant and equipment. We believe that the presenta-tion of Free cash flow provides useful information to investors because it gives an indication of the long-term cash-generat-ing ability of our business and our ability to pay for discretion-ary and non-discretionary expenditures not included in the measure, such as dividends, debt repayment or acquisitions. We also use Free cash flow to compare cash generation among the segments of our business. Free cash flow should not be considered in isolation or as an alternative to measures of cash flow calculated in accordance with IFRS. For further informa-tion about the usefulness and limitations of this measure, see
C.12 notes and Forward-Looking statements.
Cash flows from operating activities – Continuing opera-tions provided net cash of €6.996 billion in fiscal 2012, com-pared to net cash provided of €8.081 billion in the same period a year earlier. In the current period income from continuing operations was €5.184 billion. Therein included were amortiza-tion, depreciation and impairments of €2.744 billion. A build-up of operating net working capital reduced the cash inflows by €0.7 billion. The increase in operating net working capital was due mainly to a decrease in billings in excess of costs and estimated earnings on uncompleted contracts and related ad-vances primarily in the Energy Sector due in part to lower or-ders year-over-year. The current period also included cash out-flows of approximately €0.3 billion related to the revaluation of the commercial feasibility of Healthcare’s particle therapy business for general patient treatment as well as Healthcare’s Agenda 2013 initiative. In the prior-year period income from continuing operations was €7.376 billion. Therein included were amortization, depreciation and impairments of €2.437 billion. Income from continuing operations also included the Areva NP disposal gain of €1.520 billion, partly offset by the negative impact of €682 million related to an adverse arbitra-
tion decision associated with Siemens’ decision to exit its nu-clear power joint venture with Areva, which was deducted in the Consolidated Statements of Cash Flow within the line item (Gains) losses on sales of investments, net. A build-up of oper-ating net working capital in the prior-year period reduced cash inflows near the level of fiscal 2012.
Discontinued operations used net cash of €24 million in fiscal 2012, compared to net cash used of €314 million in the prior-year period. The largest factor of the decrease in cash outflows year-over-year was lower cash outflows related to Siemens IT Solutions and Services, which a year earlier included higher payments in connection with the establishment of Siemens IT Solutions and Services as a separate legal group, including for carve-out activities and personnel-related matters.
Cash flows from investing activities – Net cash used in in-vesting activities for continuing operations amounted to €5.034 billion in fiscal 2012 compared to net cash used of €2.739 billion in the prior-year period. The increase in cash out-flows from investing activities was due mainly to lower pro-ceeds from sales of investments, intangibles and property, plant and equipment of €1.355 billion; to higher acquisitions, net of cash acquired, of €1.011 billion; and to the higher build-up in receivables from financing activities of €317 million relat-ing to SFS’s asset growth strategy. Proceeds of €753 million in the current period from the sales of investments, intangibles and property, plant and equipment included the sale of our 25% interest in OAO Power Machines, held by the Energy Sector. In the prior-year period, proceeds from sales of investments, intangibles and property, plant and equipment provided net cash of €2.108 billion. This total included proceeds from the sale of investments of €1.587 billion, mainly related to the sale of our Areva NP stake for €1.7 billion in the second quarter of fiscal 2011, subsequently reduced by €0.7 billion in the third quarter of fiscal 2011 due to the arbitration decision mentioned earlier, and the sale of our 49% minority stake in KMW. Cash

1 A. To our Shareholders 21 B. Corporate Governance 49 C. Combined Management Report
50 C.1 Business and economic environment 64 C.2 Financial performance measures 69 C.3 Results of operations 82 C.4 Financial position 93 C.5 Net assets position
95 C.6 Overall assessment of the economic position 96 C.7 Subsequent events 97 C.8 Sustainability 111 C.9 Report on expected developments and
associated material opportunities and risks
86
inflows for the prior-year period also included higher proceeds from real estate disposals at SRE. Acquisitions, net of cash ac-quired, increased to €1.314 billion from €303 million in the pri-or-year period, comprising several acquisitions of entities within the Sectors to optimize our business portfolio, includ-ing in the current period the acquisition of the Connectors and Measurements Division of Expro Holdings UK 3 Ltd. in the En-ergy Sector as mentioned earlier. The aggregate consideration of this acquisition, net of cash acquired, amounted to €461 million. In the current period, cash outflows for the purchase of investments of €234 million included the second install-ment payment in connection with our equity investment in A2SEA A/S, a supplier of installation services for the construc-tion of offshore wind-farms. The equity investment is held by the Energy Sector. For comparison, purchase of investments of €724 million in the prior-year period included cash outflows re-lating mainly to €500 million in new equity, which we provid-ed to NSN in exchange for preferred shares in order to further strengthen NSN’s financial position and the first installment payment for our equity investment in A2SEA A/S.
Discontinued operations used net cash of €650 million in fiscal 2012, compared to net cash used of €1.305 billion in the prior-year period. These lower cash outflows related primarily to OSRAM, which a year earlier included payments related to the acquisition of Siteco. While both periods included cash out-flows of a mid triple-digit million € amount relating to Siemens IT Solutions and Services, these cash outflows were higher in fiscal 2011.
Free cash flow from continuing operations decreased year-over-year due primarily to cash flows from operating activities as discussed above.
On a sequential basis Free cash flow during fiscal 2012 and fis-cal 2011 developed as follows:
Free Cash FLow (in millions oF €) 1
Q4 12 4,343
Q3 12 918
Q2 12 500
Q1 12 (971)
Q4 11 3,462
Q3 11 1,028
Q2 11 393
Q1 11 1,035
1 Continuing operations.
Cash flows from financing activities – Continuing opera-tions used net cash of €3.591 billion in fiscal 2012, compared to net cash used of €7.062 billion in fiscal 2011. The decrease in net cash outflows in fiscal 2012 was due primarily to the pro-ceeds from the issuance of long-term debt of €5.113 billion, in-cluding the issuance of US$3.0 billion bonds with warrant units in February 2012 as well as the issuance of €1.4 billion and £1.0 billion in fixed-rate instruments in four tranches in September 2012. These cash inflows were partly offset by the repayment of long-term debt of €3.218 billion relating to the redemption of €1.55 billion in 5.25%-fixed-rate-instruments, €0.7 billion in floating rate assignable loans, US$0.5 billion in floating rate notes and US$0.75 billion in 5.5% notes. In fiscal 2012 we recorded also cash outflows of €1.721 billion relating to the repurchase of 23,202,500 treasury shares at a weighted average share price of €76.14. For comparison, the prior-year period included the redemption of €2.0 billion in 5.75% bonds, a payment of €1.0 billion related to the binding offer to pur-chase additional shares in order to increase our stake in our publicly listed Indian subsidiary Siemens Ltd. and higher cash outflows for financing discontinued operations. Both periods included cash outflows for dividends, which were €2.629 bil-lion (for fiscal 2011) in fiscal 2012 compared to €2.356 billion (for fiscal 2010) in fiscal 2011.
C.4.4 Capital resources and requirements
Our capital resources consist of a variety of short- and long-term financial instruments including, but not limited to, loans from financial institutions, commercial paper, notes and bonds as well as credit facilities. In addition to cash and cash equiva-lents and to available-for-sale financial assets, liquid resources consist of future cash flows from operating activities.
Our capital requirements include, among others, scheduled debt service, regular capital spending, ongoing cash require-ments from operating and SFS financing activities, including higher cash outflows related to the growth strategy of SFS, div-idend payments, pension plan funding, portfolio activities, and cash outflows in connection with restructuring measures.
Total debt comprises our Notes and bonds, Loans from banks, Obligations under finance leases and Other financial indebted-ness such as commercial paper. Total debt comprises Short-term debt and current maturities of long-term debt as well as Long-term debt, as stated on the Consolidated Statements of Financial Position. Total liquidity refers to the liquid financial assets we had available at the respective end of the reporting period to fund our business operations and pay for near-term obligations. Total liquidity comprises Cash and cash equiva-

135 D. Consolidated Financial Statements 239 E. Additional Information
130 C.11 Siemens AG (Discussion on basis of German Commercial Code)
134 C.12 Notes and forward-looking statements
129 C.10 Compensation Report, Corporate Governance statement pursuant to Section 289a of the German Commercial Code, Takeover-relevant information and explanatory report
87
lents as well as current Available-for-sale financial assets, as stated on the Consolidated Statements of Financial Position. Net debt results from total debt less total liquidity. Manage-ment uses the Net debt measure for internal corporate finance management, as well as for external communication with in-vestors, analysts and rating agencies, and accordingly we be-lieve that presentation of Net debt is useful for those con-cerned. Net debt should not, however, be considered in isola-tion or as an alternative to short-term debt and long-term debt as presented in accordance with IFRS. For further information about the usefulness and limitations of Net debt, see C.12
notes and Forward-Looking statements.
(in millions of €)
Year ended September 30,
2012 2011
Short-term debt and current maturities of long-term debt 3,826 3,660
Long-term debt 16,880 14,280
Total debt 20,707 17,940
Cash and cash equivalents (10,891) (12,468)
Available-for-sale financial assets (current) (524) (477)
Total liquidity (11,415) (12,945)
Net debt 1 9,292 4,995
1 We typically need a considerable portion of our cash and cash equivalents as well as current available-for-sale financial assets at any given time for purposes other than debt reduction. The deduction of these items from total debt in the calcula-tion of Net debt therefore should not be understood to mean that these items are available exclusively for debt reduction at any given time. Net debt comprises items as stated on d.3 ConsoLidated statements oF FinanCiaL position.
The changes in Net debt from fiscal 2011 to 2012 may also be presented as follows:
Commercial paper program – We have a US$9.0 billion (€7.0 billion) global multi-currency commercial paper program in place, which includes the ability to issue US$-denominated extendible notes. In fiscal 2012 we issued commercial paper in varying amounts to fund our ongoing short-term capital re-quirements. Our issuances of commercial paper typically have a maturity of less than 90 days. As of September 30, 2012, we had no commercial paper outstanding. All commercial paper issued in fiscal 2012 was completely repaid within the year.
Notes and bonds – We have a “program for the issuance of debt instruments” (debt issuance program, formerly called me-dium-term note program) of €15.0 billion in place which we update on a regular basis. The last update was made in May 2012. Under this program, we issued the following instru-ments:
> In September 2012, we issued €1.4 billion and £1.0 billion in fixed-rate instruments in four tranches comprising €400 million in 0.375% instruments due in September 2014, €1.0 billion in 1.50% instruments due in March 2020, £350 mil-lion in 2.75% instruments due in September 2025 and £650 million in 3.75% instruments due in September 2042.
> In February 2012, we issued US$400 million in floating rate notes (three months London Interbank Offered Rate + 1.40%) due in February 2019.
> In February 2009, we issued €4.0 billion in fixed-rate instru-ments in two tranches comprising €2.0 billion in 4.125% in-struments due in February 2013 and €2.0 billion in 5.125% instruments due in February 2017.
> In June 2008, we issued €3.4 billion in fixed-rate instru-ments in three tranches, comprising: €1.2 billion in 5.25% in-struments due in December 2011, which were redeemed at face value on their maturity date; €1.0 billion in 5.375% in-struments due in June 2014 and €1.2 billion in 5.625% instru-ments due in June 2018.
> In August 2008, we increased two tranches of the €3.4 bil-lion fixed-rate instruments by €750 million, including €350 million in 5.25% instruments due in December 2011, which were redeemed at face value on their maturity date and €400 million in 5.625% instruments due in June 2018.
> In March 2006, we issued US$1.0 billion in notes in two tranches comprising US$500 million in floating rate notes (three months London Interbank Offered Rate + 0.15%) due in March 2012, which were redeemed at face value on their maturity date and US$500 million in 5.625% notes due in March 2016.
The nominal amount outstanding under the debt issuance pro-gram was €9.9 billion as of September 30, 2012.
Changes in net debt (in millions oF €)
1 In fiscal 2012, net cash used in the build-up of operating net working capital included net cash used in inventories less advance payments received of €85 million, net cash provided by trade and other receivables of €157 million, net cash provided by trade payables of €197 million and net cash used in billings in excess of costs and in estimated earnings on incompleted contracts and related advances of €965 million.
2 Continuing operations.
3 Included in fiscal 2012 primarily cash outflows related to dividends paid of totaling €2.784 billion and to purchase of common stock of €1.721 billion.
4,995697
(7,693)
5,034
6,259 9,292
Net debt at September
30, 2011
Net cash used in the build-up of operating
net working capital 1
Income and other
changes in net cash
provided by operating activities
Total net cash provided by operating activities 2
Net cash used in
investing activities 2
Changes
in certain financing activities 3
Net debt at September
30, 2012

1 A. To our Shareholders 21 B. Corporate Governance 49 C. Combined Management Report
50 C.1 Business and economic environment 64 C.2 Financial performance measures 69 C.3 Results of operations 82 C.4 Financial position 93 C.5 Net assets position
95 C.6 Overall assessment of the economic position 96 C.7 Subsequent events 97 C.8 Sustainability 111 C.9 Report on expected developments and
associated material opportunities and risks
88
In February 2012, Siemens issued US$ bonds with warrant units in an aggregate principal amount of US$3.0 billion in two tranches. The bonds due in August 2017 have a volume of US$1.5 billion and a coupon of notional 1.05% per annum; the bonds due in August 2019 have a volume of US$1.5 billion and a coupon of notional 1.65% per annum. The exercise price of the warrants was fixed at 137.5% of the reference price. On that basis, the exercise price amounts to €104.0018 per share. At issuance, one warrant will entitle its holder to receive 1,806.1496 Siemens AG shares. The warrants result in option rights relating to a total of about 21.7 million Siemens AG shares. The equivalent amount of these bonds outstanding as of September 30, 2012 was €2.3 billion.
In September 2006, we issued a subordinated hybrid bond in two tranches, a euro tranche of €900 million in 5.25% notes and a British pound tranche of £750 million in 6.125% notes, both tranches with a final legal maturity in September 2066. The com-pany has a call option after ten years or thereafter. If the bond is not called, both tranches will become floating rate notes accord-ing to the conditions of the bond. The total nominal amount of our hybrid bond as of September 30, 2012 was €1.8 billion.
In August 2006, we issued notes totaling US$5.0 billion. These notes were issued in four tranches comprising: US$750 million in floating rate notes (three months London Interbank Offered Rate + 0.05%) due in August 2009, which were redeemed at face value at their maturity date; US$750 million in 5.5% notes due in February 2012, which were redeemed at face value on their maturity date; US$1.750 billion in 5.75% notes due in Oc-tober 2016 and US$1.750 billion in 6.125% notes due in August 2026. We may redeem, at any time, all or some of the fixed rate notes at the early redemption amount (call) according to the conditions of the notes. The nominal amount of these notes outstanding as of September 30, 2012 was €2.7 billion.
Assignable loans – In June 2008, we issued four tranches of assignable loans with an aggregate amount of €1.1 billion: €370 million in floating rate notes (six months European Inter-bank Offered Rate + 0.55%) and €113.5 million in 5.283% notes, both maturing in June 2013 and €283.5 million in floating rate notes (six months European Interbank Offered Rate + 0.7%) and €333 million in 5.435% notes, both maturing in June 2015.
Both floating rate tranches were called in August 2011 and re-deemed in December 2011 at face value.
Credit facilities – We have three credit facilities at our dispos-al for general corporate purposes. Our credit facilities as of September 30, 2012, consisted of €7.5 billion in committed lines of credit. These facilities included:
> a €4.0 billion undrawn syndicated multi-currency revolving credit facility provided by a syndicate of international banks with a 5 year tenor and two one-year extension options, which was signed in April 2012. It replaced a US$5.0 billion syndicated multi-currency revolving credit facility, which ex-pired in March 2012;
> a €450 million bilateral undrawn revolving credit facility pro-vided by a domestic bank expired in September 2012. This credit facility has been extended to September 2013;
> a US$4.0 billion syndicated multi-currency credit facility ex-piring August 2013 provided by a syndicate of international banks. This facility comprised a US$1.0 billion (€0.8 billion) term loan which was drawn in January 2007 and is due in August 2013 as well as an undrawn US$3.0 billion (€2.3 bil-lion) revolving tranche.
As of September 30, 2012, €6.8 billion of these lines of credit remained unused.
The maturity profile of the loans, notes and bonds described above is presented below:
As mentioned above Siemens AG maintains two lines of credit of €4 billion and of US$4 billion, respectively. These two lines of credit provide its lenders with a right of termination in the event that (1) Siemens AG becomes a subsidiary of another company or (2) a person or a group of persons acting in con-cert acquires control over Siemens AG by being able to exer-cise decisive influence over its activities (Art. 3 (2) of Council Regulation (EC) 139/2004). In addition, Siemens AG has a bilat-eral credit line at its disposal in the amount of €450 million as mentioned above which may be terminated by the lender if major changes in Siemens AG’s corporate legal situation occur that jeopardize the orderly repayment of the credit.
Loans, notes and bonds maturity proFiLe (nominal amounts outstanding in billions oF €)
1 The maturity of the hybrid bond depends on the exercise of a call option: the bond is callable by us in September 2016 and thereafter, with a final legal maturity ending in September 2066.
2 We may redeem, at any time, all or some of US$-notes, issued in August 2006, at the early redemption amount (call) according to the conditions of the notes.
2013 2014 2015 2016 2017 2018 2019 2020 2025 2026 2042 2066
2.9
1.4
0.30.4
1.81
2.21
4.52
1.6 1.51.0
0.4
1.40.8
1.81

135 D. Consolidated Financial Statements 239 E. Additional Information
130 C.11 Siemens AG (Discussion on basis of German Commercial Code)
134 C.12 Notes and forward-looking statements
129 C.10 Compensation Report, Corporate Governance statement pursuant to Section 289a of the German Commercial Code, Takeover-relevant information and explanatory report
89
None of our credit facilities contains a material adverse change provision of the type often found in facilities of such nature and none of our global commercial paper and debt issuance programs nor our credit facilities contain specific financial cov-enants such as rating triggers or interest coverage, leverage or capitalization ratios that could trigger remedies, such as accel-eration of repayment or additional collateral.
Further information about our bonds and the other compo-nents of our debt as well as about the use of financial instru-ments for hedging purposes is provided in notes 22 and 31
in d.6 notes to ConsoLidated FinanCiaL statements.
Investing activities in intangible assets and property, plant and equipment – Additions to intangible assets and property, plant and equipment from continuing operations in-creased from €2.163 billion in the prior year to €2.206 billion in fiscal 2012. The majority of the additions, €1.619 billion, took place in the Sectors. The remaining portion, €587 million relat-ed mainly to SRE associated with SRE’s responsibility for uni-form and comprehensive management of real estate of our company worldwide.
We directed significant portions of our additions to intangible as-sets and property, plant and equipment in fiscal 2012 to expand capacities in strategic growth markets, particularly including emerging markets; to safeguard or enhance market share; and to secure leadership or competitiveness in technology-driven growth markets. Energy ’s additions totaled €532 million. They included extension of capacities and facilities such as for the technology-driven wind power market, particularly in Europe, as well as improvement and expansion of market presence in Brazil, Russia, India and China (BRIC countries) at Power Trans-mission. Considerable amounts at Energy were also used at Fos-sil Power Generation, including for the rationalization of pro-duction processes with regard to technical equipment and ma-chines. Healthcare additions totaled €354 million in fiscal 2012, including additions to intangibles such as licenses as well as developing and implementing software and IT solutions, main-ly relating to the medical imaging, therapy systems and labora-tory diagnostics businesses. Industry spent a large portion of its additions to intangible assets and property, plant and equip-ment of €442 million for the replacement of products and ramp-ing up capacities, particularly at Industry Automation in China, and implementing additional productivity measures, particular-ly at Drive Technologies. Infrastructure & Cities spent the largest amount of its additions of €290 million at the Power Grid Solu-tions & Products business, mainly for investments in innovations at Low and Medium Voltage. The Sector also invested signifi-cant amounts for strengthening its regional footprint in emerg-ing markets and its position in fast-growing market segments.
The changes of additions to intangible assets and property, plant and equipment from fiscal 2011 to 2012 are as follows:
For continuing operations the ratio of the items Additions to intangibles assets and property, plant and equipment and Ad-ditions to assets held for rental in operating leases to deprecia-tion and impairments of property, plant and equipment, net of reversals of impairments as well as amortization and impair-ments, net of reversals of impairments, of intangible assets other than goodwill was 94% for fiscal 2012.
Dividend – At the Annual Shareholders’ Meeting scheduled for January 23, 2013, the Managing Board, in agreement with the Supervisory Board, will submit the following proposal to allo-cate the unappropriated net income of Siemens AG for the fis-cal year ended September 30, 2012: distribution of a dividend of €3.00 on each no-par value share entitled to the dividend for fiscal year 2012 existing at the date of the Annual Shareholders’ Meeting, which in the aggregate amounts to an at present ex-pected total distribution of approximately €2.5 billion.
Other capital requirements – As expected, the current fiscal year included significant cash outflows relating to the divest-ment of Siemens IT Solutions and Services in fiscal 2011. We expect that this divestment will occasion further significant cash outflows in future periods that might reach a remaining mid triple-digit million € amount in total.
additions to intangibLe assets and property, pLant and equipment (in millions oF €)
Siemens (continuing operations)
FY 2012 2,206
FY 2011 2,163
Energy Sector
FY 2012 532
FY 2011 587
Healthcare Sector
FY 2012 354
FY 2011 284
Industry Sector
FY 2012 442
FY 2011 451
Infrastructure & Cities Sector
FY 2012 290
FY 2011 264
(2)%
10%
25%
(9)%
2%

1 A. To our Shareholders 21 B. Corporate Governance 49 C. Combined Management Report
50 C.1 Business and economic environment 64 C.2 Financial performance measures 69 C.3 Results of operations 82 C.4 Financial position 93 C.5 Net assets position
95 C.6 Overall assessment of the economic position 96 C.7 Subsequent events 97 C.8 Sustainability 111 C.9 Report on expected developments and
associated material opportunities and risks
90
As mentioned earlier, Siemens announced in August 2012 that it would adjust its capital structure through share buybacks amounting to up to €3 billion by December 30, 2012. In fiscal 2012 we recorded cash outflows of €1.721 billion relating to the repurchase of 23,202,500 treasury shares at a weighted aver-age share price of €76.14. After the end of the fiscal 2012 we re-corded additional cash outflows of €1.2 billion relating to the share buyback program.
Other capital requirements also include expected significant cash outflows in coming quarters relating to charges for pro-gram-related productivity measures in Sectors in connection with “Siemens 2014,” a company-wide program supporting our One Siemens framework for sustainable value creation.
With our ability to generate positive operating cash flows, our total liquidity of €11.415 billion and our €6.8 billion in undrawn lines of credit and given our credit ratings at year-end we be-lieve that we have sufficient flexibility to fund our capital re-quirements including scheduled debt service, regular capital spending, ongoing cash requirements from operating and SFS financing activities, dividend payments, pension plan funding and portfolio activities. Also in our opinion, our working capi-tal is sufficient for the Company ’s present requirements.
C.4.4.1 ContraCtuaL obLigations In the ordinary course of business, Siemens’ primary contrac-tual obligations regarding cash relate to debt, purchase obliga-tions and operating leases.
The following table summarizes our contractual obligations as of September 30, 2012 that will result in future cash outflows:
payments due by period
Total Less than 1 year
1 – 3 years
4 – 5 years
After 5 years(in millions of €)
Debt 20,707 3,826 1,940 7,325 7,615
Purchase obligations 20,519 14,097 3,256 1,650 1,515
Operating leases 3,167 812 1,043 543 770
Total contractual obligations 44,392 18,735 6,239 9,519 9,899
Debt – As of September 30, 2012, Siemens had €20.707 billion of short- and long-term debt, of which €3.826 billion will be-come due within the next twelve months. Short-term debt in-cludes current maturities of long-term debt, as well as loans from banks coming due within the next twelve months. Fur-ther information about the components of debt is given in
note 22 in d.6 notes to ConsoLidated FinanCiaL statements.
Debt for Siemens as of September 30, 2012 consisted of the following:
(in millions of €) Short-term Long-term Total
Notes and bonds 2,018 16,194 18,212
Loans from banks 1,505 449 1,954
Other financial indebtedness 270 110 380
Obligations under finance leases 33 128 161
Total debt 3,826 16,880 20,707
Purchase obligations – Purchase obligations include agree-ments to purchase goods or services that are enforceable and legally binding and which specify all of the following items: (1) fixed or minimum quantities, (2) fixed, minimum or variable price provisions and (3) approximate timing of the transaction. As of September 30, 2012, Siemens had €20.519 billion in pur-chase obligations. These purchase obligations primarily relat-ed to agreements of our Sectors on the purchase of goods such as property plant and equipment, intangible assets, raw mate-rials and supplies or to the purchase of services such as advertis-ing or maintenance. These purchase obligations have not been recognized as liabilities or expenses as of September 30, 2012.
In December 2010, Siemens and AtoS signed an option agree-ment (written call option) which granted AtoS the right to ac-quire Siemens IT Solutions and Services. Closing of the trans-action was on July 1, 2011. Related to the transaction is a sev-en-year outsourcing contract worth around €5.5 billion, under which AtoS will provide managed services and system integra-tion to Siemens. The expected remaining cash outflows from the outsourcing contract are included in these purchase obli-gations. For further information on that transaction see
note 4 in d.6 notes to ConsoLidated FinanCiaL statements.
Operating leases – As of September 30, 2012, Siemens had a total of €3.167 billion in total future payment obligations under non-cancelable operating leases, mainly relating to SRE activities.
Other – Siemens is subject to asset retirement obligations related to certain items of property, plant and equipment. Such asset retirement obligations are primarily attributable to envi-ronmental clean-up costs related to remediation and environ-mental protection, which amounted to €1.224 billion as of September 30, 2012, and costs primarily associated with the re-moval of leasehold improvements at the end of the lease term of €58 million as of September 30, 2012. The environmental clean-up costs related to remediation and environmental

135 D. Consolidated Financial Statements 239 E. Additional Information
130 C.11 Siemens AG (Discussion on basis of German Commercial Code)
134 C.12 Notes and forward-looking statements
129 C.10 Compensation Report, Corporate Governance statement pursuant to Section 289a of the German Commercial Code, Takeover-relevant information and explanatory report
91
protection liabilities have been accrued based on the estimat-ed costs of decommissioning facilities for the production of uranium and mixed-oxide fuel elements in Hanau, Germany (Hanau facilities), as well as a nuclear research and service center in Karlstein, Germany (Karlstein facilities). For addition-al information with respect to asset retirement obligations, see
note 24 in d.6 notes to ConsoLidated FinanCiaL statements.
Our liquidity may be adversely affected in future periods by regular or special contributions to fund our pension plans and similar commitments. As of September 30, 2012, our liability for pension plans and similar commitments as recognized in the Consolidated Statements of Financial Positions amounted to €9.926 billion. However, the recognized liability may fluctu-ate significantly in future periods due to changes in assump-tions, in particular the discount rate, rate of future compensa-tion increases and pension progression. Actual developments may differ from assumptions due to changing market, eco-nomic and governmental regulatory conditions, thereby re-sulting in an increase or decrease of the liability. Employer contributions expected to be paid to the funded pension plans during fiscal 2013 are €625 million, including contributions due to contractual and legal obligations of approximately €0.3 billion. Additional contributions to our pension benefit plans may be made or contractually agreed at the discretion of our management after the end of the reporting period. In fiscal 2009, Siemens reached an agreement with the trustees of cer-tain pension plans in the U.K., which may lead to contractually agreed contributions of up to approximately €0.8 billion in com-ing years. For additional information regarding contributions to the fund our pension plans and similar commitments see
note 23 in d.6 notes to ConsoLidated FinanCiaL statements.
For further information with respect to contractual obligations see note 32 in d.6 notes to ConsoLidated FinanCiaL statements.
C.4.4.2 oFF-baLanCe sheet arrangements Guarantees – Siemens guarantees are principally credit guar-antees and guarantees of third-party performance. As of Sep-tember 30, 2012, the undiscounted maximum amount of poten-tial future payments for guarantees was €8.205 billion, includ-ing guarantees relating to discontinued operations. Credit guar-antees cover the financial obligations of third-parties in cases where Siemens is the vendor and / or contractual partner. In ad-dition, Siemens provides credit guarantees generally as credit-line guarantees with variable utilization to joint ventures and associated and other companies accounted for using the equity method. Total credit guarantees were €635 million as of Sep-tember 30, 2012. Furthermore, Siemens issues guarantees of third-party performance, which include performance bonds and guarantees of advanced payments in cases where Siemens
is the general or subsidiary partner in a consortium. In the event of non-fulfillment of contractual obligations by the con-sortium partner(s), Siemens will be required to pay up to an agreed-upon maximum amount. Guarantees of third-party per-formance amounted to €1.566 billion as of September 30, 2012.
In fiscal 2007, The Federal Republic of Germany commissioned a consortium consisting of Siemens and IBM Deutschland GmbH (IBM) to modernize and operate the non-military information and communications technology of the German Federal Armed Forces (Bundeswehr). This project is called HERKULES. A proj-ect company, BWI Informationstechnik GmbH (BWI), will pro-vide the services required by the terms of the contract. Siemens is a shareholder in the project company. The total contract value amounts to a maximum of approximately €6 bil-lion. In connection with the consortium and execution of the contract between BWI and the Federal Republic of Germany in December 2006, Siemens issued several guarantees legally and economically connected to each other in favor of the Fed-eral Republic of Germany and of the consortium member IBM. The guarantees ensure that BWI has sufficient resources to provide the required services and to fulfill its contractual obli-gations. Total future payments potentially required by Siemens amounted to €2.29 billion as of September 30, 2012 and will be reduced by approximately €400 million per year over the re-maining five-year contract period as of September 30, 2012. Yearly payments under these guarantees are limited to €400 million plus, if applicable, a maximum of €90 million in un-used guarantees carried forward from the prior year.
Other guarantees amounted to €3.714 billion as of September 30, 2012 and included indemnifications issued in connection with dispositions of business entities. Such indemnifications, if customary to the relevant transactions, may protect the buy-er from potential tax, legal and other risks in conjunction with the purchased business entity. Indemnifications primarily re-late to NSN, disposed of in fiscal 2007, EN, disposed of in fiscal 2008, and to Siemens IT Solutions and Services, disposed of in fiscal 2011. In the event that it becomes probable that Siemens will be required to satisfy these guarantees, provisions are es-tablished. Such provisions are established in addition to the liabilities recognized for the non-contingent component of the guarantees.
Capital commitments – As of September 30, 2012, the Com-pany had commitments to make capital contributions to vari-ous companies of €211 million.
For additional information with respect to guarantees and our other commitments, see note 28 in d.6 notes to ConsoLidated
FinanCiaL statements.

1 A. To our Shareholders 21 B. Corporate Governance 49 C. Combined Management Report
50 C.1 Business and economic environment 64 C.2 Financial performance measures 69 C.3 Results of operations 82 C.4 Financial position 93 C.5 Net assets position
95 C.6 Overall assessment of the economic position 96 C.7 Subsequent events 97 C.8 Sustainability 111 C.9 Report on expected developments and
associated material opportunities and risks
92
C.4.4.3 Funding oF pension pLans and simiLar CommitmentsAs of September 30, 2012, the combined funded status of Siemens’ pension plans showed an underfunding of €9.0 bil-lion, compared to an underfunding of €6.2 billion as of Sep-tember 30, 2011. A significant increase in Siemens’ defined benefit obligation (DBO) was only partly offset by an increase in the fair value of Siemens’ funded pension plan assets.
The DBO of Siemens’ pension plans, which takes into account future compensation and pension increases, amounted to €33.0 billion on September 30, 2012, an increase of €5.9 billion from the DBO at the end of the prior fiscal year. The DBO in-creased primarily due to a decrease in the discount rate for do-mestic pension plans and almost all our foreign pension plans.
The fair value of Siemens’ funded pension plan assets as of September 30, 2012, was €24.1 billion, compared to €21.0 bil-lion at the end of the prior fiscal year. The increase was mainly due to the actual return on plan assets, which for fiscal 2012 amounted to €3.2 billion, resulting from both fixed income and equity investments. This represents a 15.6% actual return. For comparison, the expected return recognized through profit or loss for fiscal 2012 amounted to €1.3 billion, which corresponds to 6.3%.
Funded status oF siemens’ pension pLans (in billions oF €)1
September 30, 2012 (9.0)
September 30, 2011 (6.2)
1 Continuing operations.
The funding policy for our pension plans is part of our overall commitment to sound financial management, which also in-cludes ongoing analysis of the structure of its pension liabili-ties. To balance return and risk, we have developed a pension benefit risk management concept. We have identified that the prime risk is a decline in the plans’ funded status as a result of the adverse development of plan assets and / or defined benefit obligations. The prime risk quantifies the expected maximum decline in the plans’ funded status for a given confidence level over a given time horizon. We monitor our investments and our
defined benefit obligations in order to measure such prime risk. A risk budget on the Group level forms the basis for determining of our investment strategy, i.e. the strategic allocation of plan assets among asset classes and the degree of hedging for inter-est rate risk. We regularly review both our risk budget and in-vestment strategy with external experts from the international asset management and insurance industry to afford an integrat-ed view of pension assets and pension liabilities. We select asset managers based on our quantitative and qualitative analysis, and then continually monitor their performance and risk both on a stand-alone basis, and in the broader portfolio context. We review the asset allocation of each plan in light of the duration of the related pension liabilities and analyze trends and events that may adversely affect asset values, so that we can initiate appropriate countermeasures at a very early stage.
We also regularly review the design of our pension plans. His-torically, the majority of our pension plans have included sig-nificant defined benefits. However, in order to reduce exposure to certain risks associated with defined benefit plans, such as longevity, inflation, effects of compensation increases and oth-er factors, we implemented new pension plans during the last several years in some of our important regional companies in-cluding those for Germany, the U.S. and the U.K. The benefits of these new plans are based predominantly on the contribu-tions we make. They are still affected by longevity, inflation ad-justments and compensation increases, but only to a minor ex-tent. We expect to continue evaluating the need to implement similar plan designs in coming years, to better control future benefit obligations and related costs.
The combined funded status of Siemens’ predominantly un-funded other post-employment benefit plans amounted to an underfunding of €0.7 billion as of September 30, 2012, com-pared to an underfunding of €0.8 billion at the end of the prior fiscal year. The underfunding decreased mainly due to a plan change of the main health care plan in the U.S. The group in-surance program for a defined group of Siemens retirees is re-placed by individual healthcare agreements between the af-fected beneficiaries and healthcare insurance providers, result-ing in a one-time reduction of current and future contributions.
For more information on Siemens’ pension plans, see note 23
in d.6 notes to ConsoLidated FinanCiaL statements.

135 D. Consolidated Financial Statements 239 E. Additional Information
130 C.11 Siemens AG (Discussion on basis of German Commercial Code)
134 C.12 Notes and forward-looking statements
129 C.10 Compensation Report, Corporate Governance statement pursuant to Section 289a of the German Commercial Code, Takeover-relevant information and explanatory report
93
During fiscal 2012, total assets increased to €108.282 billion, up from €104.243 billion the year before. Our total assets in fiscal 2012 were influenced by positive currency translation effects of €2.644 billion due mainly to the US$. Within total assets of €108.282 billion, total assets related to SFS increased to €17.405 billion as of September 30, 2012 from €14.602 billion a year ear-lier, driven by the growth strategy at SFS. These amounts re-presented 16% of Siemens’ total assets in fiscal 2012, compared to 14% in the prior year. Total current assets were 48% in fiscal 2012, compared to 50% in the prior year.
The following table shows current assets at the respective balance sheet dates:
(in millions of €)
Year ended September 30,
2012 2011
Cash and cash equivalents 10,891 12,468
Available-for-sale financial assets 524 477
Trade and other receivables 15,220 14,847
Other current financial assets 2,901 2,628
Inventories 15,679 15,143
Income tax receivables 836 798
Other current assets 1,277 1,264
Assets classified as held for disposal 4,800 4,917
Total current assets 52,129 52,542
Cash and cash equivalents totaled €10.891 billion as of Septem-ber 30, 2012. The decrease of €1.577 billion from the prior-year level was mainly due to net cash provided by operating activi-ties of €6.972 billion, more than offset by net cash used in in-vesting activities of €5.685 billion and net cash used in financ-ing activities of €2.916 billion in fiscal 2012. For detailed infor-mation, see C.4.3 Cash FLows.
The growth strategy at SFS was the primary factor in the in-crease year-over-year of €373 million in the line item Trade and other receivables and the increase of €273 million in the line item Other current financial assets.
The increase of €536 million year-over-year in the line item Inventories was due primarily to higher inventories in Total Sectors. This factor was most notable in the Energy Sector driv-en by higher finished goods and products held for resale and in the Infrastructure & Cities Sector driven by an increase in costs and earnings in excess of billings on uncompleted contracts.
Assets classified as held for disposal decreased to €4.800 bil-lion as of September 30, 2012 compared to €4.917 billion a year
earlier. The decline year-over-year was due primarily to lower assets at OSRAM and the sale of our 25% interest in OAO Power Machines partly offset by an increase in assets relating to the solar business, which was classified as discontinued opera-tions during the fourth quarter of fiscal 2012.
Long-term assets at the respective balance sheet dates were as follows:
(in millions of €)
Year ended September 30,
2012 2011
Goodwill 17,069 15,706
Other intangible assets 4,595 4,444
Property, plant and equipment 10,763 10,477
Investments accounted for using the equity method 4,436 4,966
Other financial assets 14,666 12,126
Deferred tax assets 3,777 3,206
Other assets 846 776
Total long-term assets 56,153 51,701
Goodwill increased to €17.069 billion as of September 30, 2012 compared to €15.706 billion a year earlier. The increase in goodwill was due mainly to acquisitions and purchase ac-counting adjustments and to a lesser extent to currency trans-lation differences. Acquisitions and purchase accounting ad-justments included the acquisition of the Connectors and Measurements Division of Expro Holdings UK 3 Ltd in the Energy Sector, RuggedCom Inc. in the Industry Sector, the NEM B.V. business in the Energy Sector and eMeter Corpora-tion in the Infrastructure & Cities Sector.
For information on additions to other intangible assets and property, plant and equipment see C.4.4 CapitaL resourCes
and requirements.
Investments accounted for using the equity method decreased year-over-year by €530 million. The main factor was a sharply higher equity investment loss related to our share in NSN year-over-year.
The line item Other financial assets increased to €14.666 bil-lion as of September 30, 2012 compared to €12.126 billion a year earlier. The change was due primarily to higher loan re-ceivables driven by the growth strategy at SFS, an increase in the non-current portion of the fair market values of financial derivatives used for our hedging activities and an increase in the market value of our shares in AtoS.
C.5 net assets Position

1 A. To our Shareholders 21 B. Corporate Governance 49 C. Combined Management Report
50 C.1 Business and economic environment 64 C.2 Financial performance measures 69 C.3 Results of operations 82 C.4 Financial position 93 C.5 Net assets position
95 C.6 Overall assessment of the economic position 96 C.7 Subsequent events 97 C.8 Sustainability 111 C.9 Report on expected developments and
associated material opportunities and risks
94
The table below shows our current and long-term liabilities at the respective balance sheet dates:
(in millions of €)
Year ended September 30,
2012 2011
Short-term debt and current maturities of long-term debt 3,826 3,660
Trade payables 8,036 7,677
Other current financial liabilities 1,460 2,247
Current provisions 4,750 5,168
Income tax payables 2,204 2,032
Other current liabilities 20,306 21,020
Liabilities associated with assets classified as held for disposal 2,054 1,756
Total current liabilities 42,637 43,560
Long-term debt 16,880 14,280
Pension plans and similar commitments 9,926 7,307
Deferred tax liabilities 494 595
Provisions 3,908 3,654
Other financial liabilities 1,083 824
Other liabilities 2,052 1,867
Total long-term liabilities 34,344 28,527
Short-term debt and current maturities of long-term debt in-creased by €166 million compared to the end of the prior fiscal year. The main factor of the increase were the reclassifications of €2.0 billion in 4.125% instruments, due in February 2013, and of US$1.0 billion term loan, due in August 2013, which was largely offset by redemptions, including €1.55 billion in 5.25% fixed-rate instruments, €0.7 billion in floating-rate assignable loans, US$0.5 billion in floating-rate notes and US$0.75 billion in 5.5% notes.
Trade payables increased to €8.036 billion as of September 30, 2012 compared to €7.677 billion a year earlier. The main factor in the increase was higher trade payables in the Energy Sector.
The decrease in the line item Other current financial liabilities to €1.460 billion as of September 30, 2012 from €2.247 billion in the prior-year is due mainly to a decrease in the current portion of the fair market values of financial derivatives used for our hedging activities and a decrease in miscellaneous liabilities, including liabilities relating to purchase price ad justments as
well as purchase-price-related commitments in connection with the divestment of Siemens IT Solutions and Services.
Current provisions declined by €418 million compared to the prior year, which included substantial provisions related to particle therapy contracts in the Healthcare Sector and the divestment of Siemens IT Solutions and Services. Fiscal 2012 included an increase in provisions in the Energy Sector, pri-marily related to off-shore grid connection projects.
Other current liabilities decreased by €714 million compared to the prior year-end. The main factor was lower billings in ex-cess of costs and estimated earnings on uncompleted con-tracts and related advances particularly in the Energy Sector.
Liabilities associated with assets classified as held for disposal increased to €2.054 billion as of September 30, 2012 from €1.756 billion in the prior year. The change year-over-year was due primarily to higher liabilities at OSRAM and the solar busi-ness, following its classification as discontinued operations as mentioned above.
Long-term debt increased by €2.601 billion due mainly to the issuance of US$3.0 billion bonds with warrant units and the is-suance of €1.4 billion and £1.0 billion in fixed-rate instruments in four tranches. These issuances were partly offset by the above-mentioned reclassification in the line item Short-term debt and current maturities of long-term debt.
The line item Pension plans and similar commitments in-creased by €2.619 billion as of September 30, 2012, reflecting the increase in the underfunding of the funded status of Siemens’ pension plans as of September 30, 2012 to €9.0 bil-lion, compared to €6.2 billion a year earlier.
The increase in the line item Provisions of €254 million year-over-year related primarily to an increase in the Energy Sector including provisions arising from project charges mentioned above and to liabilities relating to our Hanau and Karlstein facilities, partly offset by a decrease in provisions related to the divestment of Siemens IT Solutions and Services.
The line item Other financial liabilities increased by €258 mil-lion year-over-year mainly related to an acquisition with a mi-nority shareholder, who was granted a put-option on the non-controlling interests.

135 D. Consolidated Financial Statements 239 E. Additional Information
130 C.11 Siemens AG (Discussion on basis of German Commercial Code)
134 C.12 Notes and forward-looking statements
129 C.10 Compensation Report, Corporate Governance statement pursuant to Section 289a of the German Commercial Code, Takeover-relevant information and explanatory report
95
Shareholders’ equity and total assets were as follows:
(in millions of €)
Year ended September 30,
2012 2011
Total equity attributable to shareholders of Siemens AG 30,733 31,530
Equity ratio 28% 30%
Non-controlling interests 569 626
Total assets 108,282 104,243
Total equity attributable to shareholders of Siemens AG de-creased from €31.530 billion at the end of fiscal 2011 to €30.733 billion at the end of fiscal 2012. In fiscal 2012, the main factors relating to the change in total equity attributable to sharehold-ers of Siemens AG were: (1) Dividend payments of €2.629 billion (paid for fiscal 2011); (2) cancellation of 33,203,421 treasury shares, which reduced common stock from 914 million shares to 881 million shares; (3) repurchase of 23,202,500 treasury shares at a weighted average share price of €76.14; (4) net income at-tributable to shareholders of Siemens AG of €4.458 billion.
The line item Total equity attributable to shareholders of Siemens AG decreased by €797 million and total assets in-creased by €4.039 billion year-over-year, and as a result our eq-uity ratio decreased to 28% as of September 30, 2012 compared to 30% in the prior-year.
For additional information on our net assets position, see d.6
notes to ConsoLidated FinanCiaL statements.
European sovereign credit exposures – Due to the recent uncertainties with regard to European sovereign debt expo-sures we regularly monitor our credit exposures in particular to public and private sector debtors in Italy, Spain, Greece, Portugal and Ireland. These credit exposures include trade receivables from the sale of goods and services, receivables from finance leases and other financial assets. To evaluate these exposures we perform a credit rating for public and private sector debtors using different methods subject to centrally defined limits. For exposures to public sector debtors, which represented approxi-mately a quarter of these exposures, we applied a specific poli-cy: This policy provides that the rating applied to individual public sector customers cannot be better than the weakest of the sovereign ratings provided by Moody ’s, S&P’s and Fitch for the respective country. Based on our ratings and our credit ex-posures to end customers or main contractors located in Italy, Spain, Greece, Portugal and Ireland, totaling a low single-digit billion € amount as of September 30, 2012, we believe that Siemens is well-positioned to bear these risks.
In fiscal 2012 we increased revenue by 7% year-over-year to €78.296 billion, with all four Sectors and all three reporting re-gions contributing to growth. New orders came in near the level of revenue but 10% lower compared to the prior year, which included substantially higher volumes from large orders in our Sectors Infrastructure & Cities and Energy. For example, orders a year earlier included Siemens’ largest-ever order for trains, worth €3.7 billion.
In fiscal 2012, we achieved income from continuing operations of €5.184 billion. While this was one of our highest results ev-er, it was substantially lower than in the prior year and lower than we expected one year ago. The decline was due mainly to our Energy Sector which took substantial charges mainly relat-ed to projects with a complex marine and regulatory environ-ment in the current period and benefited from the divestment of its share in Areva NP in the prior year. Due mainly to chal-lenges in these projects we reduced our income guidance dur-ing fiscal 2012. Furthermore, profit in Energy in fiscal 2012 was also burdened by profit impacts of €327 million (pretax) related to a change in credit risk assessment for Iran. Income from continuing operations in fiscal 2012 was also held back by a less favorable market environment in the second half of the fiscal year. This was particularly evident in the Industry Sector where profit came in 10% lower year-over-year. Profit at Infra-structure & Cities in fiscal 2012 also declined year-over-year, as the Sector took €86 million (pretax) in charges at a rolling stock project in Germany. In contrast, our Healthcare Sector in-creased profit year-over-year. For comparison, profit at Health-care in fiscal 2011 was burdened by charges related to particle therapy projects. In fiscal 2012, income from continuing opera-tions was also burdened by a sharply higher loss at Equity Investments. This was due primarily to our share in NSN. In fis-cal 2012, NSN took substantial restructuring charges in con-nection with its previously announced measures aimed at maintaining its long-term competitiveness and improving profitability.
Net income in fiscal 2012 was €4.590 billion, down from €6.321 billion a year earlier. This decline was due to lower income from continuing operations, only partly offset by lower losses from discontinued operations. In the prior year, discontinued operations were burdened by a substantial loss related to our former Siemens IT Solutions and Services business, partly off-set by income from discontinued operations related to OSRAM. Income from discontinued operations related to OSRAM turned negative in the current period.
As a result of the above-mentioned profit impacts, two of our Sectors, Energy and Infrastructure & Cities, missed their re-spective adjusted EBITDA target ranges in fiscal 2012.
C.6 overall assessment oF the eConomiC Position

1 A. To our Shareholders 21 B. Corporate Governance 49 C. Combined Management Report
50 C.1 Business and economic environment 64 C.2 Financial performance measures 69 C.3 Results of operations 82 C.4 Financial position 93 C.5 Net assets position
95 C.6 Overall assessment of the economic position 96 C.7 Subsequent events 97 C.8 Sustainability 111 C.9 Report on expected developments and
associated material opportunities and risks
96
We achieved our target for capital efficiency measured in terms of ROCE (adjusted) on a continuing basis, with a result of 17.0%, well within our target range of 15% to 20%. ROCE (ad-justed) on a continuing basis a year earlier was 25.3%, benefit-ing from the above-mentioned divestment at Energy.
Our Free cash flow from continuing operations declined to €4.790 billion, down 19% year-over-year. Free cash flow devel-opment was particularly influenced by lower income from con-tinuing operations. Additional factors included cash outflows in the current period related to project-related charges in Healthcare.
In the fourth quarter of fiscal 2012, we initiated a share buy-back program of up to €3.0 billion, to be financed partly by long-term debt, and issued bonds totaling €2.7 billion. These measures are aimed at taking advantage of favorable capital market conditions while reducing the gap to our capital struc-ture target. We have set this target, defined as the ratio of ad-justed industrial net debt to adjusted EBITDA, in the range of 0.5 to 1.0. In fiscal 2012, our capital structure was a positive 0.24 compared to a negative 0.14 in the prior fiscal year.
We believe that we achieved the goals we had announced in our Interim report for the third quarter of fiscal 2012. With re-gard to One Siemens, our framework for sustainable value creation, we believe that we did not fully succeed in our fun-damental goal of continuous improvement relative to our markets and competitors. We believe that Agenda 2013, an
initiative started by our Healthcare Sector at the beginning of fiscal 2012 is making a contribution to achieve these goals. We intend to expand these efforts on a company level. We therefore initiated “Siemens 2014”, a company-wide program aimed at improving our productivity. We defined action areas for cutting our costs, strengthening our portfolio and becom-ing faster and less bureaucratic. These goals apply company-wide, with specific implementation measures to be devel-oped by each Sector. While program-related productivity mea-sures will burden Total Sectors profit, particularly in fiscal 2013, we expect that the productivity gains realized will en-able us to achieve a Total Sectors profit margin of at least 12% by fiscal 2014.
In the fourth quarter of fiscal 2012 in connection with the “Siemens 2014” company program, we decided to divest our so-lar business, consisting of our solar thermal and photovoltaic activities, because they have not met our expectations with re-gard to a number of factors, including changed market condi-tions, lower growth and strong price pressure.
We intend to provide an attractive return to shareholders. We previously set a target range for our dividend payout percentage of 30% to 50% of Net income excluding selected exceptional non-cash effects. The Siemens Managing Board, in agreement with the Supervisory Board, proposes a dividend of €3.00 per share, unchanged from a year earlier. This proposal represents a dividend payout percentage of 56%, based on shares outstand-ing as of September 30, 2012.
After the end of fiscal 2012, Siemens announced the acquisi-tion of LMS International NV, Belgium, a leading provider of mechatronic simulation solutions. With the acquisition, which will be integrated in the Industry Sector’s Industry Automation Division, Siemens intends to expand and complement the Industry Sector’s product lifecycle management portfolio with mechatronic simulation and testing software. The purchase price amounts to approximately €680 million. The transaction is subject to approval by regulatory authorities. Closing is expect-ed in the second quarter of fiscal 2013.
C.7 subsequent events
Also after the end of fiscal 2012, Siemens announced that it plans to divest the business activities included in the Indus-try Sector’s Water Technologies Business Unit, which as of September 30, 2012 was part of the Industry Automation Division. The Business Unit’s offerings comprise solutions for municipal and industrial water purification and wastewater treatment.

135 D. Consolidated Financial Statements 239 E. Additional Information
130 C.11 Siemens AG (Discussion on basis of German Commercial Code)
134 C.12 Notes and forward-looking statements
129 C.10 Compensation Report, Corporate Governance statement pursuant to Section 289a of the German Commercial Code, Takeover-relevant information and explanatory report
97
C.8.1 Sustainability at Siemens
C.8.1.1 overviewSustainability is a guiding principle within our Company. Siemens has defined sustainability to mean acting responsibly on behalf of future generations to achieve economic, environ-mental and social progress. We are aware of the associated high standards and the possibility of conflicting goals. Never-theless, the aim to create sustainable added value remains a key element of our corporate strategy. We are convinced that sustainability, in this sense, is also a business opportunity, and one that is worth seizing. One Siemens, our framework for sustainable value creation and capital-efficient growth ad-dresses this business opportunity with its three strategic direc-tions: Focus on innovation-driven growth markets, Get closer to our customers and Use the power of Siemens.
The products and solutions in our Environmental Portfolio and the innovative power of Siemens play a central role in contrib-uting to environmental and climate protection while also strengthening our standing in these innovation-driven growth markets.
A close customer relationship based on trust and a competi-tive, globally balanced and localized network of suppliers sup-ports us in getting closer to our customers all over the world.
Excellent employees are one of Siemens‘ vital strengths as they play a key role in our success and are the true power of Siemens. Leveraging the power of Siemens also means strictly adhering to clear principles of integrity – something we also expect of our partners and suppliers.
C.8 sustainability
As all these examples clearly show, sustainability is not just embellishment at Siemens, it’s the central theme of our corpo-rate strategy. The following chapters will detail this under-standing and will provide further information on Sustainability at Siemens.
C.8.1.2 sustainabiLity management and organizationThe importance we attach to the topic of sustainability is also evident in our programs and measures we execute and in the central positioning within the Company ’s organization. In our Sustainability Program we focus targets and activities in three areas: Business opportunities, Walk the talk, and Stake-holder engagement. In the first area we turn our approach to sustainability into concrete business opportunities. Walk the talk means we are committed to embedding sustainability throughout our organization and operations. In the third area we focus on collaboration with all relevant stakeholders.
Efficient sustainability management is a company-wide task that requires a clear organizational structure and a thorough anchoring of sustainability in our corporate culture. All our sustainability activities are steered by the Chief Sustainability Officer, who is a member of our Managing Board. In order to coordinate and manage our sustainability activities efficiently, we established the Siemens Sustainability Board, the Sustain-ability Office and the Siemens Sustainability Advisory Board.
The Siemens Sustainability Board, which is chaired by the Chief Sustainability Officer, is the central steering committee for sustainability at Siemens. In its regular meetings, it sets our sustainability strategy and adopts appropriate measures and
siemens sustainabiLity board
Siemens Sustainability Board
Chief Sustainability Officer
Chief Compliance
Officer
CTO of Energy
(Energy)
CEO of Imaging & Therapy
Systems (Healthcare)
CEO of Customer Services
(Industry)
CEO of Low and Medium
Voltage (Infrastructure &
Cities)
CEO of Siemens
Financial Services
CEO of Cluster Brazil
Head of Corporate
Communications and Government
Affairs
Head of Corporate Strategies
Head of Corporate Human Resources – EMEA and Governance,
Processes
Head of Environmental
Protection, Health Management
and Safety
Head of Corporate
Technology – Research & Tech-
nology Center
Head of Corporate Finance –
Reporting and Controlling
Head of Corporate Legal and Compliance

1 A. To our Shareholders 21 B. Corporate Governance 49 C. Combined Management Report
50 C.1 Business and economic environment 64 C.2 Financial performance measures 69 C.3 Results of operations 82 C.4 Financial position 93 C.5 Net assets position
95 C.6 Overall assessment of the economic position 96 C.7 Subsequent events 97 C.8 Sustainability 111 C.9 Report on expected developments and
associated material opportunities and risks
98
initiatives. Our Chief Sustainability Officer also manages the Sustainability Office, which is responsible for implementing the sustainability strategy and for coordinating company-wide programs and measures.
To help us maintain an objective perspective on our sustainabil-ity challenges and performance, we have also created the Siemens Sustainability Advisory Board composed of nine em-inent figures in science and industry from a range of disciplines and regions of the world. None are employees of Siemens. The Board meets at least twice a year, and through professional ex-changes and concrete initiatives has already contributed to the further development of our sustainability program.
Furthermore, assigned Sustainability Managers in the Sectors and Clusters ensure that sustainability measures are imple-mented throughout the Company.
C.8.1.3 CoLLaborating For sustainabiLity and perFormanCe Our sustainability efforts are generally based on our Business Conduct Guidelines, which provide the ethical and legal frame-work within which we conduct our business activities. They contain the basic principles and rules for our conduct within our Company and in relation to our external partners and the general public. Specific issues, such as those relating to the environment, are covered in more detailed regulations and guidelines. This comprehensive set of rules is generally bind-ing for all companies controlled by Siemens.
Furthermore, we believe that close collaboration with stake-holders supports us in addressing complex, interlocking sus-tainability challenges and topics. Maintaining an intensive dia-logue with partners along the supply chain and with external stakeholder groups and organizations is important for us: Siemens is actively engaged with leading global sustainability organizations, such as the World Business Council for Sustain-able Development (WBCSD), and committed to international standards and guidelines for sustainability. For example, we signed on to the United Nations Global Compact in 2003 and became a signatory to the Global Compact’s CEO Water Man-date in 2008; since fiscal 2011, we are member of the steering committee of the Global Compact’s Caring for Climate initia-tive. We regularly report on our sustainability performance us-ing the current guidelines (G3.0) of the Global Reporting Initia-tive (GRI), which aim at high transparency and comparability for corporate sustainability reporting.
Siemens has been part of the widely respected Dow Jones Sustainability Index for thirteen consecutive years and is ranked as Sector Leader in 2012 for Diversified Industrials for the fifth time in a row and as Supersector Leader for Industrial
Goods and Services for the first time ever. We also earned high ratings on a number of other indexes and rankings, including those created by the prestigious Carbon Disclosure Project (CDP). Siemens was included in CDP’s Global 500 Carbon Dis-closure Leadership Index (CDLI) for the fifth time in a row with one of the top scores in the world.
C.8.2 Research and development
C.8.2.1 researCh and deveLopment organization and strategyIn fiscal 2012, we continued to focus on the following areas in research and development (R&D): (1) ensuring long-term future viability, (2) enhancing technological competitiveness, and (3) optimizing the allocation of R&D resources.
Our R&D activities are geared toward ensuring sustainable en-ergy supplies, which is essential to our long-term viability and competitiveness in the energy and infrastructure industries. Accordingly, major focus areas include:
> increasing the efficiency of both renewable and conventional power generation,
> improving low-loss power transmission, and > finding new solutions for intelligent power networks (smart grids), carbon dioxide separation in power plants, and ener-gy storage systems for volatile renewable energies.
Another major focus is promoting more efficient energy use in buildings, industrial facilities, and the transport sector – for example through the development of electric drives and faster charging stations for electric vehicles.
Across all focus areas, we recognize the vital importance of so-phisticated software solutions – not just for the areas men-tioned above but also in nearly all of the other fields in which Siemens is active. Siemens software was used, for example, to virtually develop, build, test, and continually optimize the Red Bull Formula 1 championship-winning car throughout the 2011 season. The same is true of the Mars rover “Curiosity,” which landed on the red planet in August 2012. Siemens software was used here to digitally design, assemble, and test a virtual rover before the first prototype was even constructed.
R&D activities are carried out by both our Sectors and our Cor-porate Technology (CT) department. The Sectors focus their R&D efforts on the next generations of their products and solu-tions. In contrast, the aim of CT is to be a strong innovation partner for operational units and to help secure our technology and innovation future while strengthening Siemens as an inte-grated technology company.

135 D. Consolidated Financial Statements 239 E. Additional Information
130 C.11 Siemens AG (Discussion on basis of German Commercial Code)
134 C.12 Notes and forward-looking statements
129 C.10 Compensation Report, Corporate Governance statement pursuant to Section 289a of the German Commercial Code, Takeover-relevant information and explanatory report
99
CT has more than 7,000 employees and is set up as a world-wide network with primary locations in Germany, the U.S., Austria, Russia, India, and China. Among CT’s employees, approx-imately 4,000 software engineers at locations in Asia, Europe and the Americas develop and implement software for new products and services for our Sectors. CT makes important contributions along the entire value chain, from research and development to production technology, manufacturing pro-cesses, and testing procedures.
The technology fields cover all technological areas of Siemens. They include research on materials that help make our prod-ucts more efficient and the creation of IT platforms, security solutions, software architecture, technical systems, energy technologies, sensors, and electronic components. CT also conducts research into new solutions for automation, medical information systems, and imaging processes. This portfolio is supplemented by innovation projects for electric mobility, sus-tainable urban development, and biotechnology – in other words, fields with major strategic importance for us. All of CT’s activities are chosen to optimize the allocation of R&D resourc-es, with a balance between support for the Sectors’ current of-ferings and development of longer-term opportunities.
CT also strategically handles the intellectual property of Siemens. Around 350 experts help the Company register pat-ents and trademarks, establish them, and put them to profit-able use. CT also acts as a coordinator and leader with regard to key strategic issues at Siemens, such as lean management and production, standardization, and project management.
Cooperations with universities and non-university research in-stitutes make an important contribution to Siemens’ capacity to innovate. The key goals of these partnerships are:
> tapping the potential for joint research and development projects,
> developing and extending the network of universities or research institutes with which Siemens works and increasing communication between Siemens and these universities or institutes, and
> strengthening the appeal of Siemens to highly qualified young people as a potential employer.
In addition, Siemens takes part in publicly funded research pro-grams. The most important research areas include the develop-ment of sustainable technologies, the networking of machines, and the creation of new materials and sustainable recycling.
C.8.2.2 researCh & deveLopment FiguresIn fiscal 2012, we recognized research and development ex-penses of €4.238 billion, compared to €3.899 billion in fiscal 2011 and €3.547 billion in fiscal 2010. The resulting R&D inten-sity, defined as the ratio of R&D expenses and revenue, of 5.4% was higher than in fiscal 2011 and fiscal 2010.
r&d intensity
Research and development expenses (in billions of €)
Research and de- velopment intensity 1
FY 2012 4.238 5.4%
FY 2011 3.899 5.3%
FY 2010 3.547 5.2%
1 R&D intensity is defined as the ratio of R&D expenses and revenue.
R&D expenses and intensities for the Sectors in fiscal 2012, 2011 and 2010 were as follows:
r&d expenses
(in millions of €) FY 2012 FY 2011 FY 2010
Energy 840 756 651
Healthcare 1,314 1,173 1,116
Industry 1,215 1,128 993
Infrastructure & Cities 699 696 591
r&d intensity
FY 2012 FY 2011 FY 2010
Energy 3.0% 3.1% 2.9%
Healthcare 9.6% 9.4% 9.0%
Industry 5.9% 5.8% 5.7%
Infrastructure & Cities 4.0% 4.1% 3.6%
Corporate Technology incurred additional R&D expenses.
r&d indiCators 1
(in thousands) FY 2012 FY 2011
Employees 2 29.5 27.7
Inventions 3 8.9 8.6
First patent applications 4 4.6 4.3
1 Continuing operations.
2 Average number of employees in fiscal year.
3 Number of inventions submitted by Business Units based on an internal reporting.
4 First filings as part of the inventions submitted to patent offices.

1 A. To our Shareholders 21 B. Corporate Governance 49 C. Combined Management Report
50 C.1 Business and economic environment 64 C.2 Financial performance measures 69 C.3 Results of operations 82 C.4 Financial position 93 C.5 Net assets position
95 C.6 Overall assessment of the economic position 96 C.7 Subsequent events 97 C.8 Sustainability 111 C.9 Report on expected developments and
associated material opportunities and risks
100
In our continuing operations, we had an average of approximate-ly 12,900 R&D employees in Germany and approximately 16,700 R&D employees in 30 countries outside of Germany during fiscal 2012, including the U.S., China, Austria, India, Slovakia, Switzer-land, the U.K., Croatia, Sweden, Denmark, Mexico, and France.
As of September 30, 2012, the Company held approximately 57,300 patents worldwide in its continuing operations, com-pared to approximately 53,300 patents as of September 30, 2011. In terms of the number of published patent applications in calendar year 2011, Siemens in total ranked third in Germany and – for the second consecutive year – first in Europe. In terms of the number of patents granted in the U.S., Siemens in total ranked tenth in calendar year 2011.
2011 2010 2009
Germany – German Patent and Trademark Office (DPMA) 3 3 3
Europe – European Patent Office (EPO) 1 1 2
U.S. – United States Patent and Trademark Office (US PTO) 10 9 13
C.8.2.3 researCh & deveLopment in the seCtorsOur R&D activities in the Energy Sector are focused on devel-oping processes for the efficient generation and transmission of electrical energy. Major R&D areas in this respect are the de-velopment of
> technologies for low-loss electricity transmission, > advanced gas turbines that increase the efficiency and reduce emissions of power plants,
> combined cycle power plants to increase the availability of electricity through higher flexibility,
> wind turbine innovations, > technologies that extract the greenhouse gas carbon dioxide from the flue gas that occurs during fossil fuel-fired power generation (carbon capture and storage), and
> a subsea power grid to extract deep-sea oil and natural gas drilling economically.
Examples of research and development at Energy include Type B75 rotor blades for wind turbines, each of which has a length of 75 meters; this makes them, to our knowledge, the longest rotor blades in operation in the world at the moment. At 25 tons, the B75 is also a lightweight, as it is 10% to 20% lighter than similar rotor blades. Heavy rotor blades are subjected to higher stress loads and also require more massive nacelles, towers, and foun-dations. Intelligent design and low weight therefore have a pos-itive effect on the cost of electricity produced.
In 2011, a combined cycle power generation island delivered by Siemens in Irsching, Germany, proved an unprecedented net efficiency rating of 60.75% at an output of 578 megawatts. An even more efficient combined cycle plant will soon be built in Düsseldorf. With an anticipated efficiency rating of more than 61% and a previously unattained district heating range, Siemens expects to set new records in both categories. The total capacity factor for natural gas as a fuel will reach around 85%.
High-voltage direct-current (HVDC) technology is now making it possible to transport electricity over great distances with min-imal losses. In 2009, Siemens put the first overhead HVDC line into operation with an unprecedented direct current capacity of 800,000 volts. Siemens recently successfully tested its first HVDC transformer technology with a voltage of 1.1 million volts. The higher the voltage carried by HVDC cables, the lower the transmission losses and the higher the transmission capacity.
R&D activities in our Healthcare Sector focus on meeting cus-tomer challenges from three major trends: the world’s popula-tion continues to grow rapidly and to get older. In addition, older people make up a higher percentage of the population. These trends put increasing pressure on healthcare providers to gather more accurate diagnostic information more effi-ciently about a wider range of potential disease conditions and to integrate that information more effectively with treat-ment options.
One focus area involves combining various imaging methods that provide increasingly detailed and faster three-dimensional insights into the body of a patient, while subjecting him or her to less discomfort. We combine such imaging processes with therapeutic measures, laboratory diagnostics, and information technology to create more coordinated workflows. One exam-ple is the world’s only fully integrated whole-body magnetic resonance (MR) and positron emission tomography (PET) sys-tem, Biograph mMR, which for the first time allows physicians to simultaneously see the position of organs within the body, their function, and their metabolism. In this way they can, for example, see the position of a tumor, identify its type, and ob-serve its activity.
Another focus area is automating clinical work processes and optimizing laboratory diagnostics, which puts physicians in a position to identify diseases even more precisely and at an earlier stage. Physicians are then able to tailor therapies more closely to a patient’s needs, by monitoring the effect of medications more accurately and exploiting the evaluation and analytical capabilities of modern computer technology. The Sector also develops products that meet the specific, tar-geted requirements of the healthcare systems of emerging countries.

135 D. Consolidated Financial Statements 239 E. Additional Information
130 C.11 Siemens AG (Discussion on basis of German Commercial Code)
134 C.12 Notes and forward-looking statements
129 C.10 Compensation Report, Corporate Governance statement pursuant to Section 289a of the German Commercial Code, Takeover-relevant information and explanatory report
101
Among the R&D priorities in the Industry Sector is the soft-ware-based integration of product planning and production processes within the framework of product lifecycle manage-ment. The objective is to accelerate processes at every point along the value chain, so that time to market can be reduced by as much as 50%. The further development of automation technology, and industrial IT and industry software in particu-lar, plays a major role here. This is especially true in the case of metal production, where the IT-supported planning and opera-tion of entire steel mills has significantly changed and will fur-ther influence manufacturing processes in the steel sector.
In addition, the Industry Sector also strives to achieve greater energy efficiency, reduce raw material consumption, and reduce emissions. These objectives also guide the development of tech-nology-based service concepts such as energy management and remote maintenance systems, and the creation of efficient solu-tions for steel production that also conserve resources.
R&D activities in our Infrastructure & Cities Sector focus on urban growth issues. Main research fields therefore cover sus-tainable technologies for major metropolitan areas and their infrastructures. The aims are to increase energy efficiency, re-duce burdens on the environment, and improve the overall economy and the quality of life in cities. To this end, the Sector develops building technologies that conserve energy, solu-tions for ensuring an efficient and secure supply of electricity in cities, and intelligent traffic and transport systems. Exam-ples here include the extremely light and almost fully recycla-ble Inspiro modular subway train, and the Desigo building management system, which integrates several system compo-nents within the buildings themselves, and which also leads to significant energy savings. In addition, researchers are look-ing for ways to integrate buildings into smart grids so as to al-low them to transfer the electricity they produce into the net-work and provide additional power during peak demand times. One innovative technology that can be used for this is SIESTORAGE – a modular storage unit that balances out the power generation fluctuations that are typical of electricity produced from renewable sources by stepping in to provide energy during brief power outages.
C.8.3 Supply chain management
Supply chain management at Siemens aims to contribute to the success of our businesses in a significant and sustainable way. The principal goal of our supply chain management activ-ities is to ensure the availability and quality of the materials we require to serve our customers.
In fiscal 2012, Siemens’ purchasing volume, i.e. external spend, amounted to approximately €40 billion which equals roughly half of our total revenue.
We focused on continuing to enhance our supply chain man-agement and strengthening Siemens’ competitiveness by achieving substantial savings. The main enablers for that were already part of the Supply Chain Management initiative that was successfully completed prior to fiscal 2012. In line with our strategic priorities, we further developed and continuously rolled out our enablers for leveraging saving potential. These enablers include
> Siemens-wide managed volume: We bundle more than half of our purchasing volume on the corporate level where it is managed by dedicated organizations for both direct and indirect material. For the direct material, we set up more than 20 category management teams and started more than 200 cross-functional commodity engineering projects aiming to bring down material cost together with our suppliers. The strategic and operational procurement for all indirect materi-al throughout Siemens has been brought together in a global organization. By integrating the former procurement offices for indirect material in the Sectors and regions, we achieve substantial economies of scale effects through worldwide bundling of volume and consolidation of resources.
> Sourcing from emerging markets: One essential element of moving towards a globally balanced supply chain network is to constantly increase the share of sourcing from emerg-ing markets (Global Value Sourcing countries, GVS). To ac-complish this goal, we identify, select and fully qualify sup-pliers from Global Value Sourcing countries, and engage them in a continuous development process thereafter. Addi-tionally, we encourage and support our suppliers to expand their operations in order to follow our manufacturing foot-print in Global Value Sourcing countries. In fiscal 2012 we further increased our GVS share on a comparable basis.
> E-sourcing: We significantly increased the share of external purchases that we award via electronic bidding over the last few years from low single digit levels to significantly more than 10%.
Sectorspecific material Pooled directed and indirect material
> 50% Siemens-wide managed
�40 billion

1 A. To our Shareholders 21 B. Corporate Governance 49 C. Combined Management Report
50 C.1 Business and economic environment 64 C.2 Financial performance measures 69 C.3 Results of operations 82 C.4 Financial position 93 C.5 Net assets position
95 C.6 Overall assessment of the economic position 96 C.7 Subsequent events 97 C.8 Sustainability 111 C.9 Report on expected developments and
associated material opportunities and risks
102
Strengthening Siemens’ innovation power by leveraging our supplier network is another strategic priority. With our Siemens Supplier Forum we have established a platform for the regular dialogue on CEO level with our top strategic suppliers, aiming to ensure long-term cost leadership, realize shared growth poten-tial and sustainably increase innovation capabilities. To promote outstanding suppliers for their excellence, we have introduced the Siemens Supplier Awards for a number of categories.
As in previous years, the supply chain management organiza-tion had to face external challenges in fiscal 2012. Although the strong pricing pressure in supplier markets declined com-pared to fiscal 2011, we see indications from the geopolitical environment that prices may increase again in the near future. Despite this possibility, we expect to maintain the procure-ment savings gains and overall productivity increases for Siemens that our supply chain management organization has achieved in recent years.
Another important topic for our supply chain management is sustainability in our supply chain. We require all of our suppli-ers to comply with the principles of our Code of Conduct for Siemens Suppliers and to support its implementation in their own supply chains as well. We also continued with worldwide on-site sustainability audits by external experts to ensure the compliance with our standards and to encourage sustainable business conduct throughout our entire global supply chain. In addition, we further rolled out our Siemens Energy Efficiency Program for suppliers. We work with our suppliers to conduct environmental and energy efficiency checks of their own facili-ties, so they can identify opportunities for reducing their con-sumption of energy and other resources. In this regard, we draw upon the expertise and know-how gained in connection with our own environmental program and our Environmental Portfolio. By the end of fiscal 2012, more than 900 of our sup-pliers worldwide have completed these comprehensive assess-ments and nearly 400 others are involved in the program.
C.8.4 Production
In-house production is an important cornerstone of our opera-tions. Siemens operates more than 290 major production and manufacturing plants in more than 40 countries worldwide, including facilities at certain joint ventures and associated companies. A major production and manufacturing plant is de-fined as a facility at Business Unit level in which raw or source materials are transformed into finished goods on a large scale by using equipment and production resources such as ma-chines, tools, energy and labor. Around 150 major production and manufacturing plants are located in the region Europe, C.I.S., Africa, Middle East; around 80 major production and
manufacturing plants are located in the region Americas and around 70 major production and manufacturing plants are lo-cated in the region Asia, Australia. With around 110 major pro-duction and manufacturing plants, the Energy Sector accounts for the greatest proportion of these, followed by the Infrastruc-ture & Cities Sector (around 80 major facilities), the Industry Sector (around 70 major facilities) and the Healthcare Sector (around 40 major facilities).
Key elements of our production strategy include sustained im-provement in the cost position for our products and solutions, and locating production sites geographically to support the de-velopment of new markets. China, for example, is one of our largest growth markets, and we have established our presence there with around 50 major production and manufacturing plants. One of the most significant features of our production activities is the diversity of products, volumes and processes: The spectrum of our products ranges from hearing aids to a 600-tonne steam turbine; production volume can be anything from a single customer-specific order to high-tech serial pro-duction; and production processes range from automated pro-duction in clean rooms to manual final assembly of major in-stallations on construction sites.
We designed the Siemens Production System (SPS) in our aim to continuously improve our global production processes. The SPS is our structured approach to designing and operating the production operations of Siemens in accordance with so-called “lean” principles. These principles aim to reduce or elim-inate activities in our business processes that add no customer value. This helps us satisfy the increasingly demanding re-quirements of our customers while streamlining our cost posi-tion and those of our customers compared with competitors.
With the implementation of lean principles in our production operations, we aim to simultaneously achieve both shorter lead times and higher quality in our processes, products and solu-tions. This enables us to react even more flexibly to our custom-ers’ demands and to increase our delivery reliability. By now, the SPS has already been established in more than 190 of our major production and manufacturing facilities worldwide.
It is our strategy to ensure that all of our production and man-ufacturing facilities apply lean principles and that these prin-ciples are also adopted by other functions such as administra-tion or engineering. For the latter purpose, we have widened the range of our lean expert qualifications by adding specif-ic training programs for employees engaged in adminis-tration. By the end of fiscal 2012, a total of more than 620 employees have joined (and in part already completed) lean expert qualification programs for production and / or adminis-tration.

135 D. Consolidated Financial Statements 239 E. Additional Information
130 C.11 Siemens AG (Discussion on basis of German Commercial Code)
134 C.12 Notes and forward-looking statements
129 C.10 Compensation Report, Corporate Governance statement pursuant to Section 289a of the German Commercial Code, Takeover-relevant information and explanatory report
103
C.8.5 Quality management
Outstanding quality in our products and solutions is a key suc-cess factor for our Company. We believe that Siemens is known for high quality in its business processes and customer proj-ects, which many customers consider essential in meeting their needs.
Our main objective in terms of quality is high customer satis-faction, which we measure using the Net Promoter Score, which is discussed in more detail below. Internal audits and assessments, together with regular benchmarking, help us en-sure the effectiveness and further development of our quality management. Our quality management system is designed to meet or exceed relevant recognized international standards.
We aim to maintain a strong culture of continuous improve-ment and high transparency. Transparency in this context means to measure quality and make it visible. To that end, we have developed a comprehensive quality approach throughout the Company to increase the quality of our products and pro-cesses. We have defined binding standards in the areas of quality responsibility, quality controlling, process quality and quality awareness for all Siemens units worldwide.
The quality management organization, with some 10,000 em-ployees in our continuing operations, is well established at all levels of our business and is operating actively for quality man-agement and quality assurance within our operational units. We believe that it is particularly important to ensure that qual-ity is measurable and transparent.
The quality of our products and processes depends strongly on the capabilities of our employees. Training on quality is there-fore an integral part of our corporate culture. Training opportu-nities are made available to all employees. This applies in partic-ular to quality managers who, as experts in their fields, must demonstrate expertise with the relevant quality tools. Profes-sional development options include web-based solutions, train-ing plans specific to particular target groups, and on-the-job training. We regularly expand the portfolio of our training cours-es to complement traditional areas of the Siemens Quality Man-agement approach such as quality management in projects, in-spections and audits, and quality tools. We develop training courses in cooperation with experienced internal personnel and experts from universities and partner institutions. This approach seeks to ensure effective transfer of expertise within the Compa-ny as well as to and from external specialists.
Product safety is an essential aspect of product quality and an element of technical compliance. For this reason, product safe-ty is also a strategic objective of the entire value-added pro-
cess. Safe product design encompasses the safety of all prod-ucts and services developed, manufactured and sold by Siemens. It involves and defines requirements for just about every function in the Company and addresses the entire lifecy-cle from development, production and maintenance / repair to enhancement / modification until final disposal. Accordingly, we consider legal requirements and relevant standards as well as the current state of science and technology.
C.8.6 Distribution and customer relations
Our Sectors, Divisions and Business Units, and SFS have global responsibility for their business, sales and results. They are able to support customers around the world directly from their respective headquarters, especially for large contracts and projects. However, most of our customers are small and medi-um-sized companies and organizations that require local sup-port. To address local business opportunities with them, we are able to draw upon a large global sales force steered by our regional companies. They are responsible for the distribution of the Siemens portfolio across our Sectors and Divisions in their respective countries. This keeps us close to our custom-ers and positions us to offer fast and customizable solutions to their business needs. We are currently present in around 190 countries. Because of our long-lasting local presence we are often perceived as local citizens. Taking the fast-growing BRIC countries as an example, we founded our first subsidiary in Russia in 1855, opened our first permanent office in China in 1904, founded our Brazilian subsidiary Siemens do Brasil in 1905 and our first Indian subsidiary in 1924.
Sustainable customer relationships are the basis for our long-term success. We employ a structured key account manage-ment approach throughout the Company to take care of our key customers. This means that we seek to tailor our products and solutions to their size and regional site structures, and we aim to ensure that our key account managers continually de-velop and maintain relationships with them over the long term. This approach is supplemented by our Executive Rela-tionship Program, in which all members of the Company ’s Managing Board stay in direct contact with selected customers and maintain an ongoing dialogue with them to familiarize Siemens with their needs.
Our business success is strongly dependent on the satisfaction of our customers. For this reason, we measure customer satis-faction in every unit of the Company using the Net Promoter Score (NPS). This internationally recognized and commonly applied managerial performance indicator, which we deter-mine annually on a worldwide basis by means of customer sur-veys, measures the referral rate of our customers. The NPS for
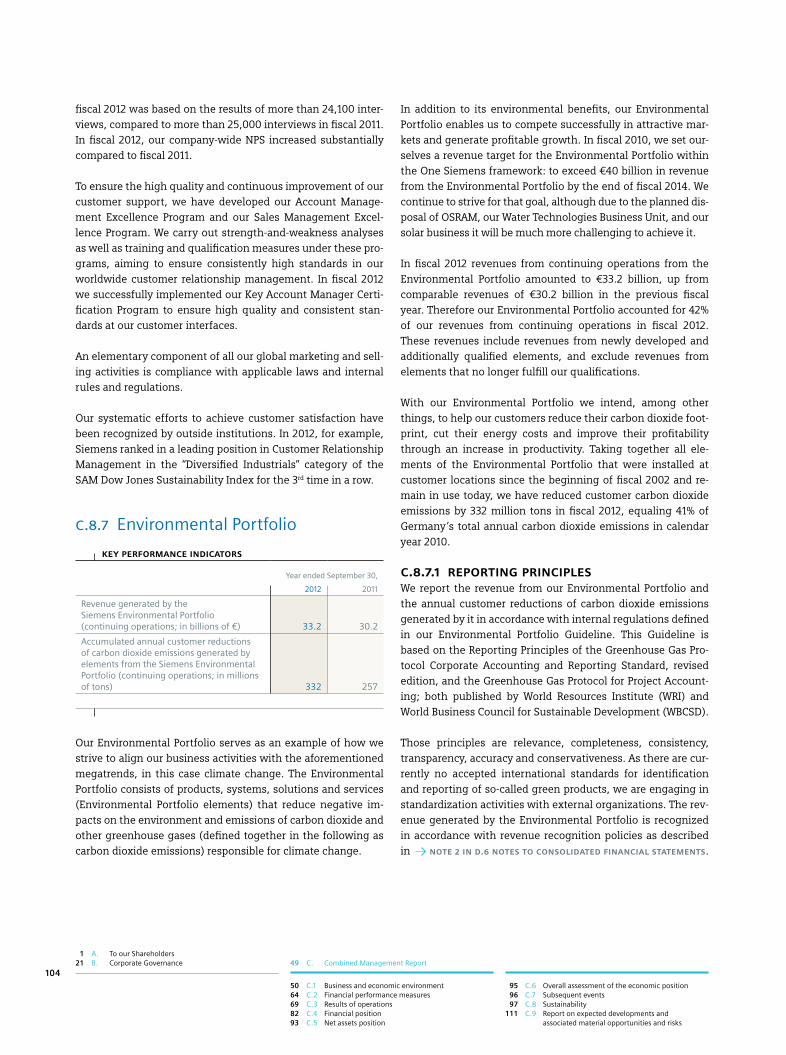
1 A. To our Shareholders 21 B. Corporate Governance 49 C. Combined Management Report
50 C.1 Business and economic environment 64 C.2 Financial performance measures 69 C.3 Results of operations 82 C.4 Financial position 93 C.5 Net assets position
95 C.6 Overall assessment of the economic position 96 C.7 Subsequent events 97 C.8 Sustainability 111 C.9 Report on expected developments and
associated material opportunities and risks
104
fiscal 2012 was based on the results of more than 24,100 inter-views, compared to more than 25,000 interviews in fiscal 2011. In fiscal 2012, our company-wide NPS increased substantially compared to fiscal 2011.
To ensure the high quality and continuous improvement of our customer support, we have developed our Account Manage-ment Excellence Program and our Sales Management Excel-lence Program. We carry out strength-and-weakness analyses as well as training and qualification measures under these pro-grams, aiming to ensure consistently high standards in our worldwide customer relationship management. In fiscal 2012 we successfully implemented our Key Account Manager Certi-fication Program to ensure high quality and consistent stan-dards at our customer interfaces.
An elementary component of all our global marketing and sell-ing activities is compliance with applicable laws and internal rules and regulations.
Our systematic efforts to achieve customer satisfaction have been recognized by outside institutions. In 2012, for example, Siemens ranked in a leading position in Customer Relationship Management in the “Diversified Industrials” category of the SAM Dow Jones Sustainability Index for the 3rd time in a row.
C.8.7 Environmental Portfolio
key perFormanCe indiCators
Year ended September 30,
2012 2011
Revenue generated by the Siemens Environmental Portfolio (continuing operations; in billions of €) 33.2 30.2
Accumulated annual customer reductions of carbon dioxide emissions generated by elements from the Siemens Environmental Portfolio (continuing operations; in millions of tons) 332 257
Our Environmental Portfolio serves as an example of how we strive to align our business activities with the aforementioned megatrends, in this case climate change. The Environmental Portfolio consists of products, systems, solutions and services (Environmental Portfolio elements) that reduce negative im-pacts on the environment and emissions of carbon dioxide and other greenhouse gases (defined together in the following as carbon dioxide emissions) responsible for climate change.
In addition to its environmental benefits, our Environmental Portfolio enables us to compete successfully in attractive mar-kets and generate profitable growth. In fiscal 2010, we set our-selves a revenue target for the Environmental Portfolio within the One Siemens framework: to exceed €40 billion in revenue from the Environmental Portfolio by the end of fiscal 2014. We continue to strive for that goal, although due to the planned dis-posal of OSRAM, our Water Technologies Business Unit, and our solar business it will be much more challenging to achieve it.
In fiscal 2012 revenues from continuing operations from the Environmental Portfolio amounted to €33.2 billion, up from comparable revenues of €30.2 billion in the previous fiscal year. Therefore our Environmental Portfolio accounted for 42% of our revenues from continuing operations in fiscal 2012. These revenues include revenues from newly developed and additionally qualified elements, and exclude revenues from elements that no longer fulfill our qualifications.
With our Environmental Portfolio we intend, among other things, to help our customers reduce their carbon dioxide foot-print, cut their energy costs and improve their profitability through an increase in productivity. Taking together all ele-ments of the Environmental Portfolio that were installed at customer locations since the beginning of fiscal 2002 and re-main in use today, we have reduced customer carbon dioxide emissions by 332 million tons in fiscal 2012, equaling 41% of Germany ’s total annual carbon dioxide emissions in calendar year 2010.
C.8.7.1 reporting prinCipLesWe report the revenue from our Environmental Portfolio and the annual customer reductions of carbon dioxide emissions generated by it in accordance with internal regulations defined in our Environmental Portfolio Guideline. This Guideline is based on the Reporting Principles of the Greenhouse Gas Pro-tocol Corporate Accounting and Reporting Standard, revised edition, and the Greenhouse Gas Protocol for Project Account-ing; both published by World Resources Institute (WRI) and World Business Council for Sustainable Development (WBCSD).
Those principles are relevance, completeness, consistency, transparency, accuracy and conservativeness. As there are cur-rently no accepted international standards for identification and reporting of so-called green products, we are engaging in standardization activities with external organizations. The rev-enue generated by the Environmental Portfolio is recognized in accordance with revenue recognition policies as described in note 2 in d.6 notes to ConsoLidated FinanCiaL statements.

135 D. Consolidated Financial Statements 239 E. Additional Information
130 C.11 Siemens AG (Discussion on basis of German Commercial Code)
134 C.12 Notes and forward-looking statements
129 C.10 Compensation Report, Corporate Governance statement pursuant to Section 289a of the German Commercial Code, Takeover-relevant information and explanatory report
105
C.8.7.2 governanCe – proCesses and deFinitionsThe qualification of Environmental Portfolio elements as well as their respective reporting is based on defined processes and criteria. In principle, any product, system, solution or service of Siemens’continuing operations may qualify for the Environ-mental Portfolio. The business portfolio of Siemens’ continu-ing operations is reviewed annually regarding the qualification of Environmental Portfolio elements based on the criteria de-scribed below. This covers the inclusion of newly developed elements as well as the integration of additionally qualified elements where evidence of fulfillment of the qualification cri-teria was not available in prior reporting periods. For addition-ally qualified Environmental Portfolio elements, we report their prior-year revenue and prior-year contribution to reduc-ing customer carbon dioxide emissions on a comparable basis. Elements that no longer fulfill our qualification criteria are excluded from our Environmental Portfolio.
Prior to inclusion in the Environmental Portfolio, potential new Environmental Portfolio elements have to undergo a multilevel internal evaluation process. The Sustainability Board annually acknowledges changes in the composition of the Environmen-tal Portfolio. One task of the Sustainability Board is also to dis-cuss potential concerns of stakeholders with regard to the inclusion or deletion of certain technologies in the Environ-mental Portfolio.
C.8.7.3 Criteria For inCLusion oF environmentaL portFoLio eLementsAn Environmental Portfolio element can be a product, a sys-tem, a solution or a service as defined above. Furthermore, a core component of a system or solution may qualify as an Environmental Portfolio element if the component provided by Siemens is key to enabling environmental benefits resulting from the system’s or solution’s overall application. To qualify for inclusion in the Environmental Portfolio, an element must meet one of the selection criteria described below, which are energy efficiency, renewable energy or environmental technol-ogies. Products, systems, solutions and services with planned application in military use or nuclear power are not included in the Environmental Portfolio.
> Energy efficiency: The criteria for energy efficiency are an improvement in energy efficiency of 20% or more during the customer use phase compared to the applicable baseline, or a reduction of at least 100,000 metric tons of carbon dioxide equivalents per reporting period in the customer use phase. Examples of elements that meet the energy efficiency crite-rion are combined cycle power plants and intelligent build-ing technology systems.
> Renewable energy: This criterion covers technologies in the field of renewable energy sources such as wind turbines or smart grid applications and their respective core compo-nents.
> Environmental technologies: This criterion is related to wa-ter and wastewater treatment, air pollution control, waste re-duction, recycling, e-car infrastructure and its core compo-nents. Additionally, a criterion for the Healthcare Sector is an environmental impact reduction in terms of noise, radiation or total weight of at least 25% compared to the baseline.
C.8.7.4 baseLine methodsEnergy efficiency, annual customer reduction of carbon diox-ide and environmental impact are all assessed by a comparison with a reference solution (baseline). There are three different options for the reference solution: before-after comparison, comparison with a reference technology or comparison with the installed base. The baselines are reviewed annually and, if necessary, adjusted, such as when statistical data on the in-stalled base is updated because of technical innovations or regulatory changes. The calculation of the reduction of carbon dioxide emissions is based on a comparison for every relevant Environmental Portfolio element with a baseline. For this cal-culation, we focus on those elements that have a material impact on the overall carbon dioxide emissions reduction. For some emission reduction calculations, the baseline reference for the installed base is determined using known global emis-sion factors such as those for power production. The baselines used for our calculations are mainly based on data of the Inter-national Energy Agency (IEA) for gross power production and for grid losses, on data from the Intergovernmental Panel on Climate Change (IPCC) for fuel based emission factors, and our own assessments of power production efficiency. For consis-tency reasons, we generally apply global emission factors for calculating emission reductions.
C.8.7.5 reporting estimatesThe inclusion of elements in the Environmental Portfolio is based on criteria, methodologies and assumptions that other companies and other stakeholders may view differently. Fac-tors that may cause differences, among others, are: choice of applicable baseline methodology, application of global emis-sion factors that may be different from local conditions, use patterns at customers that may be different from standard use patterns used for carbon dioxide abatement calculations and expert estimates if no other data is available.
To date, there is no applicable international standard that ap-plies across companies for qualifying products, systems, solu-tions and services for environmental and climate protection, or for compiling and calculating the respective revenues and the
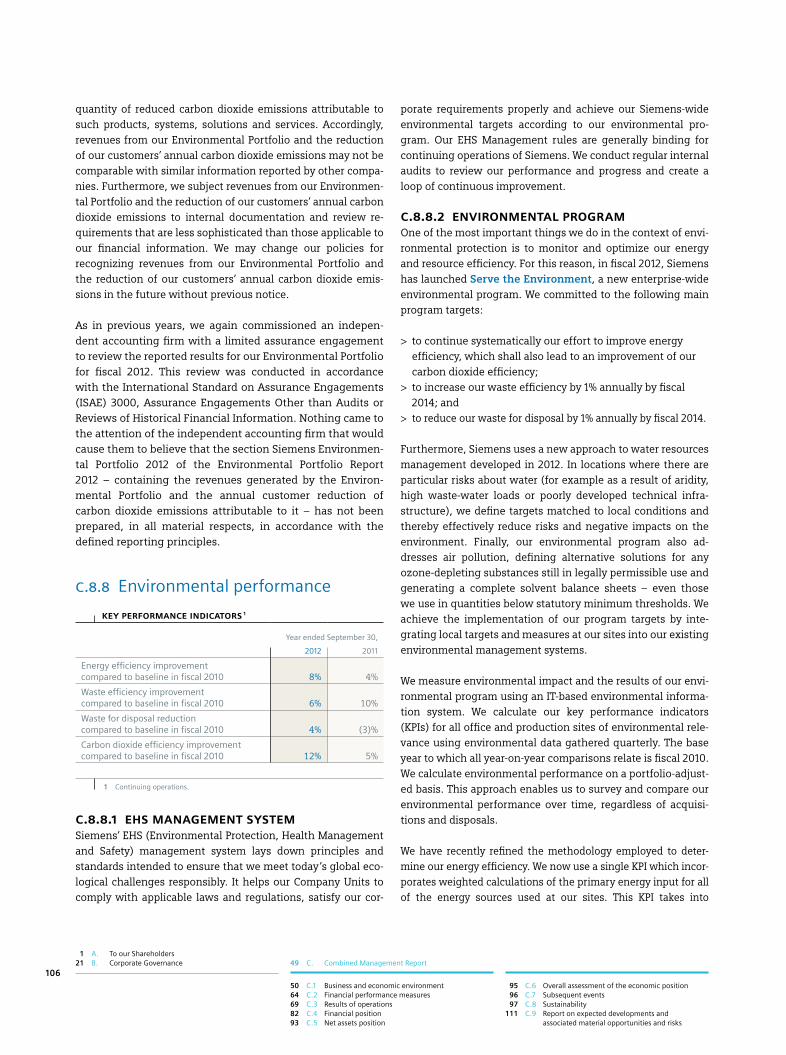
1 A. To our Shareholders 21 B. Corporate Governance 49 C. Combined Management Report
50 C.1 Business and economic environment 64 C.2 Financial performance measures 69 C.3 Results of operations 82 C.4 Financial position 93 C.5 Net assets position
95 C.6 Overall assessment of the economic position 96 C.7 Subsequent events 97 C.8 Sustainability 111 C.9 Report on expected developments and
associated material opportunities and risks
106
quantity of reduced carbon dioxide emissions attributable to such products, systems, solutions and services. Accordingly, revenues from our Environmental Portfolio and the reduction of our customers’ annual carbon dioxide emissions may not be comparable with similar information reported by other compa-nies. Furthermore, we subject revenues from our Environmen-tal Portfolio and the reduction of our customers’ annual carbon dioxide emissions to internal documentation and review re-quirements that are less sophisticated than those applicable to our financial information. We may change our policies for recognizing revenues from our Environmental Portfolio and the reduction of our customers’ annual carbon dioxide emis-sions in the future without previous notice.
As in previous years, we again commissioned an indepen-dent accounting firm with a limited assurance engagement to review the reported results for our Environmental Portfolio for fiscal 2012. This review was conducted in accordance with the International Standard on Assurance Engagements (ISAE) 3000, Assurance Engagements Other than Audits or Reviews of Historical Financial Information. Nothing came to the attention of the independent accounting firm that would cause them to believe that the section Siemens Environmen-tal Portfolio 2012 of the Environmental Portfolio Report 2012 – containing the revenues generated by the Environ-mental Portfolio and the annual customer reduction of carbon dioxide emissions attributable to it – has not been prepared, in all material respects, in accordance with the defined reporting principles.
C.8.8 Environmental performance
key perFormanCe indiCators 1
Year ended September 30,
2012 2011
Energy efficiency improvement compared to baseline in fiscal 2010 8% 4%
Waste efficiency improvement compared to baseline in fiscal 2010 6% 10%
Waste for disposal reduction compared to baseline in fiscal 2010 4% (3)%
Carbon dioxide efficiency improvement compared to baseline in fiscal 2010 12% 5%
1 Continuing operations.
C.8.8.1 ehs management system Siemens’ EHS (Environmental Protection, Health Management and Safety) management system lays down principles and standards intended to ensure that we meet today ’s global eco-logical challenges responsibly. It helps our Company Units to comply with applicable laws and regulations, satisfy our cor-
porate requirements properly and achieve our Siemens-wide environmental targets according to our environmental pro-gram. Our EHS Management rules are generally binding for continuing operations of Siemens. We conduct regular internal audits to review our performance and progress and create a loop of continuous improvement.
C.8.8.2 environmentaL programOne of the most important things we do in the context of envi-ronmental protection is to monitor and optimize our energy and resource efficiency. For this reason, in fiscal 2012, Siemens has launched Serve the Environment, a new enterprise-wide environmental program. We committed to the following main program targets:
> to continue systematically our effort to improve energy efficiency, which shall also lead to an improvement of our carbon dioxide efficiency;
> to increase our waste efficiency by 1% annually by fiscal 2014; and
> to reduce our waste for disposal by 1% annually by fiscal 2014.
Furthermore, Siemens uses a new approach to water resources management developed in 2012. In locations where there are particular risks about water (for example as a result of aridity, high waste-water loads or poorly developed technical infra-structure), we define targets matched to local conditions and thereby effectively reduce risks and negative impacts on the environment. Finally, our environmental program also ad-dresses air pollution, defining alternative solutions for any ozone-depleting substances still in legally permissible use and generating a complete solvent balance sheets – even those we use in quantities below statutory minimum thresholds. We achieve the implementation of our program targets by inte-grating local targets and measures at our sites into our existing environmental management systems.
We measure environmental impact and the results of our envi-ronmental program using an IT-based environmental informa-tion system. We calculate our key performance indicators (KPIs) for all office and production sites of environmental rele-vance using environmental data gathered quarterly. The base year to which all year-on-year comparisons relate is fiscal 2010. We calculate environmental performance on a portfolio-adjust-ed basis. This approach enables us to survey and compare our environmental performance over time, regardless of acquisi-tions and disposals.
We have recently refined the methodology employed to deter-mine our energy efficiency. We now use a single KPI which incor-porates weighted calculations of the primary energy input for all of the energy sources used at our sites. This KPI takes into

135 D. Consolidated Financial Statements 239 E. Additional Information
130 C.11 Siemens AG (Discussion on basis of German Commercial Code)
134 C.12 Notes and forward-looking statements
129 C.10 Compensation Report, Corporate Governance statement pursuant to Section 289a of the German Commercial Code, Takeover-relevant information and explanatory report
107
account the amount of energy used to extract, convert and dis-tribute the fuels consumed. Fossil energy sources receive a higher primary energy factor than renewable energy sources. Siemens sites can accordingly increase their energy efficiency and reduce the impact on natural resources of their energy demands by stra-tegically adjusting their choice of energy sources.
We achieved all of the targets we set ourselves in fiscal 2012. Our energy efficiency rose by 8% compared with the base year. We also made progress with our waste efficiency, which im-proved by 6% compared with the base year, while waste for disposal fell by 4% measured against the base year quantity.
C.8.9 Employees
key perFomanCe indiCators 1
Year ended September 30,
2012 2011
Employee fluctuation rate 2 10.7% 12.9%
Proportion of women (percentage of employees in management positions) 15.3% 14.6%
Expenses for continuing education (in millions of €) 3 283 251
Expenses per employee for continuing education (in €) 3 693 608
1 Continuing and discontinued operations.
2 Employee fluctuation rate is defined as the ratio of voluntary and involuntary exits from Siemens during the fiscal year to the average number of employees.
3 Without travel expenses.
Excellent employees are one of Siemens‘ vital strengths. They have made Siemens what it is today and their expertise, their capabilities and their high level of engagement are laying the basis for our future success. To stay competitive we need to continuously win and retain the best and brightest employees worldwide. As an employer of choice we empower our diverse and engaged people worldwide based on a high-performance culture, encourage life-long learning and development, offer an attractive working environment and ensure occupational health and safety.
Fair-minded collaboration among Company management, em-ployees and employee representatives plays a central role at Siemens. As one of the largest corporate employers in Germany and worldwide we are committed to our social responsibility and respect and uphold the fundamental rights of our employees.
In fiscal 2012, more than 286,000 Siemens employees (excluding OSRAM) took part in our worldwide employee survey relating to employee engagement (Siemens Global Engagement Survey 2012). The survey was globally distributed in 40 languages across our Company. The results continue to demonstrate the strong commitment of our employees to Siemens, its values and its strategy. The survey results also identify potential areas for further improvement, which will be assessed by the Company.
C.8.9.1 diversityAs a global player, the vast and diverse range of our employ-ees’ capabilities, experience and qualifications forms a sub-stantial competitive advantage and supports our value propo-sition as an employer.
The Global Diversity Office coordinates strategies, measures and programs across Siemens following these Diversity-principles:
> we want to have the best person for every position; > we want to provide opportunities for diversity of experience and interaction; and
> we want to achieve diversity of thinking across our Company.
Diversity networks and programs – Our Global networks pro-mote and discuss diversity topics across the Company, such as the Global Leadership Organization of Women (GLOW), Diversi-ty Ambassador and Generations Networks. In addition, we have over 100 local employee networks worldwide with employees actively engaged in diversity-related programs and activities.
Diversity Charter – Since its launch in December 2010, more than 14.000 Siemens employees have pledged their support by signing the Siemens Diversity Charter showcasing a strong grass-roots support for diversity at Siemens.
empLoyees by segments as oF september 30, 2012 (in thousands)1
1 Continuing operations.
Infrastructure & Cities: 89 (24%)
Energy: 86 (23%)
Healthcare: 51 (14%)
Industry: 105 (28%)
Other: 36 (10%)
Financial Services: 3 (1%)
empLoyees by regions as oF september 30, 2012 (in thousands)1
1 Continuing operations.
2 Commonwealth of Independent States.
Europe, C.I.S.2, Africa, Middle East: 222 (60%)therein Germany: 119 (32%)
Asia, Australia: 63 (17%)therein China: 31 (8%)therein India: 19 (5%)
Americas: 84 (23%) therein U.S.: 57 (15%)
370 370

1 A. To our Shareholders 21 B. Corporate Governance 49 C. Combined Management Report
50 C.1 Business and economic environment 64 C.2 Financial performance measures 69 C.3 Results of operations 82 C.4 Financial position 93 C.5 Net assets position
95 C.6 Overall assessment of the economic position 96 C.7 Subsequent events 97 C.8 Sustainability 111 C.9 Report on expected developments and
associated material opportunities and risks
108
Diversity Scorecard – To measure our progress in the area of diversity, we have a scorecard based on five parameters, which we track yearly and compare to prior years: These five parame-ters include professional knowledge, diversity at all levels, composition of our top talent pool, culture and branding, and experience mix.
Diversity in management – We’ve developed our manage-ment recruitment processes to ensure that the preliminary se-lection of candidates reflects the diversity of our customers and employees at all levels and in all regions. For example the percentage of women in management at Siemens globally has today nearly doubled since fiscal 2002 to 15.3%.
Work-life integration – A growing number of employees seek more flexibility in how they balance work with the rest of their lives, for example, childcare responsibilities. At many of our lo-cations worldwide, we now provide options for flexible work schedules, part-time work and telecommuting. At the same time, particularly in Germany, we are expanding the availabili-ty of childcare options near the Company, such as nurseries, daycare centers and children’s after-school centers – taking lo-cal conditions into account.
C.8.9.2 Learning and Continuing eduCationWe aim to further develop the qualification and expertise of our employees at all locations. In fiscal 2012, we invested around €283 million for continuing education (without travel expenses), which equals about €693 per employee. These ex-penses include training courses and programs both for individ-ual employees and for entire organizational units or categories of employees. For example, we prepare our next-generation managers for their future responsibilities through the Siemens Leadership Excellence Program. So-called Siemens Core Learn-ing Programs impart skills and capabilities specific to the re-quirements of particular job categories at Siemens and are an important lever for the systematic development of our employ-ees worldwide. Functional training measures address the de-velopment of specific skills within particular business func-tions. Cross-functional training improves skills and capabilities that are relevant across multiple job categories or business functions.
Siemens continues to be one of Germany ’s largest providers of professional education for secondary school graduates (7.200 places for Siemens trainees and 2.600 places for trainees from other companies). As in previous years, we again made 250 trainee positions available to disadvantaged youths. In addi-tion, we offer for the first time a professional education ac-cording to the German system to 29 school graduates coming from 13 European countries.
C.8.9.3 supporting a high perFormanCe CuLtureTo ensure high performance at all levels, our compensation system for our top executives and senior management world-wide includes a variable component that depends on three tar-get categories: Unit Performance (against internal financial targets as well as further strategic unit targets, such as perfor-mance against competition), Individual Performance and Siemens Performance.
C.8.9.4 gLobaL siemens equity CuLtureSiemens established its first employee share program in Ger-many as early as 1969, following the Company ’s reorganization as a stock exchange-listed corporation. The aim was to enable as many employees as possible to participate in Siemens’ long-term future development. Over the years, thousands of em-ployees in Germany have acquired Siemens shares with the Company ’s financial support. Building on this success in Ger-many, Siemens’ Managing Board decided in 2008 to extend employee and management participation. In the same year, the first wave of the new global Share Matching Plan was rolled out in seven countries. Today, Siemens offers approxi-mately 94% of its employees in 54 countries the opportunity to participate in the plan. The Share Matching Plan is based on a simple principle: Employees participating in the plan will re-ceive one Siemens share without payment of consideration (matching share) for every three Siemens shares bought and continuously held over a period of three years. Only condition: The employee still needs to be employed by Siemens. Clear purpose of the plan has always been to make stock ownership available to employees at all income levels.
We are convinced that empowering employees with shares moti-vates them to assume greater responsibilities and helps them identify more closely with the company they work for – a funda-mental prerequisite for the sustainable development of Siemens. In 2011, the Global Equity Organization (GEO), the largest inter-national organization concerned with share plans and equity-based compensation, presented Siemens AG with the Judges Award – for overall excellence with regard to global benefit schemes. Siemens AG was commended by the GEO jury for its strategy of establishing a truly global equity culture within the Company, taking all employees worldwide into consideration.
C.8.9.5 empLoyee rights and reLations to empLoyee representativesWe aim to respect and uphold the fundamental rights of our employees. Underscoring this commitment, Siemens, the Siemens Central Works Council, the German trade union IG Metall and the global industrial union IndustriAll have signed an international framework agreement on the principles of corporate responsibility. The agreement reaffirms Siemens’
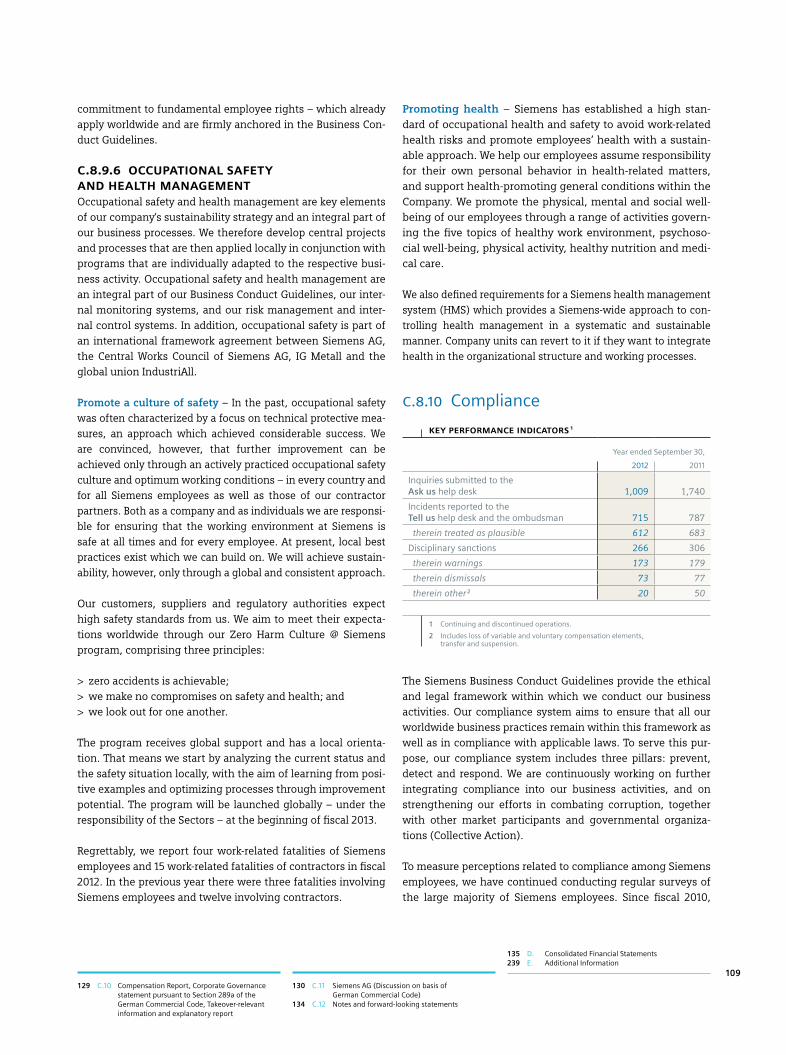
135 D. Consolidated Financial Statements 239 E. Additional Information
130 C.11 Siemens AG (Discussion on basis of German Commercial Code)
134 C.12 Notes and forward-looking statements
129 C.10 Compensation Report, Corporate Governance statement pursuant to Section 289a of the German Commercial Code, Takeover-relevant information and explanatory report
109
commitment to fundamental employee rights – which already apply worldwide and are firmly anchored in the Business Con-duct Guidelines.
C.8.9.6 oCCupationaL saFety and heaLth managementOccupational safety and health management are key elements of our company‘s sustainability strategy and an integral part of our business processes. We therefore develop central projects and processes that are then applied locally in conjunction with programs that are individually adapted to the respective busi-ness activity. Occupational safety and health management are an integral part of our Business Conduct Guidelines, our inter-nal monitoring systems, and our risk management and inter-nal control systems. In addition, occupational safety is part of an international framework agreement between Siemens AG, the Central Works Council of Siemens AG, IG Metall and the global union IndustriAll.
Promote a culture of safety – In the past, occupational safety was often characterized by a focus on technical protective mea-sures, an approach which achieved considerable success. We are convinced, however, that further improvement can be achieved only through an actively practiced occupational safety culture and optimum working conditions – in every country and for all Siemens employees as well as those of our contractor partners. Both as a company and as individuals we are responsi-ble for ensuring that the working environment at Siemens is safe at all times and for every employee. At present, local best practices exist which we can build on. We will achieve sustain-ability, however, only through a global and consistent approach.
Our customers, suppliers and regulatory authorities expect high safety standards from us. We aim to meet their expecta-tions worldwide through our Zero Harm Culture @ Siemens program, comprising three principles:
> zero accidents is achievable; > we make no compromises on safety and health; and > we look out for one another.
The program receives global support and has a local orienta-tion. That means we start by analyzing the current status and the safety situation locally, with the aim of learning from posi-tive examples and optimizing processes through improvement potential. The program will be launched globally – under the responsibility of the Sectors – at the beginning of fiscal 2013.
Regrettably, we report four work-related fatalities of Siemens employees and 15 work-related fatalities of contractors in fiscal 2012. In the previous year there were three fatalities involving Siemens employees and twelve involving contractors.
Promoting health – Siemens has established a high stan-dard of occupational health and safety to avoid work-related health risks and promote employees’ health with a sustain-able approach. We help our employees assume responsibility for their own personal behavior in health-related matters, and support health-promoting general conditions within the Company. We promote the physical, mental and social well-being of our employees through a range of activities govern-ing the five topics of healthy work environment, psychoso-cial well-being, physical activity, healthy nutrition and medi-cal care.
We also defined requirements for a Siemens health management system (HMS) which provides a Siemens-wide approach to con-trolling health management in a systematic and sustainable manner. Company units can revert to it if they want to integrate health in the organizational structure and working processes.
C.8.10 Compliance
key perFormanCe indiCators 1
Year ended September 30,
2012 2011
Inquiries submitted to the Ask us help desk 1,009 1,740
Incidents reported to the Tell us help desk and the ombudsman 715 787
therein treated as plausible 612 683
Disciplinary sanctions 266 306
therein warnings 173 179
therein dismissals 73 77
therein other 2 20 50
1 Continuing and discontinued operations.
2 Includes loss of variable and voluntary compensation elements, transfer and suspension.
The Siemens Business Conduct Guidelines provide the ethical and legal framework within which we conduct our business activities. Our compliance system aims to ensure that all our worldwide business practices remain within this framework as well as in compliance with applicable laws. To serve this pur-pose, our compliance system includes three pillars: prevent, detect and respond. We are continuously working on further integrating compliance into our business activities, and on strengthening our efforts in combating corruption, together with other market participants and governmental organiza-tions (Collective Action).
To measure perceptions related to compliance among Siemens employees, we have continued conducting regular surveys of the large majority of Siemens employees. Since fiscal 2010,

1 A. To our Shareholders 21 B. Corporate Governance 49 C. Combined Management Report
50 C.1 Business and economic environment 64 C.2 Financial performance measures 69 C.3 Results of operations 82 C.4 Financial position 93 C.5 Net assets position
95 C.6 Overall assessment of the economic position 96 C.7 Subsequent events 97 C.8 Sustainability 111 C.9 Report on expected developments and
associated material opportunities and risks
110
compliance perception forms a part of the annual Siemens Global Engagement Survey which has also been conducted in the reporting period.
The Ask us help desk encourages our employees to ask their compliance-related questions. Employees submitted 1,009 in-quiries to the help desk in fiscal 2012. We believe the decline from 1,740 inquiries in fiscal 2011 is due to improvements made in our processes and to increasing knowledge and understand-ing of compliance policies and processes among Siemens em-ployees. Furthermore, all employees can pose questions direct-ly to the compliance officer responsible for their unit.
The Tell us help desk and the Company ’s ombudsman are two secured reporting channels that can be used by our employees and external stakeholders to report violations of external and internal rules. These reports are passed on to our compliance organization. In fiscal 2012, the number of incidents reported to the Tell us help desk and the ombudsman was 715, of these 612 were initially plausible and required further inquiries or in-vestigations in order to clarify the reported incidents.
Furthermore, possible misbehavior may also be reported di-rectly to the Compliance Organization, particularly to the Com-pliance Officers in our individual company units. Our employ-ees make regularly use of this reporting channel. We perceive this as an indication of the confidence they place in our Com-pliance Organization.
On December 9, 2009, Siemens launched a global US$100 mil-lion Siemens Integrity Initiative to support organizations and projects that fight corruption and fraud through Collective Ac-tion, education and training. This initiative is part of the World Bank Siemens AG comprehensive settlement of July 2, 2009. The status of the 31 projects funded within the first funding round with a total contractual funding volume of US$37.7 mil-lion was presented to the World Bank in March 2012, based on the first annual report on the Siemens Integrity Initiative which is online publicly available.
On October 12, 2012, the Company received the Year Four Report from the Compliance Monitor Dr. Theodor Waigel, whom Siemens had engaged as part of the settlement reached with U.S. authorities in December 2008. During Year Four, the Monitor evaluated the long-term sustainability of Siemens’ compliance program and its compliance risk assessment and compliance program evaluation processes, in addition to risk-based themes and the implementation of Year Two and Year Three recommendations. As was set forth in the Settlement Agreement with the U.S. Securities and Exchange Commission (SEC) and the U.S. Department of Justice (DOJ), this Year Four Report contains (1) an evaluation of the open recommenda-tions from the Year Two and Year Three Reports plus (2) again a certification by the Compliance Monitor that the compliance program of Siemens, including its policies and procedures, is reasonably designed and implemented to detect and prevent violations within Siemens of anti-corruption laws. The Year Four report also states that all recommendations from Year Two and Year Three reports are fully implemented. Since the Year Four Report does not include any new recommendations, this means that all recommendations of the Monitor are fully implemented. As was set forth in the aforementioned settle-ment, the Monitorship ends four years after the settlement date on December 15, 2012.
At the beginning of fiscal 2011, we have launched a system of four compliance priorities to further develop and improve our compliance system. The compliance priorities have guided our activities in fiscal 2012. These included initial implementation of a new compliance risk assessment covering all Siemens en-tities, which the Sectors, Divisions and Clusters as well as cross-sector businesses are required to perform on a regular basis, and the development and roll out of a new anti-trust compliance program.
Effective from fiscal 2013 we have updated the compliance priorities as follows:
CompLianCe priorities eFFeCtive Fy 2013
Compliance priorities
Our aim is to further encourage business management respon- si bility for compliance and to continue promoting responsible business practices in our markets with Collective Action and the Siemens Integrity Initiative.
We want to leverage the Compliance system to support sustainable growth and as a competitive advantage.
We continue to develop the com pliance risk management and to provide reliable assurance for our business entities.
We focus on increasing the effi-ciency of compliance operations and collaboration.
Stand for Integrity Committed to Business Manage Risk & Assurance Focus on Efficiency

135 D. Consolidated Financial Statements 239 E. Additional Information
130 C.11 Siemens AG (Discussion on basis of German Commercial Code)
134 C.12 Notes and forward-looking statements
129 C.10 Compensation Report, Corporate Governance statement pursuant to Section 289a of the German Commercial Code, Takeover-relevant information and explanatory report
111
These compliance priorities will also determine our goals for fiscal 2013. Our ongoing aim is to encourage sound business judgment that is based upon management responsibility for compliance and backed by robust assurance provided by the compliance organization.
C.8.11 Corporate citizenship
Siemens is committed to providing long-term benefits to the societies in which we operate, through corporate citizenship activities that extend beyond our actual business operations. We deploy many different resources to act on this commit-ment, with a particular emphasis on company competencies and employee volunteering. Fundamental to corporate citizen-ship at Siemens is our commitment to the U.N. Global Com-pact, a principle-based framework for businesses, and to the U.N. Millennium Development Goals, a set of eight interna-tional development goals that member states have agreed to achieve by 2015. We also maintain an ongoing dialogue with key opinion-makers around the world.
We apply high management standards and strategically focus our corporate citizenship activities in areas where our resourc-es and expertise can make a meaningful difference:
> Education and Science: Our goal is to maintain a continu-ous dialogue with young people and to identify and foster talent from an early age on. We support educational and re-search activities particularly in natural sciences, engineer-ing and healthcare.
> Social: Projects in this area aim to bring about a systematic and lasting improvement in people’s living conditions. In ad-dition we provide urgent humanitarian relief, including fi-nancial and technical assistance after natural disasters.
> Environment: We want to make an effective contribution to-wards protecting the environment, particularly through our core competencies, and raise environmental awareness among younger generations.
> Arts and Culture: We support Arts and Culture because a so-ciety ’s cultural heritage is a key aspect of its identity.
The Siemens Stiftung – The Siemens Stiftung is dedicated to the values of Werner von Siemens and wants to empower peo-ple to actively contribute towards social development. It focus-es on holistic, non-business-related, transferable projects and models in sub-Saharan Africa, Latin America and Europe, with a particular emphasis on Germany.
Established in 2008 with a capital of €390 million, Siemens Stiftung is a nonprofit foundation under German civil law. It complements Siemens’ corporate citizenship activities and cooperates with the other five corporate foundations estab-lished by the Company in Argentina, Brazil, Columbia, the United States and France.
C.9 rePort on exPeCted develoPments and assoCiated material oPPortunities and risks
C.9.1 Report on expected developments
C.9.1.1 worLdwide eConomyAccording to predictions of IHS Global Insight, global GDP growth is expected to stabilize in 2013, but at 2.6% it would re-main below its long-term trend rate of around 3.5%. The eco-nomic outlook is dampened mainly by the unstable situation in Europe, as the continuing stagnation of growth and finan-cial uncertainty in this region cause headwinds for global de-mand and the global economy in general. Furthermore, auto-matic spending cuts and tax increases that could take effect in the U.S. at the beginning of 2013 (“fiscal cliff”) could have a
major negative impact on the U.S. and the global economy. Moreover, geopolitical tensions in North Africa and the Middle East may lead to a surge in oil prices, which could further ham-per global economic activity. On the upside, the global econo-my could gain support from expansive monetary measures in emerging markets and developed economies, especially the long-term bond-buying program (Quantitative Easing 3, or QE3) in the U.S. and the government bond purchase program (Outright Monetary Transactions, OMT) of the European Cen-tral Bank, and an increase in fiscal spending in China. Overall, GDP growth is expected to continue to be markedly higher in emerging markets than in industrialized countries.

1 A. To our Shareholders 21 B. Corporate Governance 49 C. Combined Management Report
50 C.1 Business and economic environment 64 C.2 Financial performance measures 69 C.3 Results of operations 82 C.4 Financial position 93 C.5 Net assets position
95 C.6 Overall assessment of the economic position 96 C.7 Subsequent events 97 C.8 Sustainability 111 C.9 Report on expected developments and
associated material opportunities and risks
112
Europe’s economic performance is expected to remain slug-gish in the years ahead, as the region’s crisis countries will con-tinue to suffer from high government debt levels, tight fiscal policies and high levels of unemployment. The weak economic development in the south is forecast to continue to dampen northern export economies such as Germany. Nevertheless, Germany should still be able to grow slightly due to strength-ened domestic demand. In particular private consumption is expected to grow further due to low unemployment and solid growth in real wages. Exports could continue to contribute to growth despite the deep recessions in many Euro-area econo-mies, because non-Eurozone countries are becoming more and more important for German exporters. The geopolitical devel-opment in the Middle East and Africa has a strong influence on oil prices and thus on costs in global supply chains. For exam-ple, sanctions including oil embargos against Iran and spillover effects of political turmoil in Syria could lead to higher oil pric-es and a slowdown of economic activity.
Within the Americas, much in the U.S. will depend on the handling of the fiscal cliff, which if it takes place would result in expiration of broad-based personal income tax cuts and im-plementation of federal spending cuts. These in turn could lead to a recession in the U.S. Some support for the economy will come from the Federal Reserve Bank. QE3, the decision of the Federal Reserve to make monthly purchases of mortgage-backed securities worth US$40 billion, should lower longer-term interest rates and support investment spending and the real estate market in 2013. Latin America is expected to profit from reacceleration of growth in Brazil, which should benefit from the expansive monetary policy of the Brazilian Central Bank. Beyond that, Brazil’s planned investments related to the upcoming World Cup in 2014 and the Olympic Games in 2016 should provide a strong fiscal stimulus.
In Asia, China and India continue to be major growth engines. The increase in government spending should help China’s economy counteract the negative effect of low export de-mand. Growth in Asia is also supported by other fast-growing countries including Indonesia and Vietnam, whose production should expand by 5% to 6% in the coming years. The outlook for Japan is less optimistic. For 2013 growth will slow down again, as consumer spending is still subdued and deflation risk has increased again. India could benefit from its announced macroeconomic reform package. The Indian rupee, which lost 25% of its value between July 2011 and September 2012, stabi-lized after the announcement. The underdeveloped infrastruc-ture of the country is still a major risk for industrial growth. Major grid failures due to a persistent energy supply-demand gap can severely hurt economic activity.
All in all, growth in global GDP is expected to gradually go back to the pre-crisis trend of around 3.5% in 2014. Nevertheless, the financial crisis in the advanced economies will have a lasting effect. For example, there remain significant downside risks of a new escalation of the European sovereign debt crisis. On the other hand, a fast resolution of the crisis could bring growth back to trend sooner than expected.
Gross fixed investments in real terms are expected to grow faster than GDP in both 2013 and 2014. On a global basis, IHS Global Insight is estimating 4.2% growth in gross fixed invest-ments in 2013 and 5.7% growth in 2014. In both years the Asia, Australia and Americas regions are expected to achieve clear growth in gross fixed investments while the Europe, C.I.S., Africa, Middle East region is lagging behind, mainly due to low investment levels in Europe.
Manufacturing value added in real terms is also projected to grow somewhat faster than GDP. On a global basis, IHS Global Insight is estimating 3.7% growth in manufacturing value add-ed in 2013 and 4.6% growth in 2014. Clear growth above the global average is expected in the Asia, Australia region. Growth in the Americas and Europe, C.I.S., Africa, Middle East, particu-larly in Europe, is expected to be markedly slower than in Asia, Australia.
The forecasts presented here for gross domestic product, gross fixed investment and manufacturing value are based on a re-port from IHS Global Insight dated October 15, 2012. Siemens has not independently verified this data.
C.9.1.2 market deveLopmentWe expect the growth of markets served by our Energy Sector to recover somewhat from the downturn in fiscal 2012 and to return to moderate growth in the fiscal years 2013 and 2014. On an overall basis, we expect generally strong demand from emerging markets, which continue to expand their power infra-structures, and from developed economies, which need to modernize their aging energy infrastructures and have com-mitted to implementing environment-friendly energy policies. Overall, the global market development for Energy depends to a large degree on resolution of the sovereign debt crisis in a number of developed countries. Nevertheless, for fiscal year 2013 we expect the fossil power generation market to return to prior levels. For the wind onshore market we expect a flat de-velopment, with the regions Europe, C.I.S., Africa, Middle East and Asia, Australia offsetting a drop in demand in the U.S. Off-shore wind markets are expected to regain growth momentum following slack demand in fiscal 2012. Price pressure is expect-ed to remain very strong. The energy transmission markets are expected to grow moderately over the next two fiscal years.

135 D. Consolidated Financial Statements 239 E. Additional Information
130 C.11 Siemens AG (Discussion on basis of German Commercial Code)
134 C.12 Notes and forward-looking statements
129 C.10 Compensation Report, Corporate Governance statement pursuant to Section 289a of the German Commercial Code, Takeover-relevant information and explanatory report
113
For the next two fiscal years, we expect the healthcare markets in which our Healthcare Sector participates to expand moder-ately but below the long-term growth rates anticipated for this industry. Public healthcare systems have been under cost pres-sure for some time, and this situation is likely to continue while governments address their high sovereign debt levels particularly in the U.S. and the Eurozone. In the U.S., a health care reform was enacted in the spring of 2010. In particular in connection with this reform, it is currently expected that an excise tax will be charged on certain medical devices from 2013 onwards. Siemens believes that this tax will impact all businesses except of Audiology. A continuing trend towards Accountable Care is driving provider consolidation and closer alignment between hospitals and physicians. Emerging mar-kets will continue to be a growth driver, particularly China with double digit growth rates. In Europe we expect overall at best a flat market environment.
Due to an uncertain economic outlook, the Industry Sector ex-pects that most of its customers will continue to invest cau-tiously in fiscal 2013. In the years ahead we expect markets, in-cluding those served by the Industry Automation Division and certain businesses within the Drive Technologies Division, to return to their long-term moderate growth rates. The excep-tion is the still relatively small but dynamic market segment for industrial IT, which we expect to grow significantly faster. In emerging markets, we expect that Industry customers will continue to expand and modernize their production capabili-ties. In developed economies, we expect that our customers will focus on modernizing their production facilities, though the actual development of investments may differ by country and industrial market segment.
Worldwide markets for solutions provided by our Infrastruc-ture & Cities Sector benefit from the long-term global trend to-wards urbanization. We expect the Sector’s markets to grow moderately in fiscal 2013, including large infrastructure proj-ects in rail systems. We anticipate that this will include bal-anced growth across our reporting regions in fiscal 2013. For fiscal 2014 we expect a slowdown in growth. While the Ameri-cas and Asia, Australia are expected to continue their moder-ate growth, demand in Europe, C.I.S., Africa, Middle East is ex-pected to decline due mainly to a declining demand in Europe. We expect that growth in the rail transportation and logistics markets in fiscal 2013 will benefit from large rail projects, par-ticularly in the Europe, C.I.S., Africa, Middle East region. We ex-pect a lower number of large projects in fiscal 2014 and an as-sociated slowdown in market growth. Overall, the develop-ment of the markets for products, solutions and services for rail transportation and logistics is largely driven by public spending. As customers in these markets usually have multi-
year planning and implementation horizons, they tend to be independent of short-term economic trends. For the low and medium voltage and smart grid markets we anticipate slight growth in 2013 and somewhat faster growth in fiscal 2014. De-spite continued demand for energy efficiency solutions, we ex-pect growth in building and construction markets to slow down in fiscal 2013, with some improvement in 2014 particu-larly in the U.S.
Following its reorganization at the beginning of fiscal 2012, SFS’ business is geared even more to the Siemens Sectors and their markets and provides even stronger support to the oper-ating business of Siemens. As such SFS is, among other fac-tors, influenced by the overall business development of the markets served by the four Sectors.
C.9.1.3 siemens groupResults of operationsWe are basing our outlook for the Siemens Group and its seg-ments on the above-mentioned expectations regarding the overall economic situation and specific market conditions over the next two fiscal years. The outlook is based also on an ex-change rate of US$1.25 per €. We further expect that results for fiscal 2013 and particularly fiscal 2014 will be influenced by “Siemens 2014,” our company-wide program for improving profitability in our Sectors through cost reduction, strengthen-ing core activities, improving our go-to-market setup, optimiz-ing our corporate infrastructure, and simplifying our gover-nance. Specific expectations related to “Siemens 2014” are de-tailed in the paragraphs below.
We expect that revenue in fiscal 2013 will approach the level reached in fiscal 2012 on an organic basis. We expect revenue development to benefit from conversion of our order backlog (defined as the sum of order backlogs of our Sectors) of €98 billion as of September 30, 2012. From this backlog we expect to convert approximately €41 billion of past orders into current revenue in fiscal 2013 and approximately €23 billion into reve-nue in fiscal 2014. Within these numbers for fiscal 2013, we ex-pect approximately €21 billion in revenue conversion from the €55 billion backlog of the Energy Sector, approximately €10 bil-lion in revenue conversion from the €24 billion backlog of In-frastructure & Cities, approximately €7 billion in revenue con-version from the €11 billion backlog of Industry and approxi-mately €3 billion in revenue conversion from the €7 billion backlog of Healthcare. Based on an expected overall improve-ment in the markets served by our Sectors, we expect revenue to return to moderate growth in fiscal 2014. We also expect rev-enue from emerging markets, which accounted for 33% of total revenue in fiscal 2012, to grow faster than overall revenue in the coming two fiscal years.

1 A. To our Shareholders 21 B. Corporate Governance 49 C. Combined Management Report
50 C.1 Business and economic environment 64 C.2 Financial performance measures 69 C.3 Results of operations 82 C.4 Financial position 93 C.5 Net assets position
95 C.6 Overall assessment of the economic position 96 C.7 Subsequent events 97 C.8 Sustainability 111 C.9 Report on expected developments and
associated material opportunities and risks
114
We expect that the revenue growth rate for our Environmental Portfolio will be higher than for Siemens overall. In fiscal 2010, we set ourselves the goal to increase revenue from our Environ-mental Portfolio to more than €40 billion in fiscal 2014, up from €33 billion in fiscal 2012. Due to the planned disposals men-tioned earlier, including OSRAM, the Water Technologies Busi-ness Unit, and our solar business, we believe it will be much more challenging to achieve this goal. For further information see C.3.2.3 industry and C.3.2.1 energy, respectively.
The goal of the “Siemens 2014” program mentioned above is to raise our Total Sectors profit margin to at least 12% by fiscal 2014. To achieve this goal, we are targeting productivity gains totaling approximately €6 billion over the next two fiscal years. In the area of cost reduction, we intend to derive approximately €3 billion from better integrating engineering, purchasing and production processes and overall material productivity; approxi-mately €1 billion from further improving global capacity utiliza-tion and presence; and approximately €1 billion from improving efficiency and quality in production processes and project exe-cution. The remaining portion of the productivity gains is spread over a number of smaller topics, including our go-to-market set-up, worldwide infrastructure, and governance processes.
To achieve the targeted results, our Sectors are undertaking a broad range of measures expected to lead to charges totaling up to €1.5 billion over the next two fiscal years. We anticipate recording approximately €1.0 billion of these charges in fiscal 2013 and the balance in fiscal 2014. The Total Sectors profit margin target of at least 12% mentioned above takes into con-sideration a number of expectations for fiscal 2014, including: moderate revenue growth; all four sectors in their EBITDA mar-gin ranges, due in part to the productivity gains described above; pricing pressure in the range of 2.5% to 3.0% per year; and moderate cost increases including wage developments. In addition, we expect that influences on profitability from acqui-sitions and disposals will be broadly offsetting over the next two fiscal years. We expect acquisitions to be highly accretive to profitability in the medium term.
For fiscal 2013, we expect income from continuing opera-tions in the range from €4.5 to €5.0 billion, including the ef-fect of early adoption of International Accounting Standard 19 Revised (IAS 19R). Based on our above-mentioned goal of a To-tal Sectors profit margin of at least 12% by fiscal 2014, we ex-pect fiscal 2014 income from continuing operations to show strong improvement compared to fiscal 2013. This forecast ex-cludes impacts related to legal and regulatory matters and sig-nificant portfolio effects.
Results of operations in fiscal 2013 will include adoption of IAS 19R. We anticipate that IAS 19R will significantly impact Income
from continuing operations, due primarily to an increase in cen-trally carried pension expense within Corporate items and pensions. We adopted IAS 19R after the close of fiscal 2012, on a retrospective basis. On a preliminary basis, had IAS 19R been ap-plied in fiscal 2012, the impact on Income from continuing op-erations for fiscal 2012 would have been approximately a negative €0.3 billion after tax, resulting in Income from continu-ing operations of approximately €4.9 billion for fiscal 2012. For fiscal 2013, we expect pension expense on a similar level com-pared to fiscal 2012, including the effect of IAS 19R in both years.
We are exposed to currency translation effects, involving the US$, British £ and currencies of emerging markets such as China, India and Brazil. We expect volatility in global currency markets to continue in fiscal 2013. Given that Siemens is a net exporter from the Eurozone to the rest of world, a weak Euro is principally favorable for our business and a strong Euro is prin-cipally unfavorable. Through adaptation of our production facil-ities during the recent past, we have improved our natural hedge on a global basis. In addition, we have already systemati-cally addressed the remaining currency risk in our export busi-ness activities for fiscal 2013, see note 31 in d.6 notes to Con-
soLidated FinanCiaL statements. We expect these steps to help to limit effects on income related to currency in fiscal 2013.
Our most important financial goal is capital efficiency, which we measure in terms of adjusted return on capital employed (ROCE (adjusted)). Due mainly to our expectations regarding the development of income from continuing operations, we expect ROCE (adjusted) on a continuing basis around the lower end of our target range of 15% to 20% in fiscal 2013, and in the upper half of the range in fiscal 2014. This expectation ex-cludes significant portfolio effects, in particular potential ac-quisitions, which may substantially increase our capital em-ployed and therefore reduce ROCE. For further information see
C.2 FinanCiaL perFormanCe measures.
We intend to continue providing an attractive return to share-holders. In the years ahead we intend to propose a dividend payout which, combined with outlays for share buybacks dur-ing the fiscal year, results in a sum representing 40% to 60% of Net income, which for this purpose we may adjust to exclude exceptional non-cash effects.
Financial positionWe intend to remain conservative with regard to our financial position, including liquidity, in order to maintain operational and strategic flexibility. We expect Free cash flow from con-tinuing operations in fiscal 2013 and 2014 to be burdened by substantial cash outflows related to the program-related charg-es included in our “Siemens 2014” program as discussed above. For Free cash flow, we anticipate that the recent trend of some-

135 D. Consolidated Financial Statements 239 E. Additional Information
130 C.11 Siemens AG (Discussion on basis of German Commercial Code)
134 C.12 Notes and forward-looking statements
129 C.10 Compensation Report, Corporate Governance statement pursuant to Section 289a of the German Commercial Code, Takeover-relevant information and explanatory report
115
what lower prepayments will continue, as customers seek to maintain their liquidity. Along with these effects, we expect continued significant outflows for investing activities in the next two years. SFS intends to continue with its growth strate-gy focused on the business areas of our Sectors. Furthermore, we expect significant outflows for strengthening our core ac-tivities in connection with “Siemens 2014.” This already in-cludes our previously announced acquisition of LMS for ap-proximately €0.7 billion. For comparison, we spent €1.3 billion for acquisitions in fiscal 2012. Among the planned divestments mentioned above, the intended method of divesting OSRAM, through a spin-off of the majority of shares to shareholders in fiscal 2013, will have no cash impact on our financial position.
We intend to maintain our focus on net working capital man-agement as an important factor within operating activities, and on investments in intangible and tangible assets within cash used in investing activities. For both net working capital and capital investments in intangible assets and property, plant and equipment, we take into account both the macro-economic environment and our own order growth. We will re-tain our stringent approval process for capital investments, which goes up to the Managing Board. For further informa-tion, see C.4.4 CapitaL resourCes and requirements.
In the area of investment planning, we expect to continue in-vesting in our established markets, such as to safeguard mar-ket share and competitive advantages based on technological innovation. We will also continue investing in emerging mar-kets, such as for increasing our capacities for designing, manu-facturing and marketing new solutions within these markets. With regard to capital expenditures of our Sectors in property plant and equipment and intangible assets, we expect fiscal 2013 spending on the level of fiscal 2012.
Energy plans to invest mainly in innovation and in expanding its global footprint to secure organic growth and competitive-ness by achieving cost leadership. These investments include further spending in the extension of capacities and facilities such as for the technology-driven wind power market, particu-larly in northern Europe. The Healthcare Sector continues to invest in property, plant and equipment and intangible assets including developing and implementing software and IT solu-tions relating mainly to the medical imaging, therapy systems and laboratory diagnostics businesses. The Industry Sector in-tends with its investments mostly to strengthen its regional footprint in emerging markets. This includes further invest-ments in replacing products and ramping up capacities, partic-ularly at Industry Automation in China, and implementing ad-ditional productivity measures, particularly at Drive Technolo-gies. The Infrastructure & Cities Sector plans to strengthen its regional footprint in emerging markets and its position in fast-
growing market segments. This includes innovation projects at low- and medium-voltage as well as investments related to larger projects at Rail Systems.
With our ability to generate positive operating cash flows, our total liquidity of €11.415 billion as of September 30, 2012, our €6.8 billion in undrawn lines of credit and our credit ratings at year-end, we believe that we have sufficient flexibility to fund our capital requirements including scheduled debt service, regular capital spending, ongoing cash requirements from op-erating and SFS financing activities, dividend payments, pen-sion plan funding and portfolio activities. Also in our opinion, our working capital is sufficient for the Company’s present re-quirements.
For the medium-term we set ourselves a target for our capital structure, defined as the ratio of adjusted industrial net debt to adjusted EBITDA. We seek to achieve a ratio in the range of 0.5 to 1.0. In fiscal 2012 we exercised the flexibility built into our capital structure for achieving other goals, including share buybacks, resulting in a ratio of 0.24. We expect to increase this ratio during the next two fiscal years.
C.9.1.4 segmentsAs for the Group, our outlook for our segments is based on the above-mentioned expectations regarding the overall economic situation and specific market conditions over the next two fiscal years.
For fiscal 2013, we expect orders to increase on an organic ba-sis year-over-year. We expect Total Sectors organic revenue in 2013 to approach the level reached in fiscal 2012. In particular, we expect a revenue decline in Energy due in part to order de-velopment in fiscal 2012, when the Sector’s book-to-bill ratio was below one. We anticipate that a challenging market en-vironment will continue to hold back revenue development in Industry. Revenue in fiscal 2013 is expected to rise slightly year-over-year in Healthcare and Infrastructure & Cities. While we expect Total Sectors organic revenue to return to moderate growth in fiscal 2014, this expectation is dependent particular-ly on businesses that are sensitive to short-term changes in the economic environment.
Overall, volume development in our Sectors in the next two fiscal years is expected to include pricing pressure, particularly in Healthcare and Energy. We expect pricing pressure in fiscal 2013 to be at a level similar to fiscal 2012.
We expect Total Sectors profit in fiscal 2013 to be impacted by the charges mentioned above related to the “Siemens 2014” program, totaling approximately €1.0 billion. Including their respective portions of these charges, profit at Industry and

1 A. To our Shareholders 21 B. Corporate Governance 49 C. Combined Management Report
50 C.1 Business and economic environment 64 C.2 Financial performance measures 69 C.3 Results of operations 82 C.4 Financial position 93 C.5 Net assets position
95 C.6 Overall assessment of the economic position 96 C.7 Subsequent events 97 C.8 Sustainability 111 C.9 Report on expected developments and
associated material opportunities and risks
116
Infrastructure & Cities is expected to decline year-over-year. We expect profit at Energy to increase year-over-year despite pro-gram-related charges, because the basis of comparison in fiscal 2012 includes substantial profit impacts related to large complex projects and a change in credit risk assessment for Iran. We expect that Healthcare will increase its profit year-over-year, despite further charges related to its Agenda 2013 initiative, in part because the Sector will benefit from the ini-tiative’s productivity measures which have been implemented from the beginning of fiscal 2012.
Looking ahead to fiscal 2014, we expect all four Sectors to in-crease their profit compared to fiscal 2012, as part of our inten-tion to raise our Total Sectors profit margin to at least 12% by fiscal 2014. We anticipate that these results will be based most-ly on the productivity improvements we intend to achieve with the “Siemens 2014” program, combined with sharply lower program-related charges in fiscal 2014 compared to fiscal 2013.
As part of One Siemens, we have defined adjusted EBITDA margin corridors for the respective industries of our four Sec-tors, which the Sectors seek to achieve and maintain through-out the complete business cycle. For further information see
C.2 FinanCiaL perFormanCe measures. For Energy the margin corridor is 10% to 15%; for Healthcare the margin corridor is 15% to 20%; for Industry the margin corridor is 11% to 17%; and for Infrastructure & Cities the margin corridor is 8% to 12%. De-spite the substantial charges we expect in fiscal 2013 related to the “Siemens 2014” program, we expect that only Infrastruc-ture & Cities will remain below its corridor in fiscal 2013. Based on anticipated productivity improvements, we expect all four Sectors to be within their EBITDA corridors by fiscal 2014.
We expect that Equity Investments will result in substantially lower losses in fiscal 2013 compared to fiscal 2012, which was impacted by charges largely related to the repositioning mea-sures at NSN mentioned above. We expect these charges to be substantially lower in the next two years.
In the next two fiscal years, SFS intends to continue to expand its efforts to meet the growing demand for financial solutions, particularly with regard to the business-to-business area that involves both Siemens and external customers. Within One Siemens, the target range for return on equity or ROE (after tax) for SFS is 15% to 20%. We expect that SFS will continue to reach this range in both fiscal 2013 and 2014. With regard to profit (defined as income before income taxes), we anticipate that fiscal 2013 profit will be slightly below the level of fiscal 2012, which included a gain of €78 million on the sale of an in-vestment.
We expect that SRE will continue with real estate disposals de-pending on market conditions, as it has in the past two years. We expect results from Corporate items and pensions in fiscal 2013 to be approximately a negative €1 billion.
C.9.1.5 overaLL assessmentIn fiscal 2013, Siemens begins implementation of “Siemens 2014,” a company-wide program supporting our One Siemens framework for sustainable value creation. The goal of the pro-gram is to raise our Total Sectors profit margin to at least 12% by fiscal 2014.
In the first year of the program, we expect moderate order growth and revenue approaching the level of fiscal 2012, both on an organic basis. We expect income from continuing opera-tions in the range from €4.5 to €5.0 billion, including the ef-fect of retrospective adoption of IAS 19R. This includes charges totaling approximately €1.0 billion for program-related produc-tivity measures in the Sectors, with the productivity gains real-ized in our results for fiscal 2014.
This outlook is based on a number of conditions, notably that revenue develops as expected particularly for businesses that are sensitive to short-term changes in the economic environ-ment. Furthermore, it excludes impacts related to legal and regulatory matters and significant portfolio effects. Overall, the actual development for Siemens and its Segments may vary, positively or negatively from our expectations due to the risks and opportunities described below. See C.9.3 risks as well as C.9.4 opportunities. This report on expected devel-opments should be read in conjunction with C.12 notes and
Forward-Looking statements.
C.9.2 Risk management
C.9.2.1 basiC prinCipLes oF the risk managementOur risk management policy stems from a philosophy of pur-suing sustainable growth and creating economic value while avoiding and managing inappropriate risks. As risk manage-ment is an integral part of how we plan and execute our busi-ness strategies, our risk management policy is set by the Man-aging Board. Our organizational and accountability structure requires each of the respective managements of our Sectors, SFS, SRE, regional Clusters and Corporate Units to implement risk management programs that are tailored to their specific industries and responsibilities, while being consistent with the overall policy established by the Managing Board.

135 D. Consolidated Financial Statements 239 E. Additional Information
130 C.11 Siemens AG (Discussion on basis of German Commercial Code)
134 C.12 Notes and forward-looking statements
129 C.10 Compensation Report, Corporate Governance statement pursuant to Section 289a of the German Commercial Code, Takeover-relevant information and explanatory report
117
C.9.2.2 enterprise risk management proCessWe have implemented and coordinated a set of risk manage-ment and control systems which support us in the early recog-nition of developments jeopardizing the continuity of our business. The most important of these systems include our en-terprise-wide processes for strategic planning and manage-ment reporting. Strategic planning is intended to support us in considering potential risks well in advance of major business decisions, while management reporting is intended to enable us to monitor such risks more closely as our business pro-gresses. Our internal auditors regularly review the adequacy and effectiveness of our risk management system. According-ly, if deficits are detected, it is possible to adopt appropriate measures for their elimination. This coordination of processes and procedures is intended to help ensure that the Managing Board and the Supervisory Board are fully informed about sig-nificant risks in a timely manner.
Risk management at Siemens is based on a comprehensive, in-teractive and management-oriented Enterprise Risk Manage-ment (ERM) approach that is integrated into the organization and that addresses both risks and opportunities. Our ERM ap-proach is based on the worldwide accepted Enterprise Risk Management – Integrated Framework developed by the Com-mittee of Sponsoring Organizations of the Treadway Commis-sion (COSO). The framework connects the ERM process with our financial reporting process and is closely integrated in our internal control system. It considers a company ’s strategy, the efficiency and effectiveness of its business operations, the reli-ability of its financial reporting as well as compliance with rel-evant laws and regulations to be equally important.
The ERM process aims for early identification and evaluation of, and response regarding, risks and opportunities that could materially affect the achievement of our strategic, operational, financial and compliance objectives. Our ERM is based on a net risk approach, covering risks and opportunities remaining after the execution of existing control measures. In order to provide a comprehensive view on our business activities, risks and opportunities are identified in a structured way combining elements of both top-down and bottom-up approaches. Risks and opportunities are generally reported on a quarterly basis. This regular reporting process is complemented by an ad-hoc reporting process that aims to escalate critical issues in a time-ly manner. Relevant risks and opportunities are prioritized in terms of impact and likelihood, considering quantitative and / or qualitative perspectives. The bottom-up identification and prioritization process is supported by workshops with the respective management of the Sector, SFS, SRE, regional Clus-ter and Corporate Unit organizations. This top-down element ensures that potential new risks and opportunities are dis-cussed at the management level and are included in the sub-
sequent reporting process, if found to be relevant. Reported risks and opportunities are analyzed regarding potential cumu-lative effects and are aggregated at Sector, SFS, SRE, regional Cluster and corporate level.
Responsibilities are assigned for all relevant risks and opportuni-ties with the hierarchical level of responsibility depending on the significance of the respective risk or opportunity. In a first step, assuming responsibility for a specific risk or opportunity in-volves deciding upon one of our general response strategies, or a combination of them. Our general response strategies with re-spect to risks are avoidance, transfer, reduction or acceptance of the relevant risk. Our general response strategies with respect to opportunities are partial or complete realization of the relevant opportunity. In a second step, responsibility for a risk or opportu-nity also involves the development, initiation and monitoring of appropriate response measures corresponding to the chosen re-sponse strategy. These response measures have to be specifical-ly tailored to allow for effective risk management. Accordingly, we have developed a variety of response measures with different characteristics: For example, we mitigate the risk of fluctuations in currency and interest rates by engaging in hedging activities. Regarding our long-term projects, systematic and comprehen-sive project management with standardized project milestones, including provisional acceptances during project execution, and complemented by clearly defined approval processes assists us in identifying and responding to project risks at an early stage, even before entering the bidding phase. Furthermore, we main-tain appropriate insurance levels for potential cases of damage and liability risks in order to reduce our exposure to such risks and to avoid or minimize potential losses. Among others, we ad-dress the risk of fluctuations in economic activity and customer demand by closely monitoring the macroeconomic conditions and developments in relevant industries, and by adjusting ca-pacity and implementing cost-reduction measures in a timely and consistent manner, if deemed necessary.
C.9.2.3 risk management organization and responsibiLitiesTo oversee the ERM process and to further drive the integration and harmonization of existing control activities to align with le-gal and operational requirements, the Managing Board estab-lished a Corporate Risk and Internal Control Department, head-ed by the Chief Risk & Internal Control Officer, and a Corporate Risk and Internal Control Committee (CRIC). The CRIC obtains risk and opportunity information from the Risk Committees es-tablished at the Sector, SFS, SRE and regional Cluster level as well as from the Heads of Corporate Units, which then forms the basis for the evaluation of the company-wide risk and op-portunity situation. The CRIC reports to and supports the Man-aging Board on matters relating to the implementation, opera-tion and oversight of the risk and internal control system and

1 A. To our Shareholders 21 B. Corporate Governance 49 C. Combined Management Report
50 C.1 Business and economic environment 64 C.2 Financial performance measures 69 C.3 Results of operations 82 C.4 Financial position 93 C.5 Net assets position
95 C.6 Overall assessment of the economic position 96 C.7 Subsequent events 97 C.8 Sustainability 111 C.9 Report on expected developments and
associated material opportunities and risks
118
assists the Managing Board in reporting to the Audit Commit-tee of the Supervisory Board. The CRIC is composed of the Chief Risk & Internal Control Officer, as the chairperson, and mem-bers of senior management such as the Sector and SFS CEOs, the CFO of Siemens, and selected Heads of Corporate Units.
C.9.3 Risks
Below we describe the risks that could have a material adverse effect on our business, our financial condition and results of operations, the price of our shares and American depository shares (ADS), and our reputation. The order in which the risks are presented in each of the four categories reflects the cur-rently estimated relative exposure for Siemens associated with these risks and thus provides an indication of the risks’ current importance to us. Nevertheless, risks currently considered to entail a lower risk exposure could potentially result in a higher negative impact on Siemens than risks currently considered to entail a higher risk exposure. Additional risks not known to us or that we currently consider immaterial may also negatively impact our business operations. We do not expect to incur any risks that alone or in combination would appear to jeopardize the continuity of our business.
C.9.3.1 strategiC risksWe operate in highly competitive markets, which are subject to price pressures and rapid changes: The world-wide markets for our products and solutions are highly com-petitive in terms of pricing, product and service quality, devel-opment and introduction time, customer service and financing
terms. In many of our businesses, we face downward price pressure and we are or could be exposed to market downturns or slower growth, which may increase in times of declining in-vestment activities and consumer demand. We face strong competitors, some of which are larger and may have greater re-sources in a given business area, as well as competitors from emerging markets, which may have a better cost structure. Some industries in which we operate are undergoing consoli-dation, which may result in stronger competition and a change in our relative market position. Certain competitors might be more effective and faster in capturing available market oppor-tunities, which in turn may negatively impact our market share. These factors alone or in combination may negatively impact our business, financial condition, and results of operations.
Our business, financial condition and results of opera-tions may be affected by the uncertainties of economic and political conditions, particularly in the current mac-roeconomic environment, which is characterized by the continuing crisis in financial markets and the potential threat of a global economic downturn: Our business envi-ronment is influenced by conditions in the domestic and glob-al economies. Since the second half of fiscal 2011, we have seen a high degree of volatility in the global financial markets, primarily as a result of the ongoing Eurozone sovereign debt crisis. The uncertainty in the macroeconomic environment be-came more and more present in our business segments result-ing in a more challenging overall business climate in fiscal 2012. Future economic developments and, in consequence, the speed of macroeconomic growth and the sustainability of our market environment are dependent upon the evolution of
operationaL and organizationaL struCture oF the enterprise risk management (erm) proCess
1 The term Sector in this chart comprises Sectors, SFS and SRE.
Implement ERM system and ensure management and monitoring of risks and opportunities in their respective organization.
Oversees the effectiveness of the risk management and internal control system.
Audit Committee
Oversee the risk and internal control activities for their area of responsibility and provide the Management with information necessary to report to the CRIC.
Sector Risk & Internal Control Committees
Cluster Risk & Internal Control Committees
Heads of Corporate UnitsSector Management 1 Cluster Management
Overall responsibility for the Risk and Internal Control System. Defines risk policy and ERM strategy.
Managing Board
Chairman of the CRIC. Defines and monitors application of ERM strategy, policy and methodology. Consolidates Siemens wide risk and opportunity
profile for CRIC.
Reports to and supports the Managing Board in matters relating to the implementation, operation and oversight of an effective
Risk and Internal Control System.
Corporate Risk & Internal Control Committee (CRIC) Chief Risk & Internal Control Officer

135 D. Consolidated Financial Statements 239 E. Additional Information
130 C.11 Siemens AG (Discussion on basis of German Commercial Code)
134 C.12 Notes and forward-looking statements
129 C.10 Compensation Report, Corporate Governance statement pursuant to Section 289a of the German Commercial Code, Takeover-relevant information and explanatory report
119
a number of global and local factors such as the crisis in the credit markets, economic crises arising from sovereign debt overruns, and government budget consolidation measures re-lated thereto, reduced levels of capital expenditures, declining consumer and business confidence, increasing unemployment in certain countries, fluctuating commodity prices, bankrupt-cies, natural disasters, political crises and other challenges.
In light of the latest economic developments, the high degree of unemployment in certain countries, the level of public debt in the United States as well as in Greece, Ireland, Italy, Spain, Portugal and other European countries, uncertainties with re-spect to the stability of the emerging markets, especially the Chinese economy, and the potential impact of budget consoli-dation measures by governments around the world, the bases for our expectations relating to the overall economic situation and specific conditions in markets relevant to us are subject to considerable uncertainties. In general, due to the significant proportion of long-cycle businesses in our Sectors and the im-portance of long-term contracts for Siemens, there is usually a time lag between the development of macroeconomic condi-tions and their impact on our financial results. Important ex-ceptions include our short-cycle businesses in the Industry Sector, particularly those in Industry Automation and parts of Drives Technologies, as well as parts of the Power Grid Solu-tions & Products Business within the Infrastructure & Cities Sec-tor, which are highly sensitive to volatility in market demand. If the macroeconomic environment deteriorates further and if we are not successful in adapting our production and cost structure to subsequent changes to conditions in the markets, in which we operate, there can be no assurance that we will not experience adverse effects that may be material to our business, financial condition, results of operations and our ability to access capital. For example, it may become more dif-ficult for our customers to obtain financing and as a result they may modify, delay or cancel plans to purchase our products and services or to execute transactions. Furthermore, prices may decline as a result of adverse market conditions to a great-er extent than currently anticipated. In addition, contracted payment terms, especially regarding the level of advance pay-ments by our customers relating to long-term projects, may become less favorable, which could negatively impact our cash flows. Additionally, if customers are not successful in generating sufficient revenue or securing access to the capital markets, they may not be able to pay, or may delay payment of, the amounts they owe us, which may adversely affect our business, financial condition and results of operations.
Numerous other factors, such as fluctuations of energy and raw material prices, as well as global political conflicts, including those in the Middle East, North Africa and other regions, con-tinue to impact macroeconomic parameters and the interna-
tional capital and credit markets. The uncertainty of economic and political conditions can have a material adverse impact on our business, financial condition and results of operations and can also make our budgeting and forecasting more difficult.
Our business is affected by a variety of market conditions and regulations. For example, our Energy Sector is exposed to the development of global demand for energy and is considerably affected by regulations related to energy and environmental policies. Our Healthcare Sector, in turn, is dependent on devel-opments and regulations in healthcare systems around the world, particularly in the important U.S. healthcare market. Our Industry Sector is vulnerable to unfavorable market conditions in certain segments of the automotive and manufacturing in-dustries. Our Infrastructure & Cities Sector focuses, among oth-er things, on business with public authorities around the world and is thus vulnerable to restrictions in public budgets.
Our businesses must keep pace with technological changes and develop new products and services to re-main competitive: The markets in which our businesses op-erate experience rapid and significant changes due to the in-troduction of innovative technologies. To meet our customers’ needs in these areas, we must continuously design new, and update existing products and services, and invest in, and de-velop new technologies. Introducing new products and tech-nologies requires a significant commitment to research and development, which in return requires expenditure of consid-erable financial resources that may not always result in suc-cess. Our sales and profitability may suffer if we invest in tech-nologies that do not operate, or may not be integrated, as ex-pected or that are not accepted in the marketplace as anticipat-ed, or if our products or systems are not introduced to the market in a timely manner, in particular, compared to our com-petitors, or become obsolete. We constantly apply for new patents and actively manage our intellectual property portfolio to secure our technological position. However, our patents and other intellectual property may not prevent competitors from independently developing or selling products and services similar to or duplicate of ours. There can be no assurance that the resources invested by us to protect our intellectual proper-ty will be sufficient or that our intellectual property portfolio will adequately deter misappropriation or improper use of our technology. Furthermore, in some of our markets, the need to develop and introduce new products rapidly in order to capture available opportunities may lead to quality problems. Our op-erating results depend to a significant extent on our ability to anticipate and adapt to changes in markets and to reduce the costs of producing high-quality, new and existing products. As one of the latest technology trends we carefully estimate the potential and relevance of cloud computing. We believe that the potential and usage scenarios of this technology vary

1 A. To our Shareholders 21 B. Corporate Governance 49 C. Combined Management Report
50 C.1 Business and economic environment 64 C.2 Financial performance measures 69 C.3 Results of operations 82 C.4 Financial position 93 C.5 Net assets position
95 C.6 Overall assessment of the economic position 96 C.7 Subsequent events 97 C.8 Sustainability 111 C.9 Report on expected developments and
associated material opportunities and risks
120
between our products, solutions and services depending on the degree of information technology utilized. However, we al-so believe that this trend needs to be monitored closely, be-cause it might bear the potential to change the competitive landscape. Any inability to adapt to the factors aforementioned could have a material adverse effect on our business, financial condition and results of operations.
Our business, financial condition and results of opera-tions may be adversely affected by continued strategic alignments and cost-cutting initiatives: We are in a con-tinuous process of strategic alignments and constantly engage in cost-cutting initiatives, including in connection with ongo-ing capacity adjustment measures and structural initiatives. Capacity adjustments through consolidation of business activi-ties and manufacturing facilities, and the streamlining of prod-uct portfolios are also part of these cost reduction efforts. These measures may not be implemented as planned, may turn out to be less effective than anticipated, may only become effective later than estimated or may not become effective at all. Each of these factors alone or in combination may nega-tively impact our business, financial condition, and results of operations. Any future contribution of these measures to our profitability will be influenced by the actual savings achieved and by our ability to sustain these ongoing efforts.
Our business, financial condition and results of opera-tions may be adversely affected by portfolio measures: Our strategy includes divesting activities in some business areas and strengthening others through portfolio measures, including mergers and acquisitions.
With respect to dispositions, we may not be able to divest some of our activities as planned, and the divestitures we do carry out could have a negative impact on our business, financial condi-tion, results of operations and, potentially, our reputation. For example, we have announced to divest OSRAM, our solar busi-ness and the business activities included in the Industry Sec-tor’s Water Technologies Business Unit, which as of September 30, 2012 was part of the Industry Automation Division.
Mergers and acquisitions are inherently risky because of diffi-culties that may arise when integrating people, operations, technologies and products. There can be no assurance that any of the businesses we acquire can be integrated successful-ly and as timely as originally planned or that they will perform well once integrated. In addition, we may incur significant ac-quisition, administrative and other costs in connection with these transactions, including costs related to integration of acquired businesses. Furthermore, portfolio measures may result in additional financing needs and adversely affect our fi-
nancial leverage and our debt-to-equity ratio. Acquisitions may also lead to substantial increases in intangible assets, includ-ing goodwill. Our Statements of Financial Position reflects a significant amount of intangible assets, including goodwill. Among our businesses, the largest amount of goodwill is allo-cated to the Diagnostics Division and the Imaging & Therapy Division of the Healthcare Sector, and the Industry Automation Division of the Industry Sector. In fiscal 2010, the annual test for impairment of goodwill of the Diagnostics Division within the Healthcare Sector was performed as of September 30, 2010. As a result, in the Diagnostics Division of the Healthcare Sector an impairment of €1,145 million was recognized to re-duce the carrying amount of goodwill. If we were to encounter continuing adverse business developments including negative effects on our revenues, profits or cash, or adverse effects from an increase in the weighted average cost of capital (WACC) or from foreign exchange rate developments, or if we were other-wise to perform worse than expected at acquisition, then these intangible assets, including goodwill, might have to be written off, which could materially and adversely affect our business, financial condition and results of operations. The likelihood of such adverse business developments increases in times of difficult or uncertain macroeconomic conditions.
Our business, financial condition and results of opera-tions may be adversely affected by our equity interests, other investments and strategic alliances: Our strategy includes strengthening our business interests through joint ventures, associated companies and strategic alliances. Cer-tain of our investments are accounted for using the equity method, including, among others, NSN, EN and BSH. Further-more we hold other investments, for example Atos S.A. Any factors negatively influencing the profitability of our equity and other investments, including negative effects on reve-nues, profits or cash, could have an adverse effect on our eq-uity pick-up related to these equity interests or may result in a write-off of these investments. In addition, our business, fi-nancial condition and results of operations could also be ad-versely affected in connection with loans, guarantees or non-compliance with financial covenants related to these equity and other investments. Furthermore, such investments are in-herently risky as we may not be able to sufficiently influence corporate governance processes or business decisions taken by our equity investments, other investments and strategic al-liances that may have a negative effect on our business. In ad-dition, joint ventures bear the risk of difficulties that may arise when integrating people, operations, technologies and prod-ucts. Strategic alliances may also pose risks for us because we compete in some business areas with companies with which we have strategic alliances.

135 D. Consolidated Financial Statements 239 E. Additional Information
130 C.11 Siemens AG (Discussion on basis of German Commercial Code)
134 C.12 Notes and forward-looking statements
129 C.10 Compensation Report, Corporate Governance statement pursuant to Section 289a of the German Commercial Code, Takeover-relevant information and explanatory report
121
We are subject to changes of regulations, laws and poli-cies concerning our products: As a diversified company with global businesses we are exposed to various product re-lated regulations, laws and policies influencing our processes. Recently, some jurisdictions around the world have adapted certain regulations, laws and policies requiring us to extend our recycling efforts, limit the sourcing and usage of certain raw materials and request additional due diligences and dis-closures on sourcing and usage of the regulated raw materials. In particular, there is new U.S. legislation to improve transpar-ency and accountability concerning the sourcing of “conflict minerals” from mines located in the conflict zones of the Dem-ocratic Republic of Congo (DRC) and its adjoining countries. The term “conflict minerals” currently encompasses tantalum, tin, tungsten (or their ores) and gold. Conflict minerals can be found in a vast array of products. This U.S. legislation requires manufacturers, such as us, to investigate and disclose their use of any conflict minerals originating in the DRC or adjoining countries. It also implements guidelines to assist the manufac-turer in preventing, by way of performing due diligence in its supply chain, any such sourcing from potentially financing or benefitting armed groups in this area. We are currently evalu-ating the potential impact of, and developing an implementa-tion strategy for, the above-referenced legislation. As we are operating within highly complex value chains, we may be re-quired to undertake a significant due diligence process requir-ing considerable investments of human resources and financ-es in order to comply with the conflict minerals due diligence and disclosure requirements. If our (sub) suppliers are unable or unwilling to provide us with requested information and to take other steps to ensure that no conflict minerals, financing or benefitting armed groups in the DRC, are included in miner-als or components supplied to us, we may be forced to disclose in our SEC filings about the use of conflict minerals in our sup-ply chain, which may expose us to reputational risks. In addi-tion, since the applicability of the new conflict minerals legis-lation is limited to companies publicly listed in the U.S., not all of our competitors need to comply with this legislation or un-dertake similar efforts to disclose the usage of conflict miner-als. If we are unable to achieve sufficient confidence along our supply chain, or if any of these risks or similar risks associated with such kinds of regulations, laws and policies were to mate-rialize, our reputation, business, financial condition and re-sults of operations could be materially adversely affected.
C.9.3.2 operations risksOur business, financial condition and results of opera-tions may be adversely affected by cost overruns or addi-tional payment obligations related to the management of our long-term, fixed price or turnkey projects: We per-form a portion of our business, especially large projects, under long-term contracts that are awarded on a competitive bidding
basis. Some of these contracts are inherently risky because we may assume substantially all of the risks associated with com-pleting the project and the post-completion warranty obliga-tions. For example, we face the risk that we must satisfy techni-cal requirements of a project even though we may not have gained experience with those requirements before we win the project. The profit margins realized on fixed-priced contracts may vary from original estimates as a result of changes in costs and productivity over their term. We sometimes bear the risk of unanticipated project modifications, shortage of key personnel, quality problems, financial difficulties of our customers, cost overruns or contractual penalties caused by unexpected tech-nological problems, unforeseen developments at the project sites, unforeseen changes or difficulties in the regulatory or po-litical environment, performance problems with our suppliers, subcontractors and consortium partners or other logistical dif-ficulties. Certain of our multi-year contracts also contain de-manding installation and maintenance requirements in addi-tion to other performance criteria relating to timing, unit cost and compliance with government regulations requirements, which, if not satisfied, could subject us to substantial contrac-tual penalties, damages, non-payment and contract termina-tion. There can be no assurance that contracts and projects, in particular those with long-term duration and fixed-price calcu-lation, can be completed profitably.
Increased IT security threats and higher levels of profes-sionalism in computer crime could pose a risk to our sys-tems, networks, products, solutions and services as well as to those of our service providers: Our business portfolio includes a broad array of systems, networks, products, solu-tions and services across our Sectors that rely on digital tech-nologies. We observe a global increase in IT security threats and higher levels of professionalism in computer crime, which pose a risk to the security of systems and networks and the confidentiality, availability and integrity of data. We attempt to mitigate these risks by employing a number of measures, in-cluding employee training, comprehensive monitoring of our networks and systems, and maintenance of backup and protec-tive systems such as firewalls and virus scanners. To the extent we employ service providers, such as in the area of IT infra-structure, we have contractual arrangements in place in order to ensure that these risks are reduced in a similar manner. Nonetheless, our systems, networks, products, solutions and services, as well as those of our service providers remain poten-tially vulnerable to attacks. Depending on their nature and scope, such attacks could potentially lead to the leakage of con-fidential information, improper use of our systems and net-works, manipulation and destruction of data, defective prod-ucts, production downtimes and supply shortages, which in turn could adversely affect our reputation, competitiveness, business, financial condition and results of operations.
1 A. To our Shareholders 21 B. Corporate Governance 49 C. Combined Management Report
50 C.1 Business and economic environment 64 C.2 Financial performance measures 69 C.3 Results of operations 82 C.4 Financial position 93 C.5 Net assets position
95 C.6 Overall assessment of the economic position 96 C.7 Subsequent events 97 C.8 Sustainability 111 C.9 Report on expected developments and
associated material opportunities and risks
122
We may face operational failures and quality problems in our value chain processes: Our value chain comprises all steps, from research and development to supply chain man-agement, production, marketing, sales and services. Operation-al failures in our value chain processes could result in quality problems or potential product, labor safety, regulatory or envi-ronmental risks. Such risks are particularly present in relation to our production and construction facilities, which are located all over the world and have a high degree of organizational and technological complexity. From time to time, some of the prod-ucts we sell might have quality issues resulting from the de-sign or manufacture of such products or from the software in-tegrated into them. Particularly our Healthcare Sector is subject to requirements of the U.S. Food and Drug Administration, which require certain efforts safeguarding our product quality. If we are not able to comply with these requirements our repu-tation, competitiveness, business, financial condition and re-sults of operations may be adversely affected.
Furthermore, failures on the part of service providers we em-ploy, such as in the area of IT, may have an adverse effect on our processes and operations and our ability to meet our com-mitments to customers or increase our operating costs. Any operational failures or quality issues could have a material ad-verse effect on our business, financial condition and results of operations.
We are dependent upon hiring, developing and retain-ing highly qualified management and technical person-nel: Competition for highly qualified personnel remains intense in the industries and regions in which our business operates. In many of our business areas, we intend to expand our business activities, for which we will need highly skilled employees. Our future success depends in part on our continued ability to hire, integrate, develop and retain engineers and other qualified per-sonnel. There can be no assurance that we will continue to be successful in attracting and retaining all the highly qualified employees and key personnel needed in the future, including in appropriate geographic locations, and any inability to do so could have a material adverse effect on our business.
We may face interruption of our supply chain, including the inability of third parties to deliver parts, compo-nents and services on time, and we may be subject to rising raw material prices: Our financial performance de-pends in part on reliable and effective supply chain manage-ment for components, sub-assemblies and other materials. Ca-pacity constraints and supply shortages resulting from ineffec-tive supply chain management may lead to delays and addi-tional cost. We rely on third parties to supply us with parts, components and services. Using third parties to manufacture, assemble and test our products reduces our control over man-
ufacturing yields, quality assurance, product delivery sched-ules and costs. The third parties that supply us with parts and components also have other customers and may not have suf-ficient capacity to meet all of their customers’ needs, including ours, during periods of excess demand. Component supply de-lays can affect the performance of our Sectors. Although we work closely with our suppliers to avoid supply-related prob-lems, there can be no assurance that we will not encounter supply problems in the future or that we will be able to replace a supplier that is not able to meet our demand. This risk is par-ticularly evident in businesses with a very limited number of suppliers. Shortages and delays could materially harm our business. Unanticipated increases in the price of components or raw materials due to market shortages or other reasons could also adversely affect the performance of our Sectors. Furthermore, we may be exposed to the risk of delays and in-terruptions of the supply chain as a consequence of natural di-sasters in case we are unable to identify alternative sources of supply in a timely manner or at all. A general shortage of mate-rials, components or sub-components as a result of natural di-sasters also bears the risk of unforeseeable fluctuations in pric-es and demand, which might adversely affect our results of op-erations.
Our Sectors purchase raw materials including so-called rare-earth metals, copper, steel, aluminum and oil, which exposes them to fluctuations in energy and raw material prices. In re-cent times, commodities have been subject to volatile markets, and such volatility is expected to continue. If we are not able to compensate for our increased costs or pass them on to cus-tomers, price increases could have a material adverse impact on our financial results. In contrast, in times of falling com-modity prices, we may not fully profit from such price decreas-es as we attempt to reduce the risk of rising commodity prices by several means, such as long-term contracting or physical and financial hedging. In addition to price pressure that we may face from our customers expecting to benefit from falling commodity prices or adverse market conditions, this could al-so adversely affect our business, financial condition and re-sults of operations.
C.9.3.3 FinanCiaL risksWe are exposed to currency risks and interest rate risks: We are exposed to fluctuations in exchange rates, especially between the U.S. dollar and the euro, because a high percent-age of our business volume is conducted in the U.S. and as ex-ports from Europe. In addition, we are exposed to currency ef-fects involving the currencies of emerging markets, in particu-lar the Chinese Yuan. As a result, a strong euro in relation to the U.S. dollar and other currencies could have an adverse im-pact on our revenues and results of operations. Certain curren-cy risks as well as interest rate risks are hedged on a Company-

135 D. Consolidated Financial Statements 239 E. Additional Information
130 C.11 Siemens AG (Discussion on basis of German Commercial Code)
134 C.12 Notes and forward-looking statements
129 C.10 Compensation Report, Corporate Governance statement pursuant to Section 289a of the German Commercial Code, Takeover-relevant information and explanatory report
123
wide basis using derivative financial instruments. Depending on the development of foreign currency exchange and interest rates, our hedging activities could have significant effects on our cash flow. Our Sectors and Financial Services (SFS) engage in currency hedging activities which sometimes do not qualify for hedge accounting. In addition, our Corporate Treasury has interest rate hedging activities which do not qualify for hedge accounting either, and are subject to changes in interest rates. Accordingly, exchange rate and interest rate fluctuations may lead to higher volatility and adverse effects on our business, fi-nancial conditions and results of operations. A strengthening of the euro (particularly against the U.S. dollar) may change our competitive position, as many of our competitors may ben-efit from having a substantial portion of their costs based in weaker currencies, enabling them to offer their products at lower prices.
We are exposed to volatile credit spreads: Regarding our Corporate Treasury activities, widening credit spreads due to uncertainty and risk aversion in the financial markets might lead to adverse changes of fair market values of our financial assets, in particular concerning our derivative financial instru-ments. In addition, we see a risk of widening credit spreads leading to increasing refinancing costs if the Eurozone sover-eign debt crisis with its ongoing significant impact on global financial markets and the European financial sector in particu-lar, continues or even worsens. Any such development could also further increase the costs for buying protection against credit risks due to a potential increase of counterparty risks.
Our future financing via Corporate Treasury may particu-larly be affected by the uncertainty of economic conditions and the development of capital and financial markets: Our Corporate Treasury is responsible for the financing of the Com-pany. Negative developments in the foreign exchange, money or capital markets, such as limited availability of funds (partic-ularly U.S. dollar funds), may increase our overall cost of fund-ing. The ongoing Eurozone sovereign debt crisis continues to have an impact on global capital markets. The resulting higher risk awareness of governments lead to more regulations on the use of financial instruments through (i) the Regulation on OTC derivatives, central counterparties and trade repositories (European Market Infrastructure Regulation) and (ii) other sim-ilar regulations in other jurisdictions, which may have an im-pact on the future availability or the costs of adequate hedging instruments for the company. It may even lead to further regu-lation of the financial sector and the use of financial instru-ments. Such further regulations could adversely influence our future possibilities of obtaining debt financing, and/or may sig-nificantly increase our refinancing costs. Deteriorating credit quality and/or default of business partners may adversely affect our business, financial conditions and results of operations.
Downgrades of our ratings could increase our cost of capital and could negatively affect our businesses: Our business, financial condition and results of operations are in-fluenced significantly by the actual and expected performance of the Sectors and SFS, as well as the Company ’s portfolio measures. An actual or expected negative development of our results of operations or cash flows or an increase in our net debt position could result in the deterioration of our credit rat-ing. Downgrades by rating agencies could increase our cost of capital, may reduce our potential investor base and may nega-tively affect our business, financial conditions and results of operations.
Our financing activities subject us to various risks, in-cluding credit, interest rate and foreign exchange risk: We provide our customers with various forms of direct and indirect financing in connection with large projects. We also finance a large number of customer orders, for example, the leasing of medical equipment, mainly through SFS. SFS also incurs credit risk by financing third-party equipment or by tak-ing direct or indirect participation in financings, such as syndi-cated loans. In part, we take a security interest in the assets we finance or we receive additional collateral. Our business, finan-cial conditions and results of operations may be adversely af-fected if the credit quality of our customers deteriorates or if they default on their payment obligation to us, if the value of the assets in which we have taken a security interest or addi-tional collateral declines, if interest rates or foreign exchange rates fluctuate, or if the projects in which we invest are unsuc-cessful. Potential adverse changes in economic conditions could cause a decline in the fair market values of assets, deriv-ative instruments as well as collateral, resulting in losses which could have an adverse effect on our business, financial condition and results of operations.
Our business, financial condition and results of opera-tions may be adversely affected by several parameters influencing the funded status of our pension benefit plans: The funded status of our pension plans may be affected by an increase or decrease in the defined benefit obligation (DBO), as well as by an increase or decrease in the value of plan assets. Pensions are accounted for in accordance with ac-tuarial valuations, which rely on statistical and other factors in order to anticipate future events. These factors include key pension plan valuation assumptions such as the discount rate, rate of future compensation increases and pension progres-sion. Actual developments may differ from assumptions due to changing market and economic conditions, thereby resulting in an increase or decrease in the DBO. Significant movements in financial markets or a change in the portfolio mix of invest-ed assets could result in corresponding increases or decreases in the value of plan assets, particularly equity securities. Also,

1 A. To our Shareholders 21 B. Corporate Governance 49 C. Combined Management Report
50 C.1 Business and economic environment 64 C.2 Financial performance measures 69 C.3 Results of operations 82 C.4 Financial position 93 C.5 Net assets position
95 C.6 Overall assessment of the economic position 96 C.7 Subsequent events 97 C.8 Sustainability 111 C.9 Report on expected developments and
associated material opportunities and risks
124
changes in pension plan assumptions could affect net periodic pension cost. For example, a change in discount rates may re-sult in changes in the net periodic benefit cost in the following financial year. In order to comply with local pension regula-tions in selected foreign countries, we may face a risk of in-creasing cash outflows to reduce an underfunding of our pen-sion plans in these countries, if any. Furthermore, changes in the accounting pronouncements concerning pensions could require adaptations in the way pension obligations are record-ed in our Consolidated Financial Statements and thus could have adverse effects on our business, financial conditions and results of operations.
For further information on financial risks and financial risk management see note 32 in d.6 notes to ConsoLidated Finan-
CiaL statements.
C.9.3.4 CompLianCe risksWe are subject to regulatory risks associated with our international operations: Protectionist trade policies and changes in the political and regulatory environment in the markets in which we operate, such as foreign exchange import and export controls, tariffs and other trade barriers and price or exchange controls, could affect our business in several na-tional markets, impact our sales and profitability and make the repatriation of profits difficult, and may expose us to penalties, sanctions and reputational damage. In addition, the uncertain-ty of the legal environment in some regions could limit our ability to enforce our rights. For example, as a globally operat-ing organization, we conduct business with customers in countries that are subject to export control regulations, embar-goes, sanctions or other forms of trade restrictions imposed by the U.S., the European Union or other countries or organiza-tions. The sanction regime against Iran was recently tightened further following the approval of the Council Regulation (EU) No. 267 / 2012 on March 23, 2012 concerning restrictive mea-sures against Iran and repealing Regulation (EU) No 961 / 2010 and the Implementing Regulation (EU) No. 945 / 2012 dated Oc-tober 15, 2012 that built thereupon, which lists 34 additional companies and institutions (primarily from the Oil and Gas in-dustry sector). In addition, the signing into law of the Ameri-can “Iran Threat Reduction and Syria Human Rights Act of 2012” on August 10, 2012 tightens the restrictions on the ability of non-U.S. companies to do business or trade with Iran and Syria and imposes additional disclosure obligations. As described in more detail under C.3.1.1 new orders and revenue, we have issued, and regularly update, restrictive internal guidelines governing business with customers in Iran. We may, however, still conduct certain business activities and provide products and services to customers in Iran under limited circumstances. Although we believe that our business activities have not had
a material negative impact on our reputation or share value, we cannot exclude any such impact in the future. New or tight-ened export control regulations, sanctions, embargos or other forms of trade restrictions imposed on Iran, Syria or on other sanctioned countries in which we do business may result in a curtailment of our existing business in such countries and in an adaptation of our policies. In addition, the termination of our activities in Iran, Syria or other sanctioned countries may expose us to customer claims and other actions.
We expect that sales to emerging markets will continue to ac-count for an increasing portion of our total revenue, as our busi-ness naturally evolves and as developing nations and regions around the world increase their demand for our offering. Emerging market operations involve various risks, including civil unrest, health concerns, cultural differences such as em-ployment and business practices, volatility in gross domestic product, economic and governmental instability, the potential for nationalization of private assets and the imposition of ex-change controls. The Asian markets, in particular, are important for our long-term growth strategy, and our sizeable operations in China are influenced by a legal system that is still developing and is subject to change. Our growth strategy could be limited by governments supporting local industries. Our Sectors, par-ticularly those that derive their revenue from large projects, could be adversely affected if future demand, prices and gross domestic product in the markets in which those Sectors operate do not develop as favorably as expected. If any of these risks or similar risks associated with our international operations were to materialize, our business, financial condition and results of operations could be materially adversely affected.
Current and future investigations regarding allegations of public corruption and other illegal acts could have a material adverse effect on our business, financial condi-tion and results of operations, the price of our shares and American depository shares (ADS) and our reputa-tion: We engage in a substantial amount of business with gov-ernments and government-owned enterprises around the world. We also participate in a number of projects funded by government agencies and intergovernmental and suprana-tional organizations such as multilateral development banks. If we are found to have been engaged in public corruption and other illegal acts, such activities may impair our ability to do business with these or other organizations. Corruption and re-lated proceedings may lead to criminal and civil fines as well as penalties, sanctions, injunctions against future conduct, profit disgorgements, disqualifications from directly and indirectly en-gaging in certain types of business, the loss of business licenses or permits or other restrictions. Accordingly, we may be required to record material provisions to cover potential liabilities arising

135 D. Consolidated Financial Statements 239 E. Additional Information
130 C.11 Siemens AG (Discussion on basis of German Commercial Code)
134 C.12 Notes and forward-looking statements
129 C.10 Compensation Report, Corporate Governance statement pursuant to Section 289a of the German Commercial Code, Takeover-relevant information and explanatory report
125
in connection with such investigations and proceedings, includ-ing potential tax penalties. Moreover, any findings related to public corruption that are not covered by the 2008 and 2009 corruption charge settlements which were concluded with American and German authorities may endanger these, further monitors could be appointed to review future business practices and we may otherwise be required to further modify our busi-ness practices and our compliance program.
Our involvement in ongoing and potential future corruption proceedings could damage our reputation and have an adverse impact on our ability to compete for business from public and private sector customers around the world. If we or our subsid-iaries are found to have engaged in certain illegal acts or not to have taken effective steps to address allegations or findings of corruption in our business, this may impair our ability to par-ticipate in business with governments or intergovernmental organizations and may result in our formal exclusion from such business. Even if we are not formally excluded from par-ticipating in government business, government agencies or intergovernmental or supranational organizations may infor-mally exclude us from tendering for or participating in certain contracts. For example, legislation of member states of the European Union could in certain cases result in our mandatory or discretionary exclusion from public contracts in case of a conviction for bribery and certain other offences or for other reasons. As described in more detail in note 29 in d.6 notes
to ConsoLidated FinanCiaL statements, we or our subsidiaries have in the past been excluded or currently are excluded from some contracting, including with governments, development banks and multilateral financial institutions, as a result of find-ings of corruption or other misconduct. Ongoing or potential future investigations into allegations of corruption could also impair existing relationships with, and our ability to acquire new, private sector business partners. For instance, such in-vestigations may adversely affect our ability to pursue poten-tially important strategic projects and transactions, such as strategic alliances, joint ventures or other business combina-tions, or could result in the cancellation of certain of our exist-ing contracts and third parties, including our competitors, could initiate significant third-party litigation.
In addition, future developments in ongoing and potential future investigations, such as responding to the requests of governmental authorities and cooperating with them, could divert management’s attention and resources from other is-sues facing our business. The materialization of any of these risks could have a material adverse effect on our business, fi-nancial condition and results of operations, the price of our shares and ADS and on our reputation.
Our business, financial condition and results of opera-tions could suffer as a result of current or future litiga-tion: We are subject to numerous risks relating to legal, gov-ernmental and regulatory proceedings to which we are cur-rently a party or to which we may become a party in the future. We routinely become subject to legal, governmental and regu-latory investigations and proceedings involving, among other things, requests for arbitration, allegations of improper deliv-ery of goods or services, product liability, product defects, qual-ity problems, intellectual property infringement, non-compli-ance with tax regulations and / or alleged or suspected viola-tions of applicable laws. In addition, we may face further claims in connection with the circumstances that led to the corruption charges. For additional information with respect to specific pro-ceedings see note 29 in d.6 notes to ConsoLidated FinanCiaL
statements. There can be no assurance that the results of these or any other proceedings will not materially harm our business, reputation or brand. Moreover, even if we ultimately prevail on the merits in any such proceedings, we may have to incur substantial legal fees and other costs defending our-selves against the underlying allegations. Under certain cir-cumstances we record a provision for risks arising from legal disputes and proceedings. In addition, we maintain liability in-surance for certain legal risks at levels our management be-lieves are appropriate and consistent with industry practice. Our insurance policy, however, does not protect us against rep-utational damage. Moreover, we may incur losses relating to legal proceedings beyond the limits, or outside the coverage, of such insurance. Finally, there can be no assurance that we will be able to maintain adequate insurance coverage on com-mercially reasonable terms in the future. Each of these risks may have a material adverse effect on our business, financial condition and results of operations, and our provisions for le-gal proceedings-related losses may not be sufficient to cover our ultimate losses or expenditures.
Examinations by tax authorities and changes in tax reg-ulations could adversely affect our business, financial condition and results of operations: We operate in around 190 countries and therefore are subject to different tax regula-tions. Changes in tax law could result in higher tax expense and payments. Furthermore, legislative changes could materi-ally impact our tax receivables and liabilities as well as deferred tax assets and deferred tax liabilities. In addition, the uncertain tax environment in some regions could limit our ability to en-force our rights. As a globally operating organization, we con-duct business in countries subject to complex tax rules, which may be interpreted in different ways. Future interpretations or developments of tax regimes may affect our tax liability, return on investments and business operations. We are regularly ex-amined by tax authorities in various jurisdictions.

1 A. To our Shareholders 21 B. Corporate Governance 49 C. Combined Management Report
50 C.1 Business and economic environment 64 C.2 Financial performance measures 69 C.3 Results of operations 82 C.4 Financial position 93 C.5 Net assets position
95 C.6 Overall assessment of the economic position 96 C.7 Subsequent events 97 C.8 Sustainability 111 C.9 Report on expected developments and
associated material opportunities and risks
126
ered to entail a higher opportunity exposure. The described opportunities are necessarily not the only ones we encounter. In addition, our assessment of opportunities is subject to change as our Company, our markets and technologies are constantly developing. As a consequence, new opportunities may arise, existing opportunities may cease to be relevant, or the significance of an opportunity may change. Generally, op-portunities are assessed to the best of our knowledge, consid-ering certain assumptions, including market development, market potential of technologies or solutions, and anticipated developments in customer demand or prices, among other things. When opportunities materialize, they may have a lower effect than previously estimated on the basis of the underlying assumptions. It is also possible that opportunities we see to-day will never materialize.
Through selective acquisitions, equity investments and partnerships we constantly strive to strengthen our leading technology position, open up additional poten-tial markets or further develop our product portfolio: We constantly monitor our current and future markets for oppor-tunities for strategic acquisitions, equity investments or part-nerships to complement organic growth. Such activities could help us to strengthen our market position in our existing mar-kets, provide access to new markets or complement our tech-nological portfolio in selected areas.
We particularly see further opportunities in the above-average growth potential of emerging markets: It is ex-pected that in coming years emerging markets will continue to grow significantly faster than industrialized nations, led by strong growth in the BRIC countries Brazil, Russia, India and China as well as by growth opportunities in the second wave emerging markets like Chile, Indonesia, Mexico, Poland or Tur-key. Within One Siemens, we want to take measures aimed at continuously increasing our share of revenue from emerging markets. We believe that developing the capability to design, manufacture and sell so-called SMART (simple, maintenance-friendly, affordable, reliable, and timely to market) products will provide us with opportunities to gain market share and en-hance our local presence in these strategic growth markets. Adding further SMART products to our portfolio and develop-ing stronger sales channels would enable us to increase our revenues by serving large and fast-growing regional markets, where customers may consider price more strongly than prod-uct features when making a purchase decision.
Localizing value chain activities in low cost countries could further improve our cost position: Localizing certain value chain activities, such as procurement, manufacturing, maintenance and service in markets such as the BRIC coun-tries and other emerging markets, as well as the Middle East
We are subject to environmental and other government regulations: Some of the industries in which we operate are highly regulated. Current and future environmental and other government regulations or changes thereto may require us to change the way we run our operations and could result in sig-nificant increases in our operating or product costs. In addi-tion, while we have procedures in place to ensure compliance with applicable governmental regulations in the conduct of our business operations, it cannot be excluded that violations of applicable governmental regulations may occur either by us or by third parties that we contract with, including suppliers or service providers, whose activities may be attributed to us. Any such violations expose us to the risk of liability, reputational damage or loss of licenses or permits that are important to our business operations. In particular, we could also face liability for damage or remediation for environmental contamination at the facilities we design or operate. For example, we are re-quired to bear environmental clean-up costs mainly related to remediation and environmental protection liabilities which have been accrued based on the estimated costs of decommis-sioning facilities for the production of uranium and mixed-ox-ide fuel elements in Hanau, Germany, as well as a nuclear re-search and service center in Karlstein, Germany. For further in-formation, see note 24 in d.6 notes to ConsoLidated Finan-
CiaL statements. Under certain circumstances we establish provisions for environmental risks. With regard to certain envi-ronmental risks, we maintain liability insurance at levels that our management believes are appropriate and consistent with industry practice. We may incur environmental losses beyond the limits, or outside the coverage, of such insurance, and such losses may have a material adverse effect on our busi-ness, financial condition and results of our operations. In addi-tion, our provisions for environmental liabilities may not be sufficient to cover our ultimate losses or expenditures result-ing therefrom.
C.9.4 Opportunities
Within our comprehensive, interactive and management-ori-ented Enterprise Risk Management (ERM) approach that is in-tegrated into the organization and that addresses both risks and opportunities, we regularly identify, evaluate and respond to opportunities that present themselves in our various fields of activity. Below we describe our most significant opportuni-ties. The order in which the opportunities are presented re-flects the currently estimated relative exposure for Siemens as-sociated with these opportunities and thus provides an indica-tion of the opportunities’ current importance to us. Neverthe-less, opportunities currently considered to entail a lower opportunity exposure could potentially result in a higher posi-tive impact on Siemens than opportunities currently consid-

135 D. Consolidated Financial Statements 239 E. Additional Information
130 C.11 Siemens AG (Discussion on basis of German Commercial Code)
134 C.12 Notes and forward-looking statements
129 C.10 Compensation Report, Corporate Governance statement pursuant to Section 289a of the German Commercial Code, Takeover-relevant information and explanatory report
127
could enable us to reduce costs and to strengthen our global competitive position, in particular compared to competitors based in countries with a more favorable cost structure.
We constantly strive to develop new technologies, new products and solutions as well as to improve existing ones: We invest in new technologies that we expect to meet future demands in accordance with the four strategic mega-trends demographic change, urbanization, climate change and globalization (for further information see C.1.3.1 gLobaL
megatrends). For instance, starting with fiscal 2012 we extend-ed our solution portfolio in exploiting the future infrastructure spending of the customer group “Cities” by bundling our com-petencies and providing innovative and customized city con-cepts for the relevant city stakeholders in our Sector Infrastruc-ture & Cities. In this area, we believe to haven taken a competi-tive lead in servicing this client base. Our approach is based on a global network of city account managers allowing us to lever-age the ability to replicate successful city solutions and the ca-pability of delivering both unbundled and packaged city solu-tions by integrating one or all of the competencies of our dif-ferent business areas.
We are in the process of continuously developing and implementing initiatives to reduce costs, adjust capaci-ties, improve our processes and streamline our portfolio: In an intensified competitive market environment, a competi-tive cost structure complements the competitive advantage of being innovative. We believe that further improvements in our cost position strengthen our global competitive position and secure our market presence against emerging and incumbent competitors. For example, we expect to create sustainable val-ue from productivity measures in the Sectors in connection with “Siemens 2014,” as mentioned earlier a company-wide program supporting our One Siemens framework.
We have an opportunity to further grow in the area of environment and climate protection: Many of the key ar-eas of our research and development activities focus on prod-ucts and solutions capable of strengthening and advancing our Environmental Portfolio. Our Environmental Portfolio com-prises products and solutions with outstanding energy effi-ciency, systems and components for renewable forms of ener-gy, and other environmental technologies. These products and solutions are intended to help our customers to reduce their carbon dioxide footprint, cut their energy costs and improve their profitability through increased productivity. We believe that public policy initiatives in many countries will lead to greater demand for such products and solutions in the years ahead, including from government stimulus programs. For fur-ther information, see C.8.7 environmentaL portFoLio.
We see potentials in utilizing cross-collaboration among our broad portfolio and global presence to offer more in-novative and holistic solutions: Our technological and mar-ket experience across our Sectors and Cluster enables us to le-verage cross-divisional innovation or cross-regional solutions to address the specific needs of our customers. Complemented by our Financial Services organization and its portfolio we be-lieve on further growth opportunities in our existing markets and possibilities to explore new market opportunities.
C.9.5 Significant characteristics of the accounting-related internal control and risk management systemThe following discussion describes information required pursu-ant to Section 289 (5) and Section 315 (2) no. 5 of the German Commercial Code (Handelsgesetzbuch) and explanatory report.
The overarching objective of our accounting-related internal control and risk management system is to ensure that finan-cial reporting is conducted in a proper manner such that the Consolidated Financial Statements and the Combined Manage-ment Report are prepared in accordance with all relevant regu-lations.
As described in the section C.9.2 risk management, our ERM approach is based on the worldwide accepted “Enterprise Risk Management – Integrated Framework” developed by the COSO. As one of the objectives of this framework is reliability of a company ’s financial reporting, it also includes an account-ing-related perspective. The accounting-related internal con-trol system (control system) implemented by us is based on In-ternal Control – Integrated Framework, an internationally rec-ognized framework also developed by the COSO. The two sys-tems are complementary as identified risks, and, for example, may reveal gaps in the control system that could be closed by implementing new controls and closely monitoring them. Con-versely, monitoring the control system could show that certain risks are not being controlled as effectively as was originally assumed.
We have standardized our procedures for monitoring the effec-tiveness of the control system on a group level, complying with the requirements of the U.S. Sarbanes-Oxley Act. Under these procedures, necessary controls are defined, documented in accordance with uniform standards, and tested regularly.
Our management is responsible for establishing and maintain-ing adequate internal control over financial reporting. At the end of each fiscal year, our management performs an evalua-

1 A. To our Shareholders 21 B. Corporate Governance 49 C. Combined Management Report
50 C.1 Business and economic environment 64 C.2 Financial performance measures 69 C.3 Results of operations 82 C.4 Financial position 93 C.5 Net assets position
95 C.6 Overall assessment of the economic position 96 C.7 Subsequent events 97 C.8 Sustainability 111 C.9 Report on expected developments and
associated material opportunities and risks
128
tion of the effectiveness of its control system, both in design and operating effectiveness. Our management has concluded that the Company ’s internal control over financial reporting was effective as of September 30, 2012. Nevertheless, there are inherent limitations in the effectiveness of any control system, and no system, including one determined to be effective, may prevent or detect all misstatements.
Our Consolidated Financial Statements are prepared on the ba-sis of a conceptual framework which primarily consists of com-pany-wide uniform Financial Reporting Guidelines and a chart of accounts, both issued by the Corporate Finance department and to be applied consistently throughout Siemens. New laws, accounting standards, and other official announcements are analyzed on an ongoing basis with regard to their relevance and impact on the Consolidated Financial Statements and the Combined Management Report. Where necessary, our Financial Reporting Guidelines and the chart of accounts are adjusted ac-cordingly. In quarterly closing letters, accounting departments of Siemens AG and its subsidiaries are informed about current topics from an accounting and closing process perspective and any deadlines that must be met for the respective closing pro-cesses. The conceptual framework, the communicated dead-lines, and monitoring of compliance therewith aim to mitigate the risk of Siemens not being able to prepare or publish its Con-solidated Financial Statements properly and in accordance with applicable deadlines.
The base data used in preparing the Consolidated Financial Statements consists of the closing data reported by the opera-tions of Siemens AG and its subsidiaries, which are derived from the various accounting records. Our internal Global Shared Services organization provides services to the individu-al subsidiaries. In the field of accounting, this organization pro-vides, among other things, services related to period-end clos-ing, general ledger recording, accounts receivable, accounts payable, fixed assets and payroll matters. Most of the subsidiar-ies make use of these services. Furthermore, other accounting activities, such as governance and monitoring related activi-ties, are bundled on the country and regional Cluster level. In addition, for some areas requiring specialized know-how such as valuations relating to post-employment benefits support from external service providers is obtained and used.
The reported closing data is used to prepare the Consolidated Financial Statements in the consolidation system, including the preparation of subgroup financial statements at Division, Sector and SFS level. Employees with the appropriate level of responsibility in the consolidation departments at each level and at the Group level carry out the consolidation activities and monitor compliance with the conceptual framework and deadline requirements.
The steps necessary to prepare the Consolidated Financial Statements are subject to both manual and automated con-trols at all levels. In connection with these controls, the data reported is automatically validated to support its coherence and consistency from an accounting perspective. The cause of any validation or warning messages must be rectified by the unit delivering the data before the data is finally released.
The specialist skills required of employees involved in the ac-counting process are assessed when the employees are initially selected; thereafter, the employees receive regular training. As a fundamental principle, at the different levels, items must be verified by at least one other person (four eyes principle) and specific procedures must be adhered to for the authorization of the data. Additional control mechanisms include target-perfor-mance comparisons and analyses of the composition of, and changes in, individual line items, both in the closing data re-ported by units and in the Consolidated Financial Statements.
Accounting-related IT systems provide for defined access rules in order to ensure that accounting related data is protected from unauthorized access, use or modification. Every unit in-cluded in our Consolidated Financial Statements is subject to the rules and regulations of the Corporate Information Securi-ty Guide. This is intended to ensure that IT system users only have access to those systems and information that they need to carry out their duties.
On a quarterly basis, management of Sectors, Divisions, SFS, Cross-Sector Services, regional Clusters and certain Corporate Units, are supported by confirmations of management of entities under their responsibility, which confirm the accuracy of the fi-nancial data they have reported to Siemens’ corporate headquar-ters and the effectiveness of the related control systems.
In addition, we have set up a Disclosure Committee – compris-ing selected heads of Corporate Units – which is responsible for reviewing certain financial and non-financial information prior to publication.
The Supervisory Board, through the Audit Committee, is also integrated into our control system. In particular, the Audit Committee oversees the accounting process, the effectiveness of the control system, the risk management system and the in-ternal audit system, and the independent audit of financial statements. In addition, it conducts an audit of the documents related to the Stand-alone Financial Statements of Siemens AG and the Consolidated Financial Statements and discusses the Stand-alone Financial Statements of Siemens AG, the Consoli-dated Financial Statements and Combined Management Re-port of these statements with the Managing Board and the in-dependent auditors.
135 D. Consolidated Financial Statements 239 E. Additional Information
130 C.11 Siemens AG (Discussion on basis of German Commercial Code)
134 C.12 Notes and forward-looking statements
129 C.10 Compensation Report, Corporate Governance statement pursuant to Section 289a of the German Commercial Code, Takeover-relevant information and explanatory report
129
The activities of our internal corporate audit function form a further element in the control system. Throughout Siemens and on a continuous basis, the Siemens’ internal corporate au-dit function carries out audits with respect to compliance with guidelines and the reliability and functional operation of our control system as well as the adequacy and effectiveness of our risk management system.
In addition, and in accordance with the requirements of the Sarbanes-Oxley Act, we have rules for accounting-related com-plaints and a Code of Ethics for Financial Matters to be certi-fied by the Chief Executive Officer, the Chief Financial Officer, and the Head of our Financial Reporting and Controlling de-partment, as well as other senior financial personnel con-cerned with the financial closing process.
C.9.5.1 additionaL inFormation reLated to the stand-aLone FinanCiaL statements oF siemens ag (german CommerCiaL Code) Siemens AG as the parent company of the Siemens Group is in-tegrated into the company-wide accounting-related internal control system described above. Generally, the information set out above also applies for Stand-alone Financial Statements of
Siemens AG prepared in accordance with the German Com-mercial Code.
The Consolidated Financial Statements are prepared in accor-dance with IFRS. Where required, i.e., for purposes of prepar-ing statements for local regulatory or tax purposes, data is ad-opted in accordance with relevant regulations by means of rec-onciliation at account level. Accordingly, accurately deter-mined IFRS closing data also forms an important basis for the Stand-alone Financial Statements of Siemens AG. In the case of Siemens AG and other group companies required to prepare financial statements in accordance with German Commercial Code, the conceptual framework described above is comple-mented by our mandatory German Commercial Code closing guidelines and a German Commercial Code chart of accounts.
The manual and system-based control mechanisms referred to above generally also apply when reconciling the IFRS closing data to the Stand-alone Financial Statements of Siemens AG. The information relating to the systematic monitoring of the design and operating effectiveness of the accounting-related internal control system applies only to the Consolidated Finan-cial Statements in accordance with IFRS.
C.10 ComPensation rePort, CorPorate governanCe statement Pursuant to seCtion 289a oF the german CommerCial Code, takeover-relevant inFormation and exPlanatory rePort
The Compensation Report outlines the principles underlying the determination of the total compensation of the members of the Managing Board of Siemens AG, and sets out the struc-ture and level of the remuneration of the Managing Board members. It also describes the policies governing and levels of compensation paid to Supervisory Board members. The Com-pensation Report is an integral part of the Combined Manage-ment Report and is presented in b.4 Compensation report.
The Corporate Governance statement pursuant to Section 289a of the German Commercial Code is an integral part
of the Combined Management Report and is published on www.siemens.Com/gCg-Code. The Corporate Governance
statement is also presented in b.2 Corporate governanCe
statement.
The Takeover-Relevant Information (pursuant to Sections 289 para. 4 and 315 para. 4 of the German Commercial Code) and Ex-planatory Report are an integral part of the Combined Manage-ment Report and are presented in b.5 takeover-reLevant
inFormation (pursuant to seCtions 289 para. 4 and 315 para. 4
oF the german CommerCiaL Code) and expLanatory report.

1 A. To our Shareholders 21 B. Corporate Governance 49 C. Combined Management Report
50 C.1 Business and economic environment 64 C.2 Financial performance measures 69 C.3 Results of operations 82 C.4 Financial position 93 C.5 Net assets position
95 C.6 Overall assessment of the economic position 96 C.7 Subsequent events 97 C.8 Sustainability 111 C.9 Report on expected developments and
associated material opportunities and risks
130
Unlike our Consolidated Financial Statements, which are pre-pared in accordance with the International Financial Reporting Standards (IFRS), the Stand-Alone Financial Statements of Siemens AG have been prepared in accordance with the rules set out in the German Commercial Code (Handelsgesetzbuch).
C.11.1 Business and economic environment
Siemens AG is the parent company of the Siemens Group. Siemens AG is a globally operating, integrated technology company with core activities in the fields of energy, health-care, industry and infrastructure. Beginning with fiscal 2012, Siemens formed a fourth Sector, Infrastructure & Cities, in addi-tion to our existing three Sectors, Energy, Healthcare and In-dustry. The Infrastructure & Cities Sector comprises the activi-ties of the Building Technologies and Mobility Divisions, for-merly in the Industry Sector, and the activities of the Power Distribution Division, including Smart Grid applications, for-merly in the Energy Sector. Siemens AG includes one addition-al operating business, Siemens Real Estate. Furthermore Siemens AG is significantly influenced by directly or indirectly owned subsidiaries and investments. Siemens AG holds 764 le-gal entities including non-controlling interests. Siemens AG al-so includes the Group’s corporate headquarter functions.
The economic environment for Siemens AG is largely the same as for the Siemens Group and is described in detail in C.1.2
eConomiC environment.
C.11.2 Results of operations
statement oF inCome oF siemens ag in aCCordanCe with german CommerCiaL Code (Condensed)
Year ended September 30,
(in millions of €) 2012 2011
Revenue 29,913 29,469
Cost of sales (21,607) (21,016)
Gross profit 8,307 8,453
Research and development expenses (2,904) (2,759)
Marketing, selling and general administrative expenses (3,991) (3,643)
Other operating income (expense), net 124 (698)
Financial income, net thereof income from investments 2,368 (prior year 1,995) 2,441 1,920
Result from ordinary activities 3,977 3,273
Extraordinary result – 229
Income taxes (943) (717)
Net income 3,034 2,785
Profit carried forward 114 112
Allocation to other retained earnings (504) (154)
Unappropriated net income 2,643 2,743
Revenue rose 2%. The increase was due primarily to revenue increases of €483 million in the Energy Sector and €338 million in the Healthcare Sector, partly offset by revenue declines of €394 million in the Infrastructure & Cities Sector and €113 mil-lion in the Industry Sector. On a geographic basis, revenue grew 15% year-over-year in the Americas region and 4% in the Asia, Australia region. In the Europe, C.I.S., Africa, Middle East region, revenue declined 1%. Customers in Germany account-ed for 30% of revenue compared to 31% in fiscal 2011. Exports from Germany accounted for 70% of revenue in fiscal 2012 and 69% in fiscal 2011. In fiscal 2012, new orders for Siemens AG amounted to €28.6 billion, a substantial decrease of 25% from €38.3 billion a year earlier. In particular, slowing growth in the world economy was evident in the development of new orders and led to substantially lower volume from large orders com-pared to the prior year. Prior-year period included a number of orders for large wind-farms in Energy and a €3.7 billion order for trains in Germany won by Infrastructure & Cities.
C.11 siemens ag (Discussion on basis of German Commercial Code)

135 D. Consolidated Financial Statements 239 E. Additional Information
130 C.11 Siemens AG (Discussion on basis of German Commercial Code)
134 C.12 Notes and forward-looking statements
129 C.10 Compensation Report, Corporate Governance statement pursuant to Section 289a of the German Commercial Code, Takeover-relevant information and explanatory report
131
Gross profit declined 2% and gross profit margin decreased from 29% a year ago to 28% in the current period. The decrease was driven mainly by additional costs of €633 million relating to project charges in the Energy Sector’s Power Transmission Division.
Research and development (R&D) expenses increased 5% and rose as a percentage of revenue (R&D intensity) from 9% a year earlier to 10% in fiscal 2012. The increase was associated primarily with growth-related expenses and derived mainly from the Industry Sector. R&D expenses rose in the Healthcare and Energy Sectors, and declined slightly in the Infrastruc-ture & Cities Sector. On an average basis, we employed 12,200 people in R&D in fiscal 2012 compared to 11,100 in fiscal 2011. For additional information see C.8.2 researCh and deveLop-
ment.
Other operating income (expenses), net rose €822 million compared to fiscal 2011, including an increase in other operat-ing income of €310 million and a decrease in other operating expenses of €512 million.
Other operating income rose 26%. The increase was caused primarily by a release amounting to €307 million related to in-direct pension obligations to Siemens Pensionsfonds AG and a gain of €96 million resulting from revised estimates with re-gard to transaction-related provisions in connection with the disposal of Siemens IT Solutions and Services GmbH.
Other operating expenses declined 27% compared to the prior year, which included charges amounting to €367 million relat-ed to indirect pension obligations to Siemens Pensionsfonds AG. In fiscal 2012, other operating expenses included €232 mil-lion (2011: €182 million) related to a Service Level Agreement with Siemens Financieringsmaatschappij N.V. and expenses of €166 million related to a settlement with the Greek State.
Financial income, net increased 27%. The increase was attrib-utable primarily to an increase of €373 million in income from investments. Other financial income was €163 million higher compared to the prior year, while net interest income came in €15 million lower.
Income from investments rose 19% year-over-year, due primar-ily to a gain of €1.290 billion resulting from the contribution in kind measured at fair value of Siemens Wind Power A / S into sinius GmbH, and a gain of €298 million from the disposal of Siemens s.r.o. In addition, income from investments rose on higher dividends, which came in €506 million higher year-over-year. These factors were partly offset by a €776 million de-cline in profit transfers and an increase of €650 million in im-pairments of investments.
Net other financial income improved €163 million compared to the prior year, which included impairments of shares in invest-ment funds totaling €411 million, partly offset by financial in-come of €133 million related to foreign currency and hedging transactions. Fiscal 2012 included a reversal of impairments of shares in investment funds of €155 million and growth in divi-dend income from fund shares of €53 million, more than offset by expenses related to foreign currency and hedging transac-tions amounting to €132 million and an increase of €203 mil-lion in expenses for the accretion of pension provisions.
Extraordinary result in fiscal 2011 includes a gain of €1.500 billion from the disposal of Areva NP S.A.S. and a payment of €682 million to Areva S.A. resulting from an adverse arbitra-tion decision. Also included are effects totaling a negative €589 million related to establishing Siemens IT Solutions and Services as a separate legal entity and its disposal.
Income taxes (from ordinary activities) rose 32%. The in-crease was impacted by a reduction in deferred tax assets on the loss carry-forward due to adjustments from a tax audit. This was partly offset by a decrease in current income taxes. For comparison, in fiscal 2011 income taxes from ordinary activities were burdened by adjustments of deferred tax assets amounting to €205 million into income taxes from extraordi-nary result.

1 A. To our Shareholders 21 B. Corporate Governance 49 C. Combined Management Report
50 C.1 Business and economic environment 64 C.2 Financial performance measures 69 C.3 Results of operations 82 C.4 Financial position 93 C.5 Net assets position
95 C.6 Overall assessment of the economic position 96 C.7 Subsequent events 97 C.8 Sustainability 111 C.9 Report on expected developments and
associated material opportunities and risks
132
C.11.3 Net assets and financial position
Total assets increased €159 million and were almost level with the prior year.
statement oF FinanCiaL position oF siemens ag in aCCordanCe with german CommerCiaL Code (Condensed)
September 30,
(in millions of €) 2012 2011
Assets
Non-current assets
Intangible and tangible assets 2,388 2,331
Financial assets 42,951 39,637
45,339 41,968
Current assets
Receivables and other assets 15,790 18,586
Cash and cash equivalents, marketable securities 3,155 2,834
18,945 21,420
Prepaid expenses 86 77
Deferred tax assets 2,737 3,490
Active difference resulting from offsetting 42 35
Total assets 67,149 66,990
Liabilities and equity
Equity 19,811 20,658
Special reserve with an equity portion 775 790
Accruals and provisions
Pensions and similar commitments 9,919 9,888
Other provisions 7,419 8,036
17,338 17,924
Liabilities
Liabilities to banks 146 116
Advanced payments received 1,551 1,842
Trade payables, liabilities to affiliated companies and other liabilities 27,236 25,369
28,934 27,327
Deferred income 291 291
Total liabilities and equity 67,149 66,990
Financial assets rose 8%. The increase resulted primarily from a capital increase at sinius GmbH amounting to €1.621 billion due to the contribution in kind of Siemens Wind Power A / S, which had a book value of €331 million. That contribution in kind led to a gain of €1.290 billion. In addition, shares of Siemens Diagnostics Holding II B.V. valued at €1.100 billion were transferred from Siemens Medical Solutions Diagnostics Holding I B.V. to Siemens AG, and Siemens AG performed a capital increase at OSRAM AG amounting to €699 million.
Receivables and other assets decreased 15% due primarily to lower receivables from affiliated companies as a result of intra-group financing activities.
Cash and cash equivalents and marketable securities in-creased 11%. The liquidity management of Siemens AG is based on the finance strategy of the Siemens Group. Therefore the change in liquidity of Siemens AG resulted not only from busi-ness activities of Siemens AG.
Equity declined 4%. The decrease was attributable to divi-dends paid for fiscal 2011 amounting to €2.629 billion (for ad-ditional information see C.2.4 dividend) and a €1.766 bil-lion reduction in equity due to a share buyback program con-ducted during the year. These factors were partly offset by the profit for the year of €3.034 billion, the issuance of trea-sury stock of €386 million in conjunction with our share-based compensation program and the option premium for the options rights for Siemens shares amounting to €130 mil-lion in connection with the issuance of US$ bonds with war-rant units. These warrants were issued by Siemens AG. The equity ratio at September 30, 2012 and 2011 was 30% and 31%, respectively.
Other provisions decreased 8%, primarily including decreases of €237 million in provisions for operating expenses, a decline of €207 million for tax provisions and a decrease of €156 mil-lion in provisions for warranties.
Trade payables, liabilities to affiliated companies and oth-er liabilities grew 7%, due primarily to higher liabilities to af-filiated companies as a result of intra-group financing acti vities.

135 D. Consolidated Financial Statements 239 E. Additional Information
130 C.11 Siemens AG (Discussion on basis of German Commercial Code)
134 C.12 Notes and forward-looking statements
129 C.10 Compensation Report, Corporate Governance statement pursuant to Section 289a of the German Commercial Code, Takeover-relevant information and explanatory report
133
C.11.4 Employees
key perFomanCe indiCators
Year ended September 30,
2012 2011
Employee fluctuation rate 1 2.7% 3.8%
Proportion of women (percentage of employees in management positions) 10.6% 10.4%
Expenses for continuing education (in millions of €) 2 100 86
Expenses per employee for continuing education (in €) 2 934 848
1 Employee fluctuation rate is defined as the ratio of voluntary and involuntary exits from Siemens AG during the fiscal year to the average number of employees.
2 Without travel expenses.
As of September 30, 2012, the number of employees was 108,004 and 103,624, respectively.
For additional information see C.8.9 empLoyees.
C.11.5 Risks and opportunities
The business development of Siemens AG is fundamentally subject to the same risks and opportunities as the Siemens Group. Siemens AG generally participates in the risks of its subsidiaries and equity investments in line with its percentage of each holding. For additional information see C.9.3 risks
and C.9.4 opportunities.
As the parent company of the Siemens Group, Siemens AG is integrated into the group-wide risk management system. For additional information see C.9.2 risk management.
The description of the internal control system for Siemens AG required by Section 289 para. 5 of the German Commercial Code is included in C.9.5 signiFiCant CharaCteristiCs oF the
aCCounting-reLated internaL ControL and risk management
system.
For additional information regarding the use of financial in-struments see notes to the stand-aLone FinanCiaL statements
oF siemens ag.
C.11.6 Outlook
Due to the interrelations between Siemens AG and its subsid-iaries and the relative size of Siemens AG within the Group, the Outlook of the Group also largely reflects our expectations for Siemens AG. We expect the lower level of new orders in fis-cal 2012 to affect revenue developments in fiscal 2013. Based on an expected overall improvement in the markets served by Siemens AG, we expect revenue to return to growth in fiscal 2014. This expectation is dependent particularly on businesses that are sensitive to short-term changes in the economic en-vironment. We expect to participate in the company-wide pro-gram “Siemens 2014”. This productivity improvement program is expected to include measures leading to charges in the next two fiscal years. Portions of the program-related charges will affect primarily the net income of Siemens AG in fiscal 2013. In fiscal 2014, we expect that net income will benefit from the productivity gains. Additionally, in the next two years we ex-pect that income from investments will significantly influence the profit of Siemens AG. For additional information see
C.9.1 report on expeCted deveLopments.
We intend to continue providing an attractive return to share-holders. In the years ahead we intend to propose a dividend payout which – combined with outlays for share buybacks dur-ing the fiscal year – results in a sum representing 40% to 60% of Siemens Group net income, which for this purpose we may adjust to exclude exceptional non-cash effects.
empLoyees oF siemens ag by segmentsas oF september 30, 2012 (in thousands)
Infrastructure & Cities: 26 (24%)
Industry: 36 (34%)
Energy: 26 (24%)
Healthcare: 10 (9%)
Other: 9 (8%)
Siemens Real Estate: 2 (2%)108

134
This document includes supplemental financial measures that are or may be non-GAAP financial measures. New orders and order backlog; adjusted or organic growth rates of revenue and new orders; book-to-bill ratio; Total Sectors profit; return on eq-uity (after tax), or ROE (after tax); return on capital employed (adjusted), or ROCE (adjusted); Free cash flow, or FCF; cash con-version rate, or CCR; adjusted EBITDA; adjusted EBIT; adjusted EBITDA margins, earnings effects from purchase price alloca-tion, or PPA effects; net debt and adjusted industrial net debt are or may be such non-GAAP financial measures. These sup-plemental financial measures should not be viewed in isolation as alternatives to measures of Siemens’ financial condition, re-sults of operations or cash flows as presented in accordance with IFRS in its Consolidated Financial Statements. Other companies that report or describe similarly titled financial measures may calculate them differently. Definitions of these supplemental fi-nancial measures, a discussion of the most directly comparable IFRS financial measures, information regarding the usefulness of Siemens’ supplemental financial measures, the limitations asso-ciated with these measures and reconciliations to the most com-parable IFRS financial measures are available on Siemens’ Inves-tor Relations website at www.siemens.Com/nongaap. For ad-ditional information, see supplemental financial measures and the related discussion in Siemens’ most recent annual report on Form 20-F, which can be found on our Investor Relations website or via the EDGAR system on the website of the United States Securities and Exchange Commission.
This document contains statements related to our future busi-ness and financial performance and future events or develop-ments involving Siemens that may constitute forward-looking statements. These statements may be identified by words such as “expects,” “looks forward to,” “anticipates,” “intends,” “plans,” “believes,” “seeks,” “estimates,” “will,” “project” or words of similar meaning. We may also make forward-looking statements in other reports, in presentations, in material delivered to stockholders and in press releases. In addition, our representatives may from time to time make oral forward-
looking statements. Such statements are based on the current expectations and certain assumptions of Siemens’ manage-ment, and are, therefore, subject to certain risks and uncer-tainties. A variety of factors, many of which are beyond Siemens’ control, affect Siemens’ operations, performance, business strategy and results and could cause the actual results, performance or achievements of Siemens to be mate-rially different from any future results, performance or achievements that may be expressed or implied by such for-ward-looking statements or anticipated on the basis of histori-cal trends. These factors include in particular, but are not lim-ited to, the matters described in Item 3: Key information – Risk factors of our most recent annual report on Form 20-F filed with the SEC, in the chapter “Risks” of our most recent annual report prepared in accordance with the German Commercial Code, and in the chapter “Report on risks and opportunities” of our most recent interim report.
Further information about risks and uncertainties affecting Siemens is included throughout our most recent annual and in-terim reports, as well as our most recent earnings release, which are available on the Siemens website www.siemens.Com, and throughout our most recent annual report on Form 20-F and in our other filings with the SEC, which are available on the Siemens website www.siemens.Com, and on the SEC’s web-site www.seC.gov. Should one or more of these risks or un-certainties materialize, or should underlying assumptions prove incorrect, actual results, performance or achievements of Siemens may vary materially from those described in the relevant forward-looking statement as being expected, antici-pated, intended, planned, believed, sought, estimated or pro-jected. Siemens neither intends, nor assumes any obligation, to update or revise these forward-looking statements in light of developments which differ from those anticipated.
Due to rounding, numbers presented throughout this and other documents may not add up precisely to the totals provided and percentages may not precisely reflect the absolute figures.
C.12 notes and Forward-looking statements

D. Consolidated Financial Statements
Due to rounding, numbers presented throughout these Consolidated Financial Statements may not add up precisely to the totals provided and percentages may not precisely reflect the absolute figures.
136 D.1 Consolidated Statements of Income
137 D.2 Consolidated Statements of Comprehensive Income
138 D.3 Consolidated Statements of Financial Position
139 D.4 Consolidated Statements of Cash Flow
140 D.5 Consolidated Statements of Changes in Equity
142 D.6 Notes to Consolidated Financial Statements 142 Segment information
(continuing operations) 144 Note 1 – Basis of presentation 144 Note 2 – Summary of significant accounting
policies 153 Note 3 – Critical accounting estimates 155 Note 4 – Acquisitions, dispositions
and discontinued operations 161 Note 5 – Other operating income 161 Note 6 – Other operating expense 161 Note 7 – Income (loss) from investments
accounted for using the equity method, net
161 Note 8 – Interest income, interest expense and other financial income (expense), net
162 Note 9 – Income taxes 164 Note 10 – Available-for-sale financial assets 164 Note 11 – Trade and other receivables 166 Note 12 – Other current financial assets 166 Note 13 – Inventories 166 Note 14 – Other currrent assets 166 Note 15 – Goodwill 168 Note 16 – Other intangible assets 169 Note 17 – Property, plant and equipment 170 Note 18 – Investments accounted for
using the equity method 171 Note 19 – Other financial assets 171 Note 20 – Other current financial liabilities
171 Note 21 – Other current liabilities 171 Note 22 – Debt 174 Note 23 – Pension plans and
similar commitments 184 Note 24 – Provisions 186 Note 25 – Other liabilities 186 Note 26 – Equity 188 Note 27 – Additional capital disclosures 190 Note 28 – Commitments and contingencies 191 Note 29 – Legal proceedings 197 Note 30 – Additional disclosures
on financial instruments 200 Note 31 – Derivative financial instruments
and hedging activities 203 Note 32 – Financial risk management 208 Note 33 – Share-based payment 211 Note 34 – Personnel costs 211 Note 35 – Earnings per share 212 Note 36 – Segment information 215 Note 37 – Information about geographies 215 Note 38 – Related party transactions 217 Note 39 – Principal accountant fees
and services 218 Note 40 – Corporate governance 218 Note 41 – Subsequent events 219 Note 42 – List of subsidiaries and
associated companies pursuant to Section 313 para. 2 of the German Commercial Code
232 D.7 Supervisory Board and Managing Board 232 D.7.1 Supervisory Board
236 D.7.2 Managing Board
D.
Co
nso
lid
ate
d F
inan
cial
Sta
tem
en
ts

1 A. To our Shareholders 49 C. Combined Management Report 21 B. Corporate Governance136
D.1 ConsoliDateD statements of inCome
For the Fiscal years eNDeD september 30, 2012 aND 2011
(in millions of €, per share amounts in €) Note 2012 2011
Revenue 78,296 73,275
Cost of goods sold and services rendered (56,092) (51,046)
Gross profit 22,204 22,229
Research and development expenses (4,238) (3,899)
Marketing, selling and general administrative expenses (11,162) (10,239)
Other operating income 5 516 547
Other operating expense 6 (276) (374)
Income (loss) from investments accounted for using the equity method, net 7 (266) 210
Interest income 8 2,234 2,200
Interest expense 8 (1,728) (1,716)
Other financial income (expense), net 8 (5) 649
Income from continuing operations before income taxes 7,279 9,608
Income taxes 9 (2,094) (2,232)
Income from continuing operations 5,184 7,376
Income (loss) from discontinued operations, net of income taxes 4 (595) (1,055)
Net income 4,590 6,321
Attributable to:
Non-controlling interests 132 176
Shareholders of Siemens AG 4,458 6,145
Basic earnings per share 35
Income from continuing operations 5.77 8.23
Income (loss) from discontinued operations (0.68) (1.20)
Net income 5.09 7.04
Diluted earnings per share 35
Income from continuing operations 5.71 8.14
Income (loss) from discontinued operations (0.67) (1.18)
Net income 5.04 6.96
The accompanying Notes are an integral part of these Consolidated Financial Statements.

135 D. Consolidated Financial Statements 239 E. Additional Information
140 D.5 Consolidated Statements of Changes in Equity 142 D.6 Notes to Consolidated Financial Statements 232 D.7 Supervisory Board and Managing Board
136 D.1 Consolidated Statements of Income 137 D.2 Consolidated Statements of Comprehensive Income 138 D.3 Consolidated Statements of Financial Position 139 D.4 Consolidated Statements of Cash Flow
137
D.2 ConsoliDateD statements of Comprehensive inCome
For the Fiscal years eNDeD september 30, 2012 aND 2011
(in Mio. €) Note 2012 2011
Net income 4,590 6,321
Items that will not be reclassified to profit or loss:
Actuarial gains and losses on pension plans and similar commitments 23 (2,101) (65)
Items that may be reclassified subsequently to profit or loss:
Currency translation differences 855 129
Available-for-sale financial assets 10 209 (59)
Derivative financial instruments 30, 31 63 (121)
1,127 (51)
Other comprehensive income, net of tax 1 (974) (116)
Total comprehensive income 3,615 6,205
Attributable to:
Non-controlling interests 128 169
Shareholders of Siemens AG 3,487 6,036
1 Includes income (expense) resulting from investments accounted for using the equity method of €28 million and €8 million, respectively, in fiscal 2012 and 2011 of which €(99) million and €10 million, respectively, are attributable to items that will not be reclassified to profit or loss.
The accompanying Notes are an integral part of these Consolidated Financial Statements.
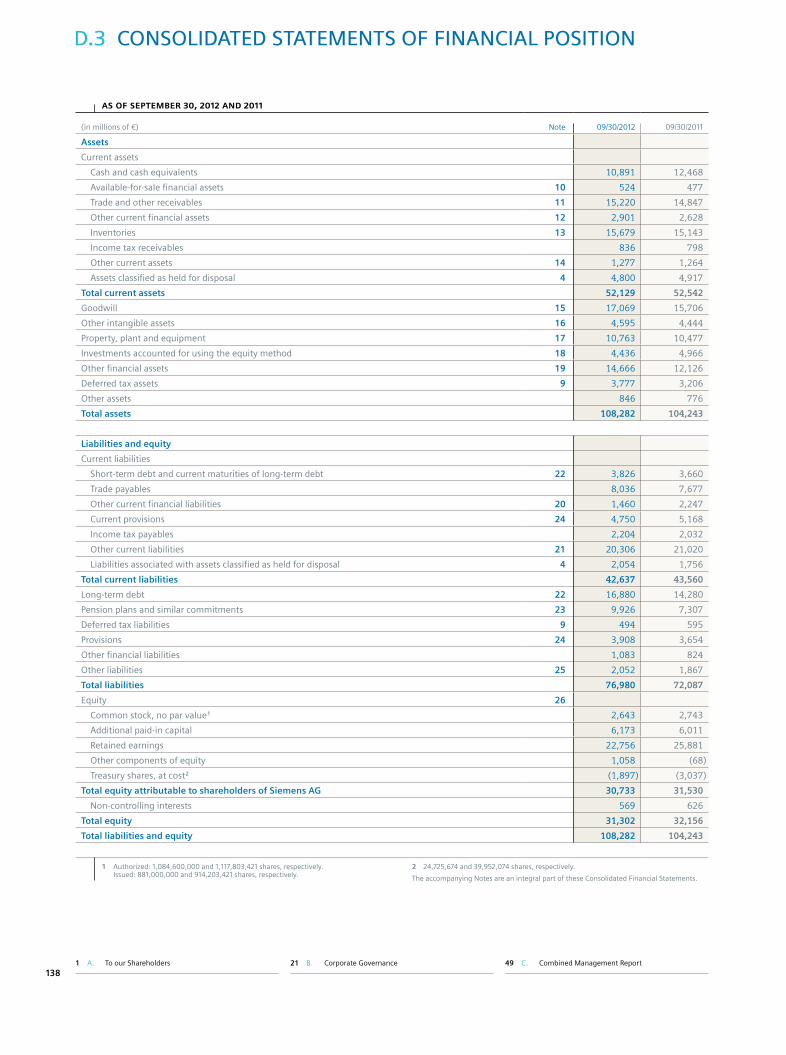
1 A. To our Shareholders 49 C. Combined Management Report 21 B. Corporate Governance138
D.3 ConsoliDateD statements of finanCial position
as oF september 30, 2012 aND 2011
(in millions of €) Note 09/30/2012 09/30/2011
Assets
Current assets
Cash and cash equivalents 10,891 12,468
Available-for-sale financial assets 10 524 477
Trade and other receivables 11 15,220 14,847
Other current financial assets 12 2,901 2,628
Inventories 13 15,679 15,143
Income tax receivables 836 798
Other current assets 14 1,277 1,264
Assets classified as held for disposal 4 4,800 4,917
Total current assets 52,129 52,542
Goodwill 15 17,069 15,706
Other intangible assets 16 4,595 4,444
Property, plant and equipment 17 10,763 10,477
Investments accounted for using the equity method 18 4,436 4,966
Other financial assets 19 14,666 12,126
Deferred tax assets 9 3,777 3,206
Other assets 846 776
Total assets 108,282 104,243
Liabilities and equity
Current liabilities
Short-term debt and current maturities of long-term debt 22 3,826 3,660
Trade payables 8,036 7,677
Other current financial liabilities 20 1,460 2,247
Current provisions 24 4,750 5,168
Income tax payables 2,204 2,032
Other current liabilities 21 20,306 21,020
Liabilities associated with assets classified as held for disposal 4 2,054 1,756
Total current liabilities 42,637 43,560
Long-term debt 22 16,880 14,280
Pension plans and similar commitments 23 9,926 7,307
Deferred tax liabilities 9 494 595
Provisions 24 3,908 3,654
Other financial liabilities 1,083 824
Other liabilities 25 2,052 1,867
Total liabilities 76,980 72,087
Equity 26
Common stock, no par value 1 2,643 2,743
Additional paid-in capital 6,173 6,011
Retained earnings 22,756 25,881
Other components of equity 1,058 (68)
Treasury shares, at cost 2 (1,897) (3,037)
Total equity attributable to shareholders of Siemens AG 30,733 31,530
Non-controlling interests 569 626
Total equity 31,302 32,156
Total liabilities and equity 108,282 104,243
1 Authorized: 1,084,600,000 and 1,117,803,421 shares, respectively. Issued: 881,000,000 and 914,203,421 shares, respectively.
2 24,725,674 and 39,952,074 shares, respectively.
The accompanying Notes are an integral part of these Consolidated Financial Statements.
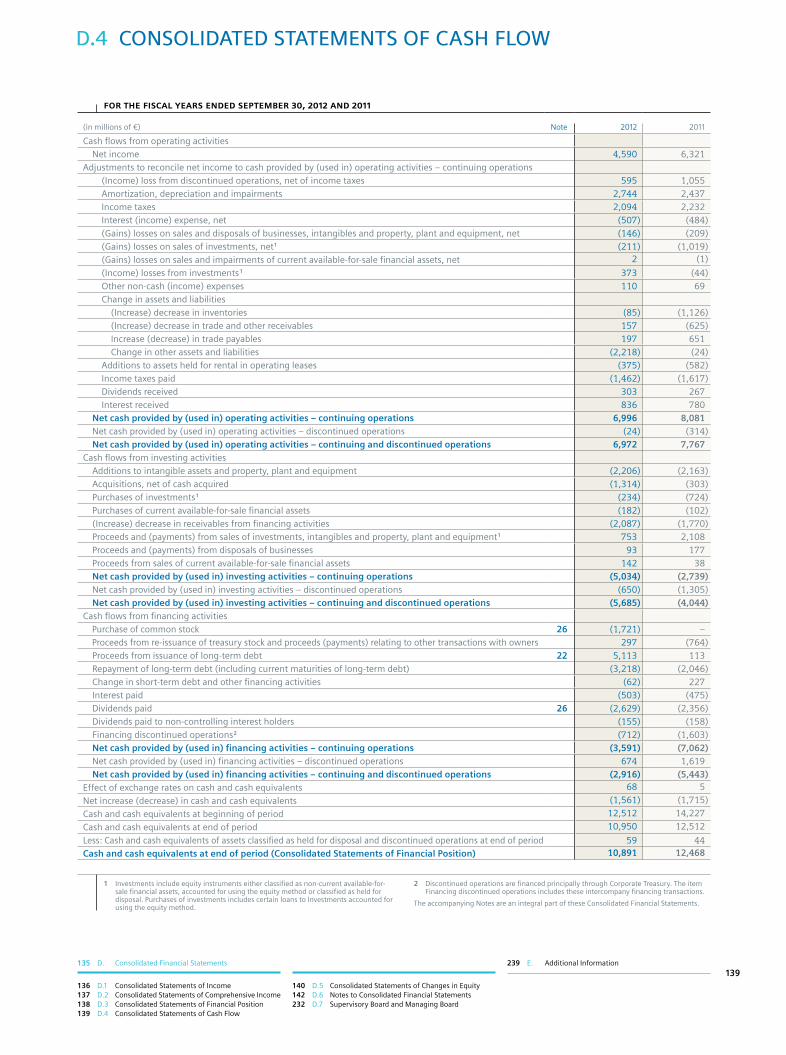
135 D. Consolidated Financial Statements 239 E. Additional Information
140 D.5 Consolidated Statements of Changes in Equity 142 D.6 Notes to Consolidated Financial Statements 232 D.7 Supervisory Board and Managing Board
136 D.1 Consolidated Statements of Income 137 D.2 Consolidated Statements of Comprehensive Income 138 D.3 Consolidated Statements of Financial Position 139 D.4 Consolidated Statements of Cash Flow
139
D.4 ConsoliDateD statements of Cash flow
For the Fiscal years ended september 30, 2012 and 2011
(in millions of €) Note 2012 2011
Cash flows from operating activities Net income 4,590 6,321Adjustments to reconcile net income to cash provided by (used in) operating activities – continuing operations (Income) loss from discontinued operations, net of income taxes 595 1,055 Amortization, depreciation and impairments 2,744 2,437 Income taxes 2,094 2,232 Interest (income) expense, net (507) (484) (Gains) losses on sales and disposals of businesses, intangibles and property, plant and equipment, net (146) (209) (Gains) losses on sales of investments, net 1 (211) (1,019) (Gains) losses on sales and impairments of current available-for-sale financial assets, net 2 (1)
(Income) losses from investments 1 373 (44) Other non-cash (income) expenses 110 69 Change in assets and liabilities (Increase) decrease in inventories (85) (1,126) (Increase) decrease in trade and other receivables 157 (625) Increase (decrease) in trade payables 197 651 Change in other assets and liabilities (2,218) (24) Additions to assets held for rental in operating leases (375) (582) Income taxes paid (1,462) (1,617) Dividends received 303 267 Interest received 836 780 Net cash provided by (used in) operating activities – continuing operations 6,996 8,081 Net cash provided by (used in) operating activities – discontinued operations (24) (314) Net cash provided by (used in) operating activities – continuing and discontinued operations 6,972 7,767Cash flows from investing activities Additions to intangible assets and property, plant and equipment (2,206) (2,163) Acquisitions, net of cash acquired (1,314) (303) Purchases of investments 1 (234) (724) Purchases of current available-for-sale financial assets (182) (102) (Increase) decrease in receivables from financing activities (2,087) (1,770) Proceeds and (payments) from sales of investments, intangibles and property, plant and equipment 1 753 2,108 Proceeds and (payments) from disposals of businesses 93 177 Proceeds from sales of current available-for-sale financial assets 142 38 Net cash provided by (used in) investing activities – continuing operations (5,034) (2,739) Net cash provided by (used in) investing activities – discontinued operations (650) (1,305) Net cash provided by (used in) investing activities – continuing and discontinued operations (5,685) (4,044)Cash flows from financing activities Purchase of common stock 26 (1,721) – Proceeds from re-issuance of treasury stock and proceeds (payments) relating to other transactions with owners 297 (764) Proceeds from issuance of long-term debt 22 5,113 113 Repayment of long-term debt (including current maturities of long-term debt) (3,218) (2,046) Change in short-term debt and other financing activities (62) 227 Interest paid (503) (475) Dividends paid 26 (2,629) (2,356) Dividends paid to non-controlling interest holders (155) (158) Financing discontinued operations 2 (712) (1,603) Net cash provided by (used in) financing activities – continuing operations (3,591) (7,062) Net cash provided by (used in) financing activities – discontinued operations 674 1,619 Net cash provided by (used in) financing activities – continuing and discontinued operations (2,916) (5,443)Effect of exchange rates on cash and cash equivalents 68 5
Net increase (decrease) in cash and cash equivalents (1,561) (1,715)
Cash and cash equivalents at beginning of period 12,512 14,227
Cash and cash equivalents at end of period 10,950 12,512
Less: Cash and cash equivalents of assets classified as held for disposal and discontinued operations at end of period 59 44Cash and cash equivalents at end of period (Consolidated Statements of Financial Position) 10,891 12,468
1 Investments include equity instruments either classified as non-current available-for-sale financial assets, accounted for using the equity method or classified as held for disposal. Purchases of investments includes certain loans to Investments accounted for using the equity method.
2 Discontinued operations are financed principally through Corporate Treasury. The item Financing discontinued operations includes these intercompany financing transactions.
The accompanying Notes are an integral part of these Consolidated Financial Statements.

1 A. To our Shareholders 49 C. Combined Management Report 21 B. Corporate Governance140
D.5 ConsoliDateD statements of Changes in equity
For the Fiscal years eNDeD september 30, 2012 aND 2011
Total comprehensive income
Other components of equityItems that may be reclassified subsequently to profit or loss
Common stock Additionalpaid-in capital
Retained earnings Currency trans-lation differences
Available-for-salefinancial assets
Derivative financialinstruments
Total Treasury shares at cost
Total equityattributable
to shareholdersof Siemens AG
Non-controllinginterests
Total equity
(in millions of €)
Balance at October 1, 2010 2,743 5,986 22,998 (115) 95 12 22,990 (3,373) 28,346 750 29,096
Net income – – 6,145 – – – 6,145 – 6,145 176 6,321
Other comprehensive income, net of tax – – (66)1 134 (59) (118) (109) – (109) (7) (116)2
Dividends – – (2,356) – – – (2,356) – (2,356) (165) (2,521)
Share-based payment – (3) (17) – – – (17) – (20) – (20)
Re-issuance of treasury stock – 28 – – – – – 336 364 – 364
Transactions with non-controlling interests 3 – – (835) (17) – – (852) – (852) (122) (974)
Other changes in equity – – 12 – – – 12 – 12 (6) 6
Balance at September 30, 2011 2,743 6,011 25,881 2 36 (106) 25,813 (3,037) 31,530 626 32,156
Balance at October 1, 2011 2,743 6,011 25,881 2 36 (106) 25,813 (3,037) 31,530 626 32,156
Net income – – 4,458 – – – 4,458 – 4,458 132 4,590
Other comprehensive income, net of tax – – (2,097)1 855 209 62 (971) – (971) (4) (974)2
Dividends – – (2,629) – – – (2,629) – (2,629) (176) (2,805)
Share-based payment – 42 (129) – – – (129) – (87) – (87)
Purchase of common stock – – – – – – – (1,767) (1,767) – (1,767)
Re-issuance of treasury stock – (6) – – – – – 397 391 – 391
Cancellation of common stock (100) – (2,410) – – – (2,410) 2,510 – – –
Transactions with non-controlling interests – – (326) – – – (326) – (326) 24 (302)
Other changes in equity – 126 7 – – – 7 – 134 (34) 100
Balance at September 30, 2012 2,643 6,173 22,756 857 245 (44) 23,814 (1,897) 30,733 569 31,302
1 Items of other comprehensive income that will not be reclassified to profit or loss consist of actuarial gains and losses on pension plans and similar commitments of €(2,097) million and €(66) million, respectively, in the fiscal years ended September 30, 2012 and 2011. Actuarial gains and losses on pension plans and similar commitments are included in line item Retained earnings.
2 In fiscal years ended September 30, 2012 and 2011, Other comprehensive income, net of tax, includes non controlling interests of €(4) million and €1 million relating to Actuarial gains and losses on pension plans and similar commitments, €(1) million and €(5) million relating to Currency translation differences, € – million and € – million relating to Available-for-sale financial assets and €1 million and €(3) million relating to Derivative financial instruments.

135 D. Consolidated Financial Statements 239 E. Additional Information
140 D.5 Consolidated Statements of Changes in Equity 142 D.6 Notes to Consolidated Financial Statements 232 D.7 Supervisory Board and Managing Board
136 D.1 Consolidated Statements of Income 137 D.2 Consolidated Statements of Comprehensive Income 138 D.3 Consolidated Statements of Financial Position 139 D.4 Consolidated Statements of Cash Flow
141
For the Fiscal years eNDeD september 30, 2012 aND 2011
Total comprehensive income
Other components of equityItems that may be reclassified subsequently to profit or loss
Common stock Additionalpaid-in capital
Retained earnings Currency trans-lation differences
Available-for-salefinancial assets
Derivative financialinstruments
Total Treasury shares at cost
Total equityattributable
to shareholdersof Siemens AG
Non-controllinginterests
Total equity
(in millions of €)
Balance at October 1, 2010 2,743 5,986 22,998 (115) 95 12 22,990 (3,373) 28,346 750 29,096
Net income – – 6,145 – – – 6,145 – 6,145 176 6,321
Other comprehensive income, net of tax – – (66)1 134 (59) (118) (109) – (109) (7) (116)2
Dividends – – (2,356) – – – (2,356) – (2,356) (165) (2,521)
Share-based payment – (3) (17) – – – (17) – (20) – (20)
Re-issuance of treasury stock – 28 – – – – – 336 364 – 364
Transactions with non-controlling interests 3 – – (835) (17) – – (852) – (852) (122) (974)
Other changes in equity – – 12 – – – 12 – 12 (6) 6
Balance at September 30, 2011 2,743 6,011 25,881 2 36 (106) 25,813 (3,037) 31,530 626 32,156
Balance at October 1, 2011 2,743 6,011 25,881 2 36 (106) 25,813 (3,037) 31,530 626 32,156
Net income – – 4,458 – – – 4,458 – 4,458 132 4,590
Other comprehensive income, net of tax – – (2,097)1 855 209 62 (971) – (971) (4) (974)2
Dividends – – (2,629) – – – (2,629) – (2,629) (176) (2,805)
Share-based payment – 42 (129) – – – (129) – (87) – (87)
Purchase of common stock – – – – – – – (1,767) (1,767) – (1,767)
Re-issuance of treasury stock – (6) – – – – – 397 391 – 391
Cancellation of common stock (100) – (2,410) – – – (2,410) 2,510 – – –
Transactions with non-controlling interests – – (326) – – – (326) – (326) 24 (302)
Other changes in equity – 126 7 – – – 7 – 134 (34) 100
Balance at September 30, 2012 2,643 6,173 22,756 857 245 (44) 23,814 (1,897) 30,733 569 31,302
3 Includes the acquisition of additional subsidiary shares in Siemens Ltd., India.
The accompanying Notes are an integral part of these Consolidated Financial Statements.

1 A. To our Shareholders 49 C. Combined Management Report 21 B. Corporate Governance142
D.6 notes to ConsoliDateD finanCial statements
segment information (continuing operations)
as oF aND For the Fiscal years eNDeD september 30, 2012 aND 2011
New orders 2 External revenue Intersegment revenue Total revenue Profit 3 Assets 4 Free cash flow 5 Additions to intangible assets and property, plant
and equipment
Amortization, depreciation and impairments 6
(in millions of €) 2012 2011 2012 2011 2012 2011 2012 2011 2012 2011 09/30/2012 09/30/2011 2012 2011 2012 2011 2012 2011
Sectors 1
Energy 26,881 31,407 27,302 24,390 235 254 27,537 24,645 2,159 4,230 1,020 499 2,315 2,768 532 587 523 403
Healthcare 13,806 13,116 13,600 12,463 42 54 13,642 12,517 1,815 1,334 11,757 11,264 1,861 1,887 354 284 726 645
Industry 19,985 20,184 18,872 18,124 1,637 1,467 20,508 19,590 2,467 2,752 7,014 6,001 2,164 2,468 442 451 591 557
Infrastructure & Cities 17,150 21,348 16,731 16,166 853 810 17,585 16,976 1,102 1,126 4,012 3,169 737 1,208 290 264 276 278
Total Sectors 77,822 86,056 76,505 71,142 2,767 2,585 79,273 73,727 7,543 9,442 23,803 20,933 7,077 8,332 1,619 1,586 2,116 1,883
Equity Investments – – – – – – – – (549) (26) 2,715 3,382 100 116 – – – –
Financial Services (SFS) 908 961 859 908 48 54 908 961 479 428 17,405 14,602 528 344 31 60 270 265
Reconciliation to Consolidated Financial Statements
Centrally managed portfolio activities 283 473 281 510 11 10 292 520 (29) (40) (448) (397) 12 (86) 3 6 6 7
Siemens Real Estate (SRE) 2,434 2,204 325 415 2,121 1,792 2,447 2,207 115 150 5,018 4,974 (231) (240) 453 453 327 272
Corporate items and pensions 508 449 325 300 184 151 509 451 (302) (257) (11,840) (9,806) (1,044) (1,168) 103 62 67 60
Eliminations, Corporate Treasury and other reconciling items (5,041) (4,978) – – (5,132) (4,591) (5,132) (4,591) 23 (90) 71,628 70,555 (1,651) (1,381) (4) (4) (41) (50)
Siemens 76,913 85,166 78,296 73,275 – – 78,296 73,275 7,279 9,608 108,282 104,243 4,790 5,918 2,206 2,163 2,744 2,437
1 Commencing with fiscal 2012, Infrastructure & Cities was implemented. Prior period information has been recast to conform to the fiscal 2012 presentation.
2 This supplementary information on New orders is provided on a voluntary basis. It is not part of the Consolidated Financial Statements subject to the audit opinion.
3 Profit of the Sectors as well as of Equity Investments and Centrally managed portfolio activities is earnings before financing interest, certain pension costs and income taxes. Certain other items not considered performance indicative by Management may be excluded. Profit of SFS and SRE is Income before income taxes.
4 Assets of the Sectors as well as of Equity Investments and Centrally managed port folio activities is defined as Total assets less income tax assets, less non-interest bearing liabilities other than tax liabilities. Assets of SFS and SRE is Total assets.

135 D. Consolidated Financial Statements 239 E. Additional Information
140 D.5 Consolidated Statements of Changes in Equity 142 D.6 Notes to Consolidated Financial Statements 232 D.7 Supervisory Board and Managing Board
136 D.1 Consolidated Statements of Income 137 D.2 Consolidated Statements of Comprehensive Income 138 D.3 Consolidated Statements of Financial Position 139 D.4 Consolidated Statements of Cash Flow
143
as oF aND For the Fiscal years eNDeD september 30, 2012 aND 2011
New orders 2 External revenue Intersegment revenue Total revenue Profit 3 Assets 4 Free cash flow 5 Additions to intangible assets and property, plant
and equipment
Amortization, depreciation and impairments 6
(in millions of €) 2012 2011 2012 2011 2012 2011 2012 2011 2012 2011 09/30/2012 09/30/2011 2012 2011 2012 2011 2012 2011
Sectors 1
Energy 26,881 31,407 27,302 24,390 235 254 27,537 24,645 2,159 4,230 1,020 499 2,315 2,768 532 587 523 403
Healthcare 13,806 13,116 13,600 12,463 42 54 13,642 12,517 1,815 1,334 11,757 11,264 1,861 1,887 354 284 726 645
Industry 19,985 20,184 18,872 18,124 1,637 1,467 20,508 19,590 2,467 2,752 7,014 6,001 2,164 2,468 442 451 591 557
Infrastructure & Cities 17,150 21,348 16,731 16,166 853 810 17,585 16,976 1,102 1,126 4,012 3,169 737 1,208 290 264 276 278
Total Sectors 77,822 86,056 76,505 71,142 2,767 2,585 79,273 73,727 7,543 9,442 23,803 20,933 7,077 8,332 1,619 1,586 2,116 1,883
Equity Investments – – – – – – – – (549) (26) 2,715 3,382 100 116 – – – –
Financial Services (SFS) 908 961 859 908 48 54 908 961 479 428 17,405 14,602 528 344 31 60 270 265
Reconciliation to Consolidated Financial Statements
Centrally managed portfolio activities 283 473 281 510 11 10 292 520 (29) (40) (448) (397) 12 (86) 3 6 6 7
Siemens Real Estate (SRE) 2,434 2,204 325 415 2,121 1,792 2,447 2,207 115 150 5,018 4,974 (231) (240) 453 453 327 272
Corporate items and pensions 508 449 325 300 184 151 509 451 (302) (257) (11,840) (9,806) (1,044) (1,168) 103 62 67 60
Eliminations, Corporate Treasury and other reconciling items (5,041) (4,978) – – (5,132) (4,591) (5,132) (4,591) 23 (90) 71,628 70,555 (1,651) (1,381) (4) (4) (41) (50)
Siemens 76,913 85,166 78,296 73,275 – – 78,296 73,275 7,279 9,608 108,282 104,243 4,790 5,918 2,206 2,163 2,744 2,437
5 Free cash flow represents net cash provided by (used in) operating activities less additions to intangible assets and property, plant and equipment. Free cash flow of the Sectors, Equity Investments and Centrally managed portfolio activities primarily exclude income tax, financing interest and certain pension related payments and proceeds. Free cash flow of SFS, a financial services business, and of SRE includes related financing interest payments and proceeds; income tax payments and proceeds of SFS and SRE are excluded.
6 Amortization, depreciation and impairments contains amortization and impairments, net of reversals of impairments, of intangible assets other than goodwill as well as depreciation and impairments of property, plant and equipment, net of reversals of impairments.

1 A. To our Shareholders 49 C. Combined Management Report 21 B. Corporate Governance144
NOTE 1 Basis of presentation
The accompanying Consolidated Financial Statements present the operations of Siemens AG with registered offices in Berlin and Munich, Germany, and its subsidiaries (the Company or Siemens). They have been prepared in accordance with Inter-national Financial Reporting Standards (IFRS), as adopted by the European Union as well as with the additional require-ments set forth in Section 315a (1) of the German Commercial Code (HGB). The financial statements are also in accordance with IFRS as issued by the International Accounting Standards Board (IASB).
Consolidated Financial Statements and Group Management Report as of September 30, 2012, prepared in accordance with Section 315a (1) of the HGB are being filed with and published in the German Electronic Federal Gazette (elektronischer Bundesanzeiger).
Siemens prepares and reports its Consolidated Financial State-ments in euros (€). Due to rounding, numbers presented may not add up precisely to totals provided.
Siemens is a German based multinational corporation with a business portfolio of activities predominantly in the field of electronics and electrical engineering.
The Consolidated Financial Statements were authorised for issue by the Managing Board on November 21, 2012. The Con-solidated Financial Statements are generally prepared on the historical cost basis, except as stated in NOTE 2 Summary Of
SigNificaNT accOuNTiNg pOliciES.
NOTE 2 Summary of significant accounting policies
The accounting policies set out below have been applied con-sistently to all periods presented in these Consolidated Finan-cial Statements.
Basis of consolidation – The Consolidated Financial State-ments include the accounts of Siemens AG and its subsidiaries which are directly or indirectly controlled. Control is generally conveyed by ownership of the majority of voting rights. Addi-tionally, the Company consolidates special purpose entities (SPE’s) when, based on the evaluation of the substance of the relationship with Siemens, the Company concludes that it con-trols the SPE. To determine when the Company should consoli-date based on substance, Siemens considers the circumstanc-es listed in SIC-12.10 as additional indicators regarding a
relationship in which Siemens controls an SPE. Siemens looks at these SIC-12.10 circumstances as indicators and always privi-leges an analysis of individual facts and circumstances on a case-by-case basis. Associated companies are recorded in the Consolidated Financial Statements using the equity method of accounting. Companies in which Siemens has joint control are also recorded using the equity method.
Business combinations – Business combinations are ac-counted for under the acquisition method. Siemens as the acquirer and the acquiree may have a relationship that existed before they contemplated the business combination, referred to as a pre-existing relationship. If the business combination in effect settles a pre-existing relationship, Siemens as the acquirer recognizes a gain or loss for the pre-existing relation-ship. The cost of an acquisition is measured at the fair value of the assets given and liabilities incurred or assumed at the date of exchange. Any contingent consideration to be transferred by Siemens as the acquirer will be recognized at fair value at the acquisition date. Subsequent changes to the fair value of the contingent consideration that is deemed to be an asset or liability will be recognized either in profit or loss or as a change to other comprehensive income. If the contingent consider-ation is classified as equity, it will not be remeasured; subse-quent settlement is accounted for within equity. Acquisition-related costs are expensed in the period incurred. Identifiable assets acquired and liabilities assumed in a business combina-tion (including contingent liabilities) are measured initially at their fair values at the acquisition date, irrespective of the ex-tent of any non-controlling interest. Uniform accounting poli-cies are applied. Non-controlling interests may be measured at their fair value (full goodwill method) or at the proportional fair value of assets acquired and liabilities assumed (partial goodwill method). After initial recognition non-controlling interests may show a deficit balance since both profits and losses are allocated to the shareholders based on their equity interests. In business combinations achieved in stages, any previously held equity interest in the acquiree is remeasured to its acquisition date fair value. If there is no loss of control, transactions with non-controlling interests are accounted for as equity transactions not affecting profit and loss. At the date control is lost, any retained equity interests are remeasured to fair value. In case of a written put on non-controlling interests the Company distinguishes whether the prerequisites for the transfer of present ownership interest are fulfilled at the bal-ance sheet date. Provided that the Company is not the benefi-cial owner of the shares underlying the put option, the exer-cise of the put option will be assumed at each balance sheet date and treated as equity transaction between shareholders with the recognition of a purchase liability at the respective exercise price. The non-controlling interests participate in profits and losses during the reporting period.

135 D. Consolidated Financial Statements 239 E. Additional Information
140 D.5 Consolidated Statements of Changes in Equity 142 D.6 Notes to Consolidated Financial Statements 232 D.7 Supervisory Board and Managing Board
136 D.1 Consolidated Statements of Income 137 D.2 Consolidated Statements of Comprehensive Income 138 D.3 Consolidated Statements of Financial Position 139 D.4 Consolidated Statements of Cash Flow
145
Associated companies and jointly controlled entities – Companies in which Siemens has the ability to exercise signifi-cant influence over operating and financial policies (generally through direct or indirect ownership of 20% to 50% of the vot-ing rights) and jointly controlled entities are recorded in the Consolidated Financial Statements using the equity method of accounting and are initially recognized at cost. The following policies equally apply to associated companies and jointly con-trolled entities. Where necessary, adjustments are made to bring the accounting policies in line with those of Siemens. The excess of Siemens’ initial investment in associated compa-nies over Siemens’ ownership percentage in the underlying net assets of those companies is attributed to certain fair value adjustments with the remaining portion recognized as good-will. Goodwill relating to the acquisition of associated compa-nies is included in the carrying amount of the investment and is not amortized but is tested for impairment as part of the overall investment in the associated company. Siemens’ share of its associated companies’ post-acquisition profits or losses is recognized in the Consolidated Statements of Income, and its share of post-acquisition movements in equity that have not been recognized in the associates’ profit or loss is recognized directly in equity. The cumulative post-acquisition movements are adjusted against the carrying amount of the investment in the associated company. When Siemens’ share of losses in an associated company equals or exceeds its interest in the associ-ate, Siemens does not recognize further losses, unless it incurs obligations or makes payments on behalf of the associate. The interest in an associate is the carrying amount of the invest-ment in the associate together with any long-term interests that, in substance, form part of Siemens’ net investment in the associate. Intercompany results arising from transactions be-tween Siemens and its associated companies are eliminated to the extent of Siemens’ interest in the associated company. Siemens determines at each reporting date whether there is any objective evidence that the investment in the associate is impaired. If this is the case, Siemens calculates the amount of impairment as the difference between the recoverable amount of the associate and its carrying value. Upon loss of significant influence over the associate, Siemens measures and recognizes any retaining investment at its fair value. Any difference be-tween the carrying amount of the associate upon loss of signif-icant influence and the fair value of the retaining investment and proceeds from disposal is recognized in profit or loss.
Foreign currency translation – The assets, including good-will, and liabilities of foreign subsidiaries, where the functional currency is other than the euro, are translated using the spot exchange rate at the end of the reporting period, while the Consolidated Statements of Income are translated using aver-age exchange rates during the period. Differences arising from such translations are recognized within equity and reclassified
to net income when the gain or loss on disposal of the foreign subsidiary is recognized. The Consolidated Statements of Cash Flow are translated at average exchange rates during the peri-od, whereas cash and cash equivalents are translated at the spot exchange rate at the end of the reporting period.
The exchange rate of the U.S. Dollar, Siemens’ significant currency outside the euro zone used in the preparation of the Consolidated Financial Statements is as follows:
Year-end exchange rate €1 quoted into
currencies specified below
Annual average rate€1 quoted into
currencies specified below
September 30, Fiscal year
Currency ISO Code 2012 2011 2012 2011
U.S. Dollar USD 1.293 1.350 1.303 1.399
Foreign currency transaction – Transactions that are de-nominated in a currency other than the functional currency of an entity, are recorded at that functional currency applying the spot exchange rate at the date when the underlying transac-tions are initially recognized. At the end of the reporting peri-od, foreign currency-denominated monetary assets and liabili-ties are re-valued to functional currency applying the spot ex-change rate prevailing at that date. Gains and losses arising from these foreign currency revaluations are recognized in net income. Those foreign currency-denominated transactions which are classified as non-monetary are remeasured using the historical spot exchange rate.
Revenue recognition – Under the condition that persuasive evidence of an arrangement exists revenue is recognized to the extent that it is probable that the economic benefits will flow to the Company and the revenue can be reliably mea-sured, regardless of when the payment is being made. In cases where the inflow of economic benefits is not probable due to customer related credit risks the revenue recognized is subject to the amount of payments irrevocably received. Revenue is measured at the fair value of the consideration received or re-ceivable net of discounts and rebates and excluding taxes or duty. The Company assesses its revenue arrangements against specific criteria in order to determine if it is acting as principal or agent. The following specific recognition criteria must also be met before revenue is recognized:
Sale of goods: Revenue from the sale of goods is recognized when the significant risks and rewards of ownership of the goods have passed to the buyer, usually on delivery of the goods.

1 A. To our Shareholders 49 C. Combined Management Report 21 B. Corporate Governance146
Sales from construction contracts: A construction contract is a contract specifically negotiated for the construction of an as-set or a combination of assets that are closely interrelated or interdependent in terms of their design, technology and func-tion or their ultimate purpose or use. When the outcome of a construction contract can be estimated reliably, revenues from construction-type projects are generally recognized under the percentage-of-completion method, based on the percentage of costs to date compared to the total estimated contract costs, contractual milestones or performance. An expected loss on the construction contract is recognized as an expense immedi-ately. When the outcome of a construction contract cannot be estimated reliably (1) revenue is recognized only to the extent contract costs incurred are probable of being recoverable, and (2) contract costs are recognized as an expense in the period in which they are incurred.
When a contract covers a number of assets, the construction of each asset is treated as a separate construction contract when (1) separate proposals have been submitted for each as-set, (2) each asset has been subject to separate negotiation and the contractor and the customer have been able to accept or reject that part of the contract relating to each asset, and (3) the costs and revenues of each asset can be identified. A group of contracts, whether with a single customer or with several customers, are treated as a single construction contract when (1) the group of contracts is negotiated as a single package, (2) the contracts are so closely interrelated that they are, in effect, part of a single project with an overall profit margin, and (3) the contracts are performed concurrently or in a continuous sequence.
During project execution variation orders by the customer for a change in the scope of the work to be performed under the contract may be received leading to an increase or a decrease in contract revenue. Examples of such variations are changes in the specifications or design of the asset and changes in the duration of the contract.
Rendering of services: Revenues from service transactions are recognized as services are performed. For long-term service contracts, revenues are recognized on a straight-line basis over the term of the contract or, if the performance pattern is other than straight-line, as the services are provided, i.e. gen-erally under the percentage-of-completion method.
Sales from multiple element arrangements: Sales of goods and services as well as software arrangements sometimes in-volve the provision of multiple elements. In these cases, the Company determines whether the contract or arrangement contains more than one unit of accounting. An arrangement is separated if (1) the delivered element(s) has (have) value to
the customer on a stand-alone basis, (2) there is reliable evi-dence of the fair value of the undelivered element(s) and (3), if the arrangement includes a general right of return relative to the delivered element(s), delivery or performance of the unde-livered element(s) is (are) considered probable and substan-tially in the control of the Company. If all three criteria are ful-filled, the appropriate revenue recognition convention is then applied to each separate unit of accounting. Generally, the to-tal arrangement consideration is allocated to the separate units of accounting based on their relative fair values. The hi-erarchy of fair value evidence is as follows: (a) sales prices for the component when it is regularly sold on a stand-alone ba-sis, (b) third-party prices for similar components or, under cer-tain circumstances, (c) cost plus an adequate business-specific profit margin related to the relevant element. By this means, reliable fair values are generally available. However, there might be cases when fair value evidence according to (a) and (b) is not available and the application of the cost plus-method (c) does not create reasonable results because the costs in-curred are not an appropriate base for the determination of the fair value of an element. In such cases the residual method is used, if fair value evidence is available for the undelivered but not for one or more of the delivered elements, i.e. the amount allocated to the delivered elements equals the total arrange-ment consideration less the aggregate fair value of the unde-livered elements. If the three separation criteria (1) to (3) are not met, revenue is deferred until such criteria are met or until the period in which the last undelivered element is delivered. The amount allocable to the delivered elements is limited to the amount that is not contingent upon delivery of additional elements or meeting other specified performance obligations.
Interest income: Interest is recognized using the effective interest method.
Royalties: Royalties are recognized on an accrual basis in accordance with the substance of the relevant agreement.
Income from lease arrangements: Operating lease income for equipment rentals is recognized on a straight-line basis over the lease term. An arrangement that is not in the legal form of a lease is accounted for as a lease if it is dependent on the use of a specific asset or assets and the arrangement conveys a right to use the asset. Receivables from finance leases, in which Siemens as lessor transfers substantially all the risks and rewards incidental to ownership to the customer are rec-ognized at an amount equal to the net investment in the lease. Finance income is subsequently recognized based on a pattern reflecting a constant periodic rate of return on the net invest-ment using the effective interest method. A selling profit component on manufacturing leases is recognized based on the policies for outright sales. Profit from sale and leaseback
135 D. Consolidated Financial Statements 239 E. Additional Information
140 D.5 Consolidated Statements of Changes in Equity 142 D.6 Notes to Consolidated Financial Statements 232 D.7 Supervisory Board and Managing Board
136 D.1 Consolidated Statements of Income 137 D.2 Consolidated Statements of Comprehensive Income 138 D.3 Consolidated Statements of Financial Position 139 D.4 Consolidated Statements of Cash Flow
147
transactions is recognized immediately if significant risks and rewards of ownership have passed to the buyer, the leaseback results in an operating lease and the transaction is established at fair value.
Dividends: Dividends are recognized when the right to receive payment is established.
Functional costs – In general, operating expenses by types are assigned to the functions following the functional area of the corresponding profit and cost centers. Expenses relating to cross-functional initiatives or projects are assigned to the re-spective functional costs based on an appropriate allocation principle. Regarding amortization see NOTE 16 OThEr iNTaNgi-
blE aSSETS, rEgardiNg dEprEciaTiON see NOTE 17 prOpErTy,
plaNT aNd EquipmENT and regarding employee benefit expense see NOTE 34 pErSONNEl cOSTS.
Government grants – Government grants are recognized when there is reasonable assurance that the conditions at-tached to the grants are complied with and the grants will be received. Grants awarded for the purchase or the production of fixed assets (grants related to assets) are generally offset against the acquisition or production costs of the respective assets and reduce future depreciations accordingly. Grants awarded for other than non-current assets (grants related to income) are reported in the Consolidated Statements of Income under the same functional area as the corresponding expenses. They are recognized as income over the periods necessary to match them on a systematic basis to the costs that are intended to be compensated. Government grants for future expenses are recorded as deferred income.
Product-related expenses and losses from onerous con-tracts – Provisions for estimated costs related to product war-ranties are recorded in line item Cost of goods sold and servic-es rendered at the time the related sale is recognized, and are established on an individual basis, except for the standard product business. The estimates reflect historic experience of warranty costs, as well as information regarding product fail-ure experienced during construction, installation or testing of products. In the case of new products, expert opinions and in-dustry data are also taken into consideration in estimating product warranty provisions. Expected losses from onerous contracts are recognized in the period when the current esti-mate of total contract costs exceeds contract revenue.
Research and development costs – Costs of research activi-ties undertaken with the prospect of gaining new scientific or technical knowledge and understanding are expensed as in-curred.
Costs for development activities, whereby research findings are applied to a plan or design for the production of new or substantially improved products and processes, are capitalized if (1) development costs can be measured reliably, the product or process is (2) technically and (3) commercially feasible, (4) future economic benefits are probable and (5) Siemens in-tends, and (6) has sufficient resources, to complete develop-ment and to use or sell the asset. The costs capitalized include the cost of materials, direct labour and other directly attribut-able expenditure that serves to prepare the asset for use. Such capitalized costs are included in line item Other intangible as-sets as other internally generated intangible assets. Other de-velopment costs are expensed as incurred. Capitalized devel-opment costs are stated at cost less accumulated amortization and impairment losses with an amortization period of gener-ally three to five years.
Government grants for research and development activities are offset against research and development costs. They are recognized as income over the periods in which the research and development costs incur that are to be compensated. Gov-ernment grants for future research and development costs are recorded as deferred income.
Earnings per share – Basic earnings per share is computed by dividing income from continuing operations, income from discontinued operations and net income, all attributable to or-dinary shareholders of Siemens AG by the weighted average number of shares outstanding during the year. Diluted earn-ings per share are calculated by assuming conversion or exer-cise of all potentially dilutive securities and share-based pay-ment plans.
Goodwill – Goodwill is not amortized, but instead tested for impairment annually, as well as whenever there are events or changes in circumstances (triggering events) which suggest that the carrying amount may not be recoverable. Goodwill is carried at cost less accumulated impairment losses.
The goodwill impairment test is performed at the level of a cash-generating unit or a group of cash-generating units rep-resented by a Division or equivalent, which is the lowest level at which goodwill is monitored for internal management purposes.
For the purpose of impairment testing, goodwill acquired in a business combination is allocated to the cash-generating unit or the group of cash-generating units that is expected to bene-fit from the synergies of the business combination. If the carry-ing amount of the cash-generating unit or the group of cash-generating units, to which the goodwill is allocated, exceeds its recoverable amount, an impairment loss on goodwill allocated

1 A. To our Shareholders 49 C. Combined Management Report 21 B. Corporate Governance148
to this cash-generating unit or this group of cash-generating units is recognized. The recoverable amount is the higher of the cash-generating unit’s or the group of cash-generating units’ fair value less costs to sell and its value in use. If either of these amounts exceeds the carrying amount, it is not al-ways necessary to determine both amounts. These values are generally determined based on discounted cash flow calcula-tions. Impairment losses on goodwill are not reversed in future periods if the recoverable amount exceeds the carrying amount of the cash-generating unit or the group of cash-gen-erating units to which the goodwill is allocated.
Other intangible assets – Other intangible assets consist of software and other internally generated intangible assets, patents, licenses and similar rights. The Company amortizes intangible assets with finite useful lives on a straight-line basis over their respective estimated useful lives to their estimated residual values. Estimated useful lives for software, patents, licenses and other similar rights generally range from three to five years, except for intangible assets with finite useful lives acquired in business combinations. Intangible assets acquired in business combinations primarily consist of customer rela-tionships and technology. Useful lives in specific acquisitions ranged from seven to twenty-five years for customer relation-ships and from three to twelve years for technology. Intangible assets which are determined to have indefinite useful lives as well as intangible assets not yet available for use are not amor-tized, but instead tested for impairment at least annually.
Property, plant and equipment – Property, plant and equip-ment is valued at cost less accumulated depreciation and im-pairment losses. This also applies to property classified as in-vestment property. Investment property consists of property held either to earn rentals or for capital appreciation or both and not used in production or for administrative purposes. The fair value disclosed for investment property is primarily based on a discounted cash flow approach except for certain cases which are based on appraisal values.
If the costs of certain components of an item of property, plant and equipment are significant in relation to the total cost of the item, they are accounted for and depreciated separately. Depreciation expense is recognized using the straight-line method. Residual values and useful lives are reviewed annual-ly and, if expectations differ from previous estimates, adjusted accordingly. Costs of construction of qualifying assets, i.e. as-sets that require a substantial period of time to be ready for its intended use, include capitalized interest, which is amortized over the estimated useful life of the related asset. The follow-ing useful lives are assumed:
Factory and office buildings 20 to 50 years
Other buildings 5 to 10 years
Technical machinery & equipment 5 to 10 years
Furniture & office equipment generally 5 years
Equipment leased to others generally 3 to 5 years
Impairment of property, plant and equipment and other intangible assets – The Company reviews property, plant and equipment and other intangible assets for impairment whenever events or changes in circumstances indicate that the carrying amount of an asset may not be recoverable. In ad-dition, intangible assets with indefinite useful lives as well as intangible assets not yet available for use are subject to an an-nual impairment test. Recoverability of assets is measured by the comparison of the carrying amount of the asset to the re-coverable amount, which is the higher of the asset’s value in use and its fair value less costs to sell. If assets do not generate cash inflows that are largely independent of those from other assets or groups of assets, the impairment test is not per-formed at an individual asset level, instead, it is performed at the level of the cash-generating unit the asset belongs to. If such assets are considered to be impaired, the impairment to be recognized is measured by the amount by which the carry-ing amount of the assets or cash generating unit exceeds their recoverable amount. If the fair value cannot be determined, the assets’ value in use is applied as their recoverable amount. The assets’ value in use is measured by discounting their esti-mated future cash flows. If there is an indication that the rea-sons which caused the impairment no longer exist, Siemens assesses the need to reverse all or a portion of the impairment.
The Company ’s property, plant and equipment and other in-tangible assets to be disposed of are recorded at the lower of carrying amount or fair value less costs to sell and deprecia-tion is ceased.
Discontinued operations and non-current assets held for disposal – Discontinued operations are reported when a component of an entity comprising operations and cash flows that can be clearly distinguished, operationally and for finan-cial reporting purposes, from the rest of the entity is classified as held for disposal or has been disposed of, if the component either (1) represents a separate major line of business or geo-graphical area of operations and (2) is part of a single co-ordi-nated plan to dispose of a separate major line of business or geographical area of operations or (3) is a subsidiary acquired exclusively with a view to resale. In the Consolidated State-ments of Income, income (loss) from discontinued operations

135 D. Consolidated Financial Statements 239 E. Additional Information
140 D.5 Consolidated Statements of Changes in Equity 142 D.6 Notes to Consolidated Financial Statements 232 D.7 Supervisory Board and Managing Board
136 D.1 Consolidated Statements of Income 137 D.2 Consolidated Statements of Comprehensive Income 138 D.3 Consolidated Statements of Financial Position 139 D.4 Consolidated Statements of Cash Flow
149
is reported separately from income and expenses from con-tinuing operations; prior periods are presented on a compara-ble basis. In the Consolidated Statements of Cash Flow, the cash flows from discontinued operations are presented sepa-rately from cash flows of continuing operations; prior periods are presented on a comparable basis. The disclosures in the Notes to the Consolidated Financial Statements outside
NOTE 4 acquiSiTiONS, diSpOSiTiONS aNd diScONTiNuEd OpEra-
TiONS that refer to the Consolidated Statements of Income and the Consolidated Statements of Cash Flow generally relate to continuing operations. Siemens reports discontinued opera-tions separately in NOTE 4 acquiSiTiONS, diSpOSiTiONS aNd diS-
cONTiNuEd OpEraTiONS. In order to present the financial effects of a discontinued operation revenues and expenses arising from intragroup transactions are eliminated except for those revenues and expenses that are considered to continue after the disposal of the discontinued operation. In any case no profit or loss is recognized for intragroup transactions.
Siemens classifies a non-current asset or a disposal group as held for disposal if its carrying amount will be recovered prin-cipally through a sale transaction or through distribution to shareholders rather than through continuing use. For this to be the case, the asset or disposal group must be available for immediate sale or distribution in its present condition subject only to terms that are usual and customary for sales or distri-butions of such assets or disposal groups and its sale or distri-bution must be highly probable. The disclosures in Notes to Consolidated Financial Statements outside NOTE 4 acquiSi-
TiONS, diSpOSiTiONS aNd diScONTiNuEd OpEraTiONS that refer to the Consolidated Statements of Financial Position generally re-late to assets that are not held for disposal. Siemens reports non-current assets or disposal groups held for disposal sepa-rately in NOTE 4 acquiSiTiONS, diSpOSiTiONS aNd diScONTiNuEd
OpEraTiONS. Non-current assets classified as held for disposal and disposal groups are measured at the lower of their carry-ing amount and fair value less costs to sell, unless these items presented in the disposal group are not part of the measure-ment scope as defined in IFRS 5, Non-current Assets held for Sale and Discontinued Operations.
Income taxes – The Company applies IAS 12 Income taxes. Current taxes are calculated based on the profit (loss) of the fiscal year and in accordance with local tax rules of the tax ju-risdiction respectively. Expected and executed additional tax payments respectively tax refunds for prior years are also tak-en into account. Under the liability method, deferred tax as-sets and liabilities are recognized for future tax consequences attributable to differences between the financial statement carrying amounts of existing assets and liabilities and their re-spective tax bases. The effect on deferred tax assets and liabili-ties of a change in tax rates is recognized in the income state-
ment, unless related to items directly recognized in equity, in the period the new laws are enacted or substantively enacted. Deferred tax assets are recognized to the extent that it is prob-able that future taxable income will be available against which the deductible temporary differences, unused tax losses and unused tax credits can be utilized.
Inventories – Inventories are valued at the lower of acquisi-tion or production costs and net realizable value, costs being generally determined on the basis of an average or first-in, first-out method. Production costs comprise direct material and labor and applicable manufacturing overheads, including depreciation charges. Net realizable value is the estimated sell-ing price in the ordinary course of business, less the estimated costs of completion and selling expenses.
Defined benefit plans – Siemens measures the entitlements of the defined benefit plans by applying the projected unit credit method. The approach reflects an actuarially calculated net present value of the future benefit entitlement for services already rendered. In determining the net present value of the future benefit entitlement for service already rendered (De-fined Benefit Obligation (DBO)), Siemens considers future compensation and benefit increases, because the employee’s final benefit entitlement at regular retirement age depends on future compensation or benefit increases. For post-employ-ment healthcare benefits, Siemens considers health care trends in the actuarial valuations.
For unfunded plans, Siemens recognizes a pension liability equal to the DBO adjusted by unrecognized past service cost. For fund-ed plans, Siemens offsets the fair value of the plan assets with the benefit obligations. Siemens recognizes the net amount, af-ter adjustments for effects relating to unrecognized past service cost and any asset ceiling, in line item Pension plans and similar commitments or in line item Other current assets.
Actuarial gains and losses, resulting for example from an ad-justment of the discount rate or from a difference between ac-tual and expected return on plan assets, are recognized by Siemens in the Consolidated Statements of Comprehensive In-come in the year in which they occur. Those effects are record-ed in full directly in equity, net of tax.
Provisions – A provision is recognized in the Statement of Financial Position when the Company has a present legal or constructive obligation as a result of a past event, it is probable that an outflow of economic benefits will be required to settle the obligation and a reliable estimate can be made of the amount of the obligation. If the effect is material, provisions are recognized at present value by discounting the expected future cash flows at a pretax rate that reflects current market

1 A. To our Shareholders 49 C. Combined Management Report 21 B. Corporate Governance150
assessments of the time value of money. When a contract be-comes onerous, the present obligation under the contract is recognized as a provision and measured at the lower of the ex-pected cost of fulfilling the contract and the expected cost of terminating the contract as far as they exceed the expected economic benefits of the contract. Additions to provisions and reversals are generally recognized in the Consolidated State-ments of Income. The present value of the recognized obliga-tions associated with the retirement of property, plant and equipment (asset retirement obligations) that result from the acquisition, construction, development or normal use of an as-set is added to the carrying amount of the related asset. The additional carrying amount is depreciated over the useful life of the related asset. Additions to and reductions from the pres-ent value of asset retirement obligations that result from changes in estimates are generally recognized by adjusting the carrying amount of the related asset and provision. If the asset retirement obligation is settled for other than the carrying amount of the liability, the Company recognizes a gain or loss on settlement.
Termination benefits – Termination benefits are recognized in the period incurred and when the amount is reasonably es-timable. Termination benefits in accordance with IAS 19, Em-ployee Benefits, are recognized as a liability and an expense when the entity has demonstrably committed itself, through a formal termination plan or otherwise created a valid expecta-tion, to either provide termination benefits as a result of an of-fer made in order to encourage voluntary redundancy or termi-nate employment before the normal retirement date.
Financial instruments – A financial instrument is any con-tract that gives rise to a financial asset of one entity and a financial liability or equity instrument of another entity. Finan-cial assets of the Company mainly include cash and cash equivalents, available-for-sale financial assets, trade receiv-ables, loans receivable, finance lease receivables and deriva-tive financial instruments with a positive fair value. Cash and cash equivalents are not included within the category avail-able-for-sale financial assets as these financial instruments are not subject to fluctuations in value. Siemens does not make use of the category held to maturity. Financial liabilities of the Company mainly comprise notes and bonds, loans from banks, trade payables, finance lease payables and derivative financial instruments with a negative fair value. Siemens does not make use of the option to designate financial assets or financial lia-bilities at fair value through profit or loss at inception (Fair Value Option). Based on their nature, financial instruments are classified as financial assets and financial liabilities measured at cost or amortized cost and financial assets and financial lia-bilities measured at fair value and as receivables from finance leases.
Financial instruments are recognized on the Consolidated State-ments of Financial Position when Siemens becomes a party to the contractual obligations of the instrument. Regular way pur-chases or sales of financial assets, i.e. purchases or sales under a contract whose terms require delivery of the asset within the time frame established generally by regulation or convention in the marketplace concerned, are accounted for at the trade date.
Initially, financial instruments are recognized at their fair val-ue. Transaction costs directly attributable to the acquisition or issue of financial instruments are only recognized in determin-ing the carrying amount, if the financial instruments are not measured at fair value through profit or loss. Finance lease re-ceivables are recognized at an amount equal to the net invest-ment in the lease. Subsequently, financial assets and liabilities are measured according to the category – cash and cash equiv-alents, available-for-sale financial assets, loans and receiv-ables, financial liabilities measured at amortized cost or finan-cial assets and liabilities classified as held for trading – to which they are assigned.
Cash and cash equivalents – The Company considers all highly liquid investments with less than three months maturi-ty from the date of acquisition to be cash equivalents. Cash and cash equivalents are measured at cost.
Available-for-sale financial assets – Investments in equity instruments, debt instruments and fund shares are all classified as available-for-sale financial assets and are measured at fair value, if reliably measurable. Unrealized gains and losses, net of applicable deferred income taxes, are recognized in line item Other comprehensive income, net of tax. Provided that fair val-ue cannot be reliably determined, Siemens measures available-for-sale financial instruments at cost. This applies to equity in-struments that do not have a quoted market price in an active market, and decisive parameters cannot be reliably estimated to be used in valuation models for the determination of fair value.
When available-for-sale financial assets incur a decline in fair value below acquisition cost and there is objective evidence that the asset is impaired, the cumulative loss that has been recognized in equity is removed from equity and recognized in the Consolidated Statements of Income. The Company consid-ers all available evidence such as market conditions and pric-es, investee-specific factors and the duration as well as the ex-tent to which fair value is less than acquisition cost in evaluat-ing potential impairment of its available-for-sale financial as-sets. The Company considers a decline in fair value as objective evidence of impairment, if the decline exceeds 20% of costs or continues for more than six months. An impairment loss for debt instruments is reversed in subsequent periods, if the rea-sons for the impairment no longer exist.

135 D. Consolidated Financial Statements 239 E. Additional Information
140 D.5 Consolidated Statements of Changes in Equity 142 D.6 Notes to Consolidated Financial Statements 232 D.7 Supervisory Board and Managing Board
136 D.1 Consolidated Statements of Income 137 D.2 Consolidated Statements of Comprehensive Income 138 D.3 Consolidated Statements of Financial Position 139 D.4 Consolidated Statements of Cash Flow
151
Loans and receivables – Financial assets classified as loans and receivables are measured at amortized cost using the ef-fective interest method less any impairment losses. Impair-ment losses on trade and other receivables are recognized us-ing separate allowance accounts. Loans and receivables bear-ing no or lower interest rates compared to market rates with a maturity of more than one year are discounted.
Financial liabilities – Siemens measures financial liabilities, except for derivative financial instruments, at amortized cost using the effective interest method.
Derivative financial instruments – Derivative financial in-struments, such as foreign currency exchange contracts and interest rate swap contracts, are measured at fair value. Deriv-ative financial instruments are classified as held for trading un-less they are designated as hedging instruments, for which hedge accounting is applied. Changes in the fair value of deriv-ative financial instruments are recognized periodically either in net income or, in the case of a cash flow hedge, in line item Other comprehensive income, net of tax (applicable deferred income taxes). Certain derivative instruments embedded in host contracts are also accounted for separately as derivatives.
Fair value hedges – The carrying amount of the hedged item is adjusted by the gain or loss attributable to the hedged risk. Where an unrecognized firm commitment is designated as hedged item, the subsequent cumulative change in its fair val-ue is recognized as a separate financial asset or liability with corresponding gain or loss recognized in net income.
For hedged items carried at amortized cost, the adjustment is amortized until maturity of the hedged item. For hedged firm commitments the initial carrying amount of the assets or liabili-ties that result from meeting the firm commitments are adjust-ed to include the cumulative changes in the fair value that were previously recognized as separate financial assets or liabilities.
Cash flow hedges – The effective portion of changes in the fair value of derivative instruments designated as cash flow hedges are recognized in line item Other comprehensive income, net of tax (applicable deferred income taxes), and any ineffective portion is recognized immediately in net income. Amounts accu-mulated in equity are reclassified into net income in the same periods in which the hedged item affects net income.
Share-based payment – IFRS 2, Share-based payment, distin-guishes between cash-settled and equity-settled share-based payment transactions. For both types, the fair value is mea-sured at grant date and compensation expense is recognized over the vesting period during which the employees become unconditionally entitled to the awards granted. Cash-settled
awards are re-measured at fair value at the end of each report-ing period and upon settlement. Siemens uses an option pric-ing model to determine the fair value of stock options. The fair value of other share-based awards, such as stock awards, matching shares, and shares granted under the Jubilee Share Program, is determined as the market price of Siemens shares, considering dividends during the vesting period the grantees are not entitled to and market conditions and non-vesting con-ditions, if applicable.
Prior-year information – The presentation of certain prior-year information has been reclassified to conform to the current year presentation.
rEcENTly adOpTEd accOuNTiNg prONOuNcEmENTSIn October 2010, the IASB issued amendments to IFRS 7, Finan-cial Instruments: Disclosures, which enhance the disclosure requirements, hence maintain the derecognition model of IAS 39. The amendments increase the disclosure requirements for transfers of financial assets where the transferor retains con-tinuing involvement in the transferred asset; additional disclo-sures are required if a disproportionate amount of transfer transactions are undertaken around the end of a reporting pe-riod. The amendment is applicable for annual reporting peri-ods beginning on or after July 1, 2011; early adoption is permit-ted. The adoption of IFRS 7 did not result in a material impact on the Company ’s Consolidated Financial Statements.
In June 2011, the IASB issued Presentation of Items of Other Comprehensive Income (Amendments to IAS 1), which re-quires the grouping of items presented in other comprehen-sive income on the basis of whether they are potentially reclas-sifiable to profit or loss subsequently. The Company early adopted the amendment as of September 30, 2012.
rEcENT accOuNTiNg prONOuNcEmENTS, NOT yET adOpTEdThe following pronouncements, issued by the IASB, are not yet effective and have not yet been adopted by the Company:
In December 2011, the IASB issued amendments to IAS 32, Financial Instruments: Presentation and IFRS 7, Financial In-struments: Disclosures regarding offsetting of financial assets and financial liabilities. The amendment to IAS 32 clarifies the existing offsetting rules and is effective for reporting periods beginning on or after January 1, 2014, early application is per-mitted, however it requires the application of the amendments to IFRS 7. These amendments to IFRS 7 expand the disclosure requirements for financial assets and financial liabilities offset in the statements of financial position including netting agree-ments where netting is subject to certain future events. This

1 A. To our Shareholders 49 C. Combined Management Report 21 B. Corporate Governance152
amendment is effective for reporting periods beginning on or after January 1, 2013. Both amendments have not yet been en-dorsed by the European Union.
In June 2011, the IASB issued IAS 19, Employee Benefits (revised 2011; IAS 19R). The Company expects the following amendments to have a significant impact on the Company ’s Consolidated Financial Statements: IAS 19R replaces the expected return on as-sets and interest costs on the defined benefit obligation with a single net interest component; unvested past service costs will be recognized in income immediately when incurred. IAS 19R also includes enhanced presentation and disclosure requirements. The standard is effective for annual periods beginning on or after January 1, 2013; early application is permitted. The amendment has been endorsed by the European Union in June 2012. The Company will adopt the revised standard in fiscal 2013. IAS 19R requires retrospective application and the presentation of transi-tion effects for the opening statement of financial position as of October 1, 2011 for which Siemens does not expect significant effects on the line items Total comprehensive income as well as Total equity. For fiscal 2012, expenses from pensions increase approximately by €360 million pre-tax once IAS 19R is applied. For fiscal 2013 the expenses from pensions would approximately be level to the adjusted expenses from pensions in fiscal 2012.
In May 2011, the IASB published its improvements to the ac-counting and disclosure requirements for consolidation, off balance sheet activities and joint arrangements by issuing IFRS 10, Consolidated Financial Statements, IFRS 11, Joint Arrange-ments, IFRS 12, Disclosure of Interests in Other Entities and consequential amendments to IAS 27, Separate Financial State-ments (amended 2011) and IAS 28, Investments in Associates and Joint Ventures (amended 2011).
IFRS 10 builds on existing principles by identifying a compre-hensive concept of control as the determining factor in whether an entity should be included within the Consolidated Financial Statements. The standard provides additional guidance to assist in the determination of control where this is difficult to assess.
IFRS 11 provides guidance for the accounting of joint arrange-ments by focusing on the rights and obligations of the arrange-ment, rather than its legal form.
IFRS 12 is a new and comprehensive standard on disclosure re-quirements for all forms of interests in other entities, includ-ing joint arrangements, associates, structured entities and off balance sheet vehicles.
IFRS 10, 11, 12 and the consequential amendments to IAS 27 and IAS 28 are effective for annual periods beginning on or af-ter January 1, 2013. These new or amended standards may be
adopted early, however all as of the same date, except that an entity may early adopt the disclosure provisions of IFRS 12. The standards are to be applied on a retrospective basis. IFRS 10, 11, 12, and the consequential amendments to IAS 27 and IAS 28 are not endorsed by the European Union yet. Siemens will adopt IFRS 10, 11, 12, and the consequential amendments to IAS 27 and IAS 28 in fiscal 2014. The Company does not expect a material impact on its Consolidated Financial Statements from these standards.
In May 2011, the IASB issued IFRS 13, Fair Value Measurement. The new standard defines fair value and standardizes disclo-sures on fair value measurements of both financial and non- financial instrument items. The new standard is applicable for annual periods beginning on or after January 1, 2013; early adoption is permitted. IFRS 13 is not endorsed by the European Union yet. Siemens will adopt IFRS 13 in fiscal 2014. Regarding financial instruments, the majority of changes required by IFRS 13 have already been introduced, mainly by amendments to IFRS 7, Financial Instruments: Disclosures. The Company does not expect a material impact on the Consolidated Finan-cial Statements upon adopting IFRS 13.
In November 2009, the IASB issued IFRS 9, Financial Instru-ments. This standard is the first phase of the IASB’s three-phase project to replace IAS 39, Financial Instruments: Recognition and Measurement. IFRS 9 amends the classification and mea-surement requirements for financial assets, including some hy-brid contracts. It uses a single approach to determine whether a financial asset is measured at amortized cost or at fair value, re-placing the different rules in IAS 39. The approach in IFRS 9 is based on how an entity manages its financial instruments (its business model) and the contractual cash flow characteristics of the financial assets. The new standard also requires a single im-pairment method to be used, replacing the different impair-ment methods in IAS 39. In December 2011, the IASB deferred the mandatory effective date from annual reporting periods be-ginning on or after January 1, 2013 to annual reporting periods beginning on or after January 1, 2015; early application is per-mitted. The IASB also provided relief from restating comparative financial statements for the effect of applying IFRS 9; instead additional transition disclosures will be required. The European Financial Reporting Advisory Group postponed its endorsement advice, to take more time to consider the output from the IASB project to improve accounting for financial instruments. The Company is currently assessing the impacts of adopting IFRS 9 on the Company ’s Consolidated Financial Statements.
The IASB issued various other pronouncements. These recent-ly adopted pronouncements as well as pronouncements not yet adopted do not have a material impact on Siemens’ Consol-idated Financial Statements.

135 D. Consolidated Financial Statements 239 E. Additional Information
140 D.5 Consolidated Statements of Changes in Equity 142 D.6 Notes to Consolidated Financial Statements 232 D.7 Supervisory Board and Managing Board
136 D.1 Consolidated Statements of Income 137 D.2 Consolidated Statements of Comprehensive Income 138 D.3 Consolidated Statements of Financial Position 139 D.4 Consolidated Statements of Cash Flow
153
NOTE 3 Critical accounting estimates
Siemens’ Consolidated Financial Statements are prepared in ac-cordance with IFRS as issued by the IASB and as adopted by the EU. Siemens’ significant accounting policies, as described in
NOTE 2 Summary Of SigNificaNT accOuNTiNg pOliciES are es-sential to understanding the Company ’s results of operations, financial positions and cash flows. Certain of these accounting policies require critical accounting estimates that involve com-plex and subjective judgments and the use of assumptions, some of which may be for matters that are inherently uncertain and susceptible to change. Such critical accounting estimates could change from period to period and have a material impact on the Company ’s results of operations, financial positions and cash flows. Critical accounting estimates could also involve es-timates where management reasonably could have used a dif-ferent estimate in the current accounting period. Management cautions that future events often vary from forecasts and that estimates routinely require adjustment.
Revenue recognition on construction contracts – The Company ’s Sectors, particularly Energy, Industry and Infra-structure & Cities, conduct a significant portion of their busi-ness under construction contracts with customers. The Company generally accounts for construction projects using the percentage-of-completion method, recognizing revenue as performance on contract progresses. Certain long-term service contracts are accounted for under the percentage-of-comple-tion method as well. This method places considerable impor-tance on accurate estimates of the extent of progress towards completion and may involve estimates on the scope of deliver-ies and services required for fulfilling the contractually defined obligations. Depending on the methodology to determine con-tract progress, the significant estimates include total contract costs, remaining costs to completion, total contract revenues, contract risks, including technical, political and regulatory risks, and other judgments. Management of the operating Divisions continually reviews all estimates involved in such construction contracts, including commercial feasibility, and adjusts them as necessary. Under the percentage-of-comple-tion method, such changes in estimates may lead to an in-crease or decrease of revenues in the respective reporting pe-riod. The Company also uses the percentage-of-completion method for projects financed directly or indirectly by Siemens. In order to qualify for such accounting, the credit quality of the customer must meet certain minimum parameters as evi-denced by the customer’s credit rating or by a credit analysis performed by Financial Services (SFS). At a minimum, a cus-tomer’s credit rating must be single B or B2 respectively from external rating agencies or an equivalent SFS-determined rat-ing. In cases the inflow of economic benefits is not probable due to customer related credit risks the revenue is restricted to
the amount of payments irrevocably received. The Company believes the credit factors used provide a reasonable basis for assessing credit quality.
Trade and other receivables – The allowance for doubtful accounts involves significant management judgment and re-view of individual receivables based on individual customer creditworthiness, current economic trends including the de-velopments of the European sovereign debt crisis and analysis of historical bad debts on a portfolio basis. For the determina-tion of the country-specific component of the individual allow-ance, we also consider country credit ratings, which are cen-trally determined based on information from external rating agencies. Regarding the determination of the valuation allow-ance derived from a portfolio-based analysis of historical bad debts, a decline of receivables in volume results in a corre-sponding reduction of such provisions and vice versa. As of September 30, 2012 and 2011, Siemens recorded a total valua-tion allowance for trade and other receivables of €1,190 million and €1,147 million, respectively.
Impairment – Siemens tests at least annually whether good-will has incurred any impairment, in accordance with its ac-counting policy. The determination of the recoverable amount of a cash-generating unit or a group of cash-generating units to which goodwill is allocated involves the use of estimates by management. The outcome predicted by these estimates is in-fluenced e.g. by the successful integration of acquired enti-ties, volatility of capital markets, interest rate developments, foreign exchange rate fluctuations and the outlook on eco-nomic trends. The recoverable amount is the higher of the cash-generating unit’s or the group of cash-generating units’ fair value less costs to sell and its value in use. The Company generally uses discounted cash flow based methods to deter-mine these values. These discounted cash flow calculations use five-year projections that are based on financial plannings. Cash flow projections take into account past experience and represent management’s best estimate about future develop-ments. Cash flows after the planning period are extrapolated using individual growth rates. Key assumptions on which management has based its determination of fair value less costs to sell and value in use include estimated growth rates, weighted average cost of capital and tax rates. These esti-mates, including the methodology used, can have a material impact on the respective values and ultimately the amount of any goodwill impairment. In fiscal 2011, the Company assessed the current commercial feasibility of its solar and hydro busi-ness, the level at which goodwill is monitored from the group perspective, as part of the Renewable Energy Division of the Energy Sector and recorded a goodwill impairment loss. Fur-ther impairments were recorded in fiscal 2012. These impair-ments are presented in discontinued operations.

1 A. To our Shareholders 49 C. Combined Management Report 21 B. Corporate Governance154
Likewise, whenever property, plant and equipment, other in-tangible assets and investments accounted for using the equi-ty method are tested for impairment, the determination of the assets’ recoverable amount involves the use of estimates by management and can have a material impact on the respective values and ultimately the amount of any impairment.
The equity method requires an analysis of triggering events for impairment or reversal of impairment. Whether future im-pairments or a reversal of the impairment of our investment in Nokia Siemens Networks B.V. (NSN) will be required is depen-dent on its ability to grow and (or) otherwise return to increas-ing profitability.
Non-current assets and disposal groups classified as held for disposal – Assets held for disposal and disposal groups are measured at the lower of their carrying amount and their fair value less costs to sell. The determination of the fair value less costs to sell includes the use of management es-timates and assumptions that tend to be uncertain.
In the fourth quarter of fiscal 2012, Siemens decided to sell its solar business consisting of the Business Units Solar Thermal Energy and Photovoltaics. As of the end of fiscal 2012 Siemens classified each business unit as held for disposal and discon-tinued operation as a sale within one year is considered highly probable by the management.
In June 2012, Siemens classified OSRAM as held for disposal and discontinued operations as a listing via spin-off within one year was considered highly probable. This expectation is based on management’s judgment considering the obligatory share-holder approval based on past experience with other capital matters suggested for approval at the general shareholders’ meeting, feedback from the financial market and the economic rationale of the decision from a shareholder perspective.
In fiscal 2011, the disposal group Siemens IT Solutions and Ser-vices was measured at fair value less costs to sell upon classifi-cation as held for disposal and discontinued operation. The fair value was assumed to be represented by the purchase price as negotiated between Siemens and Atos S.A. (AtoS) including the consideration that AtoS committed itself to pay for the transfer of Siemens IT Solutions and Services less commit-ments entered into by Siemens. The valuation of these com-mitments involves subjective judgment by management on the probability, timing and amount of these obligations. These management estimates had an effect on the amount of impair-ment losses recognized during fiscal 2011 and on the deconsol-idation result recognized in the fourth quarter of fiscal 2011 as well as on the subsequent measurement of the obligations in
fiscal 2012. These estimates are subject to change and thus any variation to the estimates could influence the amount of the total loss on the disposal of Siemens IT Solutions and Services presented within discontinued operations beyond fiscal 2011.
Employee benefit accounting – Pension plans and similar commitments – Obligations for pension and other post-em-ployment benefits and related net periodic benefit costs are determined in accordance with actuarial valuations. These val-uations rely on key assumptions including discount rates, expected return on plan assets, expected salary increases, mortality rates and health care trend rates. The discount rate assumptions are determined by reference to yields on high-quality corporate bonds of appropriate duration and currency at the end of the reporting period. In case such yields are not available discount rates are based on government bonds yields. Expected returns on plan assets assumptions are deter-mined on a uniform methodology, considering long-term his-torical returns and asset allocations. Due to changing market and economic conditions the underlying key assumptions may differ from actual developments and may lead to significant changes in pension and other post-employment benefit obli-gations. Such differences are recognized in full directly in equity in the period in which they occur without affecting profit or loss. For a sensitivity analysis, see NOTE 23, pENSiON
plaNS aNd Similar cOmmiTmENTS.
Provisions – Significant estimates are involved in the deter-mination of provisions related to onerous contracts, warranty costs, asset retirement obligations and legal proceedings. A significant portion of the business of certain operating divi-sions is performed pursuant to long-term contracts, often for large projects, in Germany and abroad, awarded on a competi-tive bidding basis. Siemens records a provision for onerous sales contracts when current estimates of total contract costs exceed expected contract revenue. Such estimates are subject to change based on new information as projects progress to-ward completion. Onerous sales contracts are identified by monitoring the progress of the project and updating the esti-mate of total contract costs which also requires significant judgment relating to achieving certain performance stan-dards, for example in the Mobility & Logistics Division, Indus-try Automation Division, at Healthcare, in the Fossil Power Generation Division and in the Power Transmission Division as well as estimates involving warranty costs and estimates regarding project delays including the assessment of respon-sibility splits between the contract partners for these delays. Significant estimates and assumptions are also involved in the determination of provisions related to major asset retire-ment obligations. Uncertainties surrounding the amount to be recognized include, for example, the estimated costs of

135 D. Consolidated Financial Statements 239 E. Additional Information
140 D.5 Consolidated Statements of Changes in Equity 142 D.6 Notes to Consolidated Financial Statements 232 D.7 Supervisory Board and Managing Board
136 D.1 Consolidated Statements of Income 137 D.2 Consolidated Statements of Comprehensive Income 138 D.3 Consolidated Statements of Financial Position 139 D.4 Consolidated Statements of Cash Flow
155
decommissioning because of the long time frame over which future cash outflows are expected to occur including the re-spective interest accretion. Amongst others, the estimated cash outflows could alter significantly if, and when, political developments affect the government’s plans to develop the final storage.
Siemens is subject to legal and regulatory proceedings in vari-ous jurisdictions. Such proceedings may result in criminal or civ-il sanctions, penalties or disgorgements against the Company. If it is more likely than not that an obligation of the Company exists and will result in an outflow of resources, a provision is recorded if the amount of the obligation can be reliably estimat-ed. Regulatory and legal proceedings as well as government in-vestigations often involve complex legal issues and are subject to substantial uncertainties. Accordingly, management exercis-es considerable judgment in determining whether there is a present obligation as a result of a past event at the end of the re-porting period, whether it is more likely than not that such a proceeding will result in an outflow of resources and whether the amount of the obligation can be reliably estimated. The Company periodically reviews the status of these proceedings with both inside and outside counsel. These judgments are sub-ject to change as new information becomes available. The re-quired amount of a provision may change in the future due to new developments in the particular matter. Revisions to esti-mates may significantly impact future net income. Upon resolu-tion, Siemens may incur charges in excess of the recorded pro-visions for such matters. It cannot be excluded, that the finan-cial position or results of operations of Siemens will be materi-ally affected by an unfavorable outcome of legal or regulatory proceedings or government investigations.
Income taxes – Siemens operates in various tax jurisdictions and therefore has to determine tax positions under respective local tax laws and tax authorities’ views which can be complex and subject to different interpretations of taxpayers and local tax authorities. Deferred tax assets are recognized if sufficient future taxable profit is available, including income from fore-casted operating earnings, the reversal of existing taxable temporary differences and established tax planning opportuni-ties. As of each period-end, management evaluates the recov-erability of deferred tax assets, based on projected future tax-able profits. As future developments are uncertain and partly beyond management’s control, assumptions are necessary to estimate future taxable profits as well as the period in which deferred tax assets will recover. Estimates are revised in the period in which there is sufficient evidence to revise the as-sumption. If management considers it probable that all or a portion of a deferred tax asset cannot be realized, a corre-sponding valuation allowance is taken into account.
NOTE 4 Acquisitions, dispositions and discontinued operations
a) acquiSiTiONSIn fiscal 2012 and 2011, the Company completed a number of acquisitions, which are included in the Company ’s Consolidat-ed Financial Statements since the date of acquisition.
aa) Acquisitions in fiscal 2012At the beginning of May 2012, Siemens acquired all of the shares of five entities constituting the Connectors and Mea-surements division of Expro Holdings UK 3 Ltd. The acquired business engineers and manufactures subsea components such as cable connectors, sensors and measuring devices. With this acquisition Siemens aimed for strategically expand-ing its portfolio in the attractive future market for subsea pow-er grids. The aggregate consideration amounts to €469 million (including €8 million cash acquired). The acquired business will be integrated into Energy Sector’s Oil & Gas Division. The following figures represent the preliminary purchase price al-location and show the amounts recognized as of the acquisi-tion date for each major class of assets acquired and liabilities assumed: Intangible assets €164 million, Property, plant and equipment €23 million, Inventories €19 million, Receivables €25 million, Liabilities €36 million and Deferred income tax li-abilities €38 million. Intangible assets mainly relate to custom-er relationships of €46 million with useful lives from nine to 13 years, technology of €100 million with a useful life of eight to twelve years and order backlog of €12 million with a useful life of two years. Goodwill of €300 million comprises intangible as-sets that are not separable such as employee know-how and expected synergy effects. Including effects from purchase ac-counting and integration costs, the acquired business contrib-uted revenues of €57 million and a net profit of €12 million to Siemens for the period from acquisition to September 30, 2012. If the acquired business had been included as of October 1, 2011, the impact on consolidated revenues and consolidated net income for the twelve months ended September 30, 2012 would have been €121 million and €41 million, respectively.
Furthermore, in fiscal 2012, Siemens completed the acquisition of a number of entities, presented in continuing operations, which are not significant individually including RuggedCom Inc., a provider of robust, industrial-quality Ethernet communi-cation products and network solutions at the Industry Sector’s Industry Automation Division, the NEM B.V. business, a special-ist in heat recovery steam generators for combined-cycle (gas and steam) power plants at Energy Sector’s Fossil Power Gener-ation Division and eMeter Corporation, a meter data manage-ment specialist at Infrastructure & Cities Sector’s Smart Grid Division. The aggregate consideration (including cash acquired) of all of these acquisitions amounts to €946 million.

1 A. To our Shareholders 49 C. Combined Management Report 21 B. Corporate Governance156
The following figures represent the preliminary purchase price allocations and show the amounts recognized for each major class of assets acquired and liabilities assumed:
(in millions of €)
Goodwill 571
Technology 126
Customer Relationships 117
Other intangible assets 49
Other long-lived assets 56
Trade and other receivables 82
Inventories 39
Other current assets 70
Cash and cash equivalents 138
Total assets acquired 1,248
Other liabilities and provisions 151
Deferred tax liabilities 52
Current liabilities 76
Total liabilities assumed 279
The respective acquisitions led to non-controlling interests of €23 million. Goodwill comprises intangible assets that are not separable such as employee know how and expected synergy effects. Including purchase price accounting effects and inte-gration costs, the acquired entities contributed revenues of €271 million and a net loss of €6 million to Siemens for the peri-od from the respective acquisition date to September 30, 2012. If these acquired business had been included as of October 1, 2011, the impact on consolidated revenues and consolidated net income for the twelve months ended September 30, 2012 would have been €389 million and €(14) million respectively.
ab) Acquisitions in fiscal 2011In January 2011, Siemens made a binding offer to purchase ad-ditional shares in order to increase its stake in its publicly list-ed Indian subsidiary Siemens Ltd. from about 55% to a maxi-mum of 75%. The Company offered the shareholders of Siemens Ltd. to purchase their shares for a price of INR 930 million per share (written put). The offer period began on March 25, 2011 and ended on April 13, 2011. The offer was ac-cepted in full until that date and the transaction was complet-ed at the end of April 2011. At the date of public announce-ment, the purchase was accounted for as acquisition of non-controlling interests qualifying as a transaction between shareholders, as present ownership was transferred. As a re-sult, line items Retained earnings and Non-controlling inter-
ests decreased by €857 million and €121 million, respectively. Transaction costs, net of tax, were deducted from equity. Line item Other comprehensive income was proportionally reallo-cated between line items Non-controlling interests and Total equity attributable to shareholders of Siemens AG.
In fiscal 2011, Siemens additionally acquired various entities, which were not material, either individually or in aggregate.
b) diSpOSiTiONS aNd diScONTiNuEd OpEraTiONSba) Dispositions not qualifying for discontinued operations: closed transactionsDispositions in fiscal 2012In fiscal 2012, Siemens completed the disposition of various entities which are not significant either individually or in ag-gregate.
Dispositions in fiscal 2011In January 2009, Siemens had announced that it will terminate the Shareholders Agreement of the joint venture Areva NP S.A.S. and sell its 34% interest in Areva NP S.A.S. to the majority shareholder Areva S.A. (Areva) by exercising the put option. Following this, Areva NP S.A.S. had been presented as asset held for disposal since the second quarter of fiscal 2009 with a carrying amount of €190 million. In March 2011, an indepen-dent expert, appointed by Siemens and Areva based on the rules set forth in the shareholders’ agreement, determined the fair market value (purchase price) of Siemens’ 34% share in the joint venture Areva NP S.A.S. Following this, the shares, previ-ously accounted for as an available-for-sale financial asset held for disposal at the Energy Sector, were transferred to Areva and derecognized at Siemens. In May 2011, an arbitral tribunal of the International Chamber of Commerce ruled on the modali-ties of Siemens’ exit from the joint venture Areva NP S.A.S. The two transactions in connection with the sale of Areva NP S.A.S resulted in a gain of €838 million in fiscal 2011 which was rec-ognized in Income (expense) from available-for-sale financial assets, net and which can be split up in a €1,520 million dispos-al gain in the second quarter of fiscal 2011 related to the termi-nation of the Areva NP S.A.S. joint venture and a loss of €682 million incurred in the third quarter on the arbitrational ruling related to Siemens’ exit from the joint venture Areva NP S.A.S.
In January 2011, the sale of the 49% interest in Krauss-Maffei Wegmann GmbH & Co. KG (KMW) to Wegmann Group was closed after the approval of the antitrust authorities and the receipt of the second purchase price installment. The gain on the sale of KMW, which used to be reported in Equity Investments, was in-cluded in line item Income (loss) from investments accounted for using the equity method, net and amounts to €90 million.

135 D. Consolidated Financial Statements 239 E. Additional Information
140 D.5 Consolidated Statements of Changes in Equity 142 D.6 Notes to Consolidated Financial Statements 232 D.7 Supervisory Board and Managing Board
136 D.1 Consolidated Statements of Income 137 D.2 Consolidated Statements of Comprehensive Income 138 D.3 Consolidated Statements of Financial Position 139 D.4 Consolidated Statements of Cash Flow
157
At the end of July 2010, Siemens signed an agreement to sell its Electronics Assembly Systems business (EA), which was re-ported in Centrally managed portfolio activities, to ASM Pacific Technology Ltd. The transaction closed at the beginning of January 2011. Total losses on disposal of EA amounted to €107 million, including a loss amounting to €1 million in fiscal 2011.
In fiscal 2011, Siemens completed the disposition of further enti-ties, which were not material, either individually or in aggregate.
bb) Dispositions not qualifying for discontinued operations: held for disposalThe Consolidated Statements of Financial Position as of Sep-tember 30, 2012 and 2011 include assets held for disposal of €106 million and €249 million and liabilities held for disposal of €39 million and €-, respectively, that do not qualify as dis-continued operations. Included as of September 30, 2011 is mainly the carrying amount of the 25% interest in OAO Power Machines, held by the Energy Sector which was sold in the first quarter of fiscal 2012.
bc) Discontinued operationsGeneralSiemens reports in this section about discontinued operations separately. The disclosures in the Notes to the Consolidated Fi-nancial Statements outside this section relate to continuing operations unless marked otherwise.
Net results of discontinued operations presented in the Con-solidated Statements of Income in fiscal 2012 and 2011 amount to €(595) million (thereof €(59) million income tax) and €(1,055) million (thereof €37 million income tax), respectively. Net results of discontinued operations for the periods present-ed relate to solar business, OSRAM, Siemens IT Solutions and Services, and the former operating segments Communications (Com) and Siemens VDO Automotive (SV).
Net income from discontinued operations attributable to shareholders of Siemens AG for fiscal 2012 and 2011 amount to €(595) million and €(1,044) million.
Solar business – discontinued operations, assets and liabilities held for disposalIn the fourth quarter of fiscal 2012, Siemens decided to sell its solar business consisting of the Business Units Solar Thermal Energy and Photovoltaics. The conditions for the respective business units to be classified as held for disposal and discon-tinued operations were fulfilled for each business unit as of the end of fiscal 2012. The respective business units are aggre-gated for presentation purposes.
Accordingly, the results of the solar business are disclosed as discontinued operations in the Company ’s Consolidated State-ments of Income for all periods presented.
Year ended September 30,
(in millions of €) 2012 2011
Revenue 199 240
Expenses (351) (606)
Loss on the measurement to fair value less costs to sell or on the disposal of the disposal group constituting the discontinued operations (106) –
Pretax loss from discontinued operations (259) (366)
Income taxes on ordinary activities 17 1
Income taxes on the loss on the measurement to fair value less costs to sell or on the disposal of the disposal group constituting the discontinued operations – –
Loss from discontinued operations, net of income taxes (241) (365)
Upon classification as held for disposal and discontinued oper-ations in the fourth quarter of fiscal 2012 the solar business was measured at the lower of their previous carrying amount and fair value less costs to sell. The associated loss recognized includes the impairment of the entire remaining goodwill of the solar business amounting to €85 million and the impair-ments related to non-current assets in the measurement scope of the disposal group amounting to €21 million.
In fiscal 2011, expenses include impairments of €231 million which were recognized in connection with the solar business. Those impairments included a goodwill impairment and an impairment of the equity investment Archimede Solar Energy S.r.l., Italy (Archimede).
As of the third quarter of fiscal 2011, a separate monitoring of the Solar Thermal Energy (STE) business within the Renew-able Energy Division was initiated, amongst others, due to the different business and market patterns in comparison to the wind power business. Accordingly, the annual impairment test for goodwill as of September 30, 2011 was performed at a lower level than the Renewable Energy Division.
The annual test for impairment of goodwill of fiscal 2011 of the solar and hydro business within the Energy Sector was per-formed as of September 30, 2011. As a result, in the solar and hydro business of the Energy Sector, an impairment loss of €128 million was recognized. The goodwill impaired is mainly attributable to the acquisition of Siemens Concentrated Solar Power Ltd. (former Solel Solar Systems Ltd.).

1 A. To our Shareholders 49 C. Combined Management Report 21 B. Corporate Governance158
As a result of a market assessment, which was completed in the three months ended September 30, 2011, the growth pros-pects and the long-term market development for the concen-trated solar power business have been reassessed and the un-derlying business planning has been adjusted accordingly to reflect expected lower growth prospects. Cash flows were dis-counted at a rate of 9.1%, whereas cash flows beyond the five-year planning period were extrapolated using a constant growth rate of 1.5%. The main reason for the deteriorated mar-ket perspective was a shift from STE technology to Photovolta-ic technology, in particular in the U.S. market. The adjusted business plan resulting from the market assessment was the basis for the annual goodwill impairment test in the three months ended September 30, 2011.
In the fourth quarter of fiscal 2011, the investment in Archimede was impaired by €43 million. The main triggering events for the impairment were the reassessment of the long-term mar-ket developments and the continuing lack of a reference proj-ect. As a consequence the underlying business planning of the investment has been adjusted to reflect the expected lower growth prospects. The Archimede impairment was based on fair value less costs to sell applying a discounted cash flow method, which assumed a discount rate of 9.1% and a terminal value growth rate of 0%.
The assets and liabilities of the solar business are presented as held for disposal in the Consolidated Statements of Financial Position as of September 30, 2012. The carrying amounts of the major classes of assets and liabilities of the solar business were as follows:
September 30,
(in millions of €) 2012
Trade and other receivables 29
Inventories 48
Property, plant and equipment 18
Financial assets 105
Other assets 24
Assets classified as held for disposal 224
Trade payables 30
Current provisions 24
Other current liabilities 66
Other liabilities 7
Liabilities associated with assets classified as held for disposal 126
OSRAM – discontinued operations, assets and liabilities held for disposalIn March 2011, Siemens announced that it planned to publicly list its subsidiary OSRAM. Siemens intended to retain a minority stake in OSRAM. The conditions for OSRAM to be classified as held for disposal and discontinued operations were fulfilled as of the end of the second quarter of fiscal 2011. Facing the mar-ket conditions Siemens decided in June 2012 to prepare, parallel and alternatively to the aforementioned plan of an initial public offering, an offering of OSRAM in the form of a spin-off by issu-ing OSRAM shares to the shareholders of Siemens AG and a sub-sequent listing of these shares. Also in this simultaneously pre-pared form of a listing, that requires approval at the general shareholders’ meeting, Siemens plans to retain a minority stake.
The decision in June 2012 represented a significant change of the previous disposal plan. Siemens no longer considered it highly probable to complete the disposal of OSRAM via an ini-tial public offering by the end of calendar year 2012, resulting in a reversal of the previous classification of the disposal group OSRAM as asset held for disposal and discontinued operations. By reversing the previous classification, Siemens recognized in the third quarter of fiscal 2012 a negative effect on earnings of €443 million before taxes that result from depreciation / amor-tization and impairments of property, plant and equipment and intangible assets and equity pick ups that were not recog-nized while OSRAM was previously classified as discontinued operations (€123 million referring to fiscal 2011). This effect on earnings is presented under expenses in the table below. Siemens considers a listing via spin-off as highly probable un-til June 2013 including the high probability of the shareholders approval based on past experience with other capital matters suggested for approval at the general shareholders’ meeting, feedback from the financial market and the economic rationale of the decision from a shareholder perspective. Accordingly, Siemens classifies OSRAM again as held for disposal and dis-continued operations. Among other impacts on Income taxes on costs to sell Siemens adjusted deferred tax assets according to the plan of issuing OSRAM shares in the form of a spin-off.
The results of OSRAM are disclosed as discontinued operations in the Company ’s Consolidated Statements of Income for all periods presented.
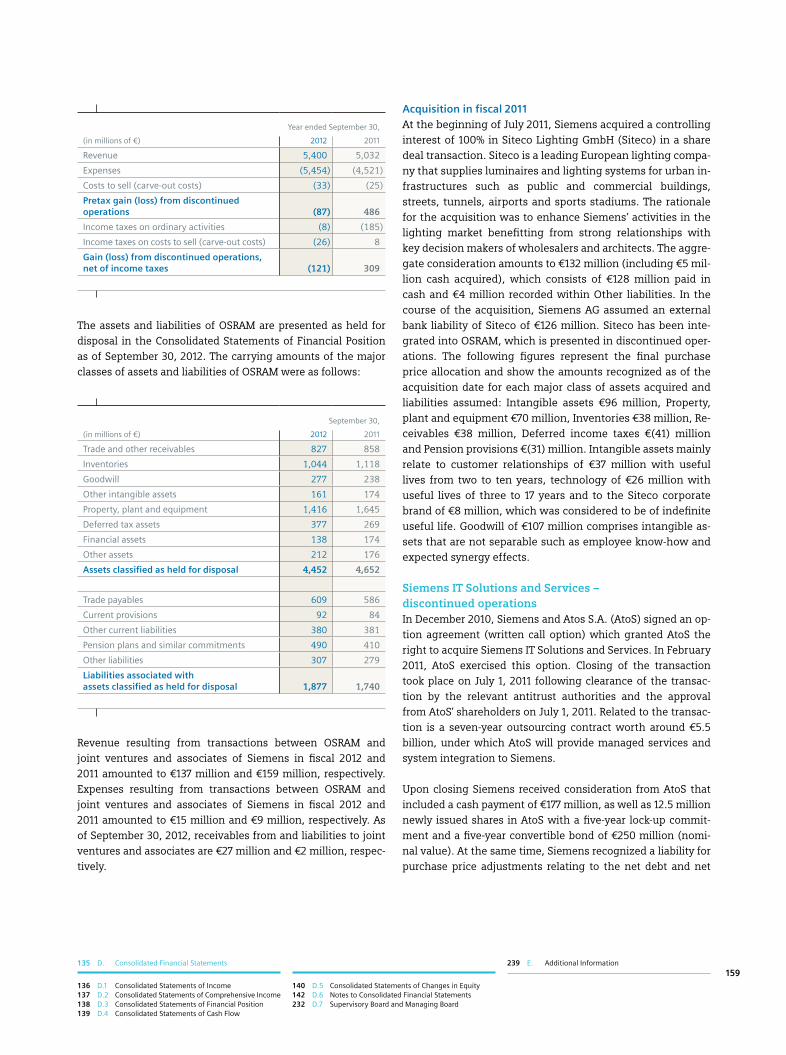
135 D. Consolidated Financial Statements 239 E. Additional Information
140 D.5 Consolidated Statements of Changes in Equity 142 D.6 Notes to Consolidated Financial Statements 232 D.7 Supervisory Board and Managing Board
136 D.1 Consolidated Statements of Income 137 D.2 Consolidated Statements of Comprehensive Income 138 D.3 Consolidated Statements of Financial Position 139 D.4 Consolidated Statements of Cash Flow
159
Year ended September 30,
(in millions of €) 2012 2011
Revenue 5,400 5,032
Expenses (5,454) (4,521)
Costs to sell (carve-out costs) (33) (25)
Pretax gain (loss) from discontinued operations (87) 486
Income taxes on ordinary activities (8) (185)
Income taxes on costs to sell (carve-out costs) (26) 8
Gain (loss) from discontinued operations, net of income taxes (121) 309
The assets and liabilities of OSRAM are presented as held for disposal in the Consolidated Statements of Financial Position as of September 30, 2012. The carrying amounts of the major classes of assets and liabilities of OSRAM were as follows:
September 30,
(in millions of €) 2012 2011
Trade and other receivables 827 858
Inventories 1,044 1,118
Goodwill 277 238
Other intangible assets 161 174
Property, plant and equipment 1,416 1,645
Deferred tax assets 377 269
Financial assets 138 174
Other assets 212 176
Assets classified as held for disposal 4,452 4,652
Trade payables 609 586
Current provisions 92 84
Other current liabilities 380 381
Pension plans and similar commitments 490 410
Other liabilities 307 279
Liabilities associated with assets classified as held for disposal 1,877 1,740
Revenue resulting from transactions between OSRAM and joint ventures and associates of Siemens in fiscal 2012 and 2011 amounted to €137 million and €159 million, respectively. Expenses resulting from transactions between OSRAM and joint ventures and associates of Siemens in fiscal 2012 and 2011 amounted to €15 million and €9 million, respectively. As of September 30, 2012, receivables from and liabilities to joint ventures and associates are €27 million and €2 million, respec-tively.
Acquisition in fiscal 2011At the beginning of July 2011, Siemens acquired a controlling interest of 100% in Siteco Lighting GmbH (Siteco) in a share deal transaction. Siteco is a leading European lighting compa-ny that supplies luminaires and lighting systems for urban in-frastructures such as public and commercial buildings, streets, tunnels, airports and sports stadiums. The rationale for the acquisition was to enhance Siemens’ activities in the lighting market benefitting from strong relationships with key decision makers of wholesalers and architects. The aggre-gate consideration amounts to €132 million (including €5 mil-lion cash acquired), which consists of €128 million paid in cash and €4 million recorded within Other liabilities. In the course of the acquisition, Siemens AG assumed an external bank liability of Siteco of €126 million. Siteco has been inte-grated into OSRAM, which is presented in discontinued oper-ations. The following figures represent the final purchase price allocation and show the amounts recognized as of the acquisition date for each major class of assets acquired and liabilities assumed: Intangible assets €96 million, Property, plant and equipment €70 million, Inventories €38 million, Re-ceivables €38 million, Deferred income taxes €(41) million and Pension provisions €(31) million. Intangible assets mainly relate to customer relationships of €37 million with useful lives from two to ten years, technology of €26 million with useful lives of three to 17 years and to the Siteco corporate brand of €8 million, which was considered to be of indefinite useful life. Goodwill of €107 million comprises intangible as-sets that are not separable such as employee know-how and expected synergy effects.
Siemens IT Solutions and Services – discontinued operations In December 2010, Siemens and Atos S.A. (AtoS) signed an op-tion agreement (written call option) which granted AtoS the right to acquire Siemens IT Solutions and Services. In February 2011, AtoS exercised this option. Closing of the transaction took place on July 1, 2011 following clearance of the transac-tion by the relevant antitrust authorities and the approval from AtoS’ shareholders on July 1, 2011. Related to the transac-tion is a seven-year outsourcing contract worth around €5.5 billion, under which AtoS will provide managed services and system integration to Siemens.
Upon closing Siemens received consideration from AtoS that included a cash payment of €177 million, as well as 12.5 million newly issued shares in AtoS with a five-year lock-up commit-ment and a five-year convertible bond of €250 million (nomi-nal value). At the same time, Siemens recognized a liability for purchase price adjustments relating to the net debt and net

1 A. To our Shareholders 49 C. Combined Management Report 21 B. Corporate Governance160
working capital of Siemens IT Solutions and Services. Siemens also recorded contractual obligations, loss provisions and risk contingencies arising from the sales agreements with AtoS presented in line items Current provisions, Provisions and Oth-er current financial liabilities.
The conditions for Siemens IT Solutions and Services to be classified as held for disposal and discontinued operations were fulfilled as of the second quarter of fiscal 2011. The results are presented as discontinued operations in the Company ’s Consolidated Statements of Income for all periods presented with the exception of certain business activities which remain in the Siemens Group. Business activities which remain with Siemens primarily relate to project HERKULES, which is report-ed in line item Centrally managed portfolio activities of Seg-ment information and continues to be accounted for under the equity method.
Year ended September 30,
(in millions of €) 2012 2011
Revenue – 2,705
Expenses (33) (3,087)
Gain (loss) on the measurement to fair value less costs to sell or on the disposal of the disposal group constituting the discontinued operations 45 (743)
Pretax gain (loss) from discontinued operations 12 (1,125)
Income taxes on ordinary activities 14 97
Income taxes on the gain (loss) on the measurement to fair value less costs to sell or on the disposal of the disposal group constituting the discontinued operations 15 202
Gain (loss) from discontinued operations, net of income taxes 41 (826)
The total loss recognized in fiscal 2011 on the disposal of the disposal group Siemens IT Solutions and Services amounted to €903 million. This amount includes the impairment of the Goodwill and other non-current assets of Siemens IT Solutions and Services of €659 million, a deconsolidation gain of €6 mil-lion, both presented under line item Gain (loss) on the mea-surement to fair value less costs to sell or on the disposal of the disposal group constituting the discontinued operations as well as an amount of €250 million relating to the obligation to
provide support to AtoS in connection with integration and training program which was recognized as restructuring ex-penses at Siemens IT Solutions and Services in the third quar-ter of fiscal 2011 and presented under line item Expenses. Un-der line item Gain (loss) on the measurement to fair value less costs to sell or on the disposal of the disposal group constitut-ing the discontinued operations also expenses for carve out activities necessary to establish Siemens IT Solutions and Ser-vices as a separate legal entity of €90 million were presented in fiscal 2011.
In fiscal 2012, line item Gain (loss) on the measurement to fair value less costs to sell or on the disposal of the disposal group constituting the discontinued operations includes, besides ex-penses for carve out activities, a gain of €53 million. This effect is due to revised estimates with regard to the transaction-relat-ed provisions including the settlement with AtoS on the cash purchase price adjustment relating to the net debt and net working capital of Siemens IT Solutions and Services reached in the second quarter of fiscal 2012. A final settlement with AtoS on all contractual obligations arising from the sales agreements was not achieved in fiscal 2012.
Revenue resulting from transactions between Siemens IT Solu-tions and Services and joint ventures and associates of Siemens in fiscal 2011 amounted to €100 million. Expenses re-sulting from transactions between Siemens IT Solutions and Services and joint ventures and associates of Siemens in fiscal 2011 amounted to €24 million.
Former segments SV and Com – discontinued operationsNet results of discontinued operations of SV activities and the former operating segment Com presented in the Consolidated Statements of Income in fiscal 2012 and 2011 amounted to €(260) million (thereof €(73) million income tax) and €(173) million (thereof €(85) million income tax), respectively. The net results in fiscal 2012 relate mainly to former operating seg-ment Com and include settlements of a matter with the Greek State with a pretax impact of €(143) million (€(104) million after tax) as well as negative tax effects of €115 million. The Company recorded a reserve in the second quarter of fiscal 2011 with regard to the restructuring measures before the sale of the SV activities in December 2007. Siemens sold its SV activ-ities in December 2007.

135 D. Consolidated Financial Statements 239 E. Additional Information
140 D.5 Consolidated Statements of Changes in Equity 142 D.6 Notes to Consolidated Financial Statements 232 D.7 Supervisory Board and Managing Board
136 D.1 Consolidated Statements of Income 137 D.2 Consolidated Statements of Comprehensive Income 138 D.3 Consolidated Statements of Financial Position 139 D.4 Consolidated Statements of Cash Flow
161
NOTE 5 Other operating income
Year ended September 30,
(in millions of €) 2012 2011
Gains on sales of property, plant and equipment and intangibles 208 250
Gains on disposals of businesses, see NOTE 4 6 27
Other 302 270
516 547
In fiscal 2012 and 2011, item Other includes income in connec-tion with legal and regulatory matters.
NOTE 6 Other operating expense
Year ended September 30,
(in millions of €) 2012 2011
Losses on disposals of businesses, see NOTE 4 aT diSpOSiTiONS (39) (30)
Losses on sales of property, plant and equipment and intangibles (28) (38)
Other (209) (306)
(276) (374)
Line item Other in fiscal 2012 and 2011 includes charges related to legal matters.
NOTE 7 Income (loss) from investments accounted for using the equity method, net
Year ended September 30,
(in millions of €) 2012 2011
Share of profit (loss), net (367) 79
Gains (losses) on sales, net 109 139
Impairment (12) (9)
Reversals of impairment 4 2
(266) 210
Item Share of profit (loss), net includes Siemens’ share in NSN’s fiscal 2012 and 2011 earnings of €(741) million and €(280) million, respectively, Siemens’ share in EN’s fiscal 2012 and 2011 earnings of €(23) million and €(46) million, respec-tively, Siemens’ share in BSH Bosch und Siemens Hausgeräte GmbH (BSH) as well as our share in KMW sold in January 2011; the two latter totaling €194 million and €191 million in fiscal 2012 and 2011, respectively. The fiscal 2012 earnings of NSN are impacted by restructuring charges at NSN.
Item Gains (losses) on sales, net, in fiscal 2012, include €79 million gain on the partial sale of interests in Bangalore Inter-national Airport Limited.
NOTE 8 Interest income, interest expense and other financial income (expense), net
Year ended September 30,
(in millions of €) 2012 2011
Pension related interest income 1,309 1,364
Interest income, other than pension 925 835
Interest income 2,234 2,200
Pension related interest expense (1,277) (1,223)
Interest expense, other than pension (450) (493)
Interest expense (1,728) (1,716)
Income (expense) from available-for-sale financial assets, net 103 854
Miscellaneous financial income (expense), net (108) (204)
Other financial income (expense), net (5) 649
Total amounts of item Interest income and (expense), other than pension, were as follows:
Year ended September 30,
(in millions of €) 2012 2011
Interest income, other than pension 925 835
Interest (expense), other than pension (450) (493)
Interest income (expense), net, other than pension 475 342
Thereof: Interest income (expense) of Operations, net 4 (34)
Thereof: Other interest income (expense), net 471 376

1 A. To our Shareholders 49 C. Combined Management Report 21 B. Corporate Governance162
Item Interest income (expense) of Operations, net includes in-terest income and expense primarily related to receivables from customers and payables to suppliers, interest on advanc-es from customers and advanced financing of customer con-tracts. Item Other interest income (expense), net includes all other interest amounts primarily consisting of interest relating to corporate debt, and related hedging activities, as well as in-terest income on corporate assets.
Item Interest income (expense) other than pension includes the following with respect to financial assets (financial liabili-ties) not at fair value through profit or loss:
Year ended September 30,
(in millions of €) 2012 2011
Total interest income on financial assets 913 826
Total interest expenses on financial liabilities 1 (792) (959)
1 Relating to hedged positions, herein only the interest expense on hedged items not at fair value through profit and loss is included, whereas item Interest expense, other than pension also contains the offsetting effect on interest of the hedging instrument. The difference is due to the disparities of interest rate swap contracts.
The components of item Income (expense) from available- for-sale financial assets, net were as follows:
Year ended September 30,
(in millions of €) 2012 2011
Dividends received 18 12
Gains on sales, net 101 881
Impairment (17) (40)
Other 1 1
Income (expense) from available-for-sale financial assets, net 103 854
In fiscal 2012, item Gains on sales, net includes €87 million gains from the sale of the 25% interest in OAO Power Machines held by the Energy Sector; €66 million of the gain relate to gains recycled from Other comprehensive income as of September 30, 2011. The investment was classified as held for disposal. The transac-tion closed in December 2011. Regarding impacts in connection with the disposal of Areva NP S.A.S. in fiscal 2011, see NOTE 4
acquiSiTiONS, diSpOSiTiONS aNd diScONTiNuEd OpEr aTiONS.
Item Miscellaneous financial income (expense), net, in fiscal 2012 and 2011, comprises gains (losses) of €(238) million and €(114) million, respectively, from the accretion of provisions and the increase (decrease) in the discount rate, as well as ex-penses as a result of allowances and write offs of finance re-ceivables, net of reversals of €(89) million and €(42) million, respectively. Furthermore, gains (losses) related to derivative financial instruments are included.
NOTE 9 Income taxes
Income from continuing operations before income tax is attributable to the following geographic regions:
Year ended September 30,
(in millions of €) 2012 2011
Germany 2,488 3,947
Foreign 4,791 5,661
7,279 9,608
Income tax expense (benefit) consists of the following:
Year ended September 30,
(in millions of €) 2012 2011
Current tax:
German corporation and trade taxes 143 293
Foreign income taxes 1,527 1,253
1,670 1,546
Deferred tax:
Germany 452 378
Foreign (28) 308
424 686
Income tax expense 2,094 2,232
The current income tax expense in fiscal 2012 and 2011 in-cludes adjustments recognized for current tax of prior years in the amount of €(121) million and €80 million, respectively. The German current tax expense in fiscal 2012 is positively affected by receivables due to several mutual agreement procedures.
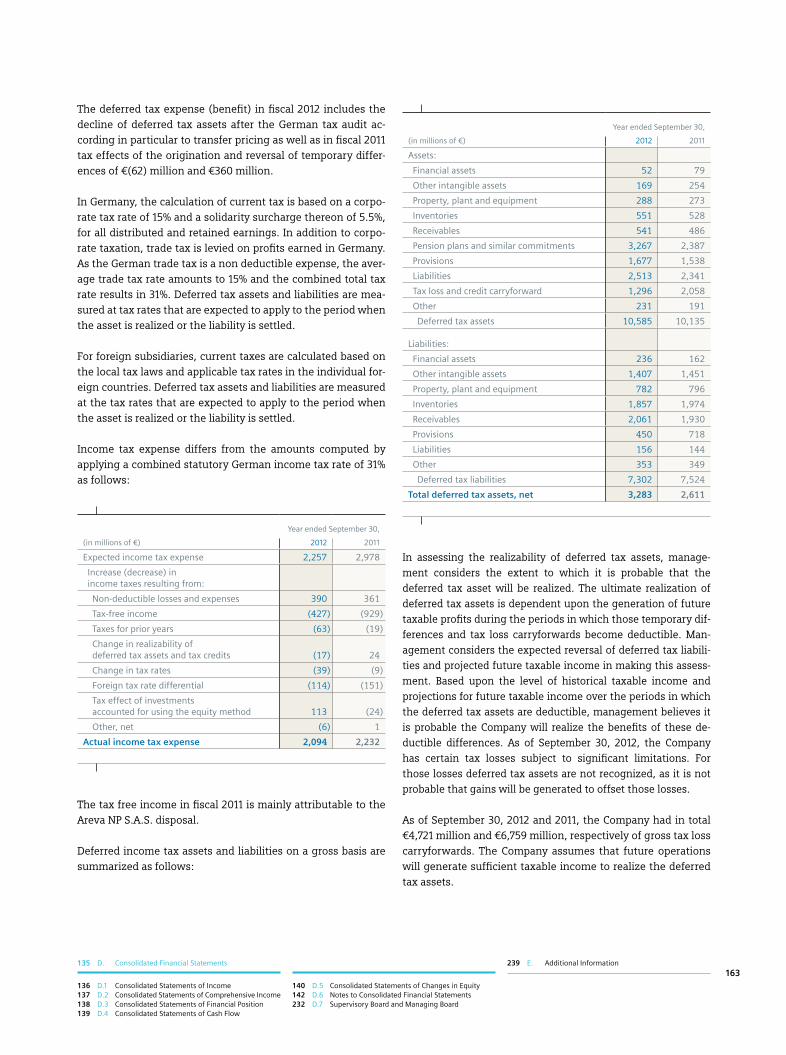
135 D. Consolidated Financial Statements 239 E. Additional Information
140 D.5 Consolidated Statements of Changes in Equity 142 D.6 Notes to Consolidated Financial Statements 232 D.7 Supervisory Board and Managing Board
136 D.1 Consolidated Statements of Income 137 D.2 Consolidated Statements of Comprehensive Income 138 D.3 Consolidated Statements of Financial Position 139 D.4 Consolidated Statements of Cash Flow
163
The deferred tax expense (benefit) in fiscal 2012 includes the decline of deferred tax assets after the German tax audit ac-cording in particular to transfer pricing as well as in fiscal 2011 tax effects of the origination and reversal of temporary differ-ences of €(62) million and €360 million.
In Germany, the calculation of current tax is based on a corpo-rate tax rate of 15% and a solidarity surcharge thereon of 5.5%, for all distributed and retained earnings. In addition to corpo-rate taxation, trade tax is levied on profits earned in Germany. As the German trade tax is a non deductible expense, the aver-age trade tax rate amounts to 15% and the combined total tax rate results in 31%. Deferred tax assets and liabilities are mea-sured at tax rates that are expected to apply to the period when the asset is realized or the liability is settled.
For foreign subsidiaries, current taxes are calculated based on the local tax laws and applicable tax rates in the individual for-eign countries. Deferred tax assets and liabilities are measured at the tax rates that are expected to apply to the period when the asset is realized or the liability is settled.
Income tax expense differs from the amounts computed by applying a combined statutory German income tax rate of 31% as follows:
Year ended September 30,
(in millions of €) 2012 2011
Expected income tax expense 2,257 2,978
Increase (decrease) in income taxes resulting from:
Non-deductible losses and expenses 390 361
Tax-free income (427) (929)
Taxes for prior years (63) (19)
Change in realizability of deferred tax assets and tax credits (17) 24
Change in tax rates (39) (9)
Foreign tax rate differential (114) (151)
Tax effect of investments accounted for using the equity method 113 (24)
Other, net (6) 1
Actual income tax expense 2,094 2,232
The tax free income in fiscal 2011 is mainly attributable to the Areva NP S.A.S. disposal.
Deferred income tax assets and liabilities on a gross basis are summarized as follows:
Year ended September 30,
(in millions of €) 2012 2011
Assets:
Financial assets 52 79
Other intangible assets 169 254
Property, plant and equipment 288 273
Inventories 551 528
Receivables 541 486
Pension plans and similar commitments 3,267 2,387
Provisions 1,677 1,538
Liabilities 2,513 2,341
Tax loss and credit carryforward 1,296 2,058
Other 231 191
Deferred tax assets 10,585 10,135
Liabilities:
Financial assets 236 162
Other intangible assets 1,407 1,451
Property, plant and equipment 782 796
Inventories 1,857 1,974
Receivables 2,061 1,930
Provisions 450 718
Liabilities 156 144
Other 353 349
Deferred tax liabilities 7,302 7,524
Total deferred tax assets, net 3,283 2,611
In assessing the realizability of deferred tax assets, manage-ment considers the extent to which it is probable that the deferred tax asset will be realized. The ultimate realization of deferred tax assets is dependent upon the generation of future taxable profits during the periods in which those temporary dif-ferences and tax loss carryforwards become deductible. Man-agement considers the expected reversal of deferred tax liabili-ties and projected future taxable income in making this assess-ment. Based upon the level of historical taxable income and projections for future taxable income over the periods in which the deferred tax assets are deductible, management believes it is probable the Company will realize the benefits of these de-ductible differences. As of September 30, 2012, the Company has certain tax losses subject to significant limitations. For those losses deferred tax assets are not recognized, as it is not probable that gains will be generated to offset those losses.
As of September 30, 2012 and 2011, the Company had in total €4,721 million and €6,759 million, respectively of gross tax loss carryforwards. The Company assumes that future operations will generate sufficient taxable income to realize the deferred tax assets.

1 A. To our Shareholders 49 C. Combined Management Report 21 B. Corporate Governance164
Deferred tax assets have not been recognized with respect of the following items (gross amounts):
September 30,
(in millions of €) 2012 2011
Deductible temporary differences 165 152
Tax loss carryforward 662 551
827 703
As of September 30, 2012 and 2011, €214 million and €224 mil-lion, respectively of the unrecognized tax loss carryforwards expire over the periods to 2023.
The Company has ongoing regular tax audits concerning open income tax years in a number of jurisdictions. Adequate provi-sions for all open tax years have been foreseen. Among others, the German Tax Audit scrutinizes the treatment of the buy-back of the convertible bond issued 2003 in the context of the tax audit for the fiscal years 2006 to 2009. Although a respec-tive tax assessment might be issued, the risk from a potential litigation remains remote in the Company’s assessment.
The Company recorded deferred tax liabilities for income taxes and foreign withholding taxes on future dividend distributions from subsidiaries which are actually intended to be repatriat-ed. Apart from this liability, the company has not recognized deferred tax liabilities for income taxes or foreign withholding taxes on the cumulative earnings of subsidiaries of €21,270 million and €20,866 million, respectively in fiscal 2012 and 2011 because the earnings are intended to be permanently re-invested in the subsidiaries.
Including the items charged or credited directly to equity and the expense (benefit) from continuing and discontinued oper-ations, the income tax expense (benefit) consists of the fol-lowing:
Year ended September 30,
(in millions of €) 2012 2011
Continuing operations 2,094 2,232
Discontinued operations 59 (37)
Income and expense recognized directly in equity (1,275) 89
878 2,283
NOTE 10 Available-for-sale financial assets
The following tables summarize the current portion of the Company ’s investment in available-for-sale financial assets:
September 30, 2012
Cost Fair valueUnrealized
gainUnrealized
loss(in millions of €)
Equity instruments 6 8 2 –
Debt instruments 304 308 5 –
Fund shares 196 208 13 (1)
506 524 19 (1)
September 30, 2011
Cost Fair valueUnrealized
gainUnrealized
loss(in millions of €)
Equity instruments 5 8 3 –
Debt instruments 272 268 – (4)
Fund shares 208 201 3 (10)
485 477 6 (14)
Non-current available-for-sale financial assets, which are in-cluded in line item Other financial assets are measured at fair value, if reliably measurable. They primarily consist of equity instruments, mainly comprising shares in AtoS. As of Septem-ber 30, 2012 and 2011 non-current available-for-sale financial assets measured at cost amount to €293 million and €252 mil-lion, respectively; available-for-sale financial assets measured at fair values amount to €728 million and €462 million, respec-tively. Unrealized gains (losses) in fiscal 2012 and 2011 result-ing from non-current available-for-sale financial assets at fair value were €215 million and €(42) million, respectively.
Regarding gross realized gains (losses) on sales of available-for-sale financial assets see NOTE 8 iNTErEST iNcOmE, iNTErEST
ExpENSE aNd OThEr fiNaNcial iNcOmE (ExpENSE), NET.
NOTE 11 Trade and other receivables
September 30,
(in millions of €) 2012 2011
Trade receivables from the sale of goods and services 13,310 13,088
Receivables from finance leases 1,910 1,759
15,220 14,847

135 D. Consolidated Financial Statements 239 E. Additional Information
140 D.5 Consolidated Statements of Changes in Equity 142 D.6 Notes to Consolidated Financial Statements 232 D.7 Supervisory Board and Managing Board
136 D.1 Consolidated Statements of Income 137 D.2 Consolidated Statements of Comprehensive Income 138 D.3 Consolidated Statements of Financial Position 139 D.4 Consolidated Statements of Cash Flow
165
Changes to the valuation allowance of current and long-term receivables presented in NOTE 11, 12 aNd 19, which belong to the class of financial assets measured at (amortized) cost are as follows (excluding receivables from finance leases):
Year ended September 30,
(in millions of €) 2012 2011
Valuation allowance as of beginning of fiscal year 1,005 993
Increase in valuation allowances recorded in the Consolidated Statements of Income in the current period 191 210
Write-offs charged against the allowance (108) (145)
Recoveries of amounts previously written-off 7 13
Foreign exchange translation differences 14 (10)
Reclassifications to line item Assets held for disposal and dispositions of those entities (54) (56)
Valuation allowance as of fiscal year-end 1,056 1,005
In fiscal 2012 and 2011, receivables from finance leases, current amount to €1,910 million and €1,759 million, respectively; the long-term portion amounts to €3,148 million and €2,983 mil-lion, respectively. The valuation allowance on current and long-term receivables from finance leases changed as follows:
Year ended September 30,
(in millions of €) 2012 2011
Valuation allowance as of beginning of fiscal year 142 168
Increase in valuation allowances recorded in the Consolidated Statements of Income in the current period 23 34
Write-offs charged against the allowance (40) (65)
Recoveries of amounts previously written-off 6 7
Foreign exchange translation differences 5 (2)
Reclassifications to line item Assets held for disposal and dispositions of those entities (2) –
Valuation allowance as of fiscal year-end 134 142
Minimum future lease payments to be received are as follows:
September 30,
(in millions of €) 2012 2011
Within one year 2,360 2,139
After one year but not more than five years 3,151 3,047
More than five years 209 166
5,719 5,352
The following table shows a reconciliation of minimum future lease payments to the gross and net investment in leases and to the present value of the minimum future lease payments re-ceivable:
September 30,
(in millions of €) 2012 2011
Minimum future lease payments 5,719 5,352
Plus: Unguaranteed residual values 131 145
Gross investment in leases 5,850 5,497
Less: Unearned finance income (657) (613)
Net investment in leases 5,193 4,884
Less: Allowance for doubtful accounts (134) (142)
Less: Present value of unguaranteed residual value (117) (125)
Present value of minimum future lease payments receivable 4,942 4,617
The gross investment in leases and the present value of mini-mum future lease payments receivable are due as follows:
September 30,
(in millions of €) 2012 2011
Gross investment in leases 5,850 5,497
Within one year 2,388 2,167
One to five years 3,248 3,155
Thereafter 214 175
Present value of minimum future lease payments receivable 4,942 4,617
Within one year 2,012 1,830
One to five years 2,743 2,639
Thereafter 187 148
Investments in finance leases primarily relate to equipment for information technology and office machines, industrial ma-chinery, medical equipment and transportation systems. Actual cash flows will vary from contractual maturities due to future sales of finance receivables, prepayments and write-offs.

1 A. To our Shareholders 49 C. Combined Management Report 21 B. Corporate Governance166
NOTE 12 Other current financial assets
September 30,
(in millions of €) 2012 2011
Derivative financial instruments 530 598
Loans receivable 1,197 869
Other 1,174 1,161
2,901 2,628
NOTE 13 Inventories
September 30,
(in millions of €) 2012 2011
Raw materials and supplies 2,629 2,650
Work in process 3,496 3,711
Costs and earnings in excess of billings on uncompleted contracts 8,005 7,849
Finished goods and products held for resale 2,643 2,317
Advances to suppliers 953 831
17,726 17,358
Advance payments received (2,047) (2,215)
15,679 15,143
Cost of goods sold and services rendered include inventories recognized as expense amounting to €54,547 million and €49,571 million, respectively, in fiscal 2012 and 2011. Raw mate-rials and supplies, work in process as well as finished goods and products held for resale are valued at the lower of acquisition /production cost and net realizable value. The respective write-downs, as compared to prior year, increased (decreased) by €57 million and €(107) million as of September 30, 2012 and 2011.
Item Costs and earnings in excess of billings on uncompleted contracts relates to construction contracts, with net asset bal-ances where contract costs plus recognized profits less recog-nized losses exceed progress billings. Construction contracts, here and as follows, include service contracts accounted for under the percentage of completion method. Liabilities from contracts for which progress billings exceed costs and recog-nized profits less recognized losses are recognized in line item Other current liabilities.
The aggregate amount of costs incurred and recognized profits less recognized losses for construction contracts in progress, as of September 30, 2012 and 2011 amounted to €82,810 mil-lion and €74,888 million, respectively. Revenue from construc-tion contracts amounted to €32,651 million and €30,298 mil-lion, respectively, for fiscal 2012 and 2011.
Advance payments received on construction contracts in prog-ress were €9,301 million and €10,198 million as of September 30, 2012 and 2011. Retentions in connection with construction con-tracts were €340 million and €290 million in fiscal 2012 and 2011.
In the fourth quarter of fiscal 2012, Siemens revised its credit risk assessment for Iran. In accordance with project account-ing principles, Siemens therefore revised project calculations for the affected contracts. The change in credit risk assess-ment resulted in an earnings impact of €347 million.
NOTE 14 Other current assets
September 30,
(in millions of €) 2012 2011
Miscellaneous tax receivables 668 732
Prepaid expenses 262 250
Other 346 282
1,277 1,264
NOTE 15 Goodwill
Year ended September 30,
(in millions of €) 2012 2011
Cost
Balance at beginning of year 17,252 17,436
Translation differences and other 599 104
Acquisitions and purchase accounting adjustments 913 209
Dispositions and reclassifications to assets classified as held for disposal (246) (497)
Balance at year-end 18,517 17,252
Accumulated impairment losses and other changes
Balance at beginning of year 1,546 1,673
Translation differences and other 59 (26)
Impairment losses recognized during the period – 2641
Dispositions and reclassifications to assets classified as held for disposal (157) (365)
Balance at year-end 1,448 1,546
Carrying amount
Balance at beginning of year 15,706 15,763
Balance at year-end 17,069 15,706
1 Impairment losses recognized in fiscal 2011 relate to activities classified as discontinued operations. Impacts on the Consolidated Statements of Income are presented in discontinued operations for all years presented.

135 D. Consolidated Financial Statements 239 E. Additional Information
140 D.5 Consolidated Statements of Changes in Equity 142 D.6 Notes to Consolidated Financial Statements 232 D.7 Supervisory Board and Managing Board
136 D.1 Consolidated Statements of Income 137 D.2 Consolidated Statements of Comprehensive Income 138 D.3 Consolidated Statements of Financial Position 139 D.4 Consolidated Statements of Cash Flow
167
As of the beginning of fiscal 2012, Siemens rearranged its re-porting structure of the segments. The previously reported amounts of goodwill as of September 30, 2011 have been real-located to conform to Siemens’ new reporting structure. There-fore, new cash generating units, which are represented by a Division or equivalent, were determined. Goodwill has been reallocated based on relative fair values of the cash generating units. Prior-year information has been adjusted accordingly.
Siemens performs the mandatory annual impairment test in the three months ended September 30, in accordance with the accounting policy stated in NOTE 2 Summary Of SigNificaNT
accOuNTiNg pOliciES and NOTE 3 criTical accOuNTiNg ESTi-
maTES. The recoverable amounts for the annual impairment test 2012 for Divisions or equivalents were estimated to be higher than the carrying amounts. Key assumptions on which management has based its determinations of the fair value less costs to sell for the Divisions’ or equivalents’ carrying amount include terminal value growth rates up to 2.7% in fis-cal 2012 and 3.0% in fiscal 2011, respectively and after-tax dis-
count rates of 7.0% to 9.5% in fiscal 2012 and 7.0% to 9.1% in fiscal 2011. Where possible, reference to market prices is made.
For the purpose of estimating the fair value less costs to sell of the Divisions or equivalents, cash flows were projected for the next five years based on past experience, actual operating re-sults and management’s best estimate about future develop-ments as well as market assumptions.
The fair value less costs to sell is mainly driven by the terminal value which is particularly sensitive to changes in the assump-tions on the terminal value growth rate and discount rate. Both assumptions are determined individually for each Divi-sion or equivalent. Discount rates reflect the current market assessment of the risks specific to each Division or equivalent and are based on the weighted average cost of capital for the Divisions or equivalents (for SFS the discount rate represents cost of equity). Terminal value growth rates take into consider-ation external macroeconomic sources of data and industry specific trends.
Carryingamount as of
10/01/2011
Translationdifferences
and other
Acquisitionsand purchase
accountingadjustments
Dispositions,reclassifications incl. reclassifica-
tions to assets classified as held
for disposal
Impairments Carryingamount as of
09/30/2012
(in millions of €)
Sectors
Energy 2,269 82 422 (54) – 2,718
Healthcare 7,964 287 63 – – 8,314
Industry 3,802 121 278 (28) – 4,173
Infrastructure & Cities 1,558 40 150 (6) – 1,742
Total Sectors 15,594 530 913 (88) – 16,949
Financial Services (SFS) 112 10 – (1) – 121
Siemens 15,706 539 913 (89) – 17,069
Carryingamount as of
10/01/2010
Translationdifferences
and other
Acquisitionsand purchase
accountingadjustments
Dispositions,reclassifications incl. reclassifica-
tions to assets classified as held
for disposal
Impairments Carryingamount as of
09/30/2011
(in millions of €)
Sectors
Energy 2,337 14 58 (12) (128) 2,269
Healthcare 7,826 83 56 (1) – 7,964
Industry 3,903 24 7 (131) – 3,802
Infrastructure & Cities 1,465 9 74 12 – 1,558
Total Sectors 15,531 130 195 (132) (128) 15,594
Siemens IT Solutions and Services 132 – 4 – (136) –
Financial Services (SFS) 102 – 10 – – 112
Siemens 15,763 130 209 (132) (264)1 15,706
1 Impairment losses recognized in fiscal 2011 relate to activities classified as discon - tinued operations. Impacts on the Consolidated Statements of Income are presented in discontinued operations for all years presented.

1 A. To our Shareholders 49 C. Combined Management Report 21 B. Corporate Governance168
The following table presents the key assumptions used to deter-mine fair value less costs to sell for impairment test purposes for the Divisions to which a significant amount of goodwill is allocated:
NOTE 16 Other intangible assets
Grosscarryingamount
as of10/01/2011
Translationdifferences
Additionsthroughbusiness
combina-tions
Additions Retirements 1 Grosscarryingamount
as of09/30/2012
Accumulatedamortization
and impairment
Carrying amount
as of09/30/2012
Amortization and
impairmentin fiscal
2012 2(in millions of €)
Software and other internally generated intangible assets 2,955 68 36 334 (122) 3,270 (2,001) 1,269 (291)
Patents, licenses and similar rights 6,665 198 463 94 (266) 7,154 (3,828) 3,326 (591)
Other intangible assets 9,620 266 499 427 (387) 10,424 (5,829) 4,595 (882)
1 Includes Other intangible assets reclassified to Assets classified as held for disposal and dispositions of those entities.
2 Includes impairment expense of €44 million in fiscal 2012, therein €43 million at the Healthcare Sector.
Grosscarryingamount
as of10/01/2010
Translationdifferences
Additionsthroughbusiness
combina-tions
Additions Retirements 1 Grosscarryingamount
as of09/30/2011
Accumulatedamortization
and impairment
Carrying amount
as of09/30/2011
Amortization and
impairmentin fiscal
2011 2(in millions of €)
Software and other internally generated intangible assets 3,068 18 1 353 (485) 2,955 (1,775) 1,180 (246)
Patents, licenses and similar rights 7,008 62 94 67 (566) 6,665 (3,401) 3,264 (528)
Other intangible assets 10,076 80 95 420 (1,051) 9,620 (5,176) 4,444 (774)
1 Includes Other intangible assets reclassified to Assets classified as held for disposal and dispositions of those entities.
2 Includes impairment expense of €8 million in fiscal 2011, thereof €7 million at the Healthcare Sector.
Amortization expense on intangible assets is included in line items Cost of goods sold and services rendered, Research and development expenses or Marketing, selling and general administrative expenses, depending on the use of the asset.
As of September 30, 2012 and 2011, contractual commitments for purchases of other intangible assets amount to €15 million and €4 million.
Year ended September 30, 2012 Year ended September 30, 2011
Goodwill
Terminal valuegrowth rate
After-taxdiscount rate
Goodwill
Terminal valuegrowth rate
After-taxdiscount rate(in millions of €)
Diagnostics of the Healthcare Sector 4,981 2.25% 7.0% 4,780 2.25% 7.0%
Imaging & Therapy Systems of the Healthcare Sector 2,596 2.7% 7.0% 2,506 2.7% 7.0%
Industry Automation of the Industry Sector 2,897 1.8% 8.5% 2,299 2.0% 8.5%

135 D. Consolidated Financial Statements 239 E. Additional Information
140 D.5 Consolidated Statements of Changes in Equity 142 D.6 Notes to Consolidated Financial Statements 232 D.7 Supervisory Board and Managing Board
136 D.1 Consolidated Statements of Income 137 D.2 Consolidated Statements of Comprehensive Income 138 D.3 Consolidated Statements of Financial Position 139 D.4 Consolidated Statements of Cash Flow
169
NOTE 17 Property, plant and equipment
As of September 30, 2012 and 2011, contractual commitments for purchases of property, plant and equipment amount to €395 million and €406 million, respectively.
Grosscarryingamount
as of10/01/2011
Translationdifferences
Additionsthroughbusiness
combina-tions
Additions Reclassi-fications
Retire-ments1
Grosscarryingamount
as of09/30/2012
Accumu-lated de-
preciationand impair-
ment
Carrying amount
as of09/30/2012
Deprecia-tion and
impair-ment in
fiscal 2012 2(in millions of €)
Land and buildings 8,110 154 53 280 175 (487) 8,285 (3,946) 4,339 (329)
Technical machinery and equipment 6,589 125 35 306 305 (284) 7,076 (4,474) 2,602 (473)
Furniture and office equipment 5,207 91 53 639 206 (532) 5,664 (4,291) 1,373 (642)
Equipment leased to others 3,301 108 – 375 2 (414) 3,372 (1,770) 1,602 (408)
Advances to suppliers and construction in progress 937 28 1 596 (689) (15) 8593 (11) 848 (10)
Property, plant and equipment 24,144 506 143 2,195 – (1,732) 25,255 (14,492) 10,763 (1,862)
1 Includes Property, plant and equipment reclassified to Assets classified as held for disposal and dispositions of those entities.
2 Includes impairment expense of €140 million in fiscal 2012, of which €56 million relate to SRE, €38 million relate to the Energy Sector and €32 million relate to SFS.
3 Includes €741 million expenditures for property, plant and equipment under construction.
Grosscarryingamount
as of10/01/2010
Translationdifferences
Additionsthroughbusiness
combina-tions
Additions Reclassi-fications
Retire-ments1
Grosscarryingamount
as of09/30/2011
Accumu-lated de-
preciationand impair-
ment
Carrying amount
as of09/30/2011
Deprecia-tion and
impair-ment in
fiscal 2011 2(in millions of €)
Land and buildings 8,596 37 17 158 294 (992) 8,110 (3,850) 4,260 (260)
Technical machinery and equipment 9,255 21 10 429 493 (3,619) 6,589 (4,223) 2,366 (425)
Furniture and office equipment 6,797 (8) 26 725 113 (2,446) 5,207 (3,980) 1,227 (618)
Equipment leased to others 3,175 – 2 586 1 (463) 3,301 (1,614) 1,687 (359)
Advances to suppliers and construction in progress 1,114 11 1 911 (901) (199) 9373 – 937 –
Property, plant and equipment 28,937 61 56 2,809 – (7,719) 24,144 (13,667) 10,477 (1,662)
1 Includes Property, plant and equipment reclassified to Assets classified as held for disposal.
2 Includes impairment expense of €25 million in fiscal 2011, of which €21 million relate to SRE.
3 Includes €804 million expenditures for property, plant and equipment under construction.
In fiscal 2012 and 2011, government grants awarded for the purchase or the production of property, plant and equipment amounted to €13 million and €14 million, respectively. The award of further government grants of €77 million and €50 million in fiscal 2012 and 2011, respectively, related to costs in-curred and future costs.

1 A. To our Shareholders 49 C. Combined Management Report 21 B. Corporate Governance170
As of September 30, 2012 and 2011, minimum future lease pay-ments receivable from lessees under operating leases are as follows:
September 30,
(in millions of €) 2012 2011
Within one year 384 426
After one year but not more than five years 754 929
More than five years 196 213
1,334 1,568
Payments from lessees under operating leases primarily relate to buildings, data processing and phone equipment as well as to medical equipment. Total contingent rent recognized in in-come in fiscal 2012 and 2011 amounts to €205 million and €182 million.
Investment propertyThe carrying amount of investment property amounts to €121 million and €105 million compared to a fair value of €232 mil-lion and €283 million as of September 30, 2012 and 2011, respectively.
NOTE 18 Investments accounted for using the equity method
As of September 30, 2012, Siemens’ principal investments accounted for under the equity method, which are all unlisted, are (in alphabetical order):
Percentage of Ownership
September 30,
2012 2011
BSH Bosch und Siemens Hausgeräte GmbH (BSH) 50% 50%
BWI Informationstechnik GmbH 1 50% 50%
Enterprise Networks Holdings B.V. 49% 49%
Maschinenfabrik Reinhausen GmbH 26% 26%
Nokia Siemens Networks Holding B.V. 2 50% 50%
P.T. Jawa Power 3 50% 50%
Shanghai Electric Power Generation Equipment Co. Ltd. 40% 40%
Voith Hydro Holding GmbH & Co. KG 35% 35%
1 The exact percentage equals 50.05%; it is not controlled by Siemens due to significant participating rights of the two other shareholders.
2 The exact percentage of voting rights equals 50% less 2,500 voting rights.
3 The investment is no jointly controlled entity.
Our interest in BSH, which is the principal jointly controlled entity of Siemens, is recognized using the equity method, ap-plying BSH’s twelve month periods ended June 30. The follow-ing information reflect BSH’s most recent published financial statements, not adjusted for the percentage of ownership held by Siemens.
Year ended December 31,
(in millions of €) 2011 2010
Revenue 9,654 9,073
Net income 374 467
December 31,
(in millions of €) 2011 2010
Current assets 4,576 4,019
Non-current assets 2,859 2,882
Current liabilities 3,109 2,838
Non-current liabilities 1,917 1,655
Summarized financial information for principal investments in associates, not adjusted for the percentage of ownership held by Siemens, is presented below. Income statement informa-tion is presented for the twelve month period applied under the equity method of accounting.
Year ended September 30,
(in millions of €) 2012 2011
Revenue 20,178 20,359
Net income (loss) (1,272) (432)
Information related to the Statements of Financial Position is presented as of the date used in applying the equity method of accounting.
September 30,
(in millions of €) 2012 2011
Total assets 17,702 18,967
Total liabilities 12,949 12,843

135 D. Consolidated Financial Statements 239 E. Additional Information
140 D.5 Consolidated Statements of Changes in Equity 142 D.6 Notes to Consolidated Financial Statements 232 D.7 Supervisory Board and Managing Board
136 D.1 Consolidated Statements of Income 137 D.2 Consolidated Statements of Comprehensive Income 138 D.3 Consolidated Statements of Financial Position 139 D.4 Consolidated Statements of Cash Flow
171
The unrecognized share of losses in associates amounts to €22 million as of September 30, 2012.
For information on contingent liabilities for joint ventures and associates see NOTE 38 rElaTEd parTy TraNSacTiONS.
Regarding the fiscal 2011 conversion of our loan receivable from NSN into interests in NSN’s preferred shares and regard-ing Siemens’ contribution of new equity in exchange for pre-ferred shares in NSN see NOTE 38 rElaTEd parTy TraNSacTiONS.
NOTE 19 Other financial assets
September 30,
(in millions of €) 2012 2011
Loans receivable 6,085 4,396
Receivables from finance leases, see NOTE 11 TradE aNd OThEr rEcEivablES 3,148 2,983
Derivative financial instruments 2,798 2,424
Available-for-sale financial assets 1,021 714
Other 1,614 1,609
14,666 12,126
Item Loans receivable primarily relate to long-term loan trans-actions of SFS. For available-for-sale financial assets classi-fied as non-current see NOTE 10 availablE-fOr-SalE fiNaNcial
aSSETS.
NOTE 20 Other current financial liabilities
September 30,
(in millions of €) 2012 2011
Derivative financial instruments, see NOTES 30 aNd 31 462 862
Accrued interest expense 237 301
Other 761 1,084
1,460 2,247
NOTE 21 Other current liabilities
September 30,
(in millions of €) 2012 2011
Billings in excess of costs and estimated earnings on uncompleted contracts and related advances 11,877 12,488
Payroll obligations and social security taxes 2,020 1,718
Other employee related costs 1,992 2,127
Deferred income 1,123 993
Accruals for outstanding invoices 904 1,033
Bonus obligations 871 1,144
Miscellaneous tax liabilities 650 694
Deferred reservation fees received 21 68
Other 848 755
20,306 21,020
Item Other employee related costs primarily includes vacation payments, accrued overtime and service anniversary awards, severance payments, as well as liabilities related to termina-tion benefits.
NOTE 22 Debt
September 30,
(in millions of €) 2012 2011
Short-term
Notes and bonds 2,018 2,495
Loans from banks 1,505 1,128
Other financial indebtedness 270 21
Obligations under finance leases 33 16
Short-term debt and current maturities of long-term debt 3,826 3,660
Long-term
Notes and bonds (maturing until 2066) 16,194 12,651
Loans from banks (maturing until 2023) 449 1,354
Other financial indebtedness (maturing until 2027) 110 146
Obligations under finance leases 128 129
Long-term debt 16,880 14,280
20,707 17,940
In fiscal 2012 and 2011, weighted-average interest rates for loans from banks, other financial indebtedness and obliga-tions under finance leases were 2.3% (2011: 2.5%), 2.1% (2011: 5.0%) and 4.6% (2011: 4.3%), respectively.

1 A. To our Shareholders 49 C. Combined Management Report 21 B. Corporate Governance172
a) cOmmErcial papEr prOgramWe have a US$ 9.0 billion (€7.0 billion) multi-currency commer-cial paper program in place including US$ extendible notes capa-bilities. As of September 30, 2012 and 2011 no commercial papers were outstanding. Siemens’ commercial papers have a maturity of generally less than 90 days. Interest rates ranged from –0.03% to 0.7% in fiscal 2012 and from 0.1% to 0.29% in fiscal 2011.
b) NOTES aNd bONdSDebt Issuance Program, previously called Euro Medium-Term Note ProgramThe Company has agreements with financial institutions un-der which it may issue instruments up to €15.0 billion as of September 30, 2012 and 2011, respectively. As of September 30, 2012 €9.9 billion (2011: €8.9 billion) in notional amounts were issued and are outstanding. The outstanding amounts as of September 30, 2012 comprise US$500 million (€387 million) 5.625% fixed-rate instruments due March 16, 2016; €1.0 billion 5.375% fixed-rate instruments due June 11, 2014; €1.6 billion 5.625% fixed-rate instruments due June 11, 2018; €2.0 billion 4.125% fixed-rate instruments due February 20, 2013 and €2.0 billion 5.125% fixed-rate instruments due February 20, 2017. As of September 30, 2011, additional instruments were outstand-ing: €1.55 billion 5.250% fixed-rate instruments and US$500 million (€370 million) floating rate notes bearing interest of 0.15% above the three months LIBOR were redeemed at face value on December 12, 2011 and March 16, 2012, respectively.
In September 2012, Siemens issued €1.4 billion and £1.0 billion (€1.25 billion as of September 30, 2012) in fixed-rate instru-ments in four tranches comprising €400 million in 0.375% in-struments due September 10, 2014, €1.0 billion in 1.50% instru-ments due March 10, 2020, £350 million (€439 million as of September 30, 2012) in 2.75% instruments due September 10, 2025 and £650 million (€814 million as of September 30, 2012) in 3.75% instruments due September 10, 2042.
In February 2012, Siemens issued US$400 million (€309 mil-lion as of September 30, 2012) in floating rate notes (3 months LIBOR + 1.4%) due February 21, 2019.
US$ Medium Term NotesIn August 2006, the Company issued US$5.0 billion of notes (€3.9 billion as of September 30, 2012). These notes were is-sued in four tranches of which the following are outstanding as of September 30, 2012 and 2011: US$1.75 billion 5.75% fixed-rate instruments due October 17, 2016 (€1.35 billion as of Sep-tember 30, 2012) and US$1.75 billion 6.125% fixed-rate instru-ments due August 17, 2026 (€1.35 billion as of September 30, 2012); the US$750 million, 5.5% fixed-rate instruments were due on February 16, 2012, and were redeemed at face value at its maturity date;
Hybrid BondIn September 2006, the Company issued a subordinated hybrid bond. The subordinated bond was issued in a EUR tranche of €900 million and a GBP tranche of £750 million (€940 million as of September 30, 2012), both with a legal final maturity on September 14, 2066 and with a call option for Siemens in 2016 or thereafter. The bonds bear a fixed interest rate until Septem-ber 14, 2016 of 5.25% for the EUR tranche and 6.125% for the GBP tranche, thereafter, floating rate interest is applied accord-ing to the conditions of the bond.
Bond with Warrant UnitsIn fiscal 2012, Siemens issued US$ bonds with warrant units in an aggregate principal amount of US$3 billion (€2.3 billion as of September 30, 2012). The bonds are composed of (1) nomi-nal US$1.5 billion (€1.16 billion as of September 30, 2012), ma-turing on August 16, 2017 bearing interest of notional 1.05% per annum, and (2) nominal US$1.5 billion (€1.16 billion as of September 30, 2012), maturing on August 16, 2019 bearing in-terest of notional 1.65% per annum. Each of the US$1.5 billion bonds were issued with 6,000 detachable warrants. The war-rants are classified as equity instruments with a fair value of €126 million at issuance; they are presented in additional paid-in capital in line item Other changes in equity. The warrants’ exercise price was fixed in Euro. The warrants entitle the hold-ers, at their option, to receive 1,806.1496 Siemens AG shares per warrant at an exercise price per share of €104.0018 during the exercise period which matures on August 1, 2017 and 2019 for bond (1) and bond (2), respectively. Accordingly, the war-rants result in option rights relating to a total of 21.7 million Siemens AG shares.
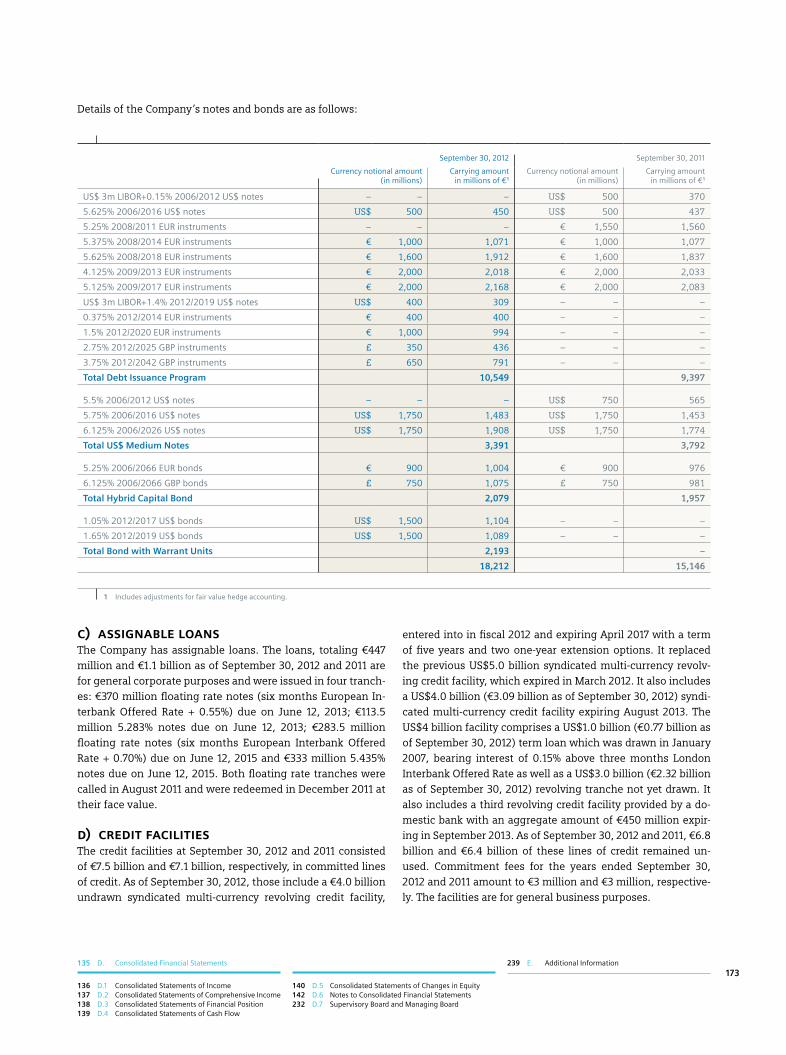
135 D. Consolidated Financial Statements 239 E. Additional Information
140 D.5 Consolidated Statements of Changes in Equity 142 D.6 Notes to Consolidated Financial Statements 232 D.7 Supervisory Board and Managing Board
136 D.1 Consolidated Statements of Income 137 D.2 Consolidated Statements of Comprehensive Income 138 D.3 Consolidated Statements of Financial Position 139 D.4 Consolidated Statements of Cash Flow
173
Details of the Company ’s notes and bonds are as follows:
c) aSSigNablE lOaNSThe Company has assignable loans. The loans, totaling €447 million and €1.1 billion as of September 30, 2012 and 2011 are for general corporate purposes and were issued in four tranch-es: €370 million floating rate notes (six months European In-terbank Offered Rate + 0.55%) due on June 12, 2013; €113.5 million 5.283% notes due on June 12, 2013; €283.5 million floating rate notes (six months European Interbank Offered Rate + 0.70%) due on June 12, 2015 and €333 million 5.435% notes due on June 12, 2015. Both floating rate tranches were called in August 2011 and were redeemed in December 2011 at their face value.
d) crEdiT faciliTiES The credit facilities at September 30, 2012 and 2011 consisted of €7.5 billion and €7.1 billion, respectively, in committed lines of credit. As of September 30, 2012, those include a €4.0 billion undrawn syndicated multi-currency revolving credit facility,
September 30, 2012 September 30, 2011
Currency notional amount(in millions)
Carrying amountin millions of € 1
Currency notional amount(in millions)
Carrying amountin millions of € 1
US$ 3m LIBOR+0.15% 2006/2012 US$ notes – – – US$ 500 370
5.625% 2006/2016 US$ notes US$ 500 450 US$ 500 437
5.25% 2008/2011 EUR instruments – – – € 1,550 1,560
5.375% 2008/2014 EUR instruments € 1,000 1,071 € 1,000 1,077
5.625% 2008/2018 EUR instruments € 1,600 1,912 € 1,600 1,837
4.125% 2009/2013 EUR instruments € 2,000 2,018 € 2,000 2,033
5.125% 2009/2017 EUR instruments € 2,000 2,168 € 2,000 2,083
US$ 3m LIBOR+1.4% 2012/2019 US$ notes US$ 400 309 – – –
0.375% 2012/2014 EUR instruments € 400 400 – – –
1.5% 2012/2020 EUR instruments € 1,000 994 – – –
2.75% 2012/2025 GBP instruments £ 350 436 – – –
3.75% 2012/2042 GBP instruments £ 650 791 – – –
Total Debt Issuance Program 10,549 9,397
5.5% 2006/2012 US$ notes – – – US$ 750 565
5.75% 2006/2016 US$ notes US$ 1,750 1,483 US$ 1,750 1,453
6.125% 2006/2026 US$ notes US$ 1,750 1,908 US$ 1,750 1,774
Total US$ Medium Notes 3,391 3,792
5.25% 2006/2066 EUR bonds € 900 1,004 € 900 976
6.125% 2006/2066 GBP bonds £ 750 1,075 £ 750 981
Total Hybrid Capital Bond 2,079 1,957
1.05% 2012/2017 US$ bonds US$ 1,500 1,104 – – –
1.65% 2012/2019 US$ bonds US$ 1,500 1,089 – – –
Total Bond with Warrant Units 2,193 –
18,212 15,146
1 Includes adjustments for fair value hedge accounting.
entered into in fiscal 2012 and expiring April 2017 with a term of five years and two one-year extension options. It replaced the previous US$5.0 billion syndicated multi-currency revolv-ing credit facility, which expired in March 2012. It also includes a US$4.0 billion (€3.09 billion as of September 30, 2012) syndi-cated multi-currency credit facility expiring August 2013. The US$4 billion facility comprises a US$1.0 billion (€0.77 billion as of September 30, 2012) term loan which was drawn in January 2007, bearing interest of 0.15% above three months London Interbank Offered Rate as well as a US$3.0 billion (€2.32 billion as of September 30, 2012) revolving tranche not yet drawn. It also includes a third revolving credit facility provided by a do-mestic bank with an aggregate amount of €450 million expir-ing in September 2013. As of September 30, 2012 and 2011, €6.8 billion and €6.4 billion of these lines of credit remained un-used. Commitment fees for the years ended September 30, 2012 and 2011 amount to €3 million and €3 million, respective-ly. The facilities are for general business purposes.

1 A. To our Shareholders 49 C. Combined Management Report 21 B. Corporate Governance174
As of September 30, 2012 and 2011, the aggregate amounts of indebtedness maturing during the next five years and thereaf-ter are as follows (excluding finance leases which are disclosed separately):
September 30,
(in millions of €) 2012 2011
Within one year 3,793 3,644
After one year but not more than five years 9,214 6,896
More than five years 7,539 7,255
20,546 17,795
OThEr fiNaNcial iNdEbTEdNESSItem Other financial indebtedness includes €153 million and €157 million as of September 30, 2012 and 2011, respectively, for the Company ’s real estate assets that were sold or trans-ferred and in which Siemens has retained significant risks and rewards of ownership, including circumstances in which Siemens participates directly or indirectly in the change in market value of the property. Therefore, these transactions have been accounted for as financing obligations. These real estate properties are carried on the Company ’s Consolidated Statements of Financial Position and no sale and profit has been recognized.
ObligaTiONS uNdEr fiNaNcE lEaSESAs of September 30, 2012 and 2011, the finance lease liabilities are as follows:
September 30, 2012 September 30, 2011
Minimum future lease payment
obligationUnamortized
interest expense
Present value ofminimum future
lease paymentobligation
Minimum future lease payment
obligationUnamortized
interest expense
Present value ofminimum future
lease paymentobligation(in millions of €)
Due
Within one year 47 14 33 31 15 16
After one year but not more than five years 62 11 51 77 14 63
More than five years 132 55 76 124 58 66
Total 241 80 161 232 87 145
Less: Current portion (33) (16)
128 129
NOTE 23 Pension plans and similar commitments
Pension benefits provided by Siemens are currently organized primarily through defined benefit pension plans which cover al-most all of the Company ’s domestic employees and many of the Company ’s foreign employees. To reduce the risk exposure to Siemens arising from its pension plans, the Company per-formed a redesign of some major pension plans during the last several years towards benefit schemes which are predominantly based on contributions made by the Company. In order to fund Siemens’ pension obligations, the Company ’s major pension plans are funded with assets in segregated pension entities.
Furthermore, the Company provides other post-employment benefits, which primarily consist of transition payments to German employees after retirement as well as post-employ-ment health care and life insurance benefits to employees in the U.S. and Canada. These predominantly unfunded other
post-employment benefit plans qualify as defined benefit plans under IFRS.
The Consolidated Statements of Financial Position include the following significant components related to pension plans and similar commitments as of September 30, 2012 and 2011:
September 30,
(in millions of €) 2012 2011
Pension benefit plans 9,246 6,552
Other post-employment benefit plans 681 754
Liabilities for pension plans and similar commitments 9,926 7,306
Prepaid costs for post-employment benefits 39 149
Actuarial (losses)/gains (8,781) (5,680)
Effects in connection with asset ceiling (170) (163)
Income tax effect 2,250 1,004
Net amount recognized in the Consolidated Statements of Changes in Equity, net of tax (6,701) (4,839)

135 D. Consolidated Financial Statements 239 E. Additional Information
140 D.5 Consolidated Statements of Changes in Equity 142 D.6 Notes to Consolidated Financial Statements 232 D.7 Supervisory Board and Managing Board
136 D.1 Consolidated Statements of Income 137 D.2 Consolidated Statements of Comprehensive Income 138 D.3 Consolidated Statements of Financial Position 139 D.4 Consolidated Statements of Cash Flow
175
In addition to the above, the Company has foreign defined con-tribution plans for pensions and other post-employment bene-fits or makes contributions to social pension funds based on legal regulations (state plans). The recognition of a liability is not required because the obligation of the Company is limited to the payment of the contributions into these plans or funds.
pENSiON bENEfiTSThe pension benefit plans cover 519,000 participants, includ-ing 228,000 active employees, 91,000 former employees with vested benefits and 200,000 retirees and surviving depen-dents. Individual benefits are generally based on eligible com-pensation levels and / or ranking within the Company hierarchy and years of service. Retirement benefits under these plans vary depending on legal, fiscal and economic requirements in each country. The majority of Siemens’ active employees in Germany participate in a pension scheme introduced in fiscal 2004, the BSAV (Beitragsorientierte Siemens Altersversor-gung). The BSAV is a funded defined benefit pension plan whose benefits are predominantly based on contributions made by the Company and returns earned on such contribu-tions, subject to a minimum return guaranteed by the Company. The BSAV is funded via the BSAV Trust. In connection with the
implementation of the BSAV, benefits provided under defined benefit pension plans funded via the Siemens German Pension Trust were modified to substantially eliminate the effects of compensation increases by freezing the accrual of benefits un-der the majority of these plans.
The Company ’s pension benefit plans are explicitly explained in the subsequent sections with regard to:
> Pension obligations, plan assets and funded status, > Components of NPBC, > Amounts recognized in the Consolidated Statements of Comprehensive Income,
> Assumptions used for the calculation of the DBO and NPBC, > Sensitivity analysis, > Plan assets and > Pension benefit payments.
Pension benefits: pension obligations, plan assets and funded statusA reconciliation of the funded status of the pension benefit plans to the amounts recognized in the Consolidated Statements of Financial Position is as follows:
September 30, 2012 September 30, 2011
(in millions of €) Total Domestic Foreign Total Domestic Foreign
Fair value of plan assets 24,052 13,956 10,096 20,965 12,309 8,656
Total defined benefit obligation 33,020 19,999 13,021 27,121 16,624 10,497
Defined benefit obligation (funded) 31,945 19,794 12,151 26,189 16,406 9,783
Defined benefit obligation (unfunded) 1,075 205 870 932 218 714
Funded status (8,968) (6,043) (2,925) (6,156) (4,315) (1,841)
Germany (6,043) (6,043) (4,315) (4,315)
U.S. (1,276) (1,276) (1,083) (1,083)
U.K. (248) (248) 148 148
Other (1,401) (1,401) (906) (906)
Unrecognized past service cost (benefits) (69) – (69) (84) – (84)
Effects due to asset ceiling (170) – (170) (163) – (163)
Net amount recognized (9,207) (6,043) (3,164) (6,403) (4,315) (2,088)
Amounts recognized in the Consolidated Statements of Financial Position consist of:
Pension asset 39 – 39 149 – 149
Pension liability (9,246) (6,043) (3,203) (6,552) (4,315) (2,237)
The fair value of plan assets, DBO and funded status as of Sep-tember 30, 2010, amounted to €24,107 million, €31,475 million and €(7,368) million, respectively. As of September 30, 2009, the fair value of plan assets, DBO and funded status were €21,990 million, €26,944 million and €(4,954) million. As of September 30, 2008, the fair value of plan assets, DBO and funded status were €21,002 million, €24,261 million and €(3,259) million.
A detailed reconciliation of the changes in the DBO and in plan assets for fiscal 2012 and 2011 as well as additional information by country is provided in the following tables (DBO and fair value of plan assets at beginning of fiscal 2012 and reconcilia-tion items for fiscal 2012 are presented inclusive of OSRAM in order to conform to the prior-year presentation):

1 A. To our Shareholders 49 C. Combined Management Report 21 B. Corporate Governance176
September 30, 2012 September 30, 2011
(in millions of €) Total Domestic Foreign Total Domestic Foreign
Change in defined benefit obligations:
Defined benefit obligation at beginning of year 28,721 17,147 11,574 31,475 18,897 12,578
Foreign currency exchange rate changes 523 – 523 234 – 234
Service cost 446 319 127 491 316 175
Interest cost 1,318 806 512 1,292 768 524
Settlements and curtailments (25) – (25) (970) (18) (952)
Plan participants’ contributions 119 64 55 137 81 56
Amendments and other 165 – 165 98 20 78
Actuarial (gains) losses 5,212 3,359 1,853 (1,766) (1,611) (155)
Acquisitions 82 6 76 46 25 21
Benefits paid (1,617) (1,040) (577) (1,553) (1,005) (548)
Divestments (29) (5) (24) (763) (326) (437)
Reclassification to assets and to liabilities associated with assets classified as held for disposal for OSRAM (1,895) (658) (1,237) (1,600) (523) (1,077)
Defined benefit obligation at end of year 33,020 19,999 13,021 27,121 16,624 10,497
Germany 19,999 19,999 16,624 16,624
U.S. 4,091 4,091 3,429 3,429
U.K. 4,006 4,006 3,053 3,053
Other 4,924 4,924 4,015 4,015
September 30, 2012 September 30, 2011
(in millions of €) Total Domestic Foreign Total Domestic Foreign
Change in plan assets:
Fair value of plan assets at beginning of year 22,193 12,700 9,493 24,107 14,059 10,048
Foreign currency exchange rate changes 486 – 486 208 – 208
Expected return on plan assets 1,390 790 600 1,475 886 589
Actuarial gains (losses) on plan assets 2,000 1,533 467 (1,653) (1,357) (296)
Acquisitions and other 198 1 197 79 1 78
Settlements (19) – (19) (773) – (773)
Employer contributions 730 376 354 849 276 573
Plan participants' contributions 119 64 55 137 81 56
Benefits paid (1,530) (998) (532) (1,470) (973) (497)
Divestments and other (36) – (36) (766) (273) (493)
Reclassification to assets and to liabilities associated with assets classified as held for disposal for OSRAM (1,480) (509) (971) (1,228) (391) (837)
Fair value of plan assets at end of year 24,052 13,956 10,096 20,965 12,309 8,656
Germany 13,956 13,956 12,309 12,309
U.S. 2,815 2,815 2,346 2,346
U.K. 3,758 3,758 3,201 3,201
Other 3,523 3,523 3,109 3,109
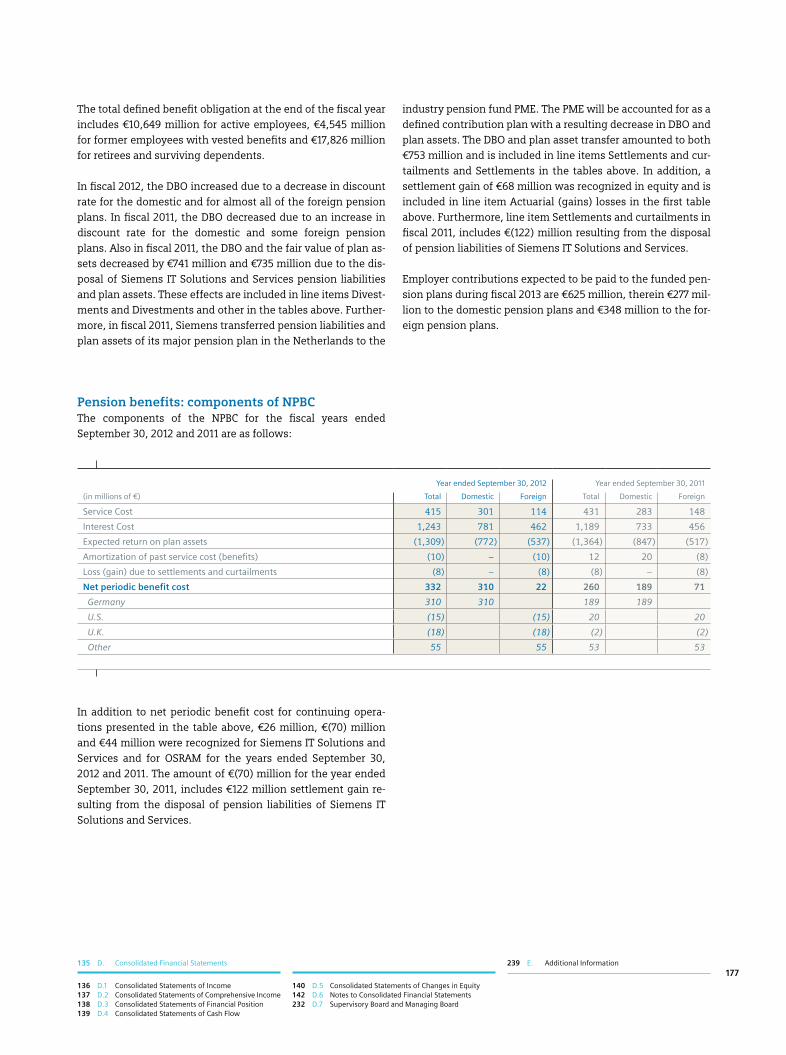
135 D. Consolidated Financial Statements 239 E. Additional Information
140 D.5 Consolidated Statements of Changes in Equity 142 D.6 Notes to Consolidated Financial Statements 232 D.7 Supervisory Board and Managing Board
136 D.1 Consolidated Statements of Income 137 D.2 Consolidated Statements of Comprehensive Income 138 D.3 Consolidated Statements of Financial Position 139 D.4 Consolidated Statements of Cash Flow
177
The total defined benefit obligation at the end of the fiscal year includes €10,649 million for active employees, €4,545 million for former employees with vested benefits and €17,826 million for retirees and surviving dependents.
In fiscal 2012, the DBO increased due to a decrease in discount rate for the domestic and for almost all of the foreign pension plans. In fiscal 2011, the DBO decreased due to an increase in discount rate for the domestic and some foreign pension plans. Also in fiscal 2011, the DBO and the fair value of plan as-sets decreased by €741 million and €735 million due to the dis-posal of Siemens IT Solutions and Services pension liabilities and plan assets. These effects are included in line items Divest-ments and Divestments and other in the tables above. Further-more, in fiscal 2011, Siemens transferred pension liabilities and plan assets of its major pension plan in the Netherlands to the
industry pension fund PME. The PME will be accounted for as a defined contribution plan with a resulting decrease in DBO and plan assets. The DBO and plan asset transfer amounted to both €753 million and is included in line items Settlements and cur-tailments and Settlements in the tables above. In addition, a settlement gain of €68 million was recognized in equity and is included in line item Actuarial (gains) losses in the first table above. Furthermore, line item Settlements and curtailments in fiscal 2011, includes €(122) million resulting from the disposal of pension liabilities of Siemens IT Solutions and Services.
Employer contributions expected to be paid to the funded pen-sion plans during fiscal 2013 are €625 million, therein €277 mil-lion to the domestic pension plans and €348 million to the for-eign pension plans.
Year ended September 30, 2012 Year ended September 30, 2011
(in millions of €) Total Domestic Foreign Total Domestic Foreign
Service Cost 415 301 114 431 283 148
Interest Cost 1,243 781 462 1,189 733 456
Expected return on plan assets (1,309) (772) (537) (1,364) (847) (517)
Amortization of past service cost (benefits) (10) – (10) 12 20 (8)
Loss (gain) due to settlements and curtailments (8) – (8) (8) – (8)
Net periodic benefit cost 332 310 22 260 189 71
Germany 310 310 189 189
U.S. (15) (15) 20 20
U.K. (18) (18) (2) (2)
Other 55 55 53 53
In addition to net periodic benefit cost for continuing opera-tions presented in the table above, €26 million, €(70) million and €44 million were recognized for Siemens IT Solutions and Services and for OSRAM for the years ended September 30, 2012 and 2011. The amount of €(70) million for the year ended September 30, 2011, includes €122 million settlement gain re-sulting from the disposal of pension liabilities of Siemens IT Solutions and Services.
Pension benefits: components of NPBCThe components of the NPBC for the fiscal years ended September 30, 2012 and 2011 are as follows:

1 A. To our Shareholders 49 C. Combined Management Report 21 B. Corporate Governance178
Pension benefits: amounts recognized in the Consolidated Statements of Comprehensive IncomeThe actuarial gains and losses on defined benefit pension plans recognized in the Consolidated Statements of Compre-hensive Income for the fiscal years ended September 30, 2012 and 2011 were as follows:
For the years ended September 30, 2012 and 2011, cumulative in-come or expense of €117 million and €(6) million is recognized in line item Net amount recognized in the Consolidated Statements of Comprehensive Income, net of tax which relates to OSRAM.
Pension benefits: assumptions for the calculation of the DBO and NPBCAssumed discount rates, compensation increase rates and pension progression rates used in calculating the DBO together
Year ended September 30, 2012 Year ended September 30, 2011
(in millions of €) Total Domestic Foreign Total Domestic Foreign
Actuarial losses (gains) 3,023 1,725 1,298 (113) (254) 141
Effects in connection with asset ceiling 2 – 2 18 – 18
Income tax effect (1,216) (869) (347) 146 227 (81)
Net amount recognized in the Consolidated Statements of Comprehensive Income, net of tax 1,809 856 953 51 (27) 78
Germany 856 856 (27) (27)
U.S. 198 198 228 228
U.K. 376 376 (208) (208)
Other 379 379 58 58
with long-term rates of return on plan assets vary according to the economic conditions of the country in which the retire-ment plans are situated or where plan assets are invested as well as capital market expectations.
The weighted-average discount rate used for the actuarial val-uation of the DBO at period-end and the expected return on plan assets for the fiscal year ending at period-end were as follows:
Year ended September 30, 2012 Year ended September 30, 2011
Total Domestic Foreign Total Domestic Foreign
Discount rate 3.2% 3.1% 3.3% 4.5% 4.7% 4.3%
Germany 3.1% 3.1% 4.7% 4.7%
U.S. 2.90% 2.90% 4.10% 4.10%
U.K. 4.4% 4.4% 5.7% 5.7%
Expected return on plan assets 6.3% 6.5% 6.1% 6.3% 6.5% 6.1%
Germany 6.5% 6.5% 6.5% 6.5%
U.S. 6.96% 6.96% 6.95% 6.95%
U.K. 6.0% 6.0% 6.0% 6.0%
The rates of compensation increase for countries with signifi-cant effects with regard to this assumption were as follows for the years ended September 30, 2012 and 2011: U.S.: 3.69% and 3.50%, U.K. 4.10% and 5.00%, Switzerland: 1.5% and 1.5%, Netherlands: 2.98% and 2.95%. The compensation increase rate for the domestic pension plans for the year ended Sep-tember 30, 2012, was 2.25% (2011: 2.25%). However, due to the
implementation of the BSAV, the effect of the compensation increase on the domestic pension plans is substantially elimi-nated. The rates of pension progression for countries with sig-nificant effects with regard to this assumption were as follows for the years ended September 30, 2012 and 2011: Germany: 1.67% and 1.75%, U.K.: 2.6% and 3.1%.

135 D. Consolidated Financial Statements 239 E. Additional Information
140 D.5 Consolidated Statements of Changes in Equity 142 D.6 Notes to Consolidated Financial Statements 232 D.7 Supervisory Board and Managing Board
136 D.1 Consolidated Statements of Income 137 D.2 Consolidated Statements of Comprehensive Income 138 D.3 Consolidated Statements of Financial Position 139 D.4 Consolidated Statements of Cash Flow
179
The assumptions used for the calculation of the DBO as of the period-end of the preceding fiscal year are used to determine the calculation of interest cost and service cost of the follow-ing year. The total expected return for the fiscal year will be based on the expected rates of return for the respective year multiplied by the fair value of plan assets at the preceding fis-cal years period-end date. The fair value and thus the expected return on plan assets are adjusted for significant events after the fiscal year end, such as a supplemental funding.
The discount rate assumptions reflect the rates available on high-quality corporate bonds or government bonds of consis-tent duration and currency at the period-end date. The expect-ed return on plan assets is determined on a uniform basis, con-sidering long-term historical returns, asset allocation, and fu-ture estimates of long-term investment returns. In fiscal 2012 and fiscal 2011, the expected return on plan assets remained primarily unchanged. Changes of the mortality assumption, primarily in Switzerland, increased the DBO by 0.6%. Changes of other actuarial assumptions not mentioned above, such as employee turnover, disability, etc., had an only minor effect on the overall DBO as of September 30, 2012.
Experience adjustments, which result from differences be-tween the actuarial assumptions and the actual occurrence, increased the DBO by 0.5% in fiscal 2012, decreased the DBO by 0.6% in fiscal 2011, did not affect the DBO in fiscal 2010, de-creased the DBO by 0.5% in fiscal 2009 and increased the DBO by 0.4% in fiscal 2008.
Pension benefits: sensitivity analysisA one-percentage-point change of the established assumptions mentioned above, used for the calculation of the NPBC for fiscal 2013, or a change in the fair value of plan assets of €500 mil-lion, as of September 30, 2012, respectively, would result in the following increase (decrease) of the fiscal 2013 NPBC:
Effect on NPBC 2013 due to a one-percentage-
point / €500
(in millions of €) increase decrease
Discount rate 80 (111)
Expected return on plan assets (236) 236
Rate of compensation increase 22 (19)
Rate of pension progression 139 (104)
Fair value of plan assets (32) 32
Increases and decreases in the discount rate, rate of compen-sation increase and rate of pension progression which are used in determining the DBO do not have a symmetrical effect on NPBC primarily due to the compound interest effect created when determining the net present value of the future pension benefit. If more than one of the assumptions were changed si-multaneously, the cumulative impact would not necessarily be the same as if only one assumption was changed in isolation.
Pension benefits: plan assetsThe asset allocation of the plan assets of the pension benefit plans as of the period-end date in fiscal 2012 and 2011, as well as the target asset allocation for fiscal year 2013, are as follows:
Target asset allocation Asset allocation
September 30, 2013 September 30, 2012 September 30, 2011
Asset class Total Domestic Foreign Total Domestic Foreign
Equity 20 – 50% 27% 27% 27% 28% 29% 27%
Fixed income 40 – 70% 62% 64% 60% 62% 63% 62%
Real estate 5 – 15% 7% 6% 7% 7% 6% 8%
Cash and other assets 0 – 15% 4% 3% 6% 3% 2% 3%
100% 100% 100% 100% 100% 100%
Derivatives are reported under the asset class whose risk is hedged. Current asset allocation is composed of high quality government and selected corporate bonds. Siemens constant-ly reviews the asset allocation in light of the duration of its pension liabilities and analyzes trends and events that may af-fect asset values in order to initiate appropriate measures at a very early stage.
The plan assets include own shares and debt instruments of the Company with a fair value of €74 million and €78 million as of September 30, 2012 and 2011.
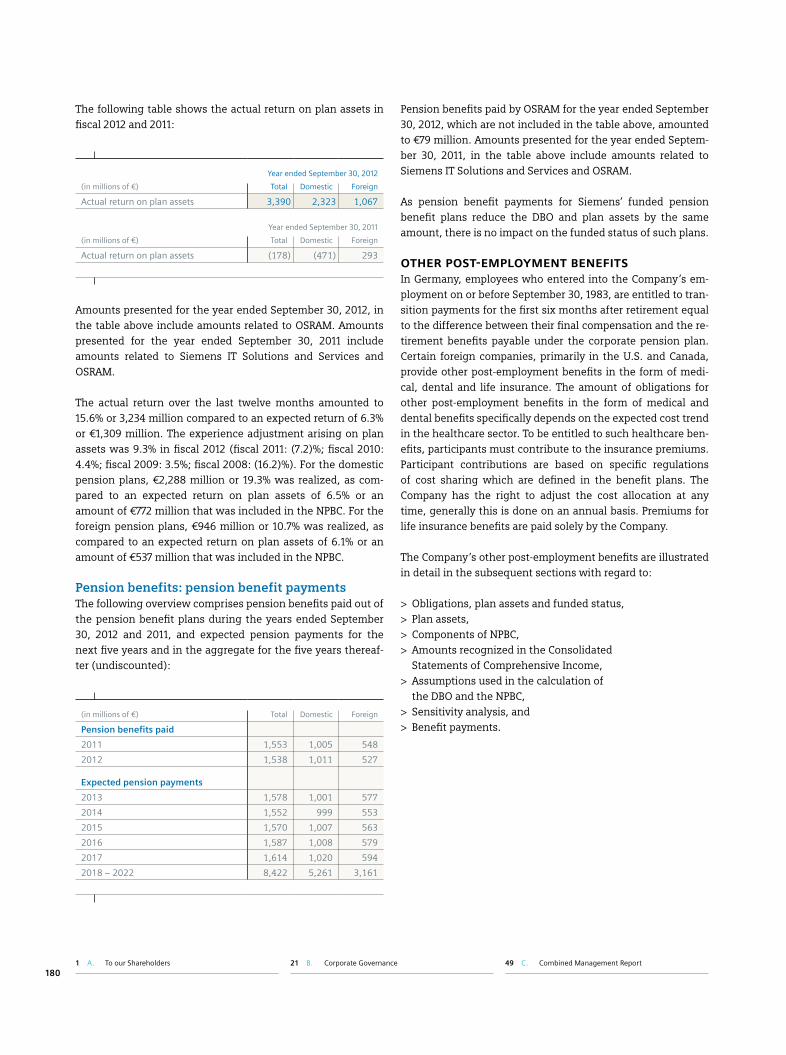
1 A. To our Shareholders 49 C. Combined Management Report 21 B. Corporate Governance180
The following table shows the actual return on plan assets in fiscal 2012 and 2011:
Year ended September 30, 2012
(in millions of €) Total Domestic Foreign
Actual return on plan assets 3,390 2,323 1,067
Year ended September 30, 2011
(in millions of €) Total Domestic Foreign
Actual return on plan assets (178) (471) 293
Amounts presented for the year ended September 30, 2012, in the table above include amounts related to OSRAM. Amounts presented for the year ended September 30, 2011 include amounts related to Siemens IT Solutions and Services and OSRAM.
The actual return over the last twelve months amounted to 15.6% or 3,234 million compared to an expected return of 6.3% or €1,309 million. The experience adjustment arising on plan assets was 9.3% in fiscal 2012 (fiscal 2011: (7.2)%; fiscal 2010: 4.4%; fiscal 2009: 3.5%; fiscal 2008: (16.2)%). For the domestic pension plans, €2,288 million or 19.3% was realized, as com-pared to an expected return on plan assets of 6.5% or an amount of €772 million that was included in the NPBC. For the foreign pension plans, €946 million or 10.7% was realized, as compared to an expected return on plan assets of 6.1% or an amount of €537 million that was included in the NPBC.
Pension benefits: pension benefit paymentsThe following overview comprises pension benefits paid out of the pension benefit plans during the years ended September 30, 2012 and 2011, and expected pension payments for the next five years and in the aggregate for the five years thereaf-ter (undiscounted):
(in millions of €) Total Domestic Foreign
Pension benefits paid
2011 1,553 1,005 548
2012 1,538 1,011 527
Expected pension payments
2013 1,578 1,001 577
2014 1,552 999 553
2015 1,570 1,007 563
2016 1,587 1,008 579
2017 1,614 1,020 594
2018 – 2022 8,422 5,261 3,161
Pension benefits paid by OSRAM for the year ended September 30, 2012, which are not included in the table above, amounted to €79 million. Amounts presented for the year ended Septem-ber 30, 2011, in the table above include amounts related to Siemens IT Solutions and Services and OSRAM.
As pension benefit payments for Siemens’ funded pension benefit plans reduce the DBO and plan assets by the same amount, there is no impact on the funded status of such plans.
OTHER POST-EMPLOYMENT BENEFITSIn Germany, employees who entered into the Company ’s em-ployment on or before September 30, 1983, are entitled to tran-sition payments for the first six months after retirement equal to the difference between their final compensation and the re-tirement benefits payable under the corporate pension plan. Certain foreign companies, primarily in the U.S. and Canada, provide other post-employment benefits in the form of medi-cal, dental and life insurance. The amount of obligations for other post-employment benefits in the form of medical and dental benefits specifically depends on the expected cost trend in the healthcare sector. To be entitled to such healthcare ben-efits, participants must contribute to the insurance premiums. Participant contributions are based on specific regulations of cost sharing which are defined in the benefit plans. The Company has the right to adjust the cost allocation at any time, generally this is done on an annual basis. Premiums for life insurance benefits are paid solely by the Company.
The Company ’s other post-employment benefits are illustrated in detail in the subsequent sections with regard to:
> Obligations, plan assets and funded status, > Plan assets, > Components of NPBC, > Amounts recognized in the Consolidated Statements of Comprehensive Income,
> Assumptions used in the calculation of the DBO and the NPBC,
> Sensitivity analysis, and > Benefit payments.
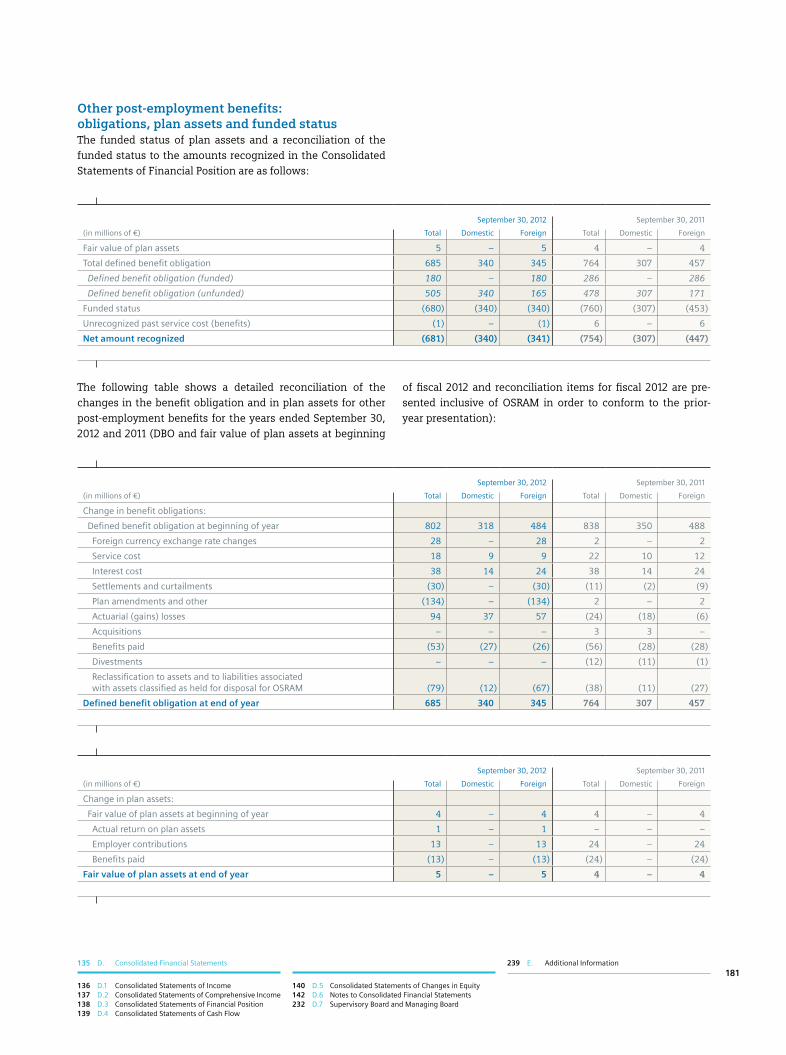
135 D. Consolidated Financial Statements 239 E. Additional Information
140 D.5 Consolidated Statements of Changes in Equity 142 D.6 Notes to Consolidated Financial Statements 232 D.7 Supervisory Board and Managing Board
136 D.1 Consolidated Statements of Income 137 D.2 Consolidated Statements of Comprehensive Income 138 D.3 Consolidated Statements of Financial Position 139 D.4 Consolidated Statements of Cash Flow
181
Other post-employment benefits: obligations, plan assets and funded statusThe funded status of plan assets and a reconciliation of the funded status to the amounts recognized in the Consolidated Statements of Financial Position are as follows:
The following table shows a detailed reconciliation of the changes in the benefit obligation and in plan assets for other post-employment benefits for the years ended September 30, 2012 and 2011 (DBO and fair value of plan assets at beginning
September 30, 2012 September 30, 2011
(in millions of €) Total Domestic Foreign Total Domestic Foreign
Fair value of plan assets 5 – 5 4 – 4
Total defined benefit obligation 685 340 345 764 307 457
Defined benefit obligation (funded) 180 – 180 286 – 286
Defined benefit obligation (unfunded) 505 340 165 478 307 171
Funded status (680) (340) (340) (760) (307) (453)
Unrecognized past service cost (benefits) (1) – (1) 6 – 6
Net amount recognized (681) (340) (341) (754) (307) (447)
September 30, 2012 September 30, 2011
(in millions of €) Total Domestic Foreign Total Domestic Foreign
Change in benefit obligations:
Defined benefit obligation at beginning of year 802 318 484 838 350 488
Foreign currency exchange rate changes 28 – 28 2 – 2
Service cost 18 9 9 22 10 12
Interest cost 38 14 24 38 14 24
Settlements and curtailments (30) – (30) (11) (2) (9)
Plan amendments and other (134) – (134) 2 – 2
Actuarial (gains) losses 94 37 57 (24) (18) (6)
Acquisitions – – – 3 3 –
Benefits paid (53) (27) (26) (56) (28) (28)
Divestments – – – (12) (11) (1)
Reclassification to assets and to liabilities associated with assets classified as held for disposal for OSRAM (79) (12) (67) (38) (11) (27)
Defined benefit obligation at end of year 685 340 345 764 307 457
September 30, 2012 September 30, 2011
(in millions of €) Total Domestic Foreign Total Domestic Foreign
Change in plan assets:
Fair value of plan assets at beginning of year 4 – 4 4 – 4
Actual return on plan assets 1 – 1 – – –
Employer contributions 13 – 13 24 – 24
Benefits paid (13) – (13) (24) – (24)
Fair value of plan assets at end of year 5 – 5 4 – 4
of fiscal 2012 and reconciliation items for fiscal 2012 are pre-sented inclusive of OSRAM in order to conform to the prior-year presentation):

1 A. To our Shareholders 49 C. Combined Management Report 21 B. Corporate Governance182
Line items Plan amendments and other and Settlements and curtailments in the first table above include €(124) million and €(30) million resulting from a plan change of the main health care plan in the U.S. The group insurance program for a de-fined group of Siemens retirees is replaced by individual healthcare agreements between the affected beneficiaries and healthcare insurance providers, resulting in a one-time reduc-tion of current and future contributions.
Other post-employment benefits: components of NPBCThe components of the NPBC for other post-employment ben-efits for the years ended September 30, 2012 and 2011 are as follows:
Year ended September 30, 2012 Year ended September 30, 2011
(in millions of €) Total Domestic Foreign Total Domestic Foreign
Service cost 16 9 7 21 10 11
Interest cost 35 14 21 36 13 23
Amortization of unrecognized past service cost (benefits) (116) – (116) 4 – 4
Loss (gain) due to settlements and curtailments (30) – (30) (10) – (10)
Net periodic benefit cost (95) 23 (118) 51 23 28
In addition to net periodic benefit cost for continuing operations presented in the table above, €5 million and less than a million were recognized for Siemens IT Solutions and Services and for OSRAM for the years ended September 30, 2012 and 2011.
Line item Net periodic benefit cost in fiscal 2012, in the table above, include €(118) million past service cost and €(30) mil-lion curtailment gain resulting from a plan change of the main health care plan in the U.S., occurring in fiscal 2012.
Other post-employment benefits: amounts recognized in the Consolidated Statements of Comprehensive IncomeThe actuarial gains and losses on other post-employment ben-efit plans recognized in the Consolidated Statements of Com-prehensive Income for the fiscal years ended September 30, 2012 and 2011 were as follows:
Year ended September 30, 2012 Year ended September 30, 2011
(in millions of €) Total Domestic Foreign Total Domestic Foreign
Actuarial losses (gains) 82 36 46 (24) (18) (6)
Income tax effect (29) (11) (18) 7 5 2
Net amount recognized in the Consolidated Statements of Comprehensive Income, net of tax 53 25 28 (17) (13) (4)
Germany 25 25 (13) (13)
U.S. 24 24 – –
Canada – – (1) (1)
Other 4 4 (3) (3)
For the years ended September 30, 2012 and 2011, cumulative income or expense of €8 and less than a million € is recog-nized in line item Net amount recognized in the Consolidated Statements of Comprehensive Income, net of tax which relates to OSRAM.

135 D. Consolidated Financial Statements 239 E. Additional Information
140 D.5 Consolidated Statements of Changes in Equity 142 D.6 Notes to Consolidated Financial Statements 232 D.7 Supervisory Board and Managing Board
136 D.1 Consolidated Statements of Income 137 D.2 Consolidated Statements of Comprehensive Income 138 D.3 Consolidated Statements of Financial Position 139 D.4 Consolidated Statements of Cash Flow
183
Other post-employment benefits: assumptions used in the calculation of the DBO and NPBCDiscount rates and other key assumptions used for transition payments in Germany are the same as those utilized for domes-tic pension benefit plans.
The weighted-average assumptions used in calculating the actuarial values for the post-employment healthcare and life insurance benefits are as follows:
Year ended September 30,
2012 2011
Discount rate 3.1% 4.57%
U.S.:
Medical trend rates (initial/ultimate/year):
Medicare ineligible pre-65 9%/5%/2021 9%/5%/2020
Medicare eligible post-65 8%/5%/2018 8.5%/5%/2019
Dental trend rates (initial/ultimate/year) 6%/5%/2021 6%/5%/2021
Canada:
Medical trend rates (initial/ultimate/year) 8.4%/5%/2019 9%/5%/2019
Drug trend rates (initial/ultimate/year) 8.4%/5%/2019 9%/5%/2019
Dental trend rates 4% 4%
Experience adjustments, which result from differences be-tween the actuarial assumptions and the actual occurrence, increased the DBO by 0.6% in fiscal 2012, decreased the DBO by 3.0% in fiscal 2011, increased the DBO by 0.5% in fiscal 2010 and decreased the DBO by 1.6% and 0.9% in fiscal 2009 and 2008, respectively.
Other post-employment benefits: sensitivity analysisThe health care assumptions may be significantly influenced by the expected progression in health care expense. A one-per-centage-point change in the healthcare trend rates would have resulted in the following increase (decrease) of the defined benefit obligation and the service and interest cost as of and for the year ended September 30, 2012:
September 30, 2012One-percentage-point
(in millions of €) increase decrease
Effect on defined benefit obligation 28 (23)
Effect on total of service and interest cost components 2 (2)
Other post-employment benefits: benefit paymentsThe following overview comprises benefit payments for other post-employment benefits paid out of the other defined bene-fit post-employment plans during the years ended September 30, 2012 and 2011, and expected pension payments for the next five years and in the aggregate for the five years thereaf-ter (undiscounted):
(in millions of €) Total Domestic Foreign
Payments for other post-employment benefits
2011 56 28 28
2012 47 25 22
Expected payments for other post-employment benefits
2013 67 39 28
2014 51 29 22
2015 57 35 22
2016 57 34 23
2017 61 39 22
2018 – 2022 282 176 106
Payments for other post-employment benefits made by OSRAM for the year ended September 30, 2012, which are not included in the table above, amounted to €6 million. Amounts present-ed for the year ended September 30, 2011 in the table above in-clude amounts related to Siemens IT Solutions and Services and OSRAM.
Since the benefit obligations for other post-employment bene-fits are generally not funded, such payments will impact the current operating cash flow of the Company.
DEFINED CONTRIBUTIONS PLANS AND STATE PLANSThe amount recognized as an expense for defined contribution plans amounted to €545 million in fiscal 2012 and €437 million in fiscal 2011, respectively. Contributions to state plans amounted to €1,584 million in fiscal 2012 and €1,528 million in fiscal 2011, respectively.

1 A. To our Shareholders 49 C. Combined Management Report 21 B. Corporate Governance184
NOTE 24 Provisions
In fiscal 2012 and 2011, item Other changes contains reclassifi-cations to line item Liabilities associated with assets classified as held for disposal including the disposal of those entities of €25 million and €200 million, respectively.
Except for asset retirement obligations, the majority of the Company ’s provisions are generally expected to result in cash outflows during the next one to 15 years.
Warranties – mainly relate to products sold.
Order related losses and risks – are provided for anticipated losses and risks on uncompleted construction, sales and leas-ing contracts.
In fiscal 2012, the Power Transmission Division of the Energy Sector incurred project charges primarily related to technically complex grid connections to offshore wind-farms in Germany.
These charges were due to project delays resulting from a com-plex regulatory environment and the projects’ complex marine environment, which required revised estimates of resources and personnel. This led to €(570) million pretax effects on the income statement in fiscal 2012, which are mainly recorded as provisions for order related losses and risks.
In fiscal 2011, Siemens reevaluated the commercial feasibility of particle therapy for general patient treatment and began shifting its focus of certain particle therapy projects primarily to research. In accordance with project accounting rules, Siemens took project charges and reduced third-quarter reve-nue in Imaging & Therapy Systems of the Healthcare Sector by the amount of revenue recognized from the projects in prior periods and set up provisions. Total pretax effects on the fiscal 2011 Consolidated Statement of Income relating to the shifted focus in the third quarter of fiscal 2011 is €381 million includ-ing provisions for order related losses and risks.
Warranties Order related losses
and risks
Asset retirement obligations
Other Total
(in millions of €)
Balance as of October 1, 2011 3,506 2,017 1,130 2,169 8,822
Additions 1,446 1,123 1 562 3,132
Usage (738) (701) (9) (359) (1,806)
Reversals (847) (418) (21) (455) (1,741)
Translation differences 48 14 3 14 79
Accretion expense and effect of changes in discount rates 1 13 172 8 195
Other changes (12) (10) 5 (6) (22)
Balance as of September 30, 2012 3,405 2,038 1,282 1,933 8,658
Thereof non-current 1,146 733 1,261 768 3,908
Warranties Order related losses
and risks
Asset retirement obligations
Other Total
(in millions of €)
Balance as of October 1, 2010 3,591 2,017 1,053 1,809 8,470
Additions 1,632 1,094 7 1,157 3,890
Usage (835) (628) (9) (410) (1,882)
Reversals (845) (384) (11) (318) (1,558)
Translation differences 3 (13) – (5) (15)
Accretion expense and effect of changes in discount rates 2 10 90 3 105
Other changes (42) (79) – (67) (188)
Balance as of September 30, 2011 3,506 2,017 1,130 2,169 8,822
Thereof non-current 1,091 595 1,111 857 3,654

135 D. Consolidated Financial Statements 239 E. Additional Information
140 D.5 Consolidated Statements of Changes in Equity 142 D.6 Notes to Consolidated Financial Statements 232 D.7 Supervisory Board and Managing Board
136 D.1 Consolidated Statements of Income 137 D.2 Consolidated Statements of Comprehensive Income 138 D.3 Consolidated Statements of Financial Position 139 D.4 Consolidated Statements of Cash Flow
185
Asset retirement obligations – The Company is subject to asset retirement obligations related to certain items of property, plant and equipment. Such asset retirement obligations are primarily attributable to environmental clean-up costs which amounted to €1,224 million and €1,079 million, respectively, as of September 30, 2012 and 2011 (the non-current portion there-of being €1,215 million and €1,069 million, respectively) and to costs primarily associated with the removal of leasehold im-provements at the end of the lease term amounting to €58 mil-lion and €51 million, respectively, as of September 30, 2012 and 2011 (the non-current portion thereof being €46 million and €42 million, respectively).
Environmental clean-up costs relate to remediation and envi-ronmental protection liabilities which have been accrued based on the estimated costs of decommissioning facilities for the production of uranium and mixed-oxide fuel elements in Hanau, Germany (Hanau facilities), as well as a nuclear research and service center in Karlstein, Germany (Karlstein facilities). Ac-cording to the German Atomic Energy Act, when such a facility is closed, the resulting radioactive waste must be collected and delivered to a government-developed final storage facility. In this regard, the Company has developed a plan to decommis-sion the Hanau and Karlstein facilities in the following steps: clean-out, decontamination and disassembly of equipment and installations, decontamination of the facilities and buildings, sorting of radioactive materials, and intermediate and final stor-age of the radioactive waste. This process will be supported by continuing engineering studies and radioactive sampling under the supervision of German federal and state authorities. The de-contamination, disassembly and sorting activities are planned to continue until 2015; thereafter, the Company is responsible for intermediate storage of the radioactive materials until a final storage facility is available. With respect to the Hanau facility, the process of setting up intermediate storage for radioactive waste has nearly reached completion; on September 21, 2006, the Company received official notification from the authorities that the Hanau facility has been released from the scope of ap-plication of the German Atomic Energy Act and that its further use is unrestricted. The ultimate costs of the remediation are contingent on the decision of the federal government on the lo-cation of the final storage facility and the date of its availability. Consequently, the provision is based on a number of significant estimates and assumptions. Several parameters relating to the development of a final storage facility for radioactive waste are specified on the so called Schacht Konrad final storage. Param-eters related to the life-span of the German nuclear reactors reflect a planned phase-out until 2022. The valuation uses as-sumptions to reflect the current and detailed cost estimates, price inflation and discount rates as well as a continuous out-flow until 2075 related to the costs for dismantling as well as intermediate and final storage.
Using the input of an independent advisor, management up-dated its valuation of the liability due to changes in estimates which resulted in minor adjustments in fiscal 2012 and 2011. Facts and circumstances of the changes were as follows:
In fiscal 2012, parameters related to the set up cost of the Konrad final storage were updated by The Federal Office for Radiation Protection (Bundesamt für Strahlenschutz).
In fiscal 2011, the parameters related to the life-span of the German nuclear reactors generally changed to a planned phase-out until 2022. Revised assumptions were applied to re-flect current and detailed cost estimates as well as a shorter time span of future cash outflows, reflecting the shorter life-span of the German nuclear reactors. As of September 30, 2011 a continuous outflow until 2075 was assumed as opposed to 2084 in prior valuations.
The determination of the provisions related to major asset re-tirement obligations will continue to involve significant esti-mates and assumptions. Uncertainties surrounding the amount to be recognized include, for example, the estimated costs of decommissioning because of the long time frame over which future cash outflows are expected to occur. Amongst others, the estimated cash outflows related to the asset retire-ment obligation could alter significantly if, and when, political developments affect the government’s plans to develop the so called Schacht Konrad. As of September 30, 2012 and 2011, the provision totals €1,224 million and €1,079 million, respectively, and is recorded net of a present value discount of €1,418 mil-lion and €1,606 million, respectively. The total expected pay-ments for each of the next five fiscal years and the total there-after are €24 million, €26 million, €26 million, €27 million, €22 million and €2,517 million.
The Company recognizes the accretion of the provision for en-vironmental clean-up costs using the effective interest method applying current interest rates prevailing at the period-end date. In fiscal 2012 and 2011, the Company recognized €23 mil-lion and €24 million, respectively in accretion expense for en-vironmental clean-up costs in line item Other Financial income (expense), net. Changes in discount rates increased the carry-ing amount of provisions by €149 million and €66 million as of September 30, 2012 and 2011, respectively.
Other – Other includes transaction-related and post-closing provisions in connection with portfolio activities.

1 A. To our Shareholders 49 C. Combined Management Report 21 B. Corporate Governance186
NOTE 25 Other liabilities
30. September
(in millions of €) 2012 2011
Employee related liabilities 493 461
Liabilities due to employees and retirees in the U.S. not qualifying for presentation as Pensions and similar obligations 523 459
Deferred income 221 237
Accruals for pending invoices 124 98
Accruals for stand-ready obligations 79 80
Severance payments 71 79
Warranties for disposed of businesses 67 73
German pension insurance association – Pensionssicherungsverein (PSV) 56 69
Insurance liabilities 126 71
Other 292 240
2,052 1,867
NOTE 26 Equity
COMMON STOCkSiemens common stock is composed of no par value shares with a notional value of €3.00 per share. Each share of com-mon stock is entitled to one vote.
The following table provides a summary of outstanding autho-rized and conditional capital and the changes for fiscal years 2012 and 2011:
Common stock (authorized and issued)
Authorized capital (not issued)
Conditional capital (not issued)
in thousands of €
in thousands shares
in thousands of €
in thousands shares
in thousands of €
in thousands shares
As of September 30, 2010 2,742,610 914,203 591,930 197,310 757,517 252,506
Expired or cancelled capital – – (71,130) (23,710) – –
Newly approved capital – – 90,000 30,000 270,000 90,000
As of September 30, 2011 2,742,610 914,203 610,800 203,600 1,027,517 342,506
Expired or cancelled capital (99,610) (33,203) – – – –
As of September 30, 2012 2,643,000 881,000 610,800 203,600 1,027,517 342,506
AUTHORIzED CAPITAL (NOT ISSUED)The Company ’s shareholders authorized the Managing Board, with the approval of the Supervisory Board, to increase capital stock through the issuance of no par value shares registered in the names of the holders and to determine the further content of the rights embodied in the shares and the terms and condi-tions of the share issue as follows:
> Authorized Capital 2011 by up to €90 million through the is-suance of up to 30 million shares for contributions in cash. The authorization was granted on January 25, 2011 and ex-pires on January 24, 2016. This authorization followed the expiration of Authorized Capital 2006, see below. In accordance with Authorized Capital 2011 new shares can be issued solely
to employees of Siemens AG and its subsidiaries. Pre-emp-tive rights of existing shareholders are excluded.
> Authorized Capital 2009 by up to €520.8 million through the issuance of up to 173.6 million shares for contributions in cash and/or in kind (Authorized Capital 2009). The authori-zation was granted on January 27, 2009 and expires on Janu-ary 26, 2014. With the approval of the Supervisory Board, the Managing Board can exclude shareholders’ pre-emptive rights for capital increases in the form of contributions in kind and in certain pre-stipulated circumstances for contri-butions in cash.
> Authorized Capital 2006, granted in January 2006, expired in January 2011.

135 D. Consolidated Financial Statements 239 E. Additional Information
140 D.5 Consolidated Statements of Changes in Equity 142 D.6 Notes to Consolidated Financial Statements 232 D.7 Supervisory Board and Managing Board
136 D.1 Consolidated Statements of Income 137 D.2 Consolidated Statements of Comprehensive Income 138 D.3 Consolidated Statements of Financial Position 139 D.4 Consolidated Statements of Cash Flow
187
CONDITIONAL CAPITAL (NOT ISSUED)Conditional Capital is provided for the purpose of a) serving the issuance of bonds with conversion rights and (or) with warrants, b) accommodating the exercise of stock option plans and c) settling claims of former Siemens Nixdorf Informations-systeme AG (SNI AG) shareholders.
> Conditional Capital 2011 to service the issuance of bonds with conversion rights and/or with warrants or a combina-tion thereof in an aggregate principal amount of up to €15 billion, entitling the holders to subscribe to up to 90 million shares of Siemens AG with no par value, representing up to €270 million of capital stock. The authorization to issue such bonds was granted in January 2011 and will expire on January 24, 2016.
> Conditional Capital 2010 to service the issuance of bonds with conversion rights and/or with warrants in an aggregate principal amount of up to €15 billion, entitling the holders to subscribe to up to 200 million shares of Siemens AG with no par value, representing up to €600 million of capital stock. The authorization to issue such bonds was granted on Janu-ary 26, 2010 and will expire on January 25, 2015.
> Conditional Capital to service the 2001 and 1999 Siemens Stock Option Plans amounts to €157 million, representing 52.32 million shares of Siemens AG as of September 30, 2012 and 2011. The last tranche of stock options expired in No-vember 2010 and from that date on, no further shares are to be issued, see NOTE 33 SHARE-BASED PAYMENT for further information on stock options.
> Conditional Capital provided to issue shares to settle claims offered to former SNI AG shareholders who had not tendered their SNI AG share certificates amounts to €0.6 million, rep-resenting 189 thousand shares as of September 30, 2012 and 2011. Such rights to claim Siemens shares expired in 2007 and no further shares are to be issued.
TRANSACTIONS wITH NON-CONTROLLINg INTERESTSIn connection with an acquisition in fiscal 2012, a minority shareholder was granted a put option on the non-controlling interests. This transaction with non-controlling interests impacted line item Retained earnings by €(301) million as of September 30, 2012.
TREASURY STOCkThe Company is authorized by its shareholders to acquire trea-sury stock of up to 10% of its capital stock existing at the date of the shareholders’ resolution, which represents up to 91,420,342 Siemens shares or – if this value is lower – as of the
date on which the authorization is exercised. The authoriza-tion became effective on March 1, 2011 and remains in force through January 24, 2016. According to the resolution, repur-chased shares may be (1) sold via a stock exchange or through a public sales offer made to all shareholders; (2) retired; (3) of-fered for purchase to individuals currently or formerly em-ployed by the Company or any of its subsidiaries as well as to Board members of any of the Company ’s subsidiaries or grant-ed and transferred to such individuals with a vesting period of at least two years; (4) offered and transferred with the approv-al of the Supervisory Board to third parties against contribu-tions in kind, particularly in connection with business combi-nations or the acquisition of companies, businesses, parts of businesses or interests therein; (5) with the approval of the Supervisory Board sold to third parties against payment in cash if the price at which such Siemens shares are to be sold is not significantly lower than the market price of the Siemens stock at the time of selling; or (6) used to service convertible bonds or warrants granted by the Company or any of its sub-sidiaries. In addition, the Supervisory Board may use repur-chased shares to meet obligations or rights to acquire Siemens shares that were or will be agreed with members of the Managing Board within the framework of rules governing Managing Board compensation.
The current authorization to acquire Siemens shares is supple-mented by an authorization to repurchase up to five percent of its capital stock existing at the date of the shareholders’ resolu-tion by using equity derivatives or forward purchases with a maximum maturity term of 18 months; the repurchase of trea-sury stock upon the exercise of such instruments shall be no later than January 24, 2016.
In August 2012, Siemens announced a share buy back amount-ing to up to €3 billion by December 30, 2012. The shares repur-chased may be used for the purposes of cancellation and re-duction of capital stock, issuance to employees, board mem-bers of affiliated companies and members of the Managing Board as well as to meet obligations arising under and in con-nection with convertible bonds and warrant bonds. In fiscal 2012, the Company repurchased 23,202,500 treasury shares at a weighted average share price of €76.14. Additionally, the Managing Board decided to cancel 33,203,421 treasury shares, which reduced common stock from 914 million shares to 881 million shares.
In fiscal 2012 and 2011, 5,225,479 shares and 4,414,342 shares, respectively, were transferred in connection with equity set-tled share-based payment plans.

1 A. To our Shareholders 49 C. Combined Management Report 21 B. Corporate Governance188
OTHER COMPREHENSIvE INCOME, NET OF TAxThe changes in line item Other comprehensive income, net of tax including non-controlling interest holders are as follows:
As of September 30, 2012 and 2011, cumulative income (expense) of €(206) million and €(71) million, respectively, is recognized in line item Other comprehensive income which relates to non-current assets or disposal groups classified as held for disposal.
OTHER CHANgES IN EqUITYLine item Other changes in equity of the Consolidated State-ment of Changes in Equity includes €126 million which relate to the equity instruments of the US$ bonds with warrants is-sued in fiscal 2012.
MISCELLANEOUSUnder the German Stock Corporation Act (Aktiengesetz), the amount of dividends available for distribution to shareholders is based upon the earnings of Siemens AG as reported in its statutory financial statements determined in accordance with the German Commercial Code (Handelsgesetzbuch). In fiscal 2012, Siemens AG management distributed an ordinary divi-dend of €2,629 million (€3.00 per share) of the fiscal 2011 earn-ings to its shareholders. In fiscal 2011, Siemens AG manage-ment distributed to its shareholders an ordinary dividend of €2,356 million (€2.70 per share) of the fiscal 2010 earnings.
The Managing Board and the Supervisory Board proposed a dividend of €3 per share of the fiscal 2012 Siemens AG earn-ings, in total representing approximately €2.5 billion in expect-ed payments. Payment of the proposed dividend is contingent upon approval by the shareholders at the Annual Shareholders’ Meeting on January 23, 2013.
NOTE 27 Additional capital disclosures
As of September 30, 2012 and 2011, Siemens’ capital structure was as follows:
September 30, % Change
(in millions of €) 2012 2011
Total equity attributable to shareholders of Siemens AG 30,733 31,530 (3)%
As percentage of total capital 60% 64%
Short-term debt and current maturities of long-term debt 3,826 3,660
Long-term debt 16,880 14,280
Total debt 20,707 17,940 15%
As percentage of total capital 40% 36%
Total capital (total debt and total equity) 51,440 49,470 4%
Regarding Siemens’ share-buy back program, see NOTE 26
EqUITY. In September 2012, Siemens issued €1.4 billion and £1.0 billion (€1.25 billion as of September 30, 2012) in fixed-rate instruments, which are partly used to finance the share buy back program.
Siemens has commitments to sell or otherwise issue common shares in connection with share-based compensation plans, which were met by re-issuing treasury shares in fiscal 2012 and 2011.
Year ended September 30, 2012 Year ended September 30, 2011
(in millions of €) Pretax Tax effect Net Pretax Tax effect Net
Items that will not be reclassified to profit or loss:
Actuarial gains and losses on pension plans and similar commitments (3,412) 1,311 (2,101) 103 (168) (65)
Items that may be reclassified subsequently to profit or loss:
Unrealized holding gains (losses) on available-for-sale financial assets 305 (10) 295 (42) 5 (37)
Reclassification adjustments for gains (losses) included in net income (86) – (86) (29) 7 (22)
Net unrealized gains (losses) on available-for-sale financial assets 219 (10) 209 (71) 12 (59)
Unrealized gains (losses) on derivative financial instruments (64) 29 (35) (35) 18 (17)
Reclassification adjustments for gains (losses) included in net income 144 (46) 98 (148) 44 (104)
Net unrealized gains (losses) on derivative financial instruments 79 (17) 63 (183) 62 (121)
Foreign-currency translation differences 855 – 855 129 – 129
1,153 (27) 1,127 (125) 74 (51)
Other comprehensive income (2,259) 1,284 (974) (22) (94) (116)

135 D. Consolidated Financial Statements 239 E. Additional Information
140 D.5 Consolidated Statements of Changes in Equity 142 D.6 Notes to Consolidated Financial Statements 232 D.7 Supervisory Board and Managing Board
136 D.1 Consolidated Statements of Income 137 D.2 Consolidated Statements of Comprehensive Income 138 D.3 Consolidated Statements of Financial Position 139 D.4 Consolidated Statements of Cash Flow
189
As part of the Company ’s One Siemens framework for sustain-able value creation, Siemens continues to use an indicator in order to optimize the capital structure. A key consideration in this regard is to continue Siemens’ ready access to capital mar-kets through various debt products and maintaining the Com-pany ’s ability to repay and service its debt obligations over time. Siemens set a capital structure target range of 0.5 – 1.0. The ratio is defined as the item Adjusted industrial net debt di-vided by the item Adjusted EBITDA. The calculation of the item Adjusted industrial net debt is set forth in the table below. Ad-justed EBITDA is defined as adjusted earnings before income taxes (EBIT) before amortization (defined as amortization and impairments, net of reversals, of intangible assets other than goodwill) and depreciation and impairments of property, plant and equipment and goodwill. Adjusted EBIT is defined as line item Income from continuing operations before income taxes less line item Interest income, less line item Interest expense less line item Other financial income (expense), net as well as less line item Income (loss) from investments accounted for using the equity method, net.
September 30,
(in millions of €) 2012 2011
Short-term debt and current maturities of long-term debt 3,826 3,660
Plus: Long-term debt 1 16,880 14,280
Less: Cash and cash equivalents (10,891) (12,468)
Less: Current available-for-sale financial assets (524) (477)
Net debt 9,292 4,995
Less: SFS Debt 2 (14,558) (12,075)
Plus: Pension plans and similar commitments 3 9,926 7,307
Plus: Credit guarantees 326 591
Less: 50% nominal amount hybrid bond 4 (920) (883)
Less: Fair value hedge accounting adjustment 5 (1,670) (1,470)
Adjusted industrial net debt 2,396 (1,534)
Adjusted EBITDA (continuing operations) 9,788 10,701
Adjusted industrial net debt / adjusted EBITDA (continuing operations) 0.24 (0.14)
1 Item Short-term debt and current maturities of long-term debt as well as item Long-term debt include, in total, adjustments for fair value hedge accounting of €1,670 million and €1,470 million, respectively, as of September 30, 2012 and 2011.
2 The adjustment considers that both Moody ’s and Standard & Poor ’s view SFS as a captive finance company. These rating agencies generally recognize and accept higher levels of debt attributable to captive finance subsidiaries in determining credit ratings. Following this concept, we exclude SFS Debt in order to derive an adjusted industrial net debt which is not affected by SFS’s financing activities
3 To reflect Siemens’ total pension liability, adjusted industrial net debt includes line item Pension plans and similar commitments as presented in the Consolidated Statements of Financial Position.
4 In accordance with calculations made by Siemens’ rating agencies, Siemens adjusts the hybrid bond in order to classify 50% as equity and 50% as debt, which reflects the characteristics of the hybrid bond such as a long maturity date and subordina-tion to all senior and debt obligations.
5 Debt is generally reported at a value representing approximately the amount to be repaid. Under IFRS, debt designated in a hedging relationship (fair value hedges) is adjusted for changes in market value, which mainly result from changes in interest rates. Those adjustments are reversed to derive an approximated amount of debt to be repaid. Siemens believes this to be a more meaningful figure in computing adjusted industrial net debt.
A key factor in maintaining a strong financial profile is Siemens’ credit rating which is affected by, among other factors, Siemens’ capital structure, profitability, ability to generate cash flow, geographic and product diversification as well as Siemens’ competitive market position. Siemens’ current corpo-rate credit ratings from Moody ’s Investors Service and Stan-dard & Poor’s Ratings Services’ (S&P) are noted as follows:
September 30, 2012 September 30, 2011
Moody’s Investors
Service S&P
Moody’s Investors
Service S&P
Long-term debt Aa3 A+ A1 A+
Short-term debt P-1 A-1+ P-1 A-1+
On June 5, 2012, Moody ’s raised its long-term Siemens’ credit rating from A1 to Aa3. The rating classification Aa is the second highest rating within Moody ’s debt ratings category. The nu-merical modifier 3 indicates a ranking in the lower end of that rating category. At the same time Moody ’s revised its outlook for Siemens’ credit rating from positive to stable. The Moody ’s rating outlook is an opinion regarding the likely direction of an issuer’s rating over the medium-term. Rating outlooks of Moody ’s fall into the following six categories: positive, nega-tive, stable, developing, ratings under review and no outlook. Moody ’s announced that the rating action was prompted by the higher levels of profitability and cash flow leverage that the Company has been able to achieve over the past few years, and Moody ’s assessment that these levels are likely to be sus-tainable through economic cycles, including the current peri-od of economic weakness in Europe.
Moody ’s rating for Siemens’ short-term corporate credit and commercial paper is P-1, the highest available rating in the prime rating system, which assesses issuers’ ability to honor senior financial obligations and contracts. It applies to senior unsecured obligations with an original maturity of less than one year. On June 5, 2012 Moody ’s affirmed Siemens’ P-1 short-term rating.
S&P’s rating for Siemens’ long-term credit rating is A+. Within S&P’s ratings definitions an obligation rated A has the third highest long-term rating category. The modifier + indicates that the long-term debt ranks in the upper end of the A catego-ry. S&P’s outlook for Siemens’ credit rating was positive. A rat-ing outlook indicates the potential direction of a long-term credit rating over the medium-term. Rating outlooks of S&P’s fall into the following four categories: positive, negative, sta-ble and developing.

1 A. To our Shareholders 49 C. Combined Management Report 21 B. Corporate Governance190
S&P’s rating for Siemens’ short-term corporate credit rating is A-1+. This is the highest short-term rating within the S&P’s short-term rating scale. During fiscal 2012, S&P’s did not change our long-term or short-term credit rating.
NOTE 28 Commitments and contingencies
gUARANTEES AND OTHER COMMITMENTSThe following table presents the undiscounted amount of maximum potential future payments for each major group of guarantee:
September 30,
(in millions of €) 2012 2011
Guarantees
Credit guarantees 326 591
Guarantees of third-party performance 1,562 2,718
HERKULES obligations 2,290 2,690
Other 3,632 3,613
7,810 9,612
As of September 30, 2012, in addition to guarantees disclosed above, Siemens has credit guarantees of €309 million, guaran-tees of third-party performance of €4 million and other guar-antees of €82 million relating to discontinued operations.
Item Credit guarantees cover the financial obligations of third parties in cases where Siemens is the vendor and (or) contrac-tual partner. These guarantees generally provide that in the event of default or non-payment by the primary debtor, Siemens will be required to settle such financial obligations. In addition, Siemens provides credit guarantees generally as credit-line guarantees with variable utilization to joint ventures and associ-ated and other companies accounted for using the equity meth-od. The maximum amount of these guarantees is subject to the outstanding balance of the credit or, in case where a credit line is subject to variable utilization, the nominal amount of the credit line. These guarantees usually have terms of between one and five years. Except for statutory recourse provisions against the primary debtor, credit guarantees are generally not subject to additional contractual recourse provisions. As of Sep-tember 30, 2012 and 2011, the Company accrued €28 million and €39 million, respectively, relating to credit guarantees.
Furthermore, Siemens issues guarantees of third-party perfor-mance, which include performance bonds and guarantees of advanced payments in cases where Siemens is the general or subsidiary partner in a consortium. In the event of non-fulfill-
ment of contractual obligations by the consortium partner(s), Siemens will be required to pay up to an agreed-upon maxi-mum amount. These agreements span the term of the con-tract, typically ranging from three months to seven years. Gen-erally, consortium agreements provide for fallback guarantees as a recourse provision among the consortium partners. In fis-cal 2011, item Guarantees of third-party performance, included a significant amount of guarantees relating to the Siemens IT Solutions and Services business, yet to be transferred to AtoS in fiscal 2011. In case a beneficiary had raised a claim under these guarantees, AtoS would have been required to indemni-fy Siemens. As of September 30, 2012 and 2011, the Company accrued €83 million and €69 million, respectively, relating to performance guarantees.
In fiscal 2007, The Federal Republic of Germany commissioned a consortium consisting of Siemens and IBM Deutschland GmbH (IBM) to modernize and operate the non-military infor-mation and communications technology of the German Feder-al Armed Forces (Bundeswehr). This project is called HERKULES. A project company, BWI Informationstechnik GmbH (BWI), will provide the services required by the terms of the contract. Siemens is a shareholder in the project company. The total contract value amounts to a maximum of approxi-mately €6 billion. In connection with the consortium and exe-cution of the contract between BWI and the Federal Republic of Germany in December 2006, Siemens issued several guaran-tees connected to each other legally and economically in favor of the Federal Republic of Germany and of the consortium member IBM. The guarantees ensure that BWI has sufficient resources to provide the required services and to fulfill its con-tractual obligations. These guarantees are listed as a separate item HERKULES obligations in the table above due to their compound and multilayer nature. Total future payments po-tentially required by Siemens amount to €2.29 billion and €2.69 billion as of September 30, 2012 and 2011, respectively and will be reduced by approximately €400 million per year over the remaining five-year contract period as of September 30, 2012. Yearly payments under these guarantees are limited to €400 million plus, if applicable, a maximum of €90 million in unused guarantees carried forward from the prior year.
Item Other includes indemnifications issued in connection with dispositions of business entities. Such indemnifications, if customary to the relevant transactions, may protect the buy-er from potential tax, legal and other risks in conjunction with the purchased business entity. Indemnifications primarily re-late to NSN, disposed of in fiscal 2007, EN, disposed of in fiscal 2008, and to Siemens IT Solutions and Services disposed of in fiscal 2011. As of September 30, 2012 and 2011, the total amount accrued for guarantees in item Other is €528 million and €620 million, respectively.

135 D. Consolidated Financial Statements 239 E. Additional Information
140 D.5 Consolidated Statements of Changes in Equity 142 D.6 Notes to Consolidated Financial Statements 232 D.7 Supervisory Board and Managing Board
136 D.1 Consolidated Statements of Income 137 D.2 Consolidated Statements of Comprehensive Income 138 D.3 Consolidated Statements of Financial Position 139 D.4 Consolidated Statements of Cash Flow
191
As of September 30, 2012 and 2011, future payment obligations under non-cancellable operating leases are as follows:
September 30,
(in millions of €) 2012 2011
Within one year 812 716
After one year but not more than five years 1,586 1,526
More than five years 770 826
3,167 3,068
Total operating rental expense for the years ended September 30, 2012 and 2011 were €1,078 million and €1,051 million, re-spectively. Total sublease income amounts to €74 million and €79 million, respectively, in fiscal 2012 and 2011. Total future minimum sublease payments expected to be received under non-cancellable subleases as of September 30, 2012 and 2011 amount to €162 million and €257 million, respectively.
As of September 30, 2012 and 2011, the Company has commit-ments to make capital contributions to the equity of various companies of €211 million and €356 million, respectively. The September 30, 2012 and 2011 balance includes a conditional commitment, proportional to our shareholding, to make capi-tal contributions to EN of € – million and €172 million.
The Company is jointly and severally liable and has capital con-tribution obligations as a partner in commercial partnerships and as a participant in various consortiums.
NOTE 29 Legal proceedings
PUBLIC CORRUPTION PROCEEDINgS Governmental and related proceedingsAs previously reported, in May 2011 Siemens AG voluntarily reported a case of attempted public corruption in connection with a project in Kuwait in calendar 2010 to the U.S. Depart-ment of Justice, the SEC, and the Munich public prosecutor. The Munich public prosecutor discontinued the investigations, which related to certain former employees, but imposed condi-tions on them. Siemens is cooperating with the U.S. authori-ties in their ongoing investigations.
As previously reported, in July 2011 the Nuremberg-Fuerth public prosecutor notified Siemens AG of an investigation against several employees in connection with payments relat-ed to the healthcare business in the Caribbean. In November 2012, the Nuremberg-Fuerth public prosecutor discontinued its investigation.
As previously reported, in July 2011 the Munich public prosecu-tor notified Siemens AG of an investigation against an employee in connection with payments to a supplier related to the oil and gas business in Central Asia from calendar 2000 to 2009. Siemens is cooperating with the public prosecutor.
As previously reported, in October 2011, the Turkish Prime Minis-try Inspection Board notified Siemens Sanayi ve Ticaret A.S., Turkey, of an investigation in connection with alleged bribery in Turkey and Iraq from calendar 1999 to 2007. Siemens is coop-erating with the authority.
As previously reported, in 2011, the Brasilia public prosecutor, Brazil, opened proceedings to assess allegations against Siemens in connection with a metro project in calendar 2007. Siemens is cooperating with the authority.
As previously reported, authorities in Russia were conducting an investigation into alleged misappropriation of public funds in connection with the award of contracts to Siemens for the delivery of medical equipment to public authorities in Yekater-inburg in calendar 2003 to 2005. In July 2011, the investigation was closed with respect to all material charges. In November 2011, all remaining charges were dropped as well.
As previously reported, in calendar 2008 the São Paulo public prosecutor, Brazil, started certain investigations into the use of business consultants and suspicious payments in connection with the former Transportation Systems Group in or after cal-endar 2000. In fiscal 2011 Siemens learned that this investiga-tion was not discontinued in calendar 2009 but treated confi-dential. Siemens is cooperating with the authority.
As previously reported, Siemens AG had filed a request for arbi-tration against the Republic of Argentina (Argentina) with the International Center for Settlement of Investment Disputes ( ICSID) of the World Bank. Siemens AG claimed that Argentina had unlawfully terminated its contract with Siemens for the development and operation of a system for the production of identity cards, border control, collection of data and voters’ registers (DNI project) and thereby violated the Bilateral Invest-ment Protection Treaty between Argentina and Germany (BIT). A unanimous decision on the merits was rendered by the ICSID arbitration tribunal in February 2007, awarding Siemens AG, inter alia, compensation in the amount of US$217.8 million, plus compound interest thereon at a rate of 2.66% since May 18, 2001. Argentina subsequently filed applications with the ICSID aiming at the annulment and reversal of the decision and a stay of enforcement of the arbitral award. In August 2009, Argentina and Siemens AG reached an agreement to mu-tually settle the case and discontinue any and all civil proceed-ings in connection with the case without acknowledging any

1 A. To our Shareholders 49 C. Combined Management Report 21 B. Corporate Governance192
legal obligations or claims. No payment was made by either party. As previously reported, the Argentinean Anti-Corruption Authority is conducting an investigation against individuals in-to corruption of government officials in connection with the award of the contract for the DNI project to Siemens in calen-dar 1998. Searches were undertaken at the premises of Siemens Argentina and Siemens IT Services S.A. in Buenos Aires in August 2008 and in February 2009. The Company is cooperat-ing with the Argentinean Authorities. The Argentinean investi-gative judge also repeatedly requested judicial assistance from the Munich public prosecutor and the federal court in New York. In December 2011, the U.S. Securities and Exchange Com-mission (SEC) and U.S. Department of Justice filed an indict-ment against nine individuals based on the same facts as the investigation of the Argentinean Anti-Corruption Authority. Most of these individuals are former Siemens employees. The former member of the Managing Board of Siemens AG, Dr. Uriel Sharef, is also involved. Siemens AG is not party to the pro-ceedings.
As previously reported, in February 2010 a Greek Parliamentary Investigation Committee (GPIC) was established to investigate whether any politicians or other state officials in Greece were involved in alleged wrong-doing of Siemens in Greece. The GPIC’s investigation was focused on possible criminal liability of politicians and other state officials. Greek public prosecutors are separately investigating certain fraud and bribery allega-tions involving – among others – former board members and former executives of Siemens A.E., Elektrotechnische Projekte und Erzeugnisse, Greece (Siemens A.E.), and Siemens AG. In January 2011, the GPIC alleged in a letter to Siemens A.E. that the damage suffered by the Greek state amounted to at least €2 billion. Furthermore, the GPIC issued a report repeating these allegations. In addition, the Hellenic Republic Minister of State indicated in a letter to Siemens that the Greek state will seek compensation from Siemens for the alleged damage. In April 2012, the Greek Parliament approved a settlement agree-ment between Siemens and the Greek State, the material pro-visions of which include the following: Siemens waives public sector receivables in the amount of €80 million. Furthermore Siemens agrees to spend a maximum of €90 million on various anti-corruption and transparency initiatives, as well as uni-versity and research programs and to provide €100 million of financial support to Siemens A.E. to ensure its continued pres-ence in Greece. In exchange, the Greek State agrees to waive all civil claims and all administrative fines related to the cor-ruption allegations and to utilize best efforts to resolve all pending disputes between Siemens and the Greek state-com-panies or its public authorities.
In February 2012, the Munich public prosecutor notified Siemens AG of a request for mutual assistance in criminal matters by a foreign authority. The investigation of the foreign authority involves a Siemens subsidiary located in North West Europe in connection with alleged payments to employ-ees of a Russian company between calendar 1999 and 2006. In November 2012, the foreign authority notified Siemens about its intention to bring a charge against two individuals and to open proceedings against Siemens. Siemens is cooper-ating with the authorities.
As previously reported, the Nigerian Economic and Financial Crimes Commission (EFCC) was conducting an investigation into alleged illegal payments by Siemens to Nigerian public of-ficials between calendar 2002 and 2005. In October 2010, the EFCC filed charges with the Federal High Court in Abuja and the High Court of the Federal Capital Territory against, among others, Siemens Ltd., Nigeria (Siemens Nigeria), Siemens AG and former board members of Siemens Nigeria. In November 2010, the Nigerian Government and Siemens Nigeria entered into an out of court settlement, obligating Siemens Nigeria to make a payment in the mid double-digit € million range to Nigeria in exchange for the Nigerian Government withdrawing these criminal charges and refraining from the initiation of any criminal, civil or other actions – such as a debarment – against Siemens Nigeria, Siemens AG, and Siemens employees.
As previously reported, the Vienna public prosecutor, Austria, is conducting an investigation into payments between calen-dar 1999 and 2006 relating to Siemens Aktiengesellschaft Öster-reich, Austria, and its subsidiary Siemens VAI Metal Technolo-gies GmbH & Co., Austria, for which valid consideration could not be identified. In September 2011, the Vienna public prose-cutor extended the investigations to include a potential corpo-rate liability of Siemens AG Austria for tax evasion. Siemens is cooperating with the authorities.
As previously reported, in September 2009, the Anti-Corrup-tion Commission of Bangladesh (ACC) filed criminal charges against two current and one former employee of Siemens Ban-gladesh Ltd.’s (Siemens Bangladesh) Healthcare business. It is alleged that the employees colluded with employees of a pub-lic hospital to overcharge for the delivery of medical equip-ment in the period before calendar 2007. The ACC has not sub-stantiated the criminal charges within the time limit provided by local law. Siemens Bangladesh filed a motion to dismiss the charges in October 2009. The court stayed its proceedings in November 2009.

135 D. Consolidated Financial Statements 239 E. Additional Information
140 D.5 Consolidated Statements of Changes in Equity 142 D.6 Notes to Consolidated Financial Statements 232 D.7 Supervisory Board and Managing Board
136 D.1 Consolidated Statements of Income 137 D.2 Consolidated Statements of Comprehensive Income 138 D.3 Consolidated Statements of Financial Position 139 D.4 Consolidated Statements of Cash Flow
193
As previously reported, in December 2009, the ACC sent a re-quest for information to Siemens Bangladesh related to tele-communications projects of Siemens’ former Communications (Com) Group undertaken prior to calendar 2007. In January 2010, Siemens Bangladesh was informed that in a related move the Anti Money Laundering Department of the Central Bank of Bangladesh is conducting a special investigation into certain accounts of Siemens Bangladesh and of former em-ployees of Siemens Bangladesh in connection with transac-tions for Com projects undertaken in the period from calendar 2002 to 2006. In February 2010 and June 2012, the ACC sent requests for additional information.
As previously reported, in November 2009 and in February 2010, a subsidiary of Siemens AG voluntarily self-reported pos-sible violations of South African anti-corruption regulations in the period before calendar 2007 to the responsible South Afri-can authorities. The authorities have requested further docu-mentation. Siemens is cooperating with the authorities.
As previously reported, in June 2010, the Frankfurt public pros-ecutor searched premises of Siemens in Germany in response to allegations of questionable payments relating to an Infra-structure & Cities project in Thailand. Siemens is cooperating with the authority.
As previously reported, in August 2010, the Inter-American Development Bank (IADB) issued a notice of administrative proceedings against, among others, Siemens IT Solutions and Services Argentina alleging fraudulent misstatements and an-titrust violations in connection with a public invitation to ten-der for a project in the province of Cordoba, Argentina, in cal-endar 2003. Siemens is cooperating with the IADB.
As previously reported, in August 2010, the IADB issued a no-tice of administrative proceedings against, among others, Siemens Venezuela alleging fraudulent misstatements and public corruption in connection with a public invitation to ten-der for healthcare projects in the Venezuelan provinces of Anzoategui and Merida in calendar 2003. Siemens is cooperat-ing with the IADB.
The Company remains subject to corruption-related investiga-tions in several jurisdictions around the world. As a result, ad-ditional criminal or civil sanctions could be brought against the Company itself or against certain of its employees in con-nection with possible violations of law. In addition, the scope of pending investigations may be expanded and new investi-
gations commenced in connection with allegations of bribery or other illegal acts. The Company ’s operating activities, finan-cial results and reputation may also be negatively affected, particularly as a result of penalties, fines, disgorgements, compensatory damages, third-party litigation, including with competitors, the formal or informal exclusion from public invi-tations to tender, or the loss of business licenses or permits. Additional expenses and provisions, which could be material, may need to be recorded in the future for penalties, fines, dam-ages or other charges in connection with the investigations.
Civil litigationAs previously reported, Siemens AG reached a settlement with nine out of eleven former members of the Managing and Supervisory Board in December 2009. The settlement relates to claims of breaches of organizational and supervisory duties in view of the accusations of illegal business practices that occurred in the course of international business transactions in calendar 2003 to 2006 and the resulting financial burdens for the Company. The Annual Shareholders’ Meeting approved all nine settlements between the Company and the former members of the Managing and Supervisory Board in January 2010. The shareholders also approved a settlement agreement between the Company and its directors and officers insurers regarding claims in connection with the D&O insurance of up to €100 million. Siemens recorded €96 million gains, net of costs, from the D&O insurance and the nine settlements. In January 2010, Siemens AG filed a lawsuit with the Munich District Court I against the two former board members who were not willing to settle, Thomas Ganswindt and Heinz-Joachim Neubürger, which is currently pending. Siemens AG and Mr. Ganswindt are in discussions to resolve the matter.
As previously reported, in June 2008, the Republic of Iraq filed an action requesting unspecified damages against 93 named defendants with the United States District Court for the South-ern District of New York on the basis of findings made in the “Report of the Independent Inquiry Committee into the United Nations Oil-for-Food Programme.” Siemens S.A.S. France, Siemens Sanayi ve Ticaret A.S., Turkey, and OSRAM Middle East FZE, Dubai, are among the 93 named defendants. Process was served upon all three Siemens subsidiaries. The three Siemens subsidiaries will defend themselves against the action.

1 A. To our Shareholders 49 C. Combined Management Report 21 B. Corporate Governance194
ANTITRUST PROCEEDINgSAs previously reported, in February 2007, the European Com-mission launched an investigation into possible antitrust vio-lations involving European producers of power transformers, in-cluding Siemens AG and VA Technologie AG, Austria (VA Tech), which Siemens acquired in July 2005. The German Antitrust Authority (Bundeskartellamt) has become involved in the pro-ceeding and is responsible for investigating those allegations that relate to the German market. Power transformers are elec-trical equipment used as major components in electric trans-mission systems in order to adapt voltages. In October 2009, the European Commission imposed fines totaling €68 million on seven companies with regard to a territorial market sharing agreement related to Japan and Europe. Siemens was not fined because it had voluntarily disclosed this aspect of the case to the authorities. The German Antitrust Authority continued its investigation with regard to the German market. In September 2012, the German Antitrust Authority and the Company ended the legal proceeding by entering into a settlement agreement. Siemens agreed to pay a fine in the single-digit € million range.
As previously reported, in April 2007, Siemens AG and former VA Tech companies filed actions before the European Court of First Instance in Luxemburg against the decisions of the Euro-pean Commission dated January 24, 2007, to fine Siemens and former VA Tech companies for alleged antitrust violations in the European Market of high-voltage gas-insulated switchgear between calendar 1988 and 2004. Gas-insulated switchgear is electrical equipment used as a major component for power substations. The fine imposed on Siemens AG amounted to €396.6 million and was paid by the Company in calendar 2007. The fine imposed on former VA Tech companies, which Siemens AG acquired in July 2005, amounted to €22.1 million. In addition, former VA Tech companies were declared jointly li-able with Schneider Electric for a separate fine of €4.5 million. In March 2011, the European Court of First Instance dismissed the case regarding the fine imposed on Siemens AG and re-cal-culated the fines for the former VA Tech companies. Former VA Tech companies were declared jointly liable with Schneider Electric for a fine of €8.1 million. Siemens AG and former VA Tech companies appealed the decision in May 2011.
In addition to these proceedings, authorities in Brazil, the Czech Republic and Slovakia are conducting investigations in-to comparable possible antitrust violations. In October 2010, the High Court of New Zealand dismissed corresponding charges against Siemens.
As previously reported, in September 2011, the Israeli Antitrust Authority requested Siemens to present its legal position regarding an alleged anti-competitive arrangement between
April 1988 and April 2004 in the field of gas-insulated switch-gear. Siemens is cooperating with the authority.
In connection with the January 24, 2007 decision of the Euro-pean Commission regarding alleged antitrust violations in the high-voltage gas-insulated switchgear market, claims are be-ing made against Siemens. Among others, a claim was filed by National Grid Electricity Transmission Plc. (National Grid) with the High Court of England and Wales in November 2008. Twen-ty-one companies have been named as defendants, including Siemens AG and various of its subsidiaries. National Grid origi-nally asserted claims in the aggregate amount of approximate-ly £249 million for damages and compound interest. In Novem-ber 2012, National Grid increased the aggregate amount to £364 million due to accrued compound interest. Siemens be-lieves National Grid’s claim to be without merit. As discussed, the European Commission’s decision has been appealed to the European Court of First Instance. In June 2009, the High Court granted a stay of the proceedings pending before it. In June 2009, the Siemens defendants filed their answers to the com-plaint and requested National Grid’s claim to be rejected. A case management conference was held in November 2012. The High Court of England and Wales lifted the stay of the proceed-ings granted in June 2009 and decided on the scope of further discovery and set a time schedule leading up to a court session expected to be held in 2014.
As previously reported, in November 2010, the Greek Competi-tion Authority searched the premises of Siemens S.A. in Athens in response to allegations of anti-competitive practices in the field of telecommunication and security. Siemens is cooperat-ing with the authority.
As previously reported, in December 2010 and in March 2011, the Turkish Antitrust Authority searched the premises of sev-eral diagnostic companies including, among others, Siemens Healthcare Diagnostik Ticaret Limited Sirketi in Turkey, in re-sponse to allegations of anti-competitive agreements. Siemens cooperated with the authority. In May 2012, the Turkish Anti-trust Authority decided that the law has not been violated, and discontinued the proceedings.
As previously reported, the Italian Antitrust Authority searched the premises of several healthcare companies, among others those of Siemens Healthcare Diagnostics S.r.l. and Siemens S.p.A. in February 2010. The investigation addresses allega-tions of anti-competitive agreements in relation to a tender of the procurement entity for the public healthcare sector in the region of Campania for the supply of medical equipment in calendar 2009. In May 2011, the Italian Antitrust Authority sent a Statement of Objections to the companies under investiga-

135 D. Consolidated Financial Statements 239 E. Additional Information
140 D.5 Consolidated Statements of Changes in Equity 142 D.6 Notes to Consolidated Financial Statements 232 D.7 Supervisory Board and Managing Board
136 D.1 Consolidated Statements of Income 137 D.2 Consolidated Statements of Comprehensive Income 138 D.3 Consolidated Statements of Financial Position 139 D.4 Consolidated Statements of Cash Flow
195
tion which confirmed that the proceedings against Siemens Healthcare Diagnostics S.r.l. were closed, but accused Siemens S.p.A. of having participated in an anti-competitive arrange-ment. In August 2011, the Italian Antitrust Authority fined sev-eral companies, including Siemens S.p.A. for alleged anti-com-petitive behavior. The fine imposed on Siemens S.p.A. amounts to €1.1 million. The company appealed the decision. In April 2012, the Regional Administrative Court overturned the deci-sion of the Italian Antitrust Authority. In November 2012, the Italian Antitrust Authority appealed the decision of the Region-al Administrative Court.
As previously reported, in September 2011, the Competition Commission of Pakistan requested Siemens Pakistan Engineer-ing Co. Ltd., Pakistan (Siemens Pakistan), to present its legal position regarding an alleged anti-competitive arrangement since calendar 2007 in the field of transformers and air-insu-lated switchgears. Siemens cooperated with the authority. In December 2011, Siemens Pakistan filed a leniency applica-tion. In April 2012, the Competition Commission of Pakistan ac-cepted the leniency application and granted Siemens Pakistan a 100% penalty reduction for the alleged behavior.
As previously reported, in October 2011, the local Antitrust Authority in Rovno, Ukraine, notified DP Siemens Ukraine (Siemens Ukraine) of an investigation into anti-competitive practices in connection with a delivery of medical equipment to a public hospital in calendar 2010. Siemens cooperated with the authority. The authority imposed a fine in an amount equiv-alent to €4,000. Siemens Ukraine did not appeal the decision.
As previously reported, in June 2007, the Turkish Antitrust Agency confirmed its earlier decision to impose a fine in an amount equivalent to €6 million on Siemens Sanayi ve Ticaret A.S., Turkey, based on alleged antitrust violations in the traffic lights market. Siemens Sanayi ve Ticaret A.S. has appealed this decision and this appeal is still pending.
In May 2012, the Brazilian Anti Trust Authority notified Siemens Ltda., Brazil of an investigation into anti-trust behavior in the field of air-insulated switchgear and other products from calen-dar 1997 to 2006. Siemens is cooperating with the authorities.
OTHER PROCEEDINgSAs previously reported, Siemens AG is a member of a supplier consortium that has been contracted to construct the nuclear power plant “Olkiluoto 3” in Finland for Teollisuuden Voima Oyj (TVO) on a turnkey basis. Siemens AG’s share of the consider-ation to be paid to the supplier consortium under the contract is approximately 27%. The other member of the supplier con-
sortium is a further consortium consisting of Areva NP S.A.S. and its wholly-owned subsidiary, Areva NP GmbH. The agreed completion date for the nuclear power plant was April 30, 2009. Completion of the power plant has been delayed for rea-sons which are in dispute. In December 2011, the supplier con-sortium informed TVO that the completion of the plant is ex-pected in August 2014. The supplier consortium and TVO cur-rently assess potential further slippage in the schedule. The fi-nal phases of the plant completion require the full cooperation of all parties involved. In December 2008, the supplier consor-tium filed a request for arbitration against TVO demanding an extension of the construction time, additional compensation, milestone payments, damages and interest. In June 2011, the supplier consortium increased its monetary claim to €1.94 bil-lion (and has not updated it since then). TVO rejected the claims and made counterclaims against the supplier consor-tium consisting primarily of damages due to the delay. In June 2012, the arbitral tribunal rendered a partial award ordering the release of withheld milestone payments to the supplier consor-tium of approximately €101 million plus interest. As of Septem-ber 2012, TVO’s alleged counterclaims amounted to €1.59 billion based on a delay of up to 56 months. Based on a completion in August 2014, TVO estimates that its counterclaims amount to €1.77 billion. The further delay of more than 56 months (beyond December 2013) as well as the potential materialization of fur-ther schedule uncertainties in the completion of the plant could lead TVO to further increase its counterclaims. The arbi-tration proceedings may continue for several years.
As previously reported, Siemens AG terminated its joint ven-ture with Areva S.A. (Areva) in January 2009. Thereafter Siemens AG entered into negotiations with the State Atomic Energy Corporation Rosatom (Rosatom) with a view to forming a new partnership active in the construction of nuclear power plants, in which it would be a minority shareholder. In April 2009, Areva filed a request for arbitration with the ICC against Siemens AG. Areva sought an order enjoining Siemens AG from pursuing such negotiations with Rosatom, a declaration that Siemens AG is in material breach of its contractual obliga-tions and a reduction of the price payable to Siemens AG for its stake in the Areva NP S.A.S. joint venture. The final award of the arbitral tribunal was notified in May 2011. According to this award, Siemens had to pay Areva liquidated damages of €648 million plus interest. Pursuant to the arbitral award, the dis-puted non-compete obligation was reduced to four years (end-ing in September 2013).
As previously reported, Siemens is involved in a power plant construction project in the United States in which one of the other parties to the project filed an arbitration proceeding in

1 A. To our Shareholders 49 C. Combined Management Report 21 B. Corporate Governance196
June 2011 asserting material claims against certain other par-ties to the project. While no claims are being asserted against Siemens in the arbitration at this time, it is possible that such claims against Siemens may follow as matters progress.
As previously reported, OSRAM is party to a number of patent lawsuits involving Samsung group companies and LG group companies. On the one hand, OSRAM has sued Samsung group companies and / or LG group companies and some of the customers of these companies in the U.S., South Korea, Germany, China and Japan for patent infringements, and is re-questing injunctions against unauthorized use of the asserted patents and, in some cases, import bans and compensation. In addition, OSRAM has commenced patent invalidation lawsuits relating to LG patents and Samsung patents on Light Emitting Diode (LED) technology in South Korea and relating to LG pat-ents on LED technology in China, Germany and the US. Sam-sung group companies and/or LG group companies have, on the other hand, initiated patent invalidation lawsuits relating to OSRAM patents on LED technology, in particular white LEDs, in South Korea, Germany, the US, China and Japan. In addition, Samsung group companies and/or LG group companies have filed patent infringement lawsuits in various jurisdictions, such as the U.S., South Korea, Germany and China, requesting injunctions against unauthorized use of the asserted patents and, in some cases, import bans and compensation from OSRAM. The patent infringement lawsuits initiated by LG group companies and Samsung group companies partly in-volve direct and indirect customers of OSRAM. In August 2012, OSRAM and Samsung entered into a settlement agreement and terminated the lawsuits pending between them. In Octo-ber 2012 OSRAM and LG entered into a settlement agreement and are in the process of terminating the lawsuits pending between them.
In July 2008, Hellenic Telecommunications Organization S.A. (OTE) filed a lawsuit against Siemens AG with the district court of Munich, Germany, seeking to compel Siemens AG to dis-close the outcome of its internal investigations with respect to OTE. OTE seeks to obtain information with respect to allega-tions of undue influence and / or acts of bribery in connection with contracts concluded between Siemens AG and OTE from calendar 1992 to 2006. In May 2009, OTE was granted access to the public prosecutor’s files in Greece. At the end of July 2010, OTE expanded its claim and requested payment of damages by Siemens AG of at least €57.07 million to OTE for alleged bribery payments to OTE-employees. While Siemens AG continues to defend itself against the expanded claim, Siemens AG and OTE remain in discussions to resolve the matter.
As previously reported, Siemens A.E. entered into a subcon-tract agreement with Science Applications International Cor-poration, Delaware, USA, (SAIC) in May of 2003 to deliver and install a significant portion of a security surveillance system (the C4I project) in advance of the Olympic Games in Athens, Greece. Siemens A.E. fulfilled its obligations pursuant to the subcontract agreement. Nonetheless, the Greek government claimed errors related to the C4I-System and withheld amounts for abatement in a double-digit million € range. Furthermore, the Greek government withheld final payment in a double-dig-it million € range, claiming that the system had not been final-ly accepted. Although Siemens A.E. is not a contractual party of the Greek government, under Siemens A.E’s subcontract agreement with SAIC non-payment by the Greek government also has an economic effect on Siemens A.E. SAIC has filed for arbitration contesting all the Greek government’s claims and its ability to withhold payments. The Greek State filed, inter alia, a motion to stay the arbitration in view of the ongoing criminal investigations conducted by the Greek public prose-cutor. This motion was denied by the Arbitral Tribunal in July 2011. Resolution of this dispute has been complicated by brib-ery and fraud allegations (either made in public or within the arbitration proceedings) against Siemens A.E. in Greece, which have resulted in extensive negative media coverage concern-ing the C4I system.
As previously reported, Russian authorities are conducting widespread investigations regarding possible fraudulent activ-ities of resellers and governmental officials relating to procure-ment of medical equipment in the public sector. As is the case with other providers of medical equipment, OOO Siemens, Russia, has received numerous information requests and in-quiries were made on-site by the authorities regarding tenders in the public healthcare sector. OOO Siemens is cooperating in the ongoing investigations which also relate to certain individ-ual employees.
As previously reported, in April 2009, the Defense Criminal In-vestigative Service of the U.S. Department of Defense conduct-ed a search at the premises of Siemens Medical Solutions USA, Inc., United States, in Malvern, Pennsylvania, in connection with an investigation relating to a Siemens contract with the U.S. Department of Defense for the provision of medical equip-ment.
As previously reported, in June 2009, Siemens AG and two of its subsidiaries voluntarily self-reported, among others, possi-ble violations of U.S. Export Administration Regulations to the responsible U.S. authorities. On October 4, 2011, the U.S.

135 D. Consolidated Financial Statements 239 E. Additional Information
140 D.5 Consolidated Statements of Changes in Equity 142 D.6 Notes to Consolidated Financial Statements 232 D.7 Supervisory Board and Managing Board
136 D.1 Consolidated Statements of Income 137 D.2 Consolidated Statements of Comprehensive Income 138 D.3 Consolidated Statements of Financial Position 139 D.4 Consolidated Statements of Cash Flow
197
Department of Commerce notified Siemens that it closed its case without taking further action. On October 5, 2011, the U.S. Department of the Treasury notified Siemens that it opened an investigation. Siemens is cooperating with the authorities.
As previously reported, since July 2009 the EU Anti-Fraud Office OLAF, its Romanian equivalent DELAF and the Romanian pub-lic prosecutor DNA have been investigating allegations of fraud in connection with the 2007 award of a contract to FORTE Business Services (later Siemens IT Solutions and Ser-vices Romania) to modernize the IT infrastructure of the Ro-manian judiciary. In September 2010, OLAF put the matter on monitoring status and decided not to open formal proceed-ings. DELAF referred the matter to DNA and closed its investi-gations. After the sale of Siemens’ global IT Solutions and Ser-vices business to AtoS, Siemens Romania is no longer directly involved in the DNA investigation. In September 2012, the Ro-manian Ministry of Finance filed civil claims in the amount of €12 million against AtoS Romania within the framework of the criminal proceedings. AtoS Romania could hold Siemens AG contractually liable if it were required to make this payment.
In December 2011, the United States Attorney ’s Office for the Northern District of New York served a Grand Jury subpoena on Siemens that seeks records of consulting payments for business conducted by the Building Technologies business unit in New York State over the period from January 1, 2000 through September 30, 2011. Siemens is cooperating with the authority.
In February 2012, the United States Attorney‘s Office for the Eastern District of New York served a subpoena on Siemens Healthcare Diagnostics Inc., United States, for information re-lating to a diagnostics process. Siemens is cooperating with the authority.
For legal proceedings information required under IAS 37, Provi-sions, Contingent Liabilities and Contingent Assets, is not dis-closed, if the Company concludes that the disclosure can be expected to seriously prejudice the outcome of the litigation.
In addition to the investigations and legal proceedings de-scribed above, Siemens AG and its subsidiaries have been named as defendants in various other legal actions and pro-ceedings arising in connection with their activities as a global diversified group. Some of these pending proceedings have been previously disclosed. Some of the legal actions include claims or potential claims for punitive damages or claims for indeterminate amounts of damages. Siemens is from time to
time also involved in regulatory investigations beyond those described above. Siemens is cooperating with the relevant au-thorities in several jurisdictions and, where appropriate, con-ducts internal investigations regarding potential wrongdoing with the assistance of in-house and external counsel. Given the number of legal actions and other proceedings to which Siemens is subject, some may result in adverse decisions. Siemens contests actions and proceedings when it considers it appropriate. In view of the inherent difficulty of predicting the outcome of such matters, particularly in cases in which claim-ants seek indeterminate damages, Siemens may not be able to predict what the eventual loss or range of loss related to such matters will be. The final resolution of the matters discussed in this paragraph could have a material effect on Siemens’ busi-ness, results of operations and financial condition for any re-porting period in which an adverse decision is rendered. How-ever, Siemens currently does not expect its business, results of operations and financial condition to be materially affected by the additional legal matters not separately discussed in this paragraph.
NOTE 30 Additional disclosures on financial instruments
The following table presents the carrying amounts of each category of financial assets and financial liabilities:
September 30,
(in millions of €) 2012 2011
Financial assets:
Loans and receivables 28,439 25,865
Cash and cash equivalents 10,891 12,468
Derivatives designated in a hedge accounting relationship 1,918 1,707
Financial assets held for trading 1,410 1,315
Available-for-sale financial assets 1,546 1,191
44,203 42,546
Financial liabilities:
Financial liabilities measured at amortized cost 30,160 27,083
Financial liabilities held for trading 920 1,350
Derivatives designated in a hedge accounting relationship 204 255
31,284 28,688

1 A. To our Shareholders 49 C. Combined Management Report 21 B. Corporate Governance198
The following table presents the fair values and carrying amounts of financial assets and financial liabilities measured at cost or amortized cost:
Cash and cash equivalents includes €199 million and €148 mil-lion as of September 30, 2012 and 2011, respectively, which are not available for use by Siemens mainly due to minimum re-serve requirements with banks.
The fair values of cash and cash equivalents, trade and other receivables and trade payables with a remaining term of up to twelve months, other current financial liabilities and borrow-ings under revolving credit facilities approximate their carry-ing amount, mainly due to the short-term maturities of these instruments.
Fixed-rate and variable-rate receivables with a remaining term of more than twelve months, including receivables from finance leases, are evaluated by the Company based on parameters
such as interest rates, specific country risk factors, individual creditworthiness of the customer, and the risk characteristics of the financed project. Based on this evaluation, allowances for these receivables are taken into account. As of September 30, 2012 and 2011, the carrying amounts of such receivables, net of allowances, approximate their fair values.
The fair value of quoted notes and bonds is based on price quotations at the period-end date. The fair value of unquoted notes and bonds, loans from banks and other financial indebt-edness, obligations under finance leases as well as other non-current financial liabilities is estimated by discounting future cash flows using rates currently available for debt of similar terms and remaining maturities.
September 30, 2012 September 30, 2011
Fair valueCarrying amount Fair value
Carrying amount(in millions of €)
Financial assets measured at cost or amortized cost
Trade and other receivables 1 13,344 13,344 13,147 13,147
Receivables from finance leases 5,059 5,059 4,742 4,742
Cash and cash equivalents 10,891 10,891 12,468 12,468
Other non-derivative financial assets 10,036 10,036 7,976 7,976
Available-for-sale financial assets 2 – 293 – 252
Financial liabilities measured at cost or amortized cost
Notes and bonds 18,460 18,212 15,007 15,146
Trade payables 3 8,036 8,036 7,677 7,677
Loans from banks and other financial indebtedness 2,340 2,334 2,680 2,649
Obligation under finance leases 202 161 194 145
Other non-derivative financial liabilities 1,418 1,418 1,466 1,466
1 Consists of (1) €13,310 million and €13,088 million trade receivables from the sale of goods and services in fiscal 2012 and 2011, respectively, as well as (2) €34 million and €59 million receivables included in line item Other financial assets in fiscal 2012 and 2011, respectively. As of September 30, 2012 and 2011, trade receivables from the sale of goods and services of €685 million and €595 million have a remaining term of more than twelve months.
2 Consists of equity instruments classified as available-for-sale, for which a fair value could not be reliably measured and which are therefore recognized at cost.
3 As of September 30, 2012 and 2011, trade payables of €128 million and €115 million have a remaining term of more than twelve months.

135 D. Consolidated Financial Statements 239 E. Additional Information
140 D.5 Consolidated Statements of Changes in Equity 142 D.6 Notes to Consolidated Financial Statements 232 D.7 Supervisory Board and Managing Board
136 D.1 Consolidated Statements of Income 137 D.2 Consolidated Statements of Comprehensive Income 138 D.3 Consolidated Statements of Financial Position 139 D.4 Consolidated Statements of Cash Flow
199
Financial instruments categorized as financial assets and fi-nancial liabilities measured at fair value are presented in the following table:
September 30,
(in millions of €) 2012 2011
Financial assets measured at fair value
Available-for-sale financial assets 1,252 939
Derivative financial instruments 3,328 3,022
Not designated in a hedge accounting relationship 1,202 1,148
In connection with fair value hedges 1,783 1,575
Foreign currency exchange derivatives 22 3
Interest rate derivatives 1,761 1,572
In connection with cash flow hedges 135 132
Foreign currency exchange derivatives 132 132
Commodity derivatives 3 –
Embedded derivatives 208 167
4,580 3,961
Financial liabilities measured at fair value
Derivative financial instruments 1,125 1,605
Not designated in a hedge accounting relationship 823 1,253
In connection with fair value hedges 11 8
Foreign currency exchange derivatives 2 8
Interest rate derivatives 9 –
In connection with cash flow hedges 193 247
Foreign currency exchange derivatives 185 207
Interest rate derivatives 8 13
Commodity derivatives – 27
Embedded derivatives 98 97
1,125 1,605
Fair values of available-for-sale financial assets are derived from quoted market prices in active markets.
The Company limits default risks resulting from derivative fi-nancial instruments by a careful counterparty selection. Deriv-ative financial instruments are generally transacted with finan-cial institutions with investment grade credit ratings. The fair valuation of derivative financial instruments at Siemens incor-porates all factors that market participants would consider, in-cluding the counterparties’ credit risks. The exact calculation of fair values of derivative financial instruments depends on the specific type of instrument:
Derivative interest rate contracts – The fair values of derivative interest rate contracts (e.g. interest rate swap agreements) are estimated by discounting expected future cash flows using current market interest rates and yield curves over the remain-ing term of the instrument. Interest rate futures and interest rate options are valued on the basis of quoted market prices when available. If quoted market prices are not available, inter-est rate options are valued based on option pricing models.
Derivative currency contracts – The fair value of foreign cur-rency exchange contracts is based on forward exchange rates. Currency options are valued on the basis of quoted market prices or on estimates based on option pricing models.
Derivative commodity contracts – The fair value of commodity swaps is based on forward commodity prices. Commodity options are valued on the basis of quoted market prices or on estimates based on option pricing models.
In determining the fair values of the derivative financial in-struments, no compensating effects from underlying transac-tions (e.g. firm commitments and forecast transactions) are taken into consideration.
The following table allocates financial assets and financial liabilities measured at fair value to the three levels of the fair value hierarchy.
September 30, 2012
(in millions of €) Level 1 Level 2 Level 3 Total
Financial assets measured at fair value
Available-for-sale financial assets 1,252 – – 1,252
Derivative financial instruments – 3,328 – 3,328
Total 1,252 3,328 – 4,580
Financial liabilities measured at fair value
Derivative financial instruments – 1,125 – 1,125
September 30, 2011
Level 1 Level 2 Level 3 Total
Financial assets measured at fair value
Available-for-sale financial assets 939 – – 939
Derivative financial instruments – 3,022 – 3,022
Total 939 3,022 – 3,961
Financial liabilities measured at fair value
Derivative financial instruments 8 1,597 – 1,605

1 A. To our Shareholders 49 C. Combined Management Report 21 B. Corporate Governance200
The levels of the fair value hierarchy and its application to our financial assets and financial liabilities are described below:
Level 1: quoted prices in active markets for identical as-sets or liabilities;
Level 2: inputs other than quoted prices that are observ-able for the asset or liability, either directly (i.e. as prices) or indirectly (i.e. derived from prices); and
Level 3: inputs for assets or liabilities, not based on observ-able market data.
Net gains (losses) of financial instruments are as follows:
Year ended September 30,
(in millions of €) 2012 2011
Cash and cash equivalents 11 –
Available-for-sale financial assets 83 1,522
Loans and receivables (228) (100)
Financial liabilities measured at amortized cost (257) (26)
Financial assets and financial liabilities held for trading (189) (95)
Net gains (losses) in fiscal 2012 and 2011 on available-for-sale financial assets include net gains on derecognition as well as impairment losses. In fiscal 2011, net gains on derecognition mainly comprise €1,520 million disposal gain related to the ter-mination of the Areva NP S.A.S. joint venture. For the amount of unrealized gains (losses) on available-for-sale financial as-sets recognized directly in equity and the amount removed from equity and recognized in net income in the respective fis-cal years, see line item Other Comprehensive Income, net of tax in NOTE 26 EqUITY.
Net losses on loans and receivables contain changes in valua-tion allowances, gains or losses on derecognition as well as re-coveries of amounts previously written-off. Net gains (losses) in fiscal 2012 and 2011 on financial liabilities measured at am-ortized cost are comprised of gains (losses) from derecogni-tion and the ineffective portion of fair value hedges. Net gains (losses) in fiscal 2012 and 2011 on financial assets and financial liabilities held for trading consist of changes in the fair value of derivative financial instruments, including interest income and expense, for which hedge accounting is not applied.
The amounts presented include foreign currency gains and losses from the realization and valuation of the financial as-sets and liabilities mentioned above.
COLLATERALSiemens holds collateral that can be sold or re-pledged in ab-sence of default by the owner of the collateral mainly resulting from reverse repurchase agreements. As of September 30, 2012 and 2011 the fair value of the collateral held amounted to €500 million and €421 million, respectively. As of September 30, 2012 and 2011, the right to sell or re-pledge the collateral has not been exercised. As of September 30, 2012 and 2011, the carry-ing amount of financial assets Siemens has pledged as collater-al amounted to €500 million and €565 million, respectively.
NOTE 31 Derivative financial instruments and hedging activities
As part of the Company ’s risk management program, a variety of derivative financial instruments is used to reduce risks resulting primarily from fluctuations in foreign currency ex-change rates, interest rates and commodity prices.
The fair values of each type of derivative financial instru-ments recorded as financial assets or financial liabilities are as follows:
September 30, 2012 September 30, 2011
(in millions of €) Asset Liability Asset Liability
Foreign currency exchange contracts 343 325 390 644
Interest rate swaps and combined interest/currency swaps 2,577 534 2,161 423
Commodity swaps 36 27 62 155
Embedded derivatives 208 98 167 97
Options 164 141 242 286
3,328 1,125 3,022 1,605
FOREIgN CURRENCY ExCHANgE RATE RISk MANAgEMENT
NOTE 32 FINANCIAL RISk MANAgEMENT
Derivative financial instruments not designated in a hedging relationshipThe Company manages its risks associated with fluctuations in foreign currency denominated receivables, payables, debt, firm commitments and forecast transactions primarily through a Company-wide portfolio approach. Under this approach the Company-wide risks are concentrated centrally, and various derivative financial instruments, primarily foreign currency ex-change contracts, foreign currency swaps and options, are uti-lized to minimize such risks. Such a strategy does not qualify

135 D. Consolidated Financial Statements 239 E. Additional Information
140 D.5 Consolidated Statements of Changes in Equity 142 D.6 Notes to Consolidated Financial Statements 232 D.7 Supervisory Board and Managing Board
136 D.1 Consolidated Statements of Income 137 D.2 Consolidated Statements of Comprehensive Income 138 D.3 Consolidated Statements of Financial Position 139 D.4 Consolidated Statements of Cash Flow
201
for hedge accounting treatment. Accordingly, all such deriva-tive financial instruments are recorded at fair value on the Consolidated Statements of Financial Position, either in line items Other current financial assets (liabilities) or line items Other financial assets (liabilities); changes in fair values are charged to net income (loss).
The Company also has foreign currency derivatives, which are embedded in certain sale and purchase contracts denominated in a currency that is neither the functional currency of the sub-stantial parties to the contract nor a currency which is com-monly used in the economic environment in which the con-tract takes place. Gains (losses) relating to such embedded foreign currency derivatives are reported in line item Cost of goods sold and services rendered in the Consolidated State-ments of Income.
Hedging activitiesThe Company ’s operating units apply hedge accounting for certain significant forecast transactions and firm commit-ments denominated in foreign currencies. Particularly, the Company has entered into foreign currency exchange con-tracts to reduce the risk of variability of future cash flows re-sulting from forecast sales and purchases as well as firm com-mitments. This risk results mainly from contracts denominat-ed in US$ both from Siemens’ business units entering into long-term contracts, e.g. project business, and from the stan-dard product business.
Cash flow hedges – As of September 30, 2012 and 2011, the ineffective portion of cash flow hedges is not significant indi-vidually or in aggregate.
Periods in which the hedged forecast transactions or the firm commitments denominated in foreign currency are expected to impact profit or loss:
Year ended September 30,
2013 20142015 to
20172018 and
thereafter(in millions of €)
Expected gain (loss) to be reclassified from line item Other comprehensive income, net of tax into revenue or cost of goods sold and services rendered (14) (21) (35) (6)
Fair value hedges – As of September 30, 2012 and 2011, the Company hedged firm commitments using foreign currency exchange contracts that were designated as hedging instru-ments in foreign currency fair value hedges of future sales re-lated primarily to the Company ’s project business and, to a lesser extent, future purchases. Financial assets (liabilities) re-sulting from those hedging transactions as well as resulting gains and (losses) from changes in fair values of foreign cur-rency exchange contracts were not significant individually or in aggregate.
INTEREST RATE RISk MANAgEMENTInterest rate risk arises from the sensitivity of financial assets and liabilities to changes in market interest rates. The Compa-ny seeks to mitigate that risk by entering into interest rate de-rivatives such as interest rate swaps, options, interest rate fu-tures and forward rate agreements.
Derivative financial instruments not designated in a hedging relationshipFor the interest rate risk management relating to the Group ex-cluding SFS business, derivative financial instruments are used under a portfolio-based approach to manage interest risk actively relative to a benchmark. The interest rate manage-ment relating to the SFS business remains to be managed sep-arately, considering the term structure of SFS’ financial assets and liabilities on a portfolio basis. Both approaches do not qualify for hedge accounting treatment. Accordingly, all inter-est rate derivatives held in this relation are recorded at fair val-ue, either in line items Other current financial assets (liabili-ties) or in line items Other financial assets (liabilities), and changes in the fair values are charged to line item Other finan-cial income (expense), net. Net cash receipts and payments re-lating to interest rate swaps used in offsetting relationships are also recorded in line item Other financial income (ex-pense), net.
Fair value hedges of fixed-rate debt obligationsUnder the interest rate swap agreements outstanding during the years ended September 30, 2012 and 2011, the Company has agreed to pay a variable rate of interest multiplied by a no-tional principle amount, and receives in return an amount equal to a specified fixed rate of interest multiplied by the same notional principal amount. These interest rate swap agreements offset an impact of future changes in interest rates on the fair value of the underlying fixed-rate debt obligations. The interest rate swap contracts are recorded at fair value in the Company ’s Consolidated Statements of Financial Position and the related portion of fixed-rate debt being hedged is re-corded at an amount equal to the sum of its carrying amount plus an adjustment representing the change in fair value of the debt obligations attributable to the interest rate risk being

1 A. To our Shareholders 49 C. Combined Management Report 21 B. Corporate Governance202
hedged. Changes in the fair value of interest rate swap con-tracts and the offsetting changes in the adjusted carrying amount of the related portion of fixed-rate debt being hedged are recognized in line item Other financial income (expense), net in the Consolidated Statements of Income. Adjustments in the carrying amount of the debt obligations resulted in a gain (loss) of €(227) million and €184 million in fiscal 2012 and 2011, respectively. During the same period, the related swap agree-ments resulted in a gain (loss) of €233 million and €(189) mil-lion, respectively. Accordingly, the net effect recognized in line item Other financial income (expense), net, representing the ineffective portion of the hedging relationship, amounts to €7 million and €(5) million in fiscal 2012 and 2011, respectively. Net cash receipts and payments relating to such interest rate swap agreements are recorded as interest expense.
The Company had interest rate swap contracts to pay variable rates of interest of an average of 0.5% and 1.3% as of Septem-ber 30, 2012 and 2011, respectively and received fixed rates of interest (average rate of 5.1% and 5.3% as of September 30, 2012 and 2011, respectively). The notional amount of indebted-ness hedged as of September 30, 2012 and 2011 was €11,253 million and €12,584 million, respectively. This changed 66% and 91% of the Company ’s underlying notes and bonds from fixed interest rates into variable interest rates as of September 30, 2012 and 2011, respectively. The notional amounts of these contracts mature at varying dates based on the maturity of the underlying hedged items. The net fair value of interest rate swap contracts (excluding accrued interest) used to hedge in-debtedness as of September 30, 2012 and 2011 was €1,586 mil-lion and €1,360 million, respectively.
Cash flow hedges of a variable-rate term loanAs of September 30, 2012 and 2011, the Company applied cash flow hedge accounting for 50% of a variable-rate US$ 1 billion term loan. To benefit from the low interest rates in the U.S., the Company entered into interest rate swap agreements to pay a fixed rate of interest and to receive in return a variable rate of interest. These interest rate swap agreements offset the effect of future changes in interest payments to be made for the underlying variable-rate term loan. In fiscal 2012 and 2011, the cash flow hedges of the variable-rate term loan did not re-sult in any ineffective portion. Net cash receipts and payments relating to such interest rate swap agreements are recorded as interest expense.
Periods in which the hedged interest payments expected to impact profit or loss are:
Year ended September 30,
2013 20142015 to
20172018 and
thereafter(in millions of €)
Expected income (loss) to be reclassified from line item Other comprehensive income, net of tax into interest expense (8) (1) (2) (7)
COMMODITY PRICE RISk MANAgEMENT NOTE 32 FINANCIAL RISk MANAgEMENT
Derivative financial instruments not designated in a hedging relationshipThe Company applies a portfolio approach to manage the Com-pany-wide risks associated with fluctuations in commodity prices from firm commitments and forecast transactions by entering into commodity swaps and commodity options. Such a strategy does not qualify for hedge accounting treatment.
Cash flow hedging activitiesThe Company ’s corporate procurement applies cash flow hedge accounting for certain firm commitments to purchase copper. As of September 30, 2012 and 2011, there is no ineffec-tive portion. In fiscal 2012 and 2011, no gains (losses) were re-classified from line item Other comprehensive income, net of tax into line item Cost of goods sold and services rendered be-cause the occurrence of the related hedged forecast transac-tion was no longer probable.
It is expected that €66 million of net deferred losses in line item Other comprehensive income, net of tax will be reclassi-fied into line item Cost of goods sold and services rendered in fiscal 2013, when the consumption of the hedged commodity purchases is recognized in line item Cost of goods sold and services rendered. As of September 30, 2012 and 2011, the maximum length of time over which the Company is hedging its future commodity purchases is 99 months and 35 months, respectively.

135 D. Consolidated Financial Statements 239 E. Additional Information
140 D.5 Consolidated Statements of Changes in Equity 142 D.6 Notes to Consolidated Financial Statements 232 D.7 Supervisory Board and Managing Board
136 D.1 Consolidated Statements of Income 137 D.2 Consolidated Statements of Comprehensive Income 138 D.3 Consolidated Statements of Financial Position 139 D.4 Consolidated Statements of Cash Flow
203
NOTE 32 Financial risk management
Siemens’ financial risk management is an integral part of how to plan and execute its business strategies. Siemens’ financial risk management policy is set by the Managing Board. Siemens’ organizational and accountability structure requires each of the respective managements of Siemens Sectors, Fi-nancial Services, Cross-Sector Services, regional Clusters and Corporate Units to implement financial risk management pro-grams that are tailored to their specific industries and respon-sibilities, while being consistent with the overall policy estab-lished by the Managing Board.
Increasing market fluctuations may result in significant cash flow and earnings volatility risk for Siemens. The Company ’s operating business as well as its investment and financing ac-tivities are affected by changes in foreign exchange rates, in-terest rates, commodity prices and equity prices. In order to optimize the allocation of the financial resources across the Siemens segments and entities, as well as to secure an optimal return for its shareholders, Siemens identifies, analyzes and proactively manages the associated financial market risks. The Company seeks to manage and control these risks primarily through its regular operating and financing activities, and uses derivative financial instruments when deemed appropriate.
Within the various methodologies to analyze and manage risk, Siemens has implemented a system based on parametric vari-ance-covariance Value at Risk (VaR). The VaR methodology pro-vides a quantification of market risks based on historical vola-tilities and correlations of the different risk factors under the assumptions of the parametric variance-covariance Value at Risk model. The VaR figures are calculated based on
> historical volatilities and correlations, > a ten day holding period, and > a 99.5% confidence level
for foreign currency exchange rate risk, interest rate risk, com-modity price risk and equity price risk as discussed below.
Actual results that are included in the Consolidated Statements of Income or Consolidated Statements of Comprehensive In-come may differ substantially from VaR figures due to funda-mental conceptual differences. The Consolidated Statements of Income and Consolidated Statements of Comprehensive In-come are prepared in accordance with IFRS. The VaR figures are the output of a model with a purely financial perspective and represent the potential financial loss which will not be exceed-ed within ten days with a probability of 99.5%. The concept of VaR is used for internal management of the treasury activities.
Although VaR is an important tool for measuring market risk, the assumptions on which the model is based give rise to some limitations including the following. A ten day holding period assumes that it is possible to dispose of the underlying positions within this period. While this is considered to be a re-alistic assumption in almost all cases, it may not be valid dur-ing prolonged periods of severe market illiquidity. A 99.5% confidence level does not reflect losses that may occur beyond this level. There is a 0.5% statistical probability that losses could exceed the calculated VaR. The use of historical data as a basis for estimating the statistic behavior of the relevant mar-kets and finally determining the possible range of the future outcomes on the basis of this statistic behavior may not al-ways cover all possible scenarios, especially those of an excep-tional nature.
Any market sensitive instruments, including equity and inter-est bearing investments, that our Company ’s pension plans hold are not included in the following quantitative and qualita-tive disclosures. For additional information see NOTE 23 PEN-
SION PLANS AND SIMILAR COMMITMENTS. SFS holds a minor trading portfolio which is subject to strict limits. As of September 30, 2012, and 2011, respectively, it had a VaR close to zero. FOREIgN CURRENCY ExCHANgE RATE RISkTransaction risk and foreign currency exchange rate risk managementSiemens’ international operations expose the Company to for-eign currency exchange rate risks, particularly regarding fluc-tuations between the U.S. Dollar and the euro, in the ordinary course of business. The Company employs various strategies discussed below involving the use of derivative financial in-struments to mitigate or eliminate certain of those exposures.
Foreign currency exchange rate fluctuations may create un-wanted and unpredictable earnings and cash flow volatility. Each Siemens unit conducting business with international counterparties that leads to future cash flows denominated in a currency other than its functional currency is exposed to risks from changes in foreign currency exchange rates. Foreign currency exchange rate exposure is partly balanced by pur-chasing of goods, commodities and services in the respective currencies as well as production activities and other contribu-tions along the value chain in the local markets.
Operating units are prohibited from borrowing or investing in foreign currencies on a speculative basis. Intercompany financing or investments of operating units are preferably carried out in their functional currency or on a hedged basis.

1 A. To our Shareholders 49 C. Combined Management Report 21 B. Corporate Governance204
Siemens has established a foreign currency exchange rate risk management system that has an established track record for years. Each Siemens unit is responsible for recording, assessing, monitoring, reporting and hedging its foreign currency transac-tion exposure. The binding guideline for Siemens’ Divisions and entities provides the concept for the identification and determi-nation of a single net foreign currency position for each unit and commits the units to hedge this aggregated position within a narrow band of at least 75% but no more than 100% of their net foreign currency position. In addition, the guideline pro-vides a framework of the organizational structure necessary for foreign currency exchange rate risk management, proposes hedging strategies and defines the hedging instruments avail-able to the entities: foreign currency exchange contracts, for-eign currency put and call options and stop-loss orders. If there are no conflicting country specific regulations, hedging activi-ties of the operating units are transacted internally with Corpo-rate Treasury. Hedging transactions with external counterpar-ties in the global financial markets are carried out under these limitations by Corporate Treasury. This includes hedging instru-ments which qualify for hedge accounting.
Siemens has a Company-wide portfolio approach which gener-ates a benefit from any potential off-set of divergent cash flows in the same currency, as well as optimized transaction costs. For additional information regarding the effect of this Compa-ny-wide portfolio approach on the Consolidated Financial Statements, as well as for a discussion of hedging activities employed to mitigate or eliminate foreign currency exchange rate risks see NOTE 31 DERIvATIvE FINANCIAL INSTRUMENTS AND
HEDgINg ACTIvITIES.
The VaR relating to foreign currency exchange rates is calculat-ed by aggregating the net foreign currency positions after hedging of the entities. As of September 30, 2012 the foreign currency exchange rate risk based on historical volatilities and correlations, a ten day holding period and a confidence level of 99.5% resulted in a VaR of €9 million compared to a VaR of €23 million in the year before. Changes in euro values of future cash flows denominated in foreign currency due to volatile for-eign currency exchange rates might influence the unhedged portion of revenues, but would also affect the unhedged por-tion of cost of materials. Future changes in the foreign currency exchange rates can impact sales prices and may lead to margin changes, the extent of which is determined by the matching of foreign currency revenues and expenses.
Siemens defines foreign currency exchange rate exposure gen-erally as items of the Consolidated Statement of Financial Posi-tion in addition to firm commitments which are denominated
in foreign currencies, as well as foreign currency denominated cash inflows and cash outflows from forecast transactions for the following three months. This foreign currency exchange rate exposure is determined based on the respective function-al currencies of the exposed Siemens’ entities.
Effects of foreign currency translationMany Siemens subsidiaries are located outside the eurozone. Since the financial reporting currency of Siemens is the euro, the financial statements of these subsidiaries are translated in-to euro for the preparation of the Consolidated Financial State-ments of Siemens. To consider the effects of foreign currency translation in the risk management, the general assumption is that investments in foreign-based operations are permanent and that reinvestment is continuous. Effects from foreign cur-rency exchange rate fluctuations on the translation of net as-set amounts into euro are reflected in the Company ’s consoli-dated equity position.
INTEREST RATE RISkSiemens’ key consideration with respect to the interest rate risk management is to mitigate the risk resulting from changes in the fair value of future cash flows. Risk arises whenever inter-est terms of financial assets and liabilities are different. Siemens manages this risk using derivative financial instru-ments which allow the Company to hedge fair value changes by swapping fixed rates of interest into variable rates of inter-est. In order to optimize the Company ’s position with regard to interest income and interest expenses and to manage the over-all financial interest rate risk with respect to valuation risk af-fecting profit and loss and economic risk of changing interest rates, Corporate Treasury performs a comprehensive corporate interest rate risk management, under which the interest rate risk relating to the SFS business and to the remaining group are managed separately. For additional information see NOTE 31
DERIvATIvE FINANCIAL INSTRUMENTS AND HEDgINg ACTIvITIES.
If there are no conflicting country-specific regulations, all Siemens segments and entities generally obtain any required financing through Corporate Treasury in the form of loans or intercompany clearing accounts. The same concept is adopted for deposits of cash generated by the units.
Assuming historical volatilities and correlations, a ten day holding period and a confidence level of 99.5% the interest rate VaR was €89 million as of September 30, 2012, increasing from the comparable value of €68 million as of September 30, 2011. This interest rate risk results primarily from euro and U.S. Dollar denominated long-term fixed rate debt obligations and interest-bearing investments. The increase in VaR related

135 D. Consolidated Financial Statements 239 E. Additional Information
140 D.5 Consolidated Statements of Changes in Equity 142 D.6 Notes to Consolidated Financial Statements 232 D.7 Supervisory Board and Managing Board
136 D.1 Consolidated Statements of Income 137 D.2 Consolidated Statements of Comprehensive Income 138 D.3 Consolidated Statements of Financial Position 139 D.4 Consolidated Statements of Cash Flow
205
mainly to the sensitivity of the interest rates in connection with the issuance of US$3.0 billion and £1.0 billion bonds in fiscal 2012. For additional information see NOTE 31 DERIvA-
TIvE FINANCIAL INSTRUMENTS AND HEDgINg ACTIvITIES.
COMMODITY PRICE RISkSiemens’ production operations expose the Company to vari-ous commodity price risks in the ordinary course of business. Especially in the Sectors Industry and Energy a continuous supply of copper was necessary for the operating activities. Commodity price risk fluctuations may create unwanted and unpredictable earnings and cash flow volatility. The Company employs various strategies discussed below involving the use of derivative financial instruments to mitigate or eliminate cer-tain of those exposures.
Siemens has established a commodity price risk management system to reduce earnings and cash flow volatility. Each Siemens unit is responsible for recording, assessing, monitor-ing, reporting and hedging its risks from forecast and pending commodity purchase transactions (commodity price risk expo-sure). The binding guideline for Siemens Divisions and entities developed by the Corporate Supply Chain Management De-partment provides the concept for the identification and deter-mination of the commodity price risk exposure and commits the units to hedge it within a narrow band of 75% to 100% of the commodity price risk exposure in the product business for the current and the subsequent quarter and 95% to 100% of the commodity price risk exposure in the project business af-ter receipt of order.
The aggregated commodity price risk exposure is hedged with external counterparties through derivative financial hedging instruments by Corporate Treasury. Derivative financial hedg-ing instruments designated for hedge accounting are directly entered into with external counterparties. Additionally, Siemens applies a Company-wide portfolio approach which generates a benefit from optimizing the Company ’s position of the overall financial commodity price risk. For additional infor-mation regarding the effect of this Company-wide portfolio ap-proach on the Consolidated Financial Statements, as well as for a discussion of hedging activities employed to mitigate or reduce commodity price risks see NOTE 31 DERIvATIvE FINAN-
CIAL INSTRUMENTS AND HEDgINg ACTIvITIES.
Using historical volatilities and correlations, a ten day holding period and a confidence level of 99.5%, the VaR, which com-prises the net position of commodity derivatives and the com-modity purchase transactions with price risk, was €10 million as of September 30, 2012 compared to €9 million as of Septem-ber 30, 2011.
EqUITY PRICE RISkSiemens’ investment portfolio consists of direct and indirect investments in publicly traded companies held for purposes other than trading. The direct participations result mainly from strategic partnerships or compensation from M&A transac-tions; indirect investments in fund shares are mainly transact-ed for financial reasons.
The equity investments are monitored based on their current market value, affected primarily by fluctuations in the volatile technology-related markets worldwide. The market value of Siemens’ portfolio in publicly traded companies as of Septem-ber 30, 2012 was €796 million compared to €516 million as of September 30, 2011.
Based on historical volatilities and correlations, a ten day hold-ing period and a confidence level of 99.5%, the VaR as of Sep-tember 30, 2012 of Siemens’ equity investments was €85 mil-lion compared to €63 million the year before. Both changes, the increase in market value and the increase in VaR, related mainly to the increase of the market value of Siemens’ Atos shares, received from Atos in connection with the divestment of Siemens IT Solutions and Services.
LIqUIDITY RISkLiquidity risk results from the Company ’s potential inability to meet its financial liabilities, e.g. for the settlement of its finan-cial debt or for ongoing cash requirements from operating ac-tivities. In addition to having implemented effective working capital and cash management, Siemens mitigates liquidity risk by arranged credit facilities with highly rated financial institu-tions, via a debt issuance program and via a global multi-cur-rency commercial paper program. Liquidity risk may also be mitigated by the Siemens Bank GmbH, which was established in December 2010. The Siemens Bank increased the flexibility of depositing cash or refinancing by using European Central Bank accounts. For further information regarding short- and long-term debt see NOTE 22 DEBT.
In addition to the above-mentioned sources of liquidity, Siemens constantly monitors funding options available in the capital markets, as well as trends in the availability and costs of such funding, with a view to maintaining financial flexibility and limiting repayment risks.
The following table reflects all contractually fixed pay-offs for settlement, repayments and interest resulting from recognized financial liabilities as well as from irrevocable loan commit-ments. It includes expected net cash outflows from derivative financial liabilities that are in place as per September 30, 2012. Such expected net cash outflows are determined based on

1 A. To our Shareholders 49 C. Combined Management Report 21 B. Corporate Governance206
each particular settlement date of an instrument. The amounts disclosed are undiscounted net cash outflows for the respec-tive upcoming fiscal years, based on the earliest date on which Siemens could be required to pay. Cash outflows for financial liabilities (including interest) without fixed amount or timing are based on the conditions existing at September 30, 2012.
Year ended September 30,
2013 20142015 to
20172018 and
thereafter(in millions of €)
Non-derivative financial liabilities
Notes and bonds 2,712 2,030 8,296 8,456
Loans from banks 1,549 66 369 11
Other financial indebtedness 265 9 44 1
Obligations under finance leases 36 19 43 148
Trade payables 8,072 22 20 3
Other financial liabilities 1,017 39 353 6
Derivative financial liabilities 469 181 244 193
Irrevocable loan commitments 2,389 113 257 78
The risk implied from the values shown in the table above re-flects the one-sided scenario of cash outflows only. Obliga-tions under finance leases, trade payables and other financial liabilities mainly originate from the financing of assets used in Siemens’ ongoing operations such as property, plant, equip-ment and investments in working capital – e.g. inventories and trade receivables. These assets are considered in the Com-pany ’s overall liquidity risk management. A considerable por-tion of the irrevocable loan commitments result from asset-based lending transactions meaning that the respective loans can only be drawn after sufficient collateral has been provided by the borrower. To monitor existing financial assets and liabil-ities as well as to enable an effective controlling of future risks, Siemens has established a comprehensive risk reporting cov-ering its worldwide business units.
The balanced view of liquidity and financial indebtedness is stated in the calculation of the Net debt. Net debt results from total debt less total liquidity. Total debt comprises line item Short-term debt and current maturities of long-term debt as well as line item Long-term debt, as stated on the Consolidated Statements of Financial Position. Total debt comprises items Notes and bonds, Loans from banks, Obligations under finance leases and Other financial indebtedness such as commercial
paper. Total liquidity refers to the liquid financial assets, which Siemens had available at the respective period-end dates to fund its business operations and to pay for near-term obliga-tions. Total liquidity comprises line items Cash and cash equivalents as well as line item Available-for-sale financial as-sets, as stated on the Consolidated Statements of Financial Po-sition. Management uses the Net debt measure for internal corporate finance management, as well as for external com-munication with investors, analysts and rating agencies.
September 30,
(in millions of €) 2012 2011
Short-term debt and current maturities of long-term debt 3,826 3,660
Long-term debt 16,880 14,280
Total debt 20,707 17,940
Cash and cash equivalents (10,891) (12,468)
Available-for-sale financial assets (current) (524) (477)
Total liquidity (11,415) (12,945)
Net debt (Total debt less Total liquidity) 9,292 4,995
Siemens’ capital resources consist of a variety of short- and long-term financial instruments including, but not limited to, loans from financial institutions, commercial paper, notes and bonds as well as credit facilities. In addition to cash and cash equivalents and to available-for-sale financial assets, liquid re-sources consist of future cash flows from operating activities.
Siemens’ capital requirements include, among others, sched-uled debt service, regular capital spending, ongoing cash re-quirements from operating and SFS financing activities, in-cluding higher cash outflows related to the announced growth strategy of SFS, dividend payments, pension plan funding, portfolio activities, and cash outflows in connection with re-structuring measures.
CREDIT RISkCredit risk is defined as an unexpected loss in cash and earn-ings if the customer is unable to pay its obligations in due time or if the value of collateral declines.
Siemens provides its customers with various forms of direct and indirect financing particularly in connection with large projects. Siemens finances a large number of smaller customer orders, for example the leasing of medical equipment, in part through SFS. SFS is also exposed to credit risk by financing third-party equipment or by taking direct or indirect participations in fi-

135 D. Consolidated Financial Statements 239 E. Additional Information
140 D.5 Consolidated Statements of Changes in Equity 142 D.6 Notes to Consolidated Financial Statements 232 D.7 Supervisory Board and Managing Board
136 D.1 Consolidated Statements of Income 137 D.2 Consolidated Statements of Comprehensive Income 138 D.3 Consolidated Statements of Financial Position 139 D.4 Consolidated Statements of Cash Flow
207
nancings, such as syndicated loans. In part, Siemens takes a se-curity interest in the assets Siemens finances or Siemens re-ceives additional collateral. Siemens may incur losses if the credit quality of its customers deteriorates or if they default on their payment obligations to Siemens, such as a consequence of a financial or political crisis and a global downturn.
The effective monitoring and controlling of credit risk is a core competency of our risk management system. Siemens has im-plemented a binding credit policy for all entities. Hence, credit evaluations and ratings are performed for all customers with an exposure or requiring credit beyond centrally defined limits.
Customer ratings, analyzed and defined by SFS, and individual customer limits are based on generally accepted rating meth-odologies, with the input consisting of information obtained from the customer, external rating agencies, data service pro-viders and Siemens’ customer default experiences. Ratings and credit limits are carefully considered in determining the conditions under which direct or indirect financing will be of-fered to customers. As part of the process, internal risk assess-ment specialists determines and continuously updates ratings and credit limits for Siemens‘ public and private customers, both in the Euro zone and around the world. For public cus-tomers our policy provides that the rating applied to individual customers cannot be better than the weakest of the sovereign ratings provided by Moody ’s, S&P’s and Fitch for the respective country.
Credit risk is recorded and monitored on an ongoing basis ap-plying different systems or processes dependent on the under-lying product. Central systems are used for ongoing monitor-ing of counterparty risk. In addition, SFS uses own systems for its financing activities. There are also a number of decentral-ized tools used for management of individual credit risks with-in the operating units. A central IT application processes data from the operating units together with rating and default in-formation and calculates an estimate which may be used as a basis for individual bad debt provisions. In addition to this au-tomated process, qualitative information is considered, in par-ticular to incorporate the latest developments.
To increase transparency with regard to credit risk Corporate Treasury has established the Siemens Credit Warehouse to which numerous operating units from the Siemens Group reg-ularly transfer business partner data as a basis for a centralized rating process. In addition, numerous operating units transfer their trade receivables with a remaining term up to one year along with the inherent credit risk to the Siemens Credit Ware-house, but remain responsible for servicing activities such as
collections and receivables management. The Siemens Credit Warehouse actively identifies, quantifies and manages the credit risk in its portfolio, such as by selling or hedging expo-sure to specific customers, countries and industries. In addi-tion to an increased transparency with regard to credit risk, the Siemens Credit Warehouse may provide Siemens with an addi-tional source of liquidity and strengthens Siemens‘ funding flexibility.
The maximum exposure to credit risk of financial assets, with-out taking account of any collateral, is represented by their carrying amount. As of September 30, 2012 and 2011 the collat-eral for financial instruments classified as financial assets measured at fair value in the form of netting agreements for derivatives in the event of insolvency of the respective coun-terparty amounted to €716 million and €1,129 million, respec-tively. As of September 30, 2012 and 2011 the collateral held for financial instruments classified as receivables from finance leases amounted to €1,685 million and €1,510 million, respec-tively, mainly in the form of the leased equipment. As of Sep-tember 30, 2012 and 2011 the collateral held for financial in-struments classified as financial assets measured at cost or amortized cost amounted to €1,902 million and €1,770 million, respectively. The collateral mainly consisted of property, plant and equipment and letters of credit. In addition, for this class Siemens holds collateral in the form of securities related to re-verse repurchase agreements that can be sold or re-pledged in absence of default by the owner of the collateral. As of Sep-tember 30, 2012 and 2011 the fair value of the collateral held amounted to €500 million and €421 million, respectively. In fis-cal 2012 and 2011 Siemens has not exercised the right to sell or re-pledge the collateral. Credit risks arising from irrevocable loan commitments are equal to the expected future pay-offs resulting from these commitments. As of September 30, 2012 and 2011 the collateral held for these commitments amounted to €1,178 million and €1,026 million, respectively, mainly in the form of inventories and receivables. Credit risks arising from credit guarantees are described in NOTE 28 COMMITMENTS
AND CONTINgENCIES. There were no significant concentrations of credit risk as of September 30, 2012 and 2011.
Concerning trade receivables and other receivables, as well as other loans or receivables included in line item Other financial assets that are neither impaired nor past due, there were no in-dications as of September 30, 2012, that defaults in payment obligations will occur. As of September 30, 2012 and 2011, financial instruments that were past due were generally im-paired. For further information regarding the concept for the de-termination of allowances on receivables see NOTE 3 CRITICAL
ACCOUNTINg ESTIMATES.

1 A. To our Shareholders 49 C. Combined Management Report 21 B. Corporate Governance208
NOTE 33 Share-based payment
Share-based payment awards at Siemens, including Bonus Awards, Stock Awards, Stock Options, the Share Matching Pro-gram and its underlying plans as well as the Jubilee Share Pro-gram are predominately designed as equity-settled plans and to a limited extent as cash-settled plans. If participating Siemens companies cease to be part of the Siemens Group, they are no longer eligible to participate in future share-based payment awards at Siemens. In such cases the participating Siemens companies have the right to settle the share-based payment awards prematurely. Total pretax expense for share-based payment recognized in line item Income from continu-ing operations amounted to €155 million and €148 million for the years ended September 30, 2012 and 2011, respectively, and refers primarily to equity-settled awards, including the Company ’s Base Share Program.
STOCk AwARDSThe Company grants stock awards as a means for providing share-based compensation to members of the Managing Board, members of the senior management of Siemens AG and its domestic and foreign subsidiaries and other eligible em-ployees. Stock awards are subject to a restriction period of about four years and entitle the beneficiary to Siemens shares without payment of consideration following the restriction pe-riod. Stock awards granted in fiscal 2008 to 2011 were general-ly subject to a restriction period of three years. Stock awards forfeit if the beneficiary ’s employment with the Company ter-minates prior to the expiration of the restriction period. Dur-ing the restriction period, beneficiaries are not entitled to divi-dends. Stock awards may not be transferred, sold, pledged or otherwise encumbered. Settlement of stock awards may occur in newly issued shares of common stock of Siemens AG, trea-sury stock or in cash. The settlement method will be deter-mined by the Managing Board and the Supervisory Board. Each fiscal year, the Company decides whether or not to grant stock awards. The Supervisory Board decides about the num-ber of stock awards to the Managing Board and the Managing Board decides about the number of stock awards to members of the senior management and other eligible employees.
In fiscal 2012, the allocation of stock awards as a share-based payment has been increasingly tied to corporate performance criteria. The target attainment for the performance criteria ranges between 0% and 200%.
Half of the annual target amount for stock awards is based on the average of earnings per share (EPS, basic) of the past three fiscal years. The target attainment determines the number of
stock awards upon allocation. Settlement of these stock awards is in shares following the four-year restriction period.
The other half of the annual target amount for stock awards is based on the share price performance of Siemens shares rela-tive to the share price performance of five important Siemens competitors (ABB, General Electric, Philips, Rockwell, Schneider) during the four-year restriction period. The target attainment is determined during the four-year restriction period for the stock awards and accordingly, determines the number of Siemens shares ultimately transferred following the restriction period. If the target attainment is up to 100%, settlement is in shares. If the target attainment exceeds 100% (up to 200%) an additional cash payment corresponding to the outperformance results.
Additionally one portion of the variable compensation compo-nent (bonus) for members of the Managing Board is granted in the form of non-forfeitable awards of Siemens stock (Bonus Awards).
Commitments to members of the Managing Board:In fiscal 2012 and 2011, agreements were entered into which entitle members of the Managing Board to stock awards con-tingent upon attainment of an EPS-based target. The fair value of these entitlements amounting to €6 million and €5 million was determined by calculating the present value of the target amount. In fiscal 2012 and 2011, agreements were entered into which entitle members of the Managing Board to stock awards contingent upon attainment of a performance-based target of Siemens stock relative to five competitors. The fair value of these entitlements amounting to €7 million and €6 million was calculated by applying a local volatility model. Inputs to that model include an expected weighted volatility of Siemens shares of 27% in 2012 and 30% and 29%, respectively, in 2011 and a market price of €73.94 in fiscal 2012 and €88.09 and €92.98, respectively in fiscal 2011 per Siemens share. Expected volatility was determined by reference to implied volatilities. The model applies a risk-free interest rate of up to 1.7% in fiscal 2012 and up to 2.4% and up to 3.0%, respectively, in fiscal 2011 and an expected dividend yield of 4.1% in fiscal 2012 and 3% and 2.4%, respectively, in fiscal 2011. Compensation expense related to stock awards is generally recognized over five years until they vest, including a restriction period of four years.
In fiscal 2012 and 2011, agreements were entered into which entitle members of the Managing Board to Bonus Awards con-tingent upon the target attainment. The fair value of these en-titlements amounting to €5 million and €5 million was deter-mined by calculating the present value of the target amount.

135 D. Consolidated Financial Statements 239 E. Additional Information
140 D.5 Consolidated Statements of Changes in Equity 142 D.6 Notes to Consolidated Financial Statements 232 D.7 Supervisory Board and Managing Board
136 D.1 Consolidated Statements of Income 137 D.2 Consolidated Statements of Comprehensive Income 138 D.3 Consolidated Statements of Financial Position 139 D.4 Consolidated Statements of Cash Flow
209
Compensation expense related to Bonus Awards is generally recognized over the vesting period of one year. Beneficiaries will receive one Siemens share without payment of consider-ation for each Bonus Award, following an additional waiting period of four years.
In fiscal 2011, the Company granted additional 128,284 stock awards to members of the Managing Board. The fair value of these stock awards amounting to €77.76 per stock award was determined as the market price of Siemens shares less the present value of expected dividends.
The remuneration system of the Managing Board and the changes in the stock awards held by Managing Board mem-bers are explained in detail in the Compensation report within the Corporate Governance report.
Commitments to members of the senior management and o ther eligible employees: In fiscal 2012, 1,080,609 stock awards were granted to mem-bers of the senior management and other eligible employees contingent upon attainment of an EPS target. The fair value of these stock awards amounts to €62 million and corresponds to the target amount reflecting the EPS target attainment. In fis-cal 2012, 947,945 stock awards were granted to members of the senior management and other eligible employees contin-gent upon the attainment of a prospective performance-based target of the Siemens stock. The fair value of these stock awards amounting to €58 million, of which €46 million relate to equity instruments, was calculated by applying a local vola-tility model. Inputs to that model include an expected weight-ed volatility of Siemens shares of 25.33% and a market price of €74.14 per Siemens share. Expected volatility was determined by reference to implied volatilities. The model applies a risk-free interest rate of up to 1.8% and an expected dividend yield of 3.91%. Compensation expense related to these stock awards is recognized over four years until they vest.
In fiscal 2011, fair value was determined as the market price of Siemens shares less the present value of dividends expected during the four year and three year vesting period, respective-ly, as stock awards do not carry dividend rights during the vesting period. The weighted average grant-date fair value for board members, senior management and other eligible em-ployees amounts to €77.79 per stock award granted in fiscal 2011, resulting in a total fair value of stock awards granted in fiscal 2011 of €107 million.
The following table shows the changes in the stock awards held by members of the senior management and other eligible employees:
Year ended September 30,
2012 2011
Awards Awards
Non-vested, beginning of period 3,857,315 4,322,824
Granted 2,028,554 1,249,901
Vested and transferred (1,531,944) (1,482,096)
Forfeited/settled (136,337) 1 (233,314)
Non-vested, end of period 4,217,588 3,857,315
1 Consists of 111,776 forfeited and 24,561 settled awards, respectively, in fiscal 2012.
SHARE MATCHINg PROgRAM AND ITS UNDERLYINg PLANS:1. Share Matching PlanIn fiscal 2012 and 2011, the Company issued a new tranche un-der the Share Matching Plan. Senior managers of Siemens AG and participating Siemens companies may invest a specified percentage of their compensation in Siemens shares; in fiscal 2011, members of the Managing Board, for the last time, could invest a specified amount of their bonus payout relating to fis-cal 2010 in Siemens shares. Within a predetermined period in the first quarter of each fiscal year, plan participants decide on their investment amount for which investment shares are pur-chased. The shares are purchased at the market price at a pre-determined date in the second quarter. Plan participants re-ceive the right to one Siemens share without payment of con-sideration (matching share) for every three investment shares continuously held over a period of three years (vesting period) provided the plan participant has been continuously employed by Siemens AG or another Siemens company until the end of the vesting period. During the vesting period, matching shares are not entitled to dividends. The right to receive matching shares forfeits if the underlying investment shares are trans-ferred, sold, pledged or otherwise encumbered. Matching shares may be settled in newly issued shares of common stock of Siemens AG, treasury stock or in cash. The settlement meth-od will be determined by the Managing Board. Each fiscal year, the Company decides whether or not to issue a new tranche under the Share Matching Plan.
2. Monthly Investment PlanIn fiscal 2012 and 2011, the Company issued a new tranche un-der the Monthly Investment Plan that is a further component of the Share Matching Plan and which is available for employ-ees – other than senior managers – of Siemens AG and partici-pating Siemens companies. Plan participants may invest a specified percentage of their compensation in Siemens shares

1 A. To our Shareholders 49 C. Combined Management Report 21 B. Corporate Governance210
on a monthly basis over a period of twelve months. The shares are purchased at market price at a predetermined date once a month. The Managing Board of the Company will decide annu-ally, whether shares acquired under the Monthly Investment Plan (investment shares) may be transferred to the Share Matching Plan the following year. If the Managing Board de-cides that shares acquired under the Monthly Investment Plan are transferred to the Share Matching Plan, plan participants will receive the right to matching shares under the same con-ditions applying to the Share Matching Plan described above. Each fiscal year the Managing Board decides, whether or not to issue a new tranche under the Monthly Investment Plan.
The Managing Board decided that shares acquired under the tranches issued in fiscal 2011 are transferred to the Share Matching Plan as of February 2012 and February 2011, respec-tively.
3. Base Share ProgramIn fiscal 2012 and 2011, the Company issued an annual tranche under the Base Share Program. Employees of Siemens AG and participating domestic Siemens companies can invest a fixed amount of their compensation into Siemens shares, sponsored by Siemens with a tax beneficial allowance; in fiscal 2011, mem-bers of the Managing Board, for the last time, could participate in the Base Share Program. The shares are bought at market price at a predetermined date in the second quarter and grant the right to receive matching shares under the same conditions applying to the Share Matching Plan described above. Each fis-cal year, the Managing Board decides whether or not to issue a new tranche under the Base Share Program. The fair value of the base share program equals the amount of the tax beneficial allowance sponsored by Siemens. In fiscal 2012 and 2011, the Company incurred pretax expense from continuing operations of €29 million and €28 million, respectively.
4. Resulting Matching Shares
Year ended September 30,
2012 2011
Entitlements to Matching Shares
Entitlements to Matching Shares
Outstanding, beginning of period 1,977,091 1,614,729
Granted 1 706,354 579,845
Vested and transferred (1,037,292) –
Forfeited (57,596) (80,258)
Settled (42,975) (137,225)
Outstanding, end of period 1,545,582 1,977,091
1 Thereof – and 3,602 to the Managing Board in fiscal 2012 and 2011, respectively.
Fair value was determined as the market price of Siemens shares less the present value of expected dividends during the vesting period as matching shares do not carry dividend rights during the vesting period. Non-vesting conditions, i.e. the condition neither to transfer, sell, pledge nor otherwise en-cumber the underlying shares, were considered in determin-ing the fair values. Depending on the grant dates, the fair val-ues are €48.69 and €51.22 per matching share entitled in fiscal 2012; in fiscal 2011, the grant-date fair values are €58.15 and €71.09 per matching share entitled. In fiscal 2012 and 2011, the weighted average grant-date fair value of the resulting match-ing shares is €50.35 and €66.13 per share respectively, based on the number of instruments granted.
JUBILEE SHARE PROgRAMUnder the Jubilee Share Program, eligible employees of Siemens AG and participating domestic Siemens companies receive jubilee shares after having been continuously em-ployed by the Company for 25 and 40 years (vesting period), respectively. Generally, settlement of jubilee grants is in shares. Jubilee shares are measured at fair value considering biometrical factors. The fair value is determined as the market price of Siemens shares at grant date less the present value of dividends expected to be paid during the vesting period for which the employees are not entitled to. The weighted average fair value of each jubilee share granted in fiscal 2012 for the 25th and the 40th anniversary is €39.45 and €29.88, respective-ly, based on the number of shares granted. The weighted aver-age fair value of each jubilee share granted adjusted by bio-metrical factors (considering fluctuation) is €19.01 and €13.12, respectively, in fiscal 2012. The weighted average fair value of each jubilee share granted in fiscal 2011 for the 25th and the 40th anniversary is €51.39 and €44.18, respectively, based on the number of shares granted. The weighted average fair value of each jubilee share granted adjusted by biometrical factors (considering fluctuation) is €29.24 and €22.24, respectively, in fiscal 2011.
In fiscal 2012 and 2011, 0.43 million and 0.49 million jubilee shares were granted; 0.16 million and 0.18 million were trans-ferred, 0.48 million and 0.41 million forfeited, resulting in an outstanding balance of 4.7 million and 4.9 million jubilee shares as of September 30, 2012 and 2011. Considering biomet-rical factors, 3.29 million and 3.55 million jubilee shares are ex-pected to vest as of September 30, 2012 and 2011.
2001 SIEMENS STOCk OPTION PLANIn December 2006, the authority to grant stock options expired. The option grants were subject to a two-year vesting period, after which they could be exercised for a period of up

135 D. Consolidated Financial Statements 239 E. Additional Information
140 D.5 Consolidated Statements of Changes in Equity 142 D.6 Notes to Consolidated Financial Statements 232 D.7 Supervisory Board and Managing Board
136 D.1 Consolidated Statements of Income 137 D.2 Consolidated Statements of Comprehensive Income 138 D.3 Consolidated Statements of Financial Position 139 D.4 Consolidated Statements of Cash Flow
211
to three years. The exercise price was equal to 120% of the ref-erence price. Based on the underlying vesting period, the last stock options were exercised in fiscal 2011; unexercised stock options expired in fiscal 2011. Accordingly, as of September 30, 2012 and 2011, there were no stock options outstanding. As of October 1, 2010, 935,432 options with a weighted average exer-cise price of €74.59 were outstanding. The fair value per option outstanding as of October 1, 2010 amounted to €4.06 for grants made in fiscal 2006. In fiscal 2011, 916,137 options were exer-cised, 12,220 expired and 7,075 forfeited.
OTHER SHARE-BASED PAYMENT AwARDSSiemens maintains other share-based payment awards. The grants of other share-based payment awards do not have a ma-terial impact on Siemens’ Consolidated Financial Statements.
NOTE 34 Personnel costs
Year ended September 30,
(in millions of €) 2012 2011
Wages and salaries 20,825 19,102
Statutory social welfare contributions and expenses for optional support payments 3,406 3,093
Expenses relating to pension plans and employee benefits 863 938
25,094 23,132
Item Expenses relating to pension plans and employee bene-fits includes service costs for the period. Expected return on plan assets and interest cost are included in pension related in-terest income (expense).
Wages and salaries, statutory social welfare contributions and expenses for optional support payments and expenses relating to pension plans and employee benefits for continuing and discontinued operations amounts to €27,009 million and €26,239 million in fiscal 2012 and 2011.
The average number of employees in fiscal years 2012 and 2011 was 366.7 thousand and 349.9 thousand, respectively (based on continuing operations). Part-time employees are included on a proportionate basis. The employees were engaged in the following activities:
Year ended September 30,
(in thousands) 2012 2011
Manufacturing and services 224.3 214.3
Sales and marketing 77.6 73.6
Research and development 29.5 27.7
Administration and general services 35.3 34.3
366.7 349.9
The average number of employees in fiscal years 2012 and 2011 was 408.5 thousand and 412.0 thousand, respectively (based on continuing and discontinued operations). Thereof, in fiscal 2012 and 2011, 255.6 thousand and 264.1 thousand employees were engaged in manufacturing and services, 83.2 thousand and 80.4 thousand employees were engaged in sales and mar-keting, 32.4 thousand and 30.4 thousand employees were in research and development and 37.3 thousand and 37.1 thou-sand employees were in administration and general services in fiscal 2012 and 2011, respectively.
NOTE 35 Earnings per share
Year ended September 30,
(shares in thousands) 2012 2011
Income from continuing operations 5,184 7,376
Less: Portion attributable to non-controlling interest 132 187
Income from continuing operations attributable to shareholders of Siemens AG 5,053 7,189
Weighted average shares outstanding – basic 876,053 873,098
Effect of dilutive convertible debt securities and share-based payment 8,259 9,558
Weighted average shares outstanding – diluted 884,311 882,656
Basic earnings per share (from continuing operations) €5.77 €8.23
Diluted earnings per share (from continuing operations) €5.71 €8.14
Share-based payment plans are dilutive at the Income from continuing operations level and so, in accordance with IAS 33, Earnings per Share, have been treated as dilutive for the pur-pose of diluted earnings per share. The diluted loss per share from discontinued operations is lower than basic loss per share from discontinued operations because of the effect of losses on discontinued operations.

1 A. To our Shareholders 49 C. Combined Management Report 21 B. Corporate Governance212
The dilutive earnings per share computation does not contain 21,674 thousand shares relating to warrants issued with bonds at September 30, 2012. The inclusion of those shares would have been antidilutive in the years presented. In the future, the warrants could potentially dilute basic earnings per share.
NOTE 36 Segment information
Segment information is presented for continuing operations.
Effective as of October 1, 2011, Siemens changed its organiza-tional structure of the Sectors. Prior-year information has been recast to correspond to the fiscal 2012 reporting format. A fourth Sector, Infrastructure & Cities was formed in order to benefit from the growth of urban centers. The new Infrastructure & Cit-ies Sector comprises the Industry Sector activities of Building Technologies, Mobility as well as the Energy Sector’s Power Dis-tribution business and Smart Grid applications. The Industry Sector is focusing even more sharply on industry solutions. Ac-cordingly, since fiscal 2012, the Company has six reportable seg-ments: the four Sectors Energy, Healthcare, Industry and Infra-structure & Cities as well as Equity Investments and Financial Services (SFS). Healthcare, Equity Investments and SFS retained its previous structure. The Managing Board is monitoring each reportable segment. Each reportable segment has its own seg-ment management reporting to the Managing Board.
DESCRIPTION OF REPORTABLE SEgMENTSThe four Sectors comprise manufacturing, industrial and com-mercial goods, solutions and services in areas more or less related to Siemens’ origins in the electrical business field.
Energy – offers a wide spectrum of products, services and so-lutions for the generation and transmission of power, and the extraction, conversion and transport of oil and gas. It primarily addresses the needs of energy providers, but also serves in-dustrial companies, particularly in the oil and gas industry.
Healthcare – offers customers a comprehensive portfolio of medical solutions across the treatment chain – ranging from medical imaging to in vitro diagnostics to interventional sys-tems and clinical information technology systems – all from a single source. In addition, the Sector provides technical main-tenance, professional and consulting services, and, together with Financial Services (SFS), financing to assist customers in purchasing the Sector’s products.
Industry – offers a broad spectrum of products, services and solutions for the efficient use of resources and energy and im-provements of productivity and flexibility in industry. Its inte-
grated technologies and holistic solutions address primarily industrial customers, such as process and manufacturing in-dustries. The portfolio spans industry automation and drives products and services, system integration and solutions for in-dustrial plant businesses as well as water processing systems.
Infrastructure & Cities – offers sustainable technologies for metropolitan areas and their infrastructures. Its offerings in-clude integrated mobility solutions, building and security sys-tems, power distribution equipment, smart grid applications, and low- and medium-voltage products.
Equity Investments – is a reportable segment with its own management. Equity Investments contains investments ac-counted for under the equity method or at cost and current available-for-sale financial assets. For strategic reasons, as of September 30, 2012 and 2011, NSN, BSH and EN, are reported in Equity Investments.
Financial Services (SFS) – provides a variety of financial ser-vices and products both to third parties and to other Siemens entities and their customers.
RECONCILIATION TO CONSOLIDATED FINANCIAL STATEMENTSReconciliation to Consolidated Financial Statements contains businesses and items not directly related to Siemens’ report-able segments:
Centrally managed portfolio activities – generally includes activities intended for divestment or closure. In fiscal 2012 and 2011 it primarily includes activities remaining from divestments and discontinued operations such as from Siemens IT Solutions and Services and from the former Com business as well as ef-fects from EA sold in the second quarter of fiscal 2011.
Siemens Real Estate (SRE) – owns and manages the Siemens real estate portfolio and offers a range of services en-compassing real estate development, real estate disposal and asset management, as well as lease and services management.
Corporate items and pensions – includes corporate charges such as personnel costs for corporate headquarters, corporate projects and non-operating investments or results of corpo-rate-related derivative activities and costs for carve out activi-ties managed by corporate, which are charged to the respec-tive segment when the disposal gain or loss is realized or when the activities are classified as discontinued operations. Pensions includes the Company ’s pension related income (ex-pense) not allocated to the segments, SRE or Centrally man-aged portfolio activities.

135 D. Consolidated Financial Statements 239 E. Additional Information
140 D.5 Consolidated Statements of Changes in Equity 142 D.6 Notes to Consolidated Financial Statements 232 D.7 Supervisory Board and Managing Board
136 D.1 Consolidated Statements of Income 137 D.2 Consolidated Statements of Comprehensive Income 138 D.3 Consolidated Statements of Financial Position 139 D.4 Consolidated Statements of Cash Flow
213
Eliminations, Corporate Treasury and other reconciling items – comprise consolidation of transactions within the segments, certain reconciliation and reclassification items and the activities of the Company ’s Corporate Treasury. It also includes interest income and expense, such as, for example, interest not allocated to segments or Centrally managed port-folio activities (referred to as financing interest), interest relat-ed to Corporate Treasury activities or resulting consolidation and reconciliation effects on interest.
MEASUREMENT – SEgMENTSAccounting policies for Segment information are generally the same as those used for Siemens, described in NOTE 2 SUM-
MARY OF SIgNIFICANT ACCOUNTINg POLICIES. Lease transactions, however, are classified as operating leases for internal and segment reporting purposes. Intersegment transactions are based on market prices.
PROFIT OF THE SECTORS AND OF EqUITY INvESTMENTS:Siemens’ Managing Board is responsible for assessing the per-formance of the segments. The Company ’s profitability mea-sure of the Sectors and Equity Investments is earnings before financing interest, certain pension costs, and income taxes as determined by the chief operating decision maker (Profit). Profit excludes various categories of items, not allocated to the Sectors and Equity Investments, which management does not regard as indicative of their performance. Profit represents a performance measure focused on operational success ex-cluding the effects of capital market financing issues; for fi-nancing issues regarding Equity Investments see paragraph below. The major categories of items excluded from Profit are presented below.
Financing interest, excluded from Profit, is any interest income or expense other than interest income related to receivables from customers, from cash allocated to the Sectors and Equity Investments and interest expense on payables to suppliers. Borrowing costs capitalized as part of qualifying long-term projects are not part of financing interest. Financing interest is excluded from Profit because decision-making regarding fi-nancing is typically made at the corporate level. Equity Invest-ments include interest and impairments as well as reversals of impairments on long-term loans granted to investments re-ported in Equity Investments.
Similarly, decision-making regarding essential pension items is done centrally. Accordingly, Profit primarily includes amounts related to service cost of pension plans only, while all other regularly recurring pension related costs – including charges for the German pension insurance association and plan admin-
istration costs – are included in line item Corporate items and pensions. Curtailments are a partial payback with regard to past service cost that affect Segment Profit.
Furthermore, income taxes are excluded from Profit since in-come tax is subject to legal structures, which typically do not correspond to the structure of the segments.
The effect of certain litigation and compliance issues is exclud-ed from Profit, if such items are not indicative of the Sectors’ and Equity Investments’ performance, since their related re-sults of operations may be distorted by the amount and the ir-regular nature of such events. This may also be the case for items that refer to more than one reportable segment, SRE and (or) Centrally managed portfolio activities or have a corporate or central character.
Central infrastructure costs are primarily allocated to the Sectors. The total amount to be allocated is determined at the beginning of the fiscal year and is charged in equal install-ments in all four quarters.
Profit of Equity Investments mainly comprises income (loss) from investments presented in Equity Investments, such as the share in the earnings of associates or dividends from in-vestments not accounted for under the equity method, income (loss) from the sale of interests in investments, impairment of investments and reversals of impairments. It also includes in-terest and impairments as well as reversals of impairments on long-term loans granted to investments reported in Equity In-vestments, primarily NSN.
PROFIT OF THE SEgMENT SFS:Profit of the segment SFS is Income before income taxes. In contrast to performance measurement principles applied to the Sectors and Equity Investments interest income and ex-pense is an important source of revenue and expense of SFS.
ASSET MEASUREMENT PRINCIPLES:Management determined Assets as a measure to assess capital intensity of the Sectors and Equity Investments (Net capital employed). Its definition corresponds to the Profit measure. It is based on Total assets of the Consolidated Statements of Financial Position, primarily excluding intra-group financing receivables, intragroup investments and tax related assets, since the corresponding positions are excluded from Profit. A Division of Infrastructure & Cities includes the project-specific intercompany financing of a long-term project. The remaining assets are reduced by non-interest-bearing liabilities other than tax related liabilities, e.g. trade payables, to derive Assets. Equity Investments may

1 A. To our Shareholders 49 C. Combined Management Report 21 B. Corporate Governance214
include certain shareholder loans granted to investments reported in Equity Investments. In contrast, Assets of SFS is Total assets.
NEw ORDERS:New orders are determined principally as estimated revenue of accepted purchase orders and order value changes and adjust-ments, excluding letters of intent. New orders are supplemen-tary information, provided on a voluntary basis. It is not part of the audited Consolidated Financial Statements.
FREE CASH FLOw DEFINITION:Segment information discloses Free cash flow and Additions to property, plant and equipment and intangible assets. Free cash flow of the Sectors and Equity Investments constitutes net cash provided by (used in) operating activities less additions to intangible assets and property, plant and equipment. It ex-cludes Financing interest, except for cases where interest on qualifying assets is capitalized or classified as contract costs and it also excludes income tax related and certain other pay-ments and proceeds, in accordance with the Company ’s Profit and Asset measurement definition. Free cash flow of Equity In-vestments includes interest from shareholder loans granted to investments reported in Equity Investments, primarily NSN. Pension curtailments are a partial payback with regard to past service cost that affect segment Free cash flow. Free cash flow of SFS, a financial services business, includes related financing interest payments and proceeds; income tax payments and proceeds of SFS are excluded.
AMORTIzATION, DEPRECIATION AND IMPAIRMENTS:Amortization, depreciation and impairments presented in Segment information includes depreciation and impairments of property, plant and equipment, net of reversals of impair-ments as well as amortization and impairments of intangible assets, net of reversals of impairment. Goodwill impairment is excluded.
MEASUREMENT – CENTRALLY MANAgED PORTFOLIO ACTIvITIES AND SRECentrally managed portfolio activities follow the measurement principles of the Sectors. SRE applies the measurement princi-ples of SFS; since fiscal 2011, Total assets of SRE nets certain intercompany finance receivables with certain intercompany finance liabilities.
RECONCILIATION TO SIEMENS’ CONSOLIDATED FINANCIAL STATEMENTSThe following table reconciles total Assets of the Sectors, Equity Investments and SFS to Total assets of Siemens’ Consolidated Statements of Financial Position:
September 30,
(in millions of €) 2012 2011
Assets of Sectors 23,803 20,933
Assets of Equity Investments 2,715 3,382
Assets of SFS 17,405 14,602
Total Segment Assets 43,923 38,917
Reconciliation:
Assets Centrally managed portfolio activities (448) (397)
Assets SRE 5,018 4,974
Assets of Corporate items and pensions (11,840) (9,806)
Eliminations, Corporate Treasury and other reconciling items of Segment information:
Asset-based adjustments:
Intragroup financing receivables and investments 22,046 24,023
Tax-related assets 4,482 3,901
Liability-based adjustments:
Pension plans and similar commitments 9,926 7,307
Liabilities 42,100 42,585
Eliminations, Corporate Treasury, other items 1 (6,926) (7,261)
Total Eliminations, Corporate Treasury and other reconciling items of Segment information 71,628 70,555
Total assets in Siemens’ Consolidated Statements of Financial Position 108,282 104,243
1 Includes assets and liabilities reclassified in connection with discontinued operations.
In fiscal years 2012 and 2011, Corporate items and pensions in the column Profit includes €(255) million and €(331) million re-lated to Corporate items, as well as €(47) million and €75 mil-lion related to Pensions, respectively. Legal and regulatory matters contributed positive effects to Corporate items in fiscal 2012 and negative effects in fiscal 2011. Remaining costs in connection with Siemens IT Solutions and Services charged to Corporate items in fiscal 2012 and 2011 amount to €118 million and €54 million, respectively. In fiscal 2011, a special remuner-ation, which was granted and charged to Corporate items in fiscal 2010 was primarily allocated to the Sectors resulting in a positive impact of €267 million at Corporate items; fiscal 2011 charges were made to Energy of €60 million, to Healthcare of €43 million, to Industry of €75 million and to Infrastruc-ture & Cities of €63 million.

135 D. Consolidated Financial Statements 239 E. Additional Information
140 D.5 Consolidated Statements of Changes in Equity 142 D.6 Notes to Consolidated Financial Statements 232 D.7 Supervisory Board and Managing Board
136 D.1 Consolidated Statements of Income 137 D.2 Consolidated Statements of Comprehensive Income 138 D.3 Consolidated Statements of Financial Position 139 D.4 Consolidated Statements of Cash Flow
215
ADDITIONAL SEgMENT INFORMATIONFor the years ended September 30, 2012 and 2011, Profit of SFS includes interest income of €778 million and €654 million, re-spectively and interest expense of €316 million and €283 mil-lion, respectively.
NOTE 37 Information about geographies
Revenue by location of customer
Revenue by location of companies
(in millions of €) 2012 2011 2012 2011
Europe, C.I.S., Africa, Middle East 39,909 38,448 44,895 43,508
Americas 22,864 20,470 22,587 19,908
Asia, Australia 15,523 14,357 10,814 9,859
Siemens 78,296 73,275 78,296 73,275
thereof Germany 11,072 10,810 19,948 19,502
thereof foreign countries 67,224 62,465 58,348 53,773
thereof U.S. 16,670 14,368 17,840 15,487
Non-current assets
September 30,
(in millions of €) 2012 2011
Europe, C.I.S., Africa, Middle East 16,009 15,238
Americas 13,723 12,921
Asia, Australia 2,695 2,468
Siemens 32,427 30,627
thereof Germany 6,446 6,351
thereof U.S. 12,133 11,713
Non-current assets consist of property, plant and equipment, goodwill and other intangible assets.
NOTE 38 Related party transactions
JOINT vENTURES AND ASSOCIATESSiemens has relationships with many joint ventures and asso-ciates in the ordinary course of business whereby Siemens buys and sells a wide variety of products and services general-ly on arm’s length terms. For information regarding our subsid-iaries, joint ventures and associated companies in fiscal 2012 see NOTE 18 INvESTMENTS ACCOUNTED FOR USINg THE EqUITY
METHOD and NOTE 42 LIST OF SUBSIDIARIES AND ASSOCIATED
COMPANIES PURSUANT TO SECTION 313 PARA. 2 OF THE gERMAN COM-
MERCIAL CODE. Information regarding our subsidiaries, joint
ventures and associated companies for fiscal 2011 are presented in the List of subsidiaries and associated companies published separately in the German Electronic Federal Gazette (elek-tronischer Bundesanzeiger).
Sales of goods and services and other income from transac-tions with joint ventures and associates as well as purchases of goods and services and other expense from transactions with joint ventures and associates are as follows:
Sales of goods and services and other income
Year ended September 30,
Purchases of goods and services and other expense
Year ended September 30,
(in millions of €) 2012 2011 2012 2011
Joint ventures 423 225 11 35
Associates 513 584 228 259
936 809 239 293
Receivables from joint ventures and associates and liabilities to joint ventures and associates are as follows:
Receivables
September 30,
Liabilities
September 30,
(in millions of €) 2012 2011 2012 2011
Joint ventures 49 52 23 76
Associates 145 120 241 234
194 172 264 310
As of September 30, 2012 and 2011, loans given to joint ven-tures and associates amounted to €60 million and €158 mil-lion, respectively. In December 2010, Siemens and Nokia Cor-poration each converted €266 million of liabilities into pre-ferred NSN shares; the liabilities included the remaining share-holder loan tranche of nominal €250 million as well as deferred interest due from NSN. In the fourth quarter of fiscal 2011, in order to strengthen NSN’s financial position, Nokia and Siemens each provided new equity of €500 million and re-ceived preferred shares in return. The increase in equity did not change the existing shareholder ratio between Siemens and Nokia Corporation. Loans given to joint ventures amount-ed to €3 million and €7 million, respectively, as of September 30, 2012 and 2011. In the normal course of business the Com-pany regularly reviews loans and receivables associated with joint ventures and associates, including NSN. In fiscal 2012 and 2011, the review resulted in net gains related to valuation al-lowances totaling €7 million and net losses related to valuation

1 A. To our Shareholders 49 C. Combined Management Report 21 B. Corporate Governance216
allowances totaling €1 million, respectively. As of September 30, 2012 and 2011, valuation allowances amounted to €37 mil-lion and €37 million, respectively.
As of September 30, 2012 and 2011, guarantees to joint ven-tures and associates amounted to €4,769 million and €5,161 million, respectively, including the HERKULES obligations of €2,290 million and €2,690 million, respectively. For additional information regarding the HERKULES obligations as well as for information regarding guarantees in connection with the con-tribution of the carrier related operations into NSN and the SEN operations into EN, see NOTE 28 COMMITMENTS AND CON-
TINgENCIES. As of September 30, 2012 and 2011, guarantees to joint ventures amounted to €474 million and €483 million, re-spectively. As of September 30, 2012 and 2011, the Company had commitments to make capital contributions of €176 mil-lion and €315 million to its joint ventures and associates, there-in €68 million and €69 million related to joint ventures, respec-tively. For additional information see NOTE 28 COMMITMENTS
AND CONTINgENCIES. For a loan raised by a joint venture, which is secured by a Siemens guarantee, Siemens granted an addi-tional collateral in the first quarter of fiscal 2011. As of Septem-ber 30, 2012 and 2011 the outstanding amount totaled to €139 million and €142 million, respectively. As of September 30, 2012 and 2011 there were loan commitments to joint ventures and associates amounting to €144 million and €200 million, re-spectively, therein €94 million and €150 million, respectively related to joint ventures.
PENSION ENTITIESFor information regarding the funding of our principal pension plans refer to NOTE 23 PENSION PLANS AND SIMILAR COMMITMENTS.
RELATED INDIvIDUALSRelated individuals include the members of the Managing Board and Supervisory Board.
In fiscal 2012 and 2011 members of the Managing Board re-ceived cash compensation of €17.4 million and €18.9 million. The fair value of stock-based compensation amounted to €22.2 million and €20.7 million for 345,382 and 352,083 Stock Awards, respectively, in fiscal 2012 and 2011. In fiscal 2012 and 2011 the Company granted contributions under the BSAV to members of the Managing Board totaling €5.7 million and €5.2 million.
Therefore in fiscal 2012 and 2011, compensation and benefits, attributable to members of the Managing Board amounted to €45.3 million and €44.8 million in total, respectively.
In fiscal 2012 and 2011, expense related to share-based pay-ment and to the Share Matching Program amounted to €16.0
million and €15.2 million; respectively. For additional informa-tion regarding the Share Matching Program see NOTE 33
SHARE-BASED PAYMENT.
Former members of the Managing Board and their surviving dependents received emoluments within the meaning of Sec-tion 314 para. 1 No. 6 b of the German Commercial Code total-ing €15.8 million and €15.0 million in fiscal 2012 and 2011.
The defined benefit obligation (DBO) of all pension commit-ments to former members of the Managing Board and their survivors as of September 30, 2012 and 2011 amounted to €181.6 million and €161.9 million. For additional information see NOTE 23 PENSION PLANS AND SIMILAR COMMITMENTS.
Compensation attributable to members of the Supervisory Board comprises in fiscal 2012 and 2011of a base compensation and additional compensation for committee work and amount-ed to €4.8 million and €4.8 million (including meeting fees), respectively.
No loans and advances from the Company are provided to members of the Managing Board and Supervisory Board.
Information regarding the remuneration of the members of the Managing Board and Supervisory Board is disclosed on an individual basis in the Compensation report, which is part of the Combined Management Report. The Compensation Report is presented within the Corporate Governance report (see
B.4).
In fiscal 2012 and 2011, no other major transactions took place between the Company and the other members of the Manag-ing Board and the Supervisory Board.
Some of our board members hold, or in the last year have held, positions of significant responsibility with other entities. We have relationships with almost all of these entities in the ordi-nary course of our business whereby we buy and sell a wide variety of products and services on arm’s length terms. Until the close of the annual general meeting of Deutsche Bank AG on May 31, 2012, Dr. Josef Ackermann was the Chairman of the Management Board of Deutsche Bank AG. Our transactions with Deutsche Bank Group are conducted on arm’s length ba-sis and include securities underwriting, other investment banking services, and credit, money market and foreign ex-change business as well as transaction banking services. Michael Diekmann is the Chairman of the Board of Manage-ment of Allianz SE. Our transactions with Allianz Group are conducted on arm’s length basis and include insurance busi-ness and asset management.

135 D. Consolidated Financial Statements 239 E. Additional Information
140 D.5 Consolidated Statements of Changes in Equity 142 D.6 Notes to Consolidated Financial Statements 232 D.7 Supervisory Board and Managing Board
136 D.1 Consolidated Statements of Income 137 D.2 Consolidated Statements of Comprehensive Income 138 D.3 Consolidated Statements of Financial Position 139 D.4 Consolidated Statements of Cash Flow
217
NOTE 39 Principal accountant fees and services
Fees related to professional services rendered by the Company ’s principal accountant, Ernst & Young (E&Y), for fiscal 2012 and 2011 were as follows:
Year ended September 30,
(in millions of €) 2012 2011
Type of Fees
Audit fees 44.2 42.0
Audit-related fees 10.6 14.8
Tax fees 0.4 0.7
All other services – –
Total 55.2 57.5
Audit fees and audit-related fees consist of fees associated with the services pre-approved by the Audit Committee de-scribed below. Tax fees, which require specific pre-approval by the Audit Committee, include primarily fees for support servic-es provided in connection with the documentation of transfer pricing arrangements and assistance for competent authority procedures according to Article 25 of the OECD Model Tax Con-vention regarding transfer pricing issues.
In fiscal 2012 and 2011, 47% and 52%, respectively, of the total fees related to Ernst & Young GmbH Wirtschaftsprüfungsge-sellschaft, Germany.
AUDIT COMMITTEE PRE-APPROvAL POLICIESIn accordance with German law, Siemens’ independent auditor is appointed by the Annual Shareholders’ Meeting based on a recommendation of the Supervisory Board. The Audit Commit-tee of the Supervisory Board prepares the board’s recommen-dation on the election of the Company ’s independent auditor. Subsequent to the auditor’s appointment, the Audit Commit-tee engages the auditor and in its sole authority approves the terms and scope of the audit and all audit engagement fees. In addition, it monitors the auditor’s independence.
In order to ensure the integrity of independent audits, Siemens’ Audit Committee has established a policy to approve all audit and permissible audit-related services provided by our independent auditor prior to the auditor’s engagement. As part of this approval process, the Audit Committee adopted pre-ap-proval policies and procedures pursuant to which the Audit Committee annually pre-approves certain types of services to be performed by Siemens’ independent auditor. Under the pol-icies, the Company ’s independent auditor is not allowed to
perform any non-audit services which either (1) may impair the auditor’s independence under applicable German regula-tions or the rules and regulations of the International Ethics Standards Board for Accountants (IESBA), the International Federation of Accountants (IFAC), the U.S. Securities and Ex-change Commission (SEC) or the Public Company Accounting Oversight Board (PCAOB) or (2) which can be more effectively or economically provided by another provider, even if permis-sible under the relevant independence rules. Furthermore, the Audit Committee has limited the sum total of all fees that may be incurred during a fiscal year for non-audit services, includ-ing audit-related services, tax services and other services, to 30% of the audit fees agreed upon for the respective fiscal year. The Audit Committee waived this limitation for fiscal 2011, pri-marily due to the audit-related services pertaining to the sale of Siemens IT Solutions and Services in that year and the then-planned initial public offering of OSRAM.
The Audit Committee has generally pre-approved the perfor-mance by E&Y of audit and audit-related services, including among others the following:
AUDIT SERvICES > Annual audit of Siemens’ Consolidated Financial Statements and its internal control over financial reporting
> Quarterly review of Siemens’ interim consolidated financial statements
> Audit and review services that are required by statute or regulation, including statutory audits of financial statements of Siemens AG and of its subsidiaries under the rules of their respective countries
> Opening balance sheet audits in connection with acquisitions, including audits with regard to the allocation of purchase prices
AUDIT-RELATED SERvICES > Voluntary local GAAP audits > Due diligence relating to actual or contemplated acquisitions and carve-outs, including consultation in accounting matters
> Post-closing audits > Carve-out audits and attestation services in the context of carve-outs
> Certification services required by regulation, law or contractual agreement
> Consultation concerning financial accounting and report-ing standards based on the auditor’s knowledge of Siemens-specific circumstances, including:
> Accounting advice relating to actual or contemplated transactions or events
> Advice on the introduction and review of new or revised accounting guidelines and requirements
> Training regarding accounting-related topics

1 A. To our Shareholders 49 C. Combined Management Report 21 B. Corporate Governance218
> Comfort letters > Employee benefit plan audits > ISAE 3402 / SSAE 16 reports > Attestation services subject to regulatory requirements, including regulatory advice
> Attestation and audits in connection with the European Community Directive on Waste Electrical and Electronic Equipment
> Attestation of compliance with provisions or calculations required by agreements
> Attest services in accordance with applicable standards, other than audit services required by statute or other regulation
Services that are not generally pre-approved as audit or audit-related services require specific pre-approval by the Audit Committee. An approval may not be granted if the service falls into a category of services not permitted by current law or if it is inconsistent with ensuring the auditor’s independence, as expressed in the four principles promulgated by the U.S. Secu-rities and Exchange Commission: (1) an auditor may not act as management or an employee of the audit client; (2) an auditor may not audit his or her own work; (3) an auditor may not serve in an advocacy role for his or her client; and (4) an audi-tor may not provide services creating a mutual or conflicting interest between itself and the audit client.
While non-audit-related services are not prohibited by law, ex-cept for certain types of non-audit services enumerated in the SEC’s rules, the Audit Committee has decided as a matter of policy not to engage the principal accountant to provide non audit-related services unless there is a compelling advantage to the Company in using the principal accountant and it can clearly be shown that there is no impairment of independence.
NOTE 40 Corporate Governance
The Managing board and the Supervisory board of Siemens Aktiengesellschaft provided the certification required by Section 161 of the German stock corporation law (AktG) as of October 1, 2012, which is available on the Company ’s website at www.SIEMENS.COM/CORPORATE-gOvERNANCE.
The Managing board and the Supervisory board of IBS AG ex-cellence, collaboration, manufacturing, currently Siemens’ sole German publicly traded subsidiary provided the certifica-tion required by Section 161 of the German stock corporation law (AktG) as of May 9, 2012, which is available at
www.IBS-Ag.DE/UNTERNEHMEN/INvESTOR-RELATIONS/CORPORATE-
gOvERNANCE.
NOTE 41 Subsequent events
After the end of fiscal 2012, Siemens announced the acquisi-tion of LMS International NV, of Belgium, a leading provider of mechatronic simulation solutions. With the acquisition, which will be integrated in the Industry Sector’s Industry Automation Division, Siemens intends to expand and complement the In-dustry Sector’s product lifecycle management portfolio with mechatronic simulation and testing software. The purchase price amounts to approximately €680 million. The transaction is subject to approval by regulatory authorities. Closing is ex-pected in the second quarter of fiscal 2013.
Also after the end of fiscal 2012, Siemens announced that it plans to divest the business activities included in the Industry Sector’s Water Technologies Business Unit, which was part of the Industry Automation Division as of September 30, 2012. The Business Unit’s offerings comprise solutions for municipal and industrial water purification and wastewater treatment.
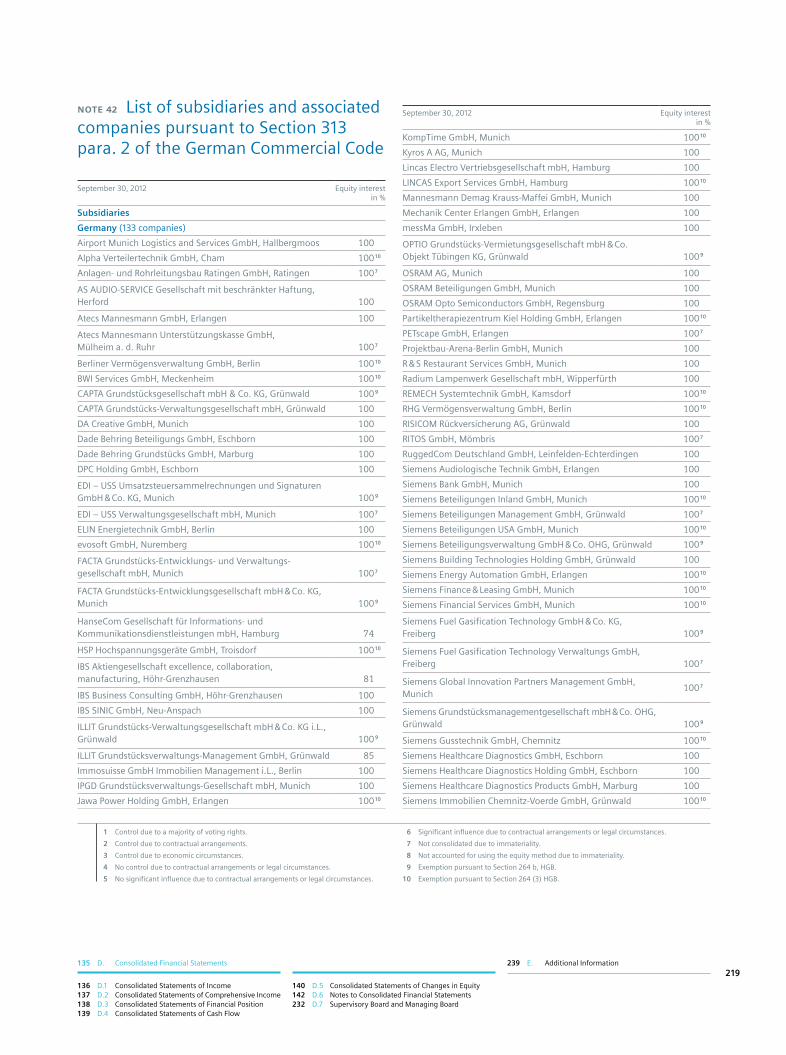
135 D. Consolidated Financial Statements 239 E. Additional Information
140 D.5 Consolidated Statements of Changes in Equity 142 D.6 Notes to Consolidated Financial Statements 232 D.7 Supervisory Board and Managing Board
136 D.1 Consolidated Statements of Income 137 D.2 Consolidated Statements of Comprehensive Income 138 D.3 Consolidated Statements of Financial Position 139 D.4 Consolidated Statements of Cash Flow
219
NOTE 42 List of subsidiaries and associated companies pursuant to Section 313 para. 2 of the German Commercial Code
September 30, 2012 Equity interest in %
Subsidiaries
Germany (133 companies)
Airport Munich Logistics and Services GmbH, Hallbergmoos 100
Alpha Verteilertechnik GmbH, Cham 100 10
Anlagen- und Rohrleitungsbau Ratingen GmbH, Ratingen 100 7
AS AUDIO-SERVICE Gesellschaft mit beschränkter Haftung, Herford 100
Atecs Mannesmann GmbH, Erlangen 100
Atecs Mannesmann Unterstützungskasse GmbH, Mülheim a. d. Ruhr
100
7
Berliner Vermögensverwaltung GmbH, Berlin 100 10
BWI Services GmbH, Meckenheim 100 10
CAPTA Grundstücksgesellschaft mbH & Co. KG, Grünwald 100 9
CAPTA Grundstücks-Verwaltungsgesellschaft mbH, Grünwald 100
DA Creative GmbH, Munich 100
Dade Behring Beteiligungs GmbH, Eschborn 100
Dade Behring Grundstücks GmbH, Marburg 100
DPC Holding GmbH, Eschborn 100
EDI – USS Umsatzsteuersammelrechnungen und Signaturen GmbH & Co. KG, Munich
100
9
EDI – USS Verwaltungsgesellschaft mbH, Munich 100 7
ELIN Energietechnik GmbH, Berlin 100
evosoft GmbH, Nuremberg 100 10
FACTA Grundstücks-Entwicklungs- und Verwaltungs-gesellschaft mbH, Munich
100
7
FACTA Grundstücks-Entwicklungsgesellschaft mbH & Co. KG, Munich
100
9
HanseCom Gesellschaft für Informations- und Kommunikationsdienstleistungen mbH, Hamburg
74
HSP Hochspannungsgeräte GmbH, Troisdorf 100 10
IBS Aktiengesellschaft excellence, collaboration, manufacturing, Höhr-Grenzhausen
81
IBS Business Consulting GmbH, Höhr-Grenzhausen 100
IBS SINIC GmbH, Neu-Anspach 100
ILLIT Grundstücks-Verwaltungsgesellschaft mbH & Co. KG i.L., Grünwald
100
9
ILLIT Grundstücksverwaltungs-Management GmbH, Grünwald 85
Immosuisse GmbH Immobilien Management i.L., Berlin 100
IPGD Grundstücksverwaltungs-Gesellschaft mbH, Munich 100
Jawa Power Holding GmbH, Erlangen 100 10
September 30, 2012 Equity interest in %
KompTime GmbH, Munich 100 10
Kyros A AG, Munich 100
Lincas Electro Vertriebsgesellschaft mbH, Hamburg 100
LINCAS Export Services GmbH, Hamburg 100 10
Mannesmann Demag Krauss-Maffei GmbH, Munich 100
Mechanik Center Erlangen GmbH, Erlangen 100
messMa GmbH, Irxleben 100
OPTIO Grundstücks-Vermietungsgesellschaft mbH & Co. Objekt Tübingen KG, Grünwald
100
9
OSRAM AG, Munich 100
OSRAM Beteiligungen GmbH, Munich 100
OSRAM Opto Semiconductors GmbH, Regensburg 100
Partikeltherapiezentrum Kiel Holding GmbH, Erlangen 100 10
PETscape GmbH, Erlangen 100 7
Projektbau-Arena-Berlin GmbH, Munich 100
R & S Restaurant Services GmbH, Munich 100
Radium Lampenwerk Gesellschaft mbH, Wipperfürth 100
REMECH Systemtechnik GmbH, Kamsdorf 100 10
RHG Vermögensverwaltung GmbH, Berlin 100 10
RISICOM Rückversicherung AG, Grünwald 100
RITOS GmbH, Mömbris 100 7
RuggedCom Deutschland GmbH, Leinfelden-Echterdingen 100
Siemens Audiologische Technik GmbH, Erlangen 100
Siemens Bank GmbH, Munich 100
Siemens Beteiligungen Inland GmbH, Munich 100 10
Siemens Beteiligungen Management GmbH, Grünwald 100 7
Siemens Beteiligungen USA GmbH, Munich 100 10
Siemens Beteiligungsverwaltung GmbH & Co. OHG, Grünwald 100 9
Siemens Building Technologies Holding GmbH, Grünwald 100
Siemens Energy Automation GmbH, Erlangen 100 10
Siemens Finance & Leasing GmbH, Munich 100 10
Siemens Financial Services GmbH, Munich 100 10
Siemens Fuel Gasification Technology GmbH & Co. KG, Freiberg
100
9
Siemens Fuel Gasification Technology Verwaltungs GmbH, Freiberg 100 7
Siemens Global Innovation Partners Management GmbH, Munich
100 7
Siemens Grundstücksmanagementgesellschaft mbH & Co. OHG, Grünwald
100
9
Siemens Gusstechnik GmbH, Chemnitz 100 10
Siemens Healthcare Diagnostics GmbH, Eschborn 100
Siemens Healthcare Diagnostics Holding GmbH, Eschborn 100
Siemens Healthcare Diagnostics Products GmbH, Marburg 100
Siemens Immobilien Chemnitz-Voerde GmbH, Grünwald 100 10
1 Control due to a majority of voting rights.
2 Control due to contractual arrangements.
3 Control due to economic circumstances.
4 No control due to contractual arrangements or legal circumstances.
5 No significant influence due to contractual arrangements or legal circumstances.
6 Significant influence due to contractual arrangements or legal circumstances.
7 Not consolidated due to immateriality.
8 Not accounted for using the equity method due to immateriality.
9 Exemption pursuant to Section 264 b, HGB.
10 Exemption pursuant to Section 264 (3) HGB.

1 A. To our Shareholders 49 C. Combined Management Report 21 B. Corporate Governance220
September 30, 2012 Equity interest in %
Siemens Industriegetriebe GmbH, Penig 100 10
Siemens Industriepark Karlsruhe GmbH & Co. KG, Grünwald 100 9
Siemens Industry Automation Holding AG, Munich 100 10
Siemens Industry Software GmbH & Co. KG, Cologne 100 9
Siemens Industry Software Management GmbH, Cologne 100
Siemens Insulation Center GmbH & Co. KG, Zwönitz 100 9
Siemens Insulation Center Verwaltungs-GmbH, Zwönitz 100 7
Siemens Kapitalanlagegesellschaft mbH, Munich 100 10
Siemens Medical Solutions Health Services GmbH, Erlangen 100
Siemens Nixdorf Informationssysteme GmbH, Grünwald 100
Siemens Power Control GmbH, Langen 100 10
Siemens Private Finance Versicherungs- und Kapital-anlagenvermittlungs-GmbH, Munich
100
10
Siemens Programm- und Systementwicklung GmbH, Hamburg 100 7
Siemens Programm- und Systementwicklung GmbH & Co. KG, Hamburg
100
9
Siemens Project Ventures GmbH, Erlangen 100 10
Siemens Real Estate GmbH & Co. OHG, Grünwald 100 9
Siemens Real Estate Management GmbH, Grünwald 100 7
Siemens Spezial-Investmentaktiengesellschaft mit TGV, Munich 100
Siemens Technology Accelerator GmbH, Munich 100 10
Siemens Technopark Berlin GmbH & Co. KG, Berlin 100 9
Siemens Technopark Berlin Verwaltungs GmbH, Berlin 100 7
Siemens Technopark Mülheim GmbH & Co. KG, Grünwald 100 9
Siemens Technopark Mülheim Verwaltungs GmbH, Grünwald 100 7
Siemens Technopark Nürnberg GmbH & Co. KG, Grünwald 100 9
Siemens Technopark Nürnberg Verwaltungs GmbH, Grünwald 100
Siemens Treasury GmbH, Munich 100 10
Siemens Turbomachinery Equipment GmbH, Frankenthal 100 10
Siemens VAI Metals Technologies GmbH, Willstätt-Legelshurst 100
Siemens Venture Capital GmbH, Munich 100 10
Siemens Wind Power GmbH, Bremen 100 10
SILLIT Grundstücks-Verwaltungsgesellschaft mbH, Munich 100
SIM 16. Grundstücksverwaltungs- und -beteiligungs- GmbH & Co. KG, Munich
100
9
SIM 2. Grundstücks-GmbH & Co. KG i.L., Munich 100 9
SIMAR Nordost Grundstücks-GmbH, Grünwald 100
SIMAR Nordwest Grundstücks-GmbH, Grünwald 100
SIMAR Ost Grundstücks-GmbH, Grünwald 100
SIMAR Süd Grundstücks-GmbH, Grünwald 100
SIMAR West Grundstücks-GmbH, Grünwald 100
SIMOS Real Estate GmbH, Munich 100 10
sinius GmbH, Munich 100
Siteco Auslandsholding GmbH, Traunreut 100
Siteco Beleuchtungstechnik GmbH, Traunreut 100
September 30, 2012 Equity interest in %
Siteco Lighting GmbH, Traunreut 100
SKAG Fonds C1, Munich 100
SKAG Fonds S7, Munich 100
SKAG Fonds S8, Munich 100
SKAG Principals, Munich 100
Steinmüller Engineering GmbH, Gummersbach 60
SVM Star Ventures Managementgesellschaft mbH Nr. 3 & Co. Beteiligungs KG Nr. 2, Munich 99 3
SVM Star Ventures Managementgesellschaft mbH Nr. 3 & Co. Beteiligungs KG Nr. 3, Munich 99 3
SVM Star Ventures Managementgesellschaft mbH Nr. 3 & Co. Beteiligungs KG Nr. 4, Munich 99 3
SYKATEC Systeme, Komponenten, Anwendungstechnologie GmbH, Erlangen 100 10
TGB Technisches Gemeinschaftsbüro GmbH, Kassel 100
TLT-Turbo GmbH, Zweibrücken 100 10
Traxon Technologies Europe GmbH, Paderborn 100
Trench Germany GmbH, Bamberg 100 10
Turbine Airfoil Coating and Repair GmbH, Berlin 100
VIB Verkehrsinformationsagentur Bayern GmbH, Munich 51
VMZ Berlin Betreibergesellschaft mbH, Berlin 100
VR-LEASING IKANA GmbH & Co. Immobilien KG, Eschborn 94 3
VVK Versicherungsvermittlungs- und Verkehrskontor GmbH, Munich
100
10
Weiss Spindeltechnologie GmbH, Schweinfurt 100
Winergy AG, Voerde 100 10
Europe (without Germany) (247 companies)
ComBuild Kommunikations- & Gebäudetechnologie GmbH, Vienna / Austria
100
ETM professional control GmbH, Eisenstadt / Austria 100
Hochquellstrom-Vertriebs GmbH, Vienna / Austria 100
IBS engineering consulting software GmbH, Linz / Austria 100
ITH icoserve technology for healthcare GmbH, Innsbruck / Austria 69
KDAG Beteiligungen GmbH, Vienna / Austria 100
Landis & Staefa (Österreich) GmbH, Vienna / Austria 100
Landis & Staefa GmbH, Vienna / Austria 100
Saudi VOEST-ALPINE GmbH, Linz / Austria 100
SIELOG Systemlogik GmbH, Vienna / Austria 76
Siemens Aktiengesellschaft Österreich, Vienna / Austria 100
Siemens Convergence Creators GmbH, Eisenstadt / Austria 100
Siemens Convergence Creators GmbH, Vienna / Austria 100 7
Siemens Convergence Creators Holding GmbH, Vienna / Austria
100
1 Control due to a majority of voting rights.
2 Control due to contractual arrangements.
3 Control due to economic circumstances.
4 No control due to contractual arrangements or legal circumstances.
5 No significant influence due to contractual arrangements or legal circumstances.
6 Significant influence due to contractual arrangements or legal circumstances.
7 Not consolidated due to immateriality.
8 Not accounted for using the equity method due to immateriality.
9 Exemption pursuant to Section 264 b, HGB.
10 Exemption pursuant to Section 264 (3) HGB.

135 D. Consolidated Financial Statements 239 E. Additional Information
140 D.5 Consolidated Statements of Changes in Equity 142 D.6 Notes to Consolidated Financial Statements 232 D.7 Supervisory Board and Managing Board
136 D.1 Consolidated Statements of Income 137 D.2 Consolidated Statements of Comprehensive Income 138 D.3 Consolidated Statements of Financial Position 139 D.4 Consolidated Statements of Cash Flow
221
September 30, 2012 Equity interest in %
Siemens Gebäudemanagement & -Services G.m.b.H., Vienna / Austria
100
Siemens Healthcare Diagnostics GmbH, Vienna / Austria 100
Siemens Industry Software GmbH, Linz / Austria 100
Siemens Konzernbeteiligungen GmbH, Vienna / Austria 100
Siemens Liegenschaftsverwaltung GmbH, Vienna / Austria 100
Siemens Mitarbeitervorsorgekasse AG, Vienna / Austria 100
Siemens Pensionskasse AG, Vienna / Austria 100
Siemens Personaldienstleistungen GmbH, Vienna / Austria 100
Siemens Urban Rail Technologies Holding GmbH, Vienna / Austria 100
Siemens VAI Metals Technologies GmbH, Linz / Austria 100
Siteco Lighting Austria GmbH, Vienna / Austria 100
Siteco Österreich GmbH, Vienna / Austria 100
Steiermärkische Medizinarchiv GesmbH, Graz / Austria 52
Trench Austria GmbH, Leonding / Austria 100
VVK Versicherungs-Vermittlungs- und Verkehrs-Kontor GmbH, Vienna / Austria
100
Oktopus S.A. / N.V., Brussels / Belgium 100
Siemens Healthcare Diagnostics SA, Brussels / Belgium 100
Siemens Healthcare Diagnostics Services Sprl, Brussels / Belgium 100
Siemens Industry Software NV, Anderlecht / Belgium 100
Siemens Product Lifecycle Management Software II (BE) BVBA, Anderlecht / Belgium
100
Siemens S.A. / N.V., Anderlecht / Belgium 100
Siteco Lighting Benelux BVBA, Eupen / Belgium 100
VRcontext International S.A., Brussels / Belgium 100
OSRAM d.o.o., Mostar / Bosnia and Herzegovina 100
Siemens d.o.o., Banja Luka / Bosnia and Herzegovina 100
Siemens d.o.o. Sarajevo, Sarajevo / Bosnia and Herzegovina 100
OSRAM EOOD, Sofia / Bulgaria 100
Security Management Technologies Bulgaria EOOD, Sofia / Bulgaria
100
Siemens EOOD, Sofia / Bulgaria 100
DPC d.o.o. – u likvidaciji, Zagreb / Croatia 100 7
Koncar Power Transformers Ltd., Zagreb / Croatia 51
OSRAM d.o.o., Zagreb / Croatia 100
Siemens d.d., Zagreb / Croatia 98
J. N. Kelly Security Holding Limited, Larnaka / Cyprus 100
Kintec Cyprus Ltd, Larnaka / Cyprus 100
ANF DATA spol. s r.o., Prague / Czech Republic 100
OEZ s.r.o., Letohrad / Czech Republic 100
OSRAM Ceská republika s.r.o., Bruntál / Czech Republic 100
Siemens Audiologická Technika s.r.o., Prague / Czech Republic 100
Siemens Convergence Creators, s.r.o., Prague / Czech Republic 100
September 30, 2012 Equity interest in %
Siemens Electric Machines s.r.o., Drasov / Czech Republic 100
Siemens Industry Software, s.r.o., Prague / Czech Republic 100
Siemens, s.r.o., Prague / Czech Republic 100
Siteco Lighting, spol. s r.o., Prague / Czech Republic 100
OSRAM A / S, Taastrup / Denmark 100
Siemens A / S, Ballerup / Denmark 100
Siemens Healthcare Diagnostics ApS, Ballerup / Denmark 100
Siemens Höreapparater A / S, Copenhagen / Denmark 100
Siemens Industry Software A / S, Allerød / Denmark 100
Siemens Wind Power A / S, Brande / Denmark 100
OY OSRAM AB, Espoo / Finland 100
Siemens Healthcare Diagnostics OY, Espoo / Finland 100
Siemens Osakeyhtiö, Espoo / Finland 100
Flender-Graffenstaden SAS, Illkirch-Graffenstaden / France 100
OSRAM S.A.S.U., Molsheim / France 100
PETNET Solutions SAS, Saint-Denis / France 100
Siemens Audiologie S.A.S., Saint-Denis / France 100
Siemens Financial Services SAS, Saint-Denis / France 100
Siemens France Holding, Saint-Denis / France 100
Siemens Healthcare Diagnostics S.A.S., Saint-Denis / France 100
Siemens Industry Software SAS, Vélizy-Villacoublay / France 100
Siemens Lease Services SAS, Saint-Denis / France 100
Siemens S.A.S., Saint-Denis / France 100
Siemens Transmission & Distribution SAS, Grenoble / France 100
Siemens VAI Metals Technologies SAS, Savigneux / France 100
Trench France S.A.S., Saint-Louis / France 100
Tecnomatix Technologies (Gibraltar) Limited, Gibraltar / Gibraltar 100
Broadcastle Bank Limited, Stoke Poges, Buckinghamshire / Great Britain
100
Broadcastle Ltd., Stoke Poges, Buckinghamshire / Great Britain 100
Electrium Sales Limited, Frimley, Surrey / Great Britain 100
eMeter International Limited, Reading, Berkshire / Great Britain 100
GyM Renewables Limited, Frimley, Surrey / Great Britain 100
GyM Renewables ONE Limited, Frimley, Surrey / Great Britain 100
Marine Current Turbines Limited, Frimley, Surrey / Great Britain 100
OSRAM Ltd., Langley, Berkshire / Great Britain 100
OSRAM UK Pension Scheme Limited, Langley, Berkshire / Great Britain
100
Sea Generation (Brough Ness) Limited, Frimley, Surrey / Great Britain
100
Sea Generation (Kyle Rhea) Limited, Frimley, Surrey / Great Britain
100
Sea Generation (Wales) Ltd., Frimley, Surrey / Great Britain 100
Sea Generation Limited, Frimley, Surrey / Great Britain 100
1 Control due to a majority of voting rights.
2 Control due to contractual arrangements.
3 Control due to economic circumstances.
4 No control due to contractual arrangements or legal circumstances.
5 No significant influence due to contractual arrangements or legal circumstances.
6 Significant influence due to contractual arrangements or legal circumstances.
7 Not consolidated due to immateriality.
8 Not accounted for using the equity method due to immateriality.
9 Exemption pursuant to Section 264 b, HGB.
10 Exemption pursuant to Section 264 (3) HGB.

1 A. To our Shareholders 49 C. Combined Management Report 21 B. Corporate Governance222
September 30, 2012 Equity interest in %
Siemens Financial Services Holdings Ltd., Stoke Poges, Buckinghamshire / Great Britain
100
Siemens Financial Services Ltd., Stoke Poges, Buckinghamshire / Great Britain
100
Siemens Healthcare Diagnostics Ltd., Frimley, Surrey / Great Britain
100
Siemens Healthcare Diagnostics Manufacturing Ltd, Frimley, Surrey / Great Britain
100
Siemens Healthcare Diagnostics Products Ltd, Frimley, Surrey / Great Britain
100
Siemens Hearing Instruments Ltd., Crawley, Sussex / Great Britain
100
Siemens Holdings plc, Frimley, Surrey / Great Britain 100
Siemens Industrial Turbomachinery Ltd., Frimley, Surrey / Great Britain
100
Siemens Industry Software Limited, Frimley, Surrey / Great Britain
100
Siemens plc, Frimley, Surrey / Great Britain 100
Siemens Protection Devices Limited, Frimley, Surrey / Great Britain
100
Siemens Real Estate Ltd., Frimley, Surrey / Great Britain 100
Siemens Transmission & Distribution Limited, Frimley, Surrey / Great Britain
100
Siemens VAI Metals Technologies Limited, Sheffield, South Yorkshire / Great Britain
100
Siteco Ltd., Stockport / Great Britain 100
Trench (UK) Ltd., Hebburn, Tyne & Wear / Great Britain 100
Tronic Ltd., Frimley, Surrey / Great Britain 100
VA TECH (UK) Ltd., Frimley, Surrey / Great Britain 100
VA Tech Reyrolle Distribution Ltd., Frimley, Surrey / Great Britain 100
VA TECH T & D UK Ltd., Frimley, Surrey / Great Britain 100
VTW Anlagen UK Ltd., Banbury, Oxfordshire / Great Britain 100
Kintec A.E., Athens / Greece 100
OSRAM A.E., Athens / Greece 100
Siemens A.E., Elektrotechnische Projekte und Erzeugnisse, Athens / Greece
100
Siemens Healthcare Diagnostics ABEE, Athens / Greece 100
evosoft Hungary Szamitastechnikai Kft., Budapest / Hungary 100
Siemens Audiológiai Technika Kereskedelmi és Szolgáltató Korlátolt Felelösségü Társaság, Budapest / Hungary
100
Siemens PSE Program- és Rendszerfejlesztö Kft., Budapest / Hungary
100
Siemens Zrt., Budapest / Hungary 100
Europlex Technologies (Ireland) Limited, Dublin / Ireland 100
September 30, 2012 Equity interest in %
iMetrex Technologies Limited, Dublin / Ireland 100
Siemens Healthcare Diagnostics Manufacturing Limited, Swords, Co. Dublin / Ireland
100
7
Siemens Limited, Dublin / Ireland 100
Siemens Medical Solutions Diagnostics Europe Limited, Swords, Co. Dublin / Ireland
100
HV-Turbo Italia S.r.l., Mornago / Italy 51
OSRAM S.p.A. – Società Riunite OSRAM Edison Clerici, Milan / Italy
100
Siemens Healthcare Diagnostics S.r.l., Milan / Italy 100
Siemens Hearing Instruments Italy S.r.l., Milan / Italy 100
Siemens Industry Software S.r.l, Milan / Italy 100
Siemens Renting S.p.A. in Liquidazione, Milan / Italy 100
Siemens S.p.A., Milan / Italy 100
Siemens Transformers S.p.A., Trento / Italy 100
Siemens VAI Metals Technologies S.r.l., Marnate / Italy 100
Siteco Lighting Systems S.r.I., Milan / Italy 100
Trench Italia S.r.l., Savona / Italy 100
TurboCare S.p.A., Turin / Italy 100
UAB IBS Baltic, Kaunas / Lithuania 81
Tecnomatix Technologies SARL, Luxembourg / Luxembourg 100
TFM International S.A. i.L., Luxembourg / Luxembourg 100
Siemens d.o.o. Podgorica, Podgorica / Montenegro 100
NEM Energy B.V., Leiden / Netherlands 100
NEM Energy Holding B.V., The Hague / Netherlands 100
NEM Energy Services B.V., Hengelo / Netherlands 100
NEM Standard Fasel Manufacturing B.V., Hengelo / Netherlands 100
NEM Standard Fasel Tools 4 Rent B.V., Hengelo / Netherlands 100
OSRAM Benelux B.V., Capelle aan den IJssel / Netherlands 100
Powerspex Instrumentation B.V., Hengelo / Netherlands 100
Siemens Audiologie Techniek B.V., The Hague / Netherlands 100
Siemens Diagnostics Holding II B.V., The Hague / Netherlands 100
Siemens Finance B.V., The Hague / Netherlands 100
Siemens Financieringsmaatschappij N.V., The Hague / Netherlands
100
Siemens Gas Turbine Technologies Holding B.V., The Hague / Netherlands
65
Siemens Healthcare Diagnostics B.V., Amersfoort / Netherlands 100
Siemens Industry Software B.V., s-Hertogenbosch / Netherlands 100
Siemens International Holding B.V., The Hague / Netherlands 100
Siemens Medical Solutions Diagnostics Holding I B.V., The Hague / Netherlands
100
Siemens Nederland N.V., The Hague / Netherlands 100
Siemens Train Technologies Holding B.V., The Hague / Netherlands
51
1 Control due to a majority of voting rights.
2 Control due to contractual arrangements.
3 Control due to economic circumstances.
4 No control due to contractual arrangements or legal circumstances.
5 No significant influence due to contractual arrangements or legal circumstances.
6 Significant influence due to contractual arrangements or legal circumstances.
7 Not consolidated due to immateriality.
8 Not accounted for using the equity method due to immateriality.
9 Exemption pursuant to Section 264 b, HGB.
10 Exemption pursuant to Section 264 (3) HGB.

135 D. Consolidated Financial Statements 239 E. Additional Information
140 D.5 Consolidated Statements of Changes in Equity 142 D.6 Notes to Consolidated Financial Statements 232 D.7 Supervisory Board and Managing Board
136 D.1 Consolidated Statements of Income 137 D.2 Consolidated Statements of Comprehensive Income 138 D.3 Consolidated Statements of Financial Position 139 D.4 Consolidated Statements of Cash Flow
223
September 30, 2012 Equity interest in %
Standard Fasel B.V. (NEM Standard Fasel Boiler Services), Utrecht / Netherlands
100
TurboCare B.V., Hengelo / Netherlands 100
Matre Instruments AS, Rubbestadneset / Norway 100
OSRAM AS, Lysaker / Norway 100
Poseidon Consulting Services AS, Stavanger / Norway 100
Siemens AS, Oslo / Norway 100
Siemens Healthcare Diagnostics AS, Oslo / Norway 100
Siemens Höreapparater AS, Oslo / Norway 100
Siteco Belysning AS, Oslo / Norway 100
Audio SAT Sp. z o.o., Poznan / Poland 100
OSRAM Sp. z o.o., Warsaw / Poland 100
Siemens Finance Sp. z o.o., Warsaw / Poland 100
Siemens Industry Software Sp. z o.o., Warsaw / Poland 100
Siemens Sp. z o.o., Warsaw / Poland 100
Siteco Lighting Poland Sp. z o.o., Warsaw / Poland 100
TurboCare Poland Spólka Akcyjna, Lubliniec / Poland 100
TurboCare Sp. z o.o., Wroclaw / Poland 80
OSRAM Empresa de Aparelhagem Eléctrica Lda., Lisbon / Portugal 100
Siemens Healthcare Diagnostics, Unipessoal Lda., Amadora / Portugal
100
Siemens S.A., Amadora / Portugal 100
OSRAM Romania S.R.L., Voluntari / Romania 100
SIEMENS (AUSTRIA) PROIECT SPITAL COLTEA SRL, Bucharest / Romania
100
Siemens Program and System Engineering S.R.L., Brasov / Romania
100
Siemens S.R.L., Bucharest / Romania 100
SIMEA SIBIU S.R.L., Sibiu / Romania 100
OAO OSRAM, Smolensk / Russian Federation 99
OOO Legion II, Moscow / Russian Federation 100
OOO Legion T2, Moscow / Russian Federation 100
OOO Russian Turbo Machinery, Perm / Russian Federation 51
OOO Siemens, Moscow / Russian Federation 100
OOO Siemens Gas Turbine Technologies, Novoe Devyatkino / Russian Federation
100
OOO Siemens High Voltage Products, Ufimsky District / Russian Federation
100
OOO Siemens Train Technologies, Verkhnyaya Pyshma / Russian Federation
100
OOO Siemens Transformers, Voronezh / Russian Federation 100
OOO Siemens Urban Rail Technologies, Moscow / Russian Federation
100
OOO Siteco, Moscow / Russian Federation 100
September 30, 2012 Equity interest in %
Siemens Elektroprivod LLC, St. Petersburg / Russian Federation 66
Siemens Finance LLC, Vladivostok / Russian Federation 100
Siemens Industry Software, OOO, Moscow / Russian Federation 100
Siemens Research Center Limited Liability Company, Moscow / Russian Federation
100
OSRAM d.o.o., Belgrade / Serbia 100
Siemens d.o.o. Beograd, Belgrade / Serbia 100
OEZ Slovakia, spol. s r.o., Bratislava / Slovakia 100
OSRAM, a.s., Nové Zámky / Slovakia 100
SAT Systémy automatizacnej techniky spol. s.r.o., Bratislava / Slovakia
60
Siemens Program and System Engineering s.r.o., Bratislava / Slovakia
100
Siemens s.r.o., Bratislava / Slovakia 100
SIPRIN s.r.o., Bratislava / Slovakia 100
Siemens d.o.o., Ljubljana / Slovenia 100
Siteco Sistemi d.o.o., Maribor / Slovenia 100
Fábrica Electrotécnica Josa, S.A., Barcelona / Spain 100
OSRAM S.A., Madrid / Spain 100
Petnet Soluciones, S.L., Sociedad Unipersonal, Madrid / Spain 100
Siemens Fire & Security Products, S.A., Madrid / Spain 100
Siemens Healthcare Diagnostics S.L., Barcelona / Spain 100
Siemens Holding S.L., Madrid / Spain 100
Siemens Industry Software S.L., Barcelona / Spain 100
Siemens Renting S.A., Madrid / Spain 100
Siemens S.A., Madrid / Spain 100
Siteco Lighting, S.L.U., Madrid / Spain 100
Telecomunicación, Electrónica y Conmutación S.A., Madrid / Spain 100
OSRAM AB, Stockholm / Sweden 100
Siemens AB, Upplands Väsby / Sweden 100
Siemens Financial Services AB, Stockholm / Sweden 100
Siemens Healthcare Diagnostics AB, Södertälje / Sweden 100
Siemens Industrial Turbomachinery AB, Finspong / Sweden 100
Siemens Industry Software AB, Kista / Sweden 100
Dade Behring Diagnostics AG, Düdingen / Switzerland 100
Huba Control AG, Würenlos / Switzerland 100
OSRAM AG, Winterthur / Switzerland 100
Siemens Audiologie AG, Adliswil / Switzerland 100
Siemens Fuel Gasification Technology Holding AG, Zug / Switzerland
100
Siemens Healthcare Diagnostics AG, Zurich / Switzerland 100
Siemens Industry Software AG, Zurich / Switzerland 100
Siemens Power Holding AG, Zug / Switzerland 100
Siemens Schweiz AG, Zurich / Switzerland 100
Siteco Schweiz AG, Bern / Switzerland 100
1 Control due to a majority of voting rights.
2 Control due to contractual arrangements.
3 Control due to economic circumstances.
4 No control due to contractual arrangements or legal circumstances.
5 No significant influence due to contractual arrangements or legal circumstances.
6 Significant influence due to contractual arrangements or legal circumstances.
7 Not consolidated due to immateriality.
8 Not accounted for using the equity method due to immateriality.
9 Exemption pursuant to Section 264 b, HGB.
10 Exemption pursuant to Section 264 (3) HGB.

1 A. To our Shareholders 49 C. Combined Management Report 21 B. Corporate Governance224
September 30, 2012 Equity interest in %
Stadt / Land Immobilien AG, Zurich / Switzerland 100
OSRAM Ampul Ticaret A.S., Istanbul / Turkey 100
Siemens Finansal Kiralama A.S., Istanbul / Turkey 100
Siemens Healthcare Diagnostik Ticaret Limited Sirketi, Istanbul / Turkey
100
Siemens Sanayi ve Ticaret A.S., Istanbul / Turkey 100
Siteco Aydinlatma Teknigi Tic. Ve San. Ltd. Sti., Istanbul / Turkey 100
100 % foreign owned subsidiary “Siemens Ukraine”, Kiev / Ukraine 100
Enterprise with 100 % foreign investment “Osram Ukraine”, Kiev / Ukraine
100
America (122 companies)
OSRAM Argentina S.A.C.I., Buenos Aires / Argentina 100
Siemens IT Services S.A., Buenos Aires / Argentina 100
Siemens S.A., Buenos Aires / Argentina 100
VA TECH International Argentina SA, Buenos Aires / Argentina 100
Siemens Soluciones Tecnologicas S.A., Santa Cruz de la Sierra / Bolivia
100
Active Tecnologia em Sistemas de Automacao Ltda, Vila Assuncao / Brazil
100
Chemtech Servicos de Engenharia e Software Ltda., Rio de Janeiro / Brazil
100
innotec do Brasil Ltda., São Paulo / Brazil 100
Iriel Indústria Cómercio de Sistemas Eléctricos Ltda., Canoas / Brazil 100
OSRAM do Brasil Lampadas Elétricas Ltda., Osasco / Brazil 100
Senergy Sistemas de Medição S / A, Belo Horizonte / Brazil 100
Siemens Aparelhos Auditivos Ltda., São Paulo / Brazil 100 7
Siemens Eletroeletronica Limitada, Manaus / Brazil 100
Siemens Healthcare Diagnósticos Ltda., São Paulo / Brazil 100
Siemens Industry Software Ltda., São Caetano do Sul / Brazil 100
Siemens Ltda., São Paulo / Brazil 100
Siemens Serviços em Equipamentos Submarinos Ltda., Niterói, Rio de Janeiro / Brazil
100
Siemens VAI Metals Services Ltda., Volta Redonda / Brazil 100
VAI – INGDESI Automation Ltda., Belo Horizonte / Brazil 100
Dade Behring Hong Kong Holdings Corporation, Tortola / British Virgin Islands
100
8264716 Canada Limited, Burlington, Ontario / Canada 100
ENCELIUM TECHNOLOGIES Unlimited liability company, Vancouver, British Columbia / Canada
100
OSRAM Sylvania Ltd., Mississauga, Ontario / Canada 100
Prairie West Technical Services, Ltd., Regina, Saskatchewan / Canada
100
RuggedCom Inc., Concord, Ontario / Canada 100
Siemens Canada Ltd., Burlington, Ontario / Canada 100
September 30, 2012 Equity interest in %
Siemens Financial Ltd., Mississauga, Burlington, Ontario / Canada
100
Siemens Hearing Instruments Inc., Burlington, Ontario / Canada 100
Siemens Industry Software Ltd., Mississauga, Ontario / Canada 100
Siemens Transformers Canada Inc., Trois-Rivières, Quebec / Canada
100
Trench Ltd., Saint John, New Brunswick / Canada 100
Turbocare Canada Ltd., Calgary, Alberta / Canada 100
Wheelabrator Air Pollution Control (Canada) Inc., Burlington, Ontario / Canada
100
Siemens Healthcare Diagnostics Manufacturing Limited, George Town / Cayman Islands
100
Venture Strategy Cayman Partners L.P., George Town / Cayman Islands
99
3
OSRAM Chile Ltda., Santiago de Chile / Chile 100
Siemens S.A., Santiago de Chile / Chile 100
OSRAM de Colombia Iluminaciones S.A., Bogotá / Colombia 100
Siemens Manufacturing S.A., Bogotá / Colombia 100
Siemens S.A., Bogotá / Colombia 100
Siemens Healthcare Diagnostics S.A., San José / Costa Rica 51
Siemens S.A., San José / Costa Rica 100
Siemens, S.R.L., Santo Domingo / Dominican Republic 100
OSRAM del Ecuador S.A., Guayaquil / Ecuador 100
Siemens S.A., Quito / Ecuador 100
Siemens S.A., San Salvador / El Salvador 100
SIEMENS HEALTHCARE DIAGNOSTICS GUATEMALA, S.A., Guatemala City / Guatemala
99
Siemens S.A., Guatemala City / Guatemala 100
Siemens S.A., Tegucigalpa / Honduras 100
Dade Behring, S.A. de C.V., Mexico City / Mexico 100
Grupo Siemens S.A. de C.V., Mexico City / Mexico 100
Indústria de Trabajos Eléctricos S.A. de C.V., Ciudad Juárez / Mexico
100
Industrias OSRAM de México S.A., Tultitlán / Mexico 100
Ingdesi S.A. de C.V., Monterrey / Mexico 100
OSRAM de México S.A. de C.V., Tultitlán / Mexico 100
OSRAM S.A. de C.V., Tultitlán / Mexico 100
Proyectos de Energia S.A. de C.V., Mexico City / Mexico 100
Siemens Healthcare Diagnostics, S. de R.L. de C.V., Mexico City / Mexico
100
Siemens Industry Software, SA de CV, Santa Fe / Mexico 100
Siemens Inmobiliaria S.A. de C.V., Mexico City / Mexico 100
Siemens Innovaciones S.A. de C.V., Mexico City / Mexico 100
Siemens Medical Solutions Diagnostics S. de R.L. de C.V., Mexico City / Mexico
100
1 Control due to a majority of voting rights.
2 Control due to contractual arrangements.
3 Control due to economic circumstances.
4 No control due to contractual arrangements or legal circumstances.
5 No significant influence due to contractual arrangements or legal circumstances.
6 Significant influence due to contractual arrangements or legal circumstances.
7 Not consolidated due to immateriality.
8 Not accounted for using the equity method due to immateriality.
9 Exemption pursuant to Section 264 b, HGB.
10 Exemption pursuant to Section 264 (3) HGB.

135 D. Consolidated Financial Statements 239 E. Additional Information
140 D.5 Consolidated Statements of Changes in Equity 142 D.6 Notes to Consolidated Financial Statements 232 D.7 Supervisory Board and Managing Board
136 D.1 Consolidated Statements of Income 137 D.2 Consolidated Statements of Comprehensive Income 138 D.3 Consolidated Statements of Financial Position 139 D.4 Consolidated Statements of Cash Flow
225
September 30, 2012 Equity interest in %
Siemens Servicios S.A. de C.V., Mexico City / Mexico 100
Siemens, S.A. de C.V., Mexico City / Mexico 100
Siemens S.A., Managua / Nicaragua 100
Siemens Healthcare Diagnostics Panama, S.A, Panama City / Panama
100
Siemens S.A., Panama City / Panama 100
OSRAM de Perú S.A.C., Lima / Peru 100
Siemens S.A.C., Lima / Peru 100
Siemens S.A., Montevideo / Uruguay 100
Siemens Telecomunicaciones S.A., Montevideo / Uruguay 100
Audiology Distribution, LLC, Palm Beach Gardens, FL / USA 100
EMeter Corporation, Foster City, CA / USA 100
FCE International, LLC, Huntington Valley, PA / USA 100
HearX West LLC, West Palm Beach, FL / USA 50 2
HearX West, Inc., West Palm Beach, FL / USA 100
IBS America, Inc., Lexington, MA / USA 100
Mannesmann Corporation, New York, NY / USA 100
NEM USA Corp., Greenville, SC / USA 100
Nimbus Technologies, LLC, Plano, TX / USA 100
OSRAM Opto Semiconductors, Inc., Sunnyvale, CA / USA 100
OSRAM SYLVANIA INC., Danvers, MA / USA 100
OSRAM Sylvania Puerto Rico Corp., Luquillo, PR / USA 100
Pace Global, LLC, Fairfax, VA / USA 100
P.E.T.NET Houston, LLC, Knoxville, TN / USA 51
PETNET Indiana LLC, Indianapolis, IN / USA 50 1
PETNET Solutions Cleveland, LLC, Knoxville, TN / USA 63
PETNET Solutions, Inc., Knoxville, TN / USA 100
RuggedCom (USA) Inc., Hollywood, FL / USA 100
Siemens Capital Company LLC, Iselin, NJ / USA 100
Siemens Corporation, Washington, D.C. / USA 100
Siemens Credit Warehouse, Inc., Iselin, NJ / USA 100
Siemens Demag Delaval Turbomachinery, Inc., Hamilton, NJ / USA
100
Siemens Diagnostics Finance Co. LLC, Deerfield, IL / USA 100
Siemens Electrical, LLC, Alpharetta, GA / USA 100
Siemens Energy, Inc., Orlando, FL / USA 100
Siemens Financial Services, Inc., Iselin, NJ / USA 100
Siemens Financial, Inc., Iselin, NJ / USA 100
Siemens Fossil Services, Inc., Orlando, FL / USA 100
Siemens Generation Services Company, Orlando, FL / USA 100
Siemens Government Technologies, Inc., Arlington, VA / USA 100
Siemens Healthcare Diagnostics Inc., Tarrytown, NY / USA 100
Siemens Hearing Instruments, Inc., Piscataway, NJ / USA 100
Siemens Industry, Inc., Buffalo Grove, IL / USA 100
Siemens Medical Solutions USA, Inc., Malvern, PA / USA 100
September 30, 2012 Equity interest in %
Siemens Molecular Imaging, Inc., Knoxville, TN / USA 100
Siemens Power Generation Service Company, Ltd., Orlando, FL / USA
100
Siemens Product Lifecycle Management Software II (US) Inc., Plano, TX / USA
100
Siemens Product Lifecycle Management Software Inc., Plano, TX / USA
100
Siemens Public, Inc., Wilmington, DE / USA 100
Siemens Treated Water Outsourcing Corp., Rockford, IL / USA 100
Siemens USA Holdings, Inc., New York, NY / USA 100
SMI Holding LLC, New York, NY / USA 100
Sylvania Lighting Services Corp., Danvers, MA / USA 100
Transport & Distribution Inc., Danvers, MA / USA 100
Traxon Supply USA Inc., East Rutherford, NJ / USA 100
TurboCare, Inc., Chicopee, MA / USA 100
Wheelabrator Air Pollution Control Inc., Pittsburgh, PA / USA 100
Winergy Drive Systems Corporation, Elgin, IL / USA 100
Siemens Healthcare Diagnostics C.A., Caracas / Venezuela 100
Siemens S.A., Caracas / Venezuela 100
TurboCare C.A., Caracas / Venezuela 100
Asia (163 companies)
Siemens W.L.L., Manama / Bahrain 51
Siemens Bangladesh Ltd., Dhaka / Bangladesh 100
Beijing Siemens Cerberus Electronics Ltd., Beijing / China 100
Chengdu KK & K Power Fan Co., Ltd., Chengdu / China 51
Chung Tak Lighting Control Systems (Guangzhou) Ltd., Guangzhou / China
59
DPC (Tianjin) Co., Ltd., Tianjin / China 100
GIS Steel & Aluminum Products Co., Ltd. Hangzhou, Hangzhou / China
51
IBS Industrial Business Software (Shanghai), Ltd., Shanghai / China 100
MWB (Shanghai) Co Ltd., Shanghai / China 65
OSRAM China Lighting Ltd., Foshan / China 90
OSRAM Kunshan Display Optic Co. Ltd., Kunshan / China 100
RuggedCom (China) Communications Technology and Development Co. Ltd., Changzhou / China
100
Siemens Building Technologies (Tianjin) Ltd., Tianjin / China 70
Siemens Business Information Consulting Co.,Ltd, Beijing / China
100
Siemens Circuit Protection Systems Ltd., Shanghai / China 75
Siemens Electrical Apparatus Ltd., Suzhou / China 100
Siemens Electrical Drives (Shanghai) Ltd., Shanghai / China 100
Siemens Electrical Drives Ltd., Tianjin / China 85
Siemens Factory Automation Engineering Ltd., Beijing / China 68
1 Control due to a majority of voting rights.
2 Control due to contractual arrangements.
3 Control due to economic circumstances.
4 No control due to contractual arrangements or legal circumstances.
5 No significant influence due to contractual arrangements or legal circumstances.
6 Significant influence due to contractual arrangements or legal circumstances.
7 Not consolidated due to immateriality.
8 Not accounted for using the equity method due to immateriality.
9 Exemption pursuant to Section 264 b, HGB.
10 Exemption pursuant to Section 264 (3) HGB.

1 A. To our Shareholders 49 C. Combined Management Report 21 B. Corporate Governance226
September 30, 2012 Equity interest in %
Siemens Finance and Leasing Ltd., Beijing / China 100
Siemens Financial Services Ltd., Beijing / China 100
Siemens Gas Turbine Parts Ltd., Shanghai / China 51
Siemens Healthcare Diagnostics (Shanghai) Co., Ltd., Shanghai / China
100
Siemens Hearing Instruments (Suzhou) Co. Ltd., Suzhou / China
100
Siemens High Voltage Circuit Breaker Co., Ltd., Hangzhou / China
51
Siemens High Voltage Switchgear Co., Ltd. Shanghai, Shanghai / China
51
Siemens High Voltage Switchgear Guangzhou Ltd., Guangzhou / China
94
Siemens Industrial Automation Ltd., Shanghai, Shanghai / China 90
Siemens Industrial Turbomachinery (Huludao) Co. Ltd., Huludao / China
84
Siemens Industry Software (Shanghai) Co., Ltd., Shanghai / China 100
Siemens International Trading Ltd., Shanghai, Shanghai / China 100
Siemens Ltd., China, Beijing / China 100
Siemens Manufacturing and Engineering Centre Ltd., Shanghai / China
51
Siemens Mechanical Drive Systems (Tianjin) Co., Ltd., Tianjin / China
100
Siemens Medical Solutions Diagnostics Ltd., Beijing / China 100
Siemens Medium Voltage Switching Technologies (Wuxi) Ltd., Wuxi / China
85
Siemens Numerical Control Ltd., Nanjing / China 80
Siemens PLM Software (Shenzhen) Limited, Shenzhen / China 100
Siemens Power Automation Ltd., Nanjing / China 100
Siemens Power Equipment Packages Co. Ltd., Shanghai, Shanghai / China
65
Siemens Power Plant Automation Ltd., Nanjing / China 100
Siemens Process Analytics Co. Ltd., Shanghai, Shanghai / China 100
Siemens Real Estate Management (Beijing) Ltd., Co., Beijing / China
100
Siemens Sensors & Communication Ltd., Dalian / China 100
Siemens Shanghai Medical Equipment Ltd., Shanghai / China 100
Siemens Shenzhen Magnetic Resonance Ltd., Shenzhen / China 100
Siemens Signalling Co. Ltd., Xi'an, Xian / China 70
Siemens Special Electrical Machines Co. Ltd., Changzhi / China 77 7
Siemens Standard Motors Ltd., Jiangsu, Yizheng / China 100
Siemens Surge Arresters Ltd., Wuxi / China 100
Siemens Switchgear Co. Ltd., Shanghai / China 55
Siemens Technology Development (Beijing) Ltd. Corp., Beijing / China
90
September 30, 2012 Equity interest in %
Siemens Transformer (Guangzhou) Co., Ltd., Guangzhou / China
63
Siemens Transformer (Jinan) Company Ltd., Jinan / China 90
Siemens Transformer (Wuhan) Company Ltd., Wuhan City / China
100
Siemens VAI Manufacturing (Taicang) Co., Ltd., Taicang / China 100
Siemens VAI Metals Technologies Co., Ltd., Shanghai, Shanghai / China
100
Siemens Water Technologies and Engineering (Tianjin) Co., Ltd., Tianjin / China
68
Siemens Water Technologies Ltd., Beijing / China 100
Siemens Wind Power Blades (Shanghai) Co., Ltd., Shanghai / China
100
Siemens Wind Power Turbines (Shanghai) Co. Ltd., Shanghai / China
100
Siemens Wiring Accessories Shandong Ltd., Zibo / China 100
Siemens X-Ray Vacuum Technology Ltd., Wuxi / China 100
Sunny World (Shaoxing) Green Lighting Co., Ltd., Shaoxing / China
100
Trench High Voltage Products Ltd., Shenyang, Shenyang / China 65
Winergy Drive Systems (Tianjin) Co. Ltd., Tianjin / China 100
Yangtze Delta Manufacturing Co. Ltd., Hangzhou, Hangzhou / China
51
Asia Care Holding Limited, Hong Kong / Hong Kong 100 7
OSRAM Asia Pacific Ltd., Hong Kong / Hong Kong 100
OSRAM Holding Company Ltd., Hong Kong / Hong Kong 100
OSRAM Hong Kong Ltd, Hong Kong / Hong Kong 100
OSRAM Lighting Control Systems Ltd., Hong Kong / Hong Kong 65
OSRAM Opto Semiconductors Asia Ltd., Hong Kong / Hong Kong 100
Siemens Healthcare Diagnostics Limited, Hong Kong / Hong Kong 100
Siemens Industry Software Limited, Hong Kong / Hong Kong 100
Siemens Ltd., Hong Kong / Hong Kong 100
Siemens Water Technologies International Sales Ltd., Hong Kong / Hong Kong
100
Traxon Technologies Ltd., Hong Kong / Hong Kong 100
eMeter India Pvt. Ltd., New Delhi / India 100
Morgan Construction Company India Private Limited, Mumbai / India
100
OSRAM Automotive Lamps Private Limited, Bengaluru / India 100
OSRAM India Pvt. Ltd., Gurgaon / India 100
PETNET Radiopharmaceutical Solutions Pvt. Ltd., New Delhi / India
100
Powerplant Performance Improvement Ltd., New Delhi / India 50 1
Siemens Financial Services Private Limited, Mumbai / India 100
Siemens Hearing Instruments Pvt. Ltd., Bengaluru / India 100
1 Control due to a majority of voting rights.
2 Control due to contractual arrangements.
3 Control due to economic circumstances.
4 No control due to contractual arrangements or legal circumstances.
5 No significant influence due to contractual arrangements or legal circumstances.
6 Significant influence due to contractual arrangements or legal circumstances.
7 Not consolidated due to immateriality.
8 Not accounted for using the equity method due to immateriality.
9 Exemption pursuant to Section 264 b, HGB.
10 Exemption pursuant to Section 264 (3) HGB.

135 D. Consolidated Financial Statements 239 E. Additional Information
140 D.5 Consolidated Statements of Changes in Equity 142 D.6 Notes to Consolidated Financial Statements 232 D.7 Supervisory Board and Managing Board
136 D.1 Consolidated Statements of Income 137 D.2 Consolidated Statements of Comprehensive Income 138 D.3 Consolidated Statements of Financial Position 139 D.4 Consolidated Statements of Cash Flow
227
September 30, 2012 Equity interest in %
Siemens Industry Software (India) Private Limited, New Delhi / India
100
Siemens Ltd., Mumbai / India 74
Siemens Nixdorf Information Systems Pvt. Ltd., Mumbai / India 100
Siemens Power Engineering Pvt. Ltd., Gurgaon / India 100
Siemens Technology and Services Private Limited, Mumbai / India
100
Siemens VAI Metals Technologies Private Limited, Mumbai / India
100
Winergy Drive Systems India Pvt. Ltd., Chennai / India 100
P.T. OSRAM Indonesia, Tangerang / Indonesia 100
P.T. Siemens Hearing Instruments, Batam / Indonesia 100
P.T. Siemens Indonesia, Jakarta / Indonesia 100
PT. Siemens Industrial Power, Kota Bandung / Indonesia 60
Siemens Sherkate Sahami (Khass), Teheran / Iran 96
Yekta Setareh Atllas Co. (P.J.S.), Teheran / Iran 100
Robcad Limited, Herzliya / Israel 100
RuggedCom Ltd., Herzliya / Israel 100
Siemens Concentrated Solar Power Ltd., Beit Shemesh / Israel 100
Siemens Industry Software Ltd., Herzliya / Israel 100
Siemens Israel Ltd., Tel Aviv / Israel 100
Siemens Product Lifecycle Management Software 2 (IL) Ltd., Herzliya / Israel
100
UGS Israeli Holdings (Israel) Ltd., Herzliya / Israel 100
Acrorad Co., Ltd., Okinawa / Japan 57
Best Sound K.K., Sagamihara / Japan 93
Mochida Siemens Medical Systems Co., Ltd., Tokyo / Japan 90
OSRAM Ltd., Yokohama / Japan 100
Siemens Healthcare Diagnostics K.K., Tokyo / Japan 100
Siemens Hearing Instruments K.K., Tokyo / Japan 100
Siemens Industry Software K.K., Tokyo / Japan 100
Siemens Japan Holding K.K., Tokyo / Japan 100
Siemens Japan K.K., Tokyo / Japan 100
Siemens Kameda Healthcare IT Systems K.K., Tokyo / Japan 67
Siemens Product Lifecycle Management Software II (JP) K.K., Tokyo / Japan
100
Siemens TOO, Almaty / Kazakhstan 100
OSRAM Korea Co. Ltd., Ansan / Korea 100
Siemens Industry Software Ltd., Seoul / Korea 100
Siemens Ltd. Seoul, Seoul / Korea 100
Siemens PETNET Korea Co. Ltd., Seoul / Korea 100
Siemens Electrical & Electronic Services K.S.C.C., Kuwait City / Kuwait
47
2
Expro Services (Malaysia) SDN. BHD., Kuala Lumpur / Malaysia 100
OSRAM (Malaysia) Sdn. Bhd., Kuala Lumpur / Malaysia 100
September 30, 2012 Equity interest in %
Osram Opto Semiconductors (Malaysia) Sdn Bhd, Penang / Malaysia
100
Reyrolle (Malaysia) Sdn. Bhd., Kuala Lumpur / Malaysia 100
SFL – Boilerinstallations SDN. BHD., Kuala Lumpur / Malaysia
100
Siemens Malaysia Sdn. Bhd., Petaling Jaya / Malaysia 100
Siemens Transportation Turnkey Systems Sdn. Bhd., Petaling Jaya / Malaysia
100
Siteco Lighting Malaysia Sdn. Bhd., Puchong / Malaysia 100
VA TECH Malaysia Sdn.Bhd., Kuala Lumpur / Malaysia 30 2
Siemens L.L.C., Muscat / Oman 51
Siemens Pakistan Engineering Co. Ltd., Karachi / Pakistan 66
Dade Behring Diagnostics Philippines, Inc., Manila / Philippines 100
Siemens Power Operations, Inc., Manila / Philippines 100
Siemens, Inc., Manila / Philippines 100
Siemens W.L.L., Doha / Qatar 40 2
Arabia Electric Ltd. (Equipment), Jeddah / Saudi Arabia 51
ISCOSA Industries and Maintenance Ltd., Riyadh / Saudi Arabia 51
Siemens Ltd., Jeddah / Saudi Arabia 51
VA TECH T & D Co. Ltd., Riyadh / Saudi Arabia 51
Westinghouse Saudi Arabia Ltd., Riyadh / Saudi Arabia 100 7
OSRAM Pte. Ltd., Singapore / Singapore 100
PETNET Solutions Private Limited, Singapore / Singapore 100
RuggedCom Asia Pte. Ltd., Singapore / Singapore 100
Siemens Industry Software Pte. Ltd., Singapore / Singapore 100
Siemens Medical Instruments Pte. Ltd., Singapore / Singapore 100
Siemens Pte. Ltd., Singapore / Singapore 100
OSRAM Taiwan Company Ltd., Taipei / Taiwan 100
Siemens Industry Software (TW) Co., Ltd., Taipei / Taiwan 100
Siemens Ltd., Taipei / Taiwan 100
OSRAM Thailand Co. Ltd., Bangkok / Thailand 100
Siemens Limited, Bangkok / Thailand 99
Siemens Product Lifecycle Management Software (TH) Co. Ltd., Bangkok / Thailand 100
VA TECH Holding (Thailand) Co. Ltd., Bangkok / Thailand 50 2
VA TECH Transmission & Distribution Co. Ltd., Bangkok / Thailand 100
OSRAM Middle East FZE, Dubai / United Arab Emirates 100
SD (Middle East) LLC, Dubai / United Arab Emirates 49 2
Siemens LLC, Abu Dhabi / United Arab Emirates 49 2
Siemens Middle East Limited, Masdar City / United Arab Emirates 100
Siemens Middle East, FZ-LLC, Dubai / United Arab Emirates 100
Siemens Ltd., Ho Chi Minh City / Vietnam 100
1 Control due to a majority of voting rights.
2 Control due to contractual arrangements.
3 Control due to economic circumstances.
4 No control due to contractual arrangements or legal circumstances.
5 No significant influence due to contractual arrangements or legal circumstances.
6 Significant influence due to contractual arrangements or legal circumstances.
7 Not consolidated due to immateriality.
8 Not accounted for using the equity method due to immateriality.
9 Exemption pursuant to Section 264 b, HGB.
10 Exemption pursuant to Section 264 (3) HGB.

1 A. To our Shareholders 49 C. Combined Management Report 21 B. Corporate Governance228
1 Control due to a majority of voting rights.
2 Control due to contractual arrangements.
3 Control due to economic circumstances.
4 No control due to contractual arrangements or legal circumstances.
5 No significant influence due to contractual arrangements or legal circumstances.
6 Significant influence due to contractual arrangements or legal circumstances.
7 Not consolidated due to immateriality.
8 Not accounted for using the equity method due to immateriality.
9 Exemption pursuant to Section 264 b, HGB.
10 Exemption pursuant to Section 264 (3) HGB.
September 30, 2012 Equity interest in %
Africa (32 companies)
ESTEL Rail Automation SPA, Algiers / Algeria 51
Siemens Spa, Algiers / Algeria 100
Siemens S.A., Luanda / Angola 51
Siemens Pty. Ltd., Gaborone / Botswana 100
NEM Energy Egypt LLC, Alexandria / Egypt 100
Siemens Healthcare Diagnostics S.A.E, Cairo / Egypt 100
Siemens Ltd. for Trading, Cairo / Egypt 100
Siemens Technologies S.A.E., Cairo / Egypt 90
Siemens Kenya Ltd., Nairobi / Kenya 100
SCIENTIFIC MEDICAL SOLUTION DIAGNOSTICS S.A.R.L., Casablanca / Morocco
100
Siemens Plant Operations Tahaddart SARL, Tanger / Morocco 100
Siemens S.A., Casablanca / Morocco 100
Siemens Lda., Maputo / Mozambique 100
Siemens Pty. Ltd., Windhoek / Namibia 100
Siemens Ltd., Lagos / Nigeria 100
Comos Industry Solutions (Pty) Ltd, Johannesburg / South Africa 100
Dade Behring South Africa (Pty) Ltd, Randfontein / South Africa
100
Linacre Investments (Pty) Ltd., Kenilworth / South Africa 0 3
Marqott (Proprietory) Limited, Pretoria / South Africa 100
Marqott Holdings (Pty.) Ltd., Pretoria / South Africa 100
OSRAM (Pty.) Ltd., Midrand / South Africa 100
Siemens (Proprietary) Limited, Midrand / South Africa 70
Siemens Building Technologies (Pty) Ltd., Midrand / South Africa
100
Siemens Employee Share Ownership Trust, Johannesburg / South Africa
0
3
Siemens Healthcare Diagnostics (Pty.) Limited, Isando / South Africa
100
Siemens Hearing Solution (Pty.) Ltd., Randburg / South Africa 100
Siemens IT Solutions and Services (Pty) Ltd., Johannesburg / South Africa
100
Siemens IT Solutions and Services South Africa (Pty) Ltd, Midrand / South Africa
100
Siemens Real Estate Management (Pty.) Ltd., Mthatha / South Africa
100
Siemens Tanzania Ltd., Dar es Salaam / Tanzania 100
Siemens S.A., Tunis / Tunisia 100
Siemens Pvt. Ltd., Harare / Zimbabwe 100 7
Australia / New Zealand / Oceans (17 companies)
eMeter Australia Proprietary Limited, Sydney / Australia 100 7
Exemplar Health (SCUH) 3 Pty Limited, Bayswater / Australia 100 7
September 30, 2012 Equity interest in %
Exemplar Health (SCUH) 4 Pty Limited, Bayswater / Australia 100 7
Exemplar Health (SCUH) Holdings 3 Pty Limited, Bayswater / Australia
100
Exemplar Health (SCUH) Holdings 4 Pty Limited, Bayswater / Australia
100
Exemplar Health (SCUH) Trust 3, Bayswater / Australia 100
Exemplar Health (SCUH) Trust 4, Bayswater / Australia 100
Kaon Consulting Pty. Ltd., Loganholme, Loganholme QLD / Australia
100
7
Kaon Electric Pty. Ltd., Loganholme, Loganholme QLD / Australia
100
7
Kaon Holdings Pty. Ltd., Loganholme, Loganholme QLD / Australia 100 7
Memcor Australia Pty. Ltd., South Windsor / Australia 100
OSRAM Australia Pty. Ltd., Sydney / Australia 100
Siemens Building Technologies Pty. Ltd., Mount Waverley / Australia
100
Siemens Hearing Instruments Pty. Ltd., Bayswater / Australia 100
Siemens Ltd., Bayswater / Australia 100
Siemens Product Lifecycle Management Software (AUS) Pty Ltd., Melbourne / Australia
100
Siemens (N.Z.) Limited, Auckland / New Zealand 100
Associated companies and joint ventures
Germany (33 companies)
Advanced Power AG und Siemens Project Ventures GmbH in GbR, Hamburg
50
ATS Projekt Grevenbroich GmbH, Schüttorf, Schüttorf 25 8
BELLIS GmbH, Braunschweig 49 8
BSH Bosch und Siemens Hausgeräte GmbH, Munich 50
BWI Informationstechnik GmbH, Meckenheim 50 4
DKS Dienstleistungsgesellschaft f. Kommunikationsanlagen des Stadt- und Regionalverkehrs mbH, Cologne
49
8
EMIS Electrics GmbH, Lübbenau / Spreewald 49
Erlangen AG Technologie Scouting und Marketing, Erlangen 32 8
FEAG Fertigungscenter für Elektrische Anlagen GmbH, Erlangen
49
8
HANSATON Akustik GmbH, Hamburg 50 8
IFTEC GmbH & Co. KG, Leipzig 50
Infineon Technologies Bipolar GmbH & Co. KG, Warstein 40
Infineon Technologies Bipolar Verwaltungs-GmbH, Warstein 40 8
Innovative Wind Concepts GmbH, Husum 50
LIB Verwaltungs-GmbH, Leipzig 50 8
Lightcycle Retourlogistik und Service GmbH, Munich 47 8

135 D. Consolidated Financial Statements 239 E. Additional Information
140 D.5 Consolidated Statements of Changes in Equity 142 D.6 Notes to Consolidated Financial Statements 232 D.7 Supervisory Board and Managing Board
136 D.1 Consolidated Statements of Income 137 D.2 Consolidated Statements of Comprehensive Income 138 D.3 Consolidated Statements of Financial Position 139 D.4 Consolidated Statements of Cash Flow
229
1 Control due to a majority of voting rights.
2 Control due to contractual arrangements.
3 Control due to economic circumstances.
4 No control due to contractual arrangements or legal circumstances.
5 No significant influence due to contractual arrangements or legal circumstances.
6 Significant influence due to contractual arrangements or legal circumstances.
7 Not consolidated due to immateriality.
8 Not accounted for using the equity method due to immateriality.
9 Exemption pursuant to Section 264 b, HGB.
10 Exemption pursuant to Section 264 (3) HGB.
September 30, 2012 Equity interest in %
Maschinenfabrik Reinhausen GmbH, Regensburg 26
MeVis BreastCare GmbH & Co. KG, Bremen 49
MeVis BreastCare Verwaltungsgesellschaft mbH, Bremen 49 8
Partikeltherapiezentrum Kiel GmbH & Co. KG, Kiel 50 8
Power Vermögensbeteiligungsgesellschaft mbH Die Erste, Hamburg
50
8
PTZ Partikeltherapiezentrum Kiel Management GmbH, Wiesbaden 50 8
Siemens Venture Capital Fund 1 GmbH, Munich 100 4, 8
Siemens-Electrogeräte GmbH, Munich 100 4, 8
SKAG Eurocash, Munich 11 6
SKAG Euroinvest Corporates, Munich 22
Symeo GmbH, Neubiberg 65 4, 8
Transrapid International Verwaltungsgesellschaft mbH i.L., Berlin 50 8
Voith Hydro Holding GmbH & Co. KG, Heidenheim 35
Voith Hydro Holding Verwaltungs GmbH, Heidenheim 35 8
WKN AG, Husum 29
Wohnen am Wedding KG THG Immobilien-Fondsgesellschaft mbH & Co., Berlin
26
8
Wustermark Energie GKW Beteiligungs-GmbH, Hamburg 50 8
Europe (without Germany) (56 companies)
AHC Austrian Health Care Systems & Engineering GmbH, Vienna / Austria
33
8
Arelion GmbH, Hagenberg im Mühlkreis / Austria 25 8
Kompetenzzentrum Licht GmbH, Dornbirn / Austria 33 8
Dils Energie NV, Brussels / Belgium 50
EMGO N.V., Lommel / Belgium 50
T-Power NV, Brussels / Belgium 20
EKOLAMP s.r.o., Prague / Czech Republic 30 8
Meomed s.r.o., Prerov / Czech Republic 47 8
A2SEA A / S, Fredericia / Denmark 49
Compagnie Electrique de Bretagne, S.A.S., Paris / France 40
Recylum Societe par Actions Simplifiée, Paris / France 25 8
TRIXELL S.A.S., Moirans / France 25
Breesea Limited, London / Great Britain 50 8
Gwynt y Mor Offshore Wind Farm Limited, Swindon / Great Britain
10
6
Heron Wind Limited, London / Great Britain 33
Lincs Renewable Energy Holdings Limited, London / Great Britain
50
Njord Limited, London / Great Britain 33
Odos Imaging Ltd., Edinburgh / Great Britain 50 8
Optimus Wind Limited, London / Great Britain 50 8
September 30, 2012 Equity interest in %
Plessey Holdings Ltd., Frimley, Surrey / Great Britain 50 8
Pyreos Limited, Edinburgh / Great Britain 37 8
Sesmos Limited, Edinburgh / Great Britain 50 8
SMart Wind Limited, London / Great Britain 50
Unincorporated Joint Venture Gwynt y Mor, Swindon / Great Britain
10
6
Anakiklosi Siskevon Simetochiki S.A., Piraeus / Greece 20 8
Eviop-Tempo A.E. Electrical Equipment Manufacturers, Vasilikon / Greece
48
Szeged Energia Zrt., Szeged / Hungary 50
Transfima GEIE, Turin / Italy 42 8
Transfima S.p.A., Milan / Italy 49 8
Turboservice Torino S.p.A., Turin / Italy 50 8
VAL 208 Torino GEIE, Milan / Italy 86 4, 8
SIA Ekogaisma, Riga / Latvia 33 8
Solutions & Infrastructure Services Limited, Gzira / Malta 50
Eemsmond Energie B.V., Amsterdam / Netherlands 50 8
Enterprise Networks Holdings B.V., Amsterdam / Netherlands
49
Infraspeed Maintainance B.V., Zoetermeer / Netherlands 46
Nokia Siemens Networks Holding B.V., Amsterdam / Netherlands 50
Ural Locomotives Holding Besloten Vennootschap, The Hague / Netherlands
50
Wirescan AS, Halden / Norway 27 8
Windfarm Polska II Sp. z o.o., Koszalin / Poland 50 8
MTS – Metro, Transportes do Sul S.A., Lisbon / Portugal 21 8
OOO Northern Capital Express, Moscow / Russian Federation 25 8
OOO Transconverter, Moscow / Russian Federation 35 8
OOO VIS Automation mit Zusatz „Ein Gemeinschaftsunter-nehmen von VIS und Siemens“, Moscow / Russian Federation
49
ZAO Interautomatika, Moscow / Russian Federation 46
ZAO Nuclearcontrol, Moscow / Russian Federation 40 8
ZAO Systema-Service, St. Petersburg / Russian Federation 26
EKOSIJ d.o.o., Ljubljana / Slovenia 25 8
Merida Power, S.L., Madrid / Spain 50 8
Nertus Mantenimiento Ferroviario y Servicios S.A., Barcelona / Spain
51
4
Soleval Renovables S.L., Sevilla / Spain 50
Solucia Renovables 1, S.L., Lebrija (Sevilla) / Spain 50
Termica AFAP S.A., Villacanas / Spain 20 8
Certas AG, Zurich / Switzerland 50
Interessengemeinschaft TUS, Männedorf / Switzerland 50
Zentrum Oberengstringen AG, Oberengstringen / Switzerland 42 8

1 A. To our Shareholders 49 C. Combined Management Report 21 B. Corporate Governance230
1 Control due to a majority of voting rights.
2 Control due to contractual arrangements.
3 Control due to economic circumstances.
4 No control due to contractual arrangements or legal circumstances.
5 No significant influence due to contractual arrangements or legal circumstances.
6 Significant influence due to contractual arrangements or legal circumstances.
7 Not consolidated due to immateriality.
8 Not accounted for using the equity method due to immateriality.
9 Exemption pursuant to Section 264 b, HGB.
10 Exemption pursuant to Section 264 (3) HGB.
September 30, 2012 Equity interest in %
Shanghai Electric Power Generation Equipment Co., Ltd., Shanghai / China
40
Shanghai Electric Wind Energy Co., Ltd., Shanghai / China 49
Siemens Traction Equipment Ltd., Zhuzhou, Zhuzhou / China 50
Siteco Prosperity Lighting (Lang Fang) Co., Ltd., Lang Fang / China 50
Zhenjiang Siemens Busbar Trunking Systems Co. Ltd., Yangzhong / China
50
OSRAM Prosperity Company Ltd., Hong Kong / Hong Kong 50
Bangalore International Airport Ltd., Bengaluru / India 26
P.T. Jawa Power, Jakarta / Indonesia 50
PT Asia Care Indonesia, Jakarta / Indonesia 40
LAMP NOOR (P.J.S.) Co., Saveh / Iran 20 8
Arava Power Company Ltd., D.N. Eilot / Israel 40 8
Global Sun Israel, L.P., D.N. Eilot / Israel 36
Metropolitan Transportation Solutions Ltd., Rosh HaAyin / Israel 20 8
Negev Energy – Ashalim Thermo-Solar Ltd, Airport City / Israel 50
Kanto Hochouki Co., Ltd., Ibaragi / Japan 25 8
Kikoeno Soudanshitsu Co., Ltd., Tochigi / Japan 50 8
Koden Co., Ltd., Hiroshima / Japan 43 8
Yaskawa Siemens Automation & Drives Corp., Kitakyushu / Japan
50
Temir Zhol Electrification LLP, Astana / Kazakhstan 49
Rousch (Pakistan) Power Ltd., Karachi / Pakistan 26
Power Automation Pte. Ltd., Singapore / Singapore 49
Modern Engineering and Consultants Co. Ltd., Bangkok / Thailand
40
8
Siemens Transformers L.L.C, Abu Dhabi / United Arab Emirates 49
Africa (3 companies)
Energie Electrique de Tahaddart S.A., Tanger / Morocco 20
VOEST-ALPINE Technical Services Ltd., Abuja / Nigeria 40 8
Impilo Consortium (Pty.) Ltd., La Lucia / South Africa 31
Australia / New Zealand / Oceans (2 companies)
Exemplar Health (SCUH) Partnership, Sydney / Australia 50
SILCAR Pty. Ltd., Mount Waverley / Australia 50
September 30, 2012 Equity interest in %
America (18 companies)
Cia Técnica de Engenheria Eletrica Sucursal Argentina VA TECH ARGENTINA S.A. Union transitoria de Empresas, Buenos Aires / Argentina
30
8
CVL Componentes de Vidro Ltda., Caçapava / Brazil 50
Pemopro S.A. de C.V., Mexico City / Mexico 25 8
BritePointe, Inc., Berkeley, CA / USA 40 8
Brockton Power Company LLC, Boston, MA / USA 23
Brockton Power Holdings Inc., Boston, MA / USA 25 8
Brockton Power Properties, Inc., Boston, MA / USA 25 8
Cyclos Semiconductor, Inc., Berkeley, CA / USA 41
PhSiTh LLC, New Castle, DE / USA 33
Power Properties Inc., Boston, MA / USA 25 8
Reactive NanoTechnologies, Inc., Hunt Valley, MD / USA 21
Rether networks, Inc., Centereach, NY / USA 30
Semprius, Inc., Durham, NC / USA 21
Siemens First Capital Commercial Finance, LLC, Oklahoma City, OK / USA
51
4
Treated Water Outsourcing J.V., Naperville, IL / USA 50
Valeo Sylvania LLC, Seymour, IN / USA 50
Zargis Medical Corp., Princeton, NJ / USA 25
Innovex Capital En Tecnologia, C.A., Caracas / Venezuela 20 6
Asia (32 companies)
Oil and Gas ProServ LLC, Baku / Azerbaijan 25 8
ChinaInvent (Shanghai) Instrument Co., Ltd, Shanghai / China 30 8
FCE (Beijing) Heat Treatment Technology Co., Ltd., Beijing / China
30
8
Foshan Electrical and Lighting Co., Ltd., Foshan / China 13 6
GSP China Technology Co., Ltd., Beijing / China 50
Guangzhou Morgan Seals Co., Ltd., Guangzhou / China 50 8
OSRAM (China) Fluorescent Materials Co., Ltd., Yixing / China 50 4
ROSE Power Transmission Technology Co., Ltd, Anshan / China 50
Saitong Railway Electrification (Nanjing) Co., Ltd., Nanjing / China
50
8

135 D. Consolidated Financial Statements 239 E. Additional Information
140 D.5 Consolidated Statements of Changes in Equity 142 D.6 Notes to Consolidated Financial Statements 232 D.7 Supervisory Board and Managing Board
136 D.1 Consolidated Statements of Income 137 D.2 Consolidated Statements of Comprehensive Income 138 D.3 Consolidated Statements of Financial Position 139 D.4 Consolidated Statements of Cash Flow
231
1 Control due to a majority of voting rights.
2 Control due to contractual arrangements.
3 Control due to economic circumstances.
4 No control due to contractual arrangements or legal circumstances.
5 No significant influence due to contractual arrangements or legal circumstances.
6 Significant influence due to contractual arrangements or legal circumstances.
7 Not consolidated due to immateriality.
8 Not accounted for using the equity method due to immateriality.
9 Exemption pursuant to Section 264 b, HGB.
10 Exemption pursuant to Section 264 (3) HGB.
11 Values according to the latest available local GAAP financial statements; the underlying fiscal year may differ from the Siemens fiscal year.
September 30, 2012 Equity interest in %
Net Income in millions of €
Equity in millions of €
Other investments 11
Germany (9 companies)
Ausbildungszentrum für Technik, Informationsverarbeitung und Wirtschaft gemeinnützige GmbH (ATIW), Paderborn 100 4, 5 0 2
BOMA Verwaltungsgesellschaft mbH & Co. KG, Grünwald 100 4, 5 (46) (46)
BSAV Kapitalbeteiligungen und Vermögensverwaltungs Management GmbH, Grünwald 100 4, 5 (1) 29
Kyros Beteiligungsverwaltung GmbH, Grünwald 100 4, 5 (2) 237
MAENA Grundstücks-Verwaltungsgesellschaft mbH & Co. KG, Grünwald 97 4, 5 (102) (103)
Realtime Technology AG, Munich 9 2 29
Siemens Pensionsfonds AG, Grünwald 100 4, 5 1 9
Siemens Venture Capital Fund 2 GmbH i.L., Munich 100 4, 5 0 0
SIM 9. Grundstücksverwaltungs- und -beteiligungs-GmbH, Munich 100 4, 5 1 13
Europe (without Germany) (3 companies)
Atos S.A., Bezons Cedex / France 15 183 2,329
Medical Systems S.p.A., Genoa / Italy 45 5 10 72
Corporate XII S.A. (SICAV-FIS), Luxembourg / Luxembourg 100 4, 5 160 6,549
America (4 companies)
Middle East Opportunities Fund SPC obo Solar Energy I Segregated Portfolio, George Town / Cayman Islands 42 5 0 5
CoreLabs, Inc., Princeton, NJ / USA 5 (4) 35
Global Healthcare Exchange LLC, Westminster, CO / USA 7 3 212
iBAHN Corporation, Salt Lake City, UH / USA 9 (3) 34
This is a translation of the German “Konzernabschluss gemäß §315a (1) HGB der Siemens AG zum 30. September 2012.” Sole authoritative and universally valid version is the German lan-guage document.

1 A. To our Shareholders 49 C. Combined Management Report 21 B. Corporate Governance232
Gerhard Cromme, Dr. iur.Chairman
Chairman of the Supervisory Boards of Siemens AG and ThyssenKrupp AG
Date of birth: February 25, 1943 Member since: January 23, 2003
External positions
German supervisory board positions:
> Axel Springer AG, Berlin (until April 2013)
> ThyssenKrupp AG, Duisburg and Essen (Chairman)
Positions outside Germany:
> Compagnie de Saint-Gobain S.A., France (until June 2013)
Berthold Huber*First Deputy Chairman
First Chairman, IG Metall
Date of birth: February 15, 1950 Member since: July 1, 2004
External positions
German supervisory board positions:
> Audi AG, Ingolstadt (Deputy Chairman)
> Porsche Automobil Holding SE, Stuttgart
> Volkswagen AG, Wolfsburg (Deputy Chairman)
Josef Ackermann, Dr. oec.Second Deputy Chairman
Chairman of the Board of Directors, Zurich Insurance Group AG
Date of birth: February 7, 1948 Member since: January 23, 2003
External positions
Positions outside Germany:
> Belenos Clean Power Holding AG, Switzerland (Deputy Chairman)
> Investor AB, Sweden > Royal Dutch Shell plc, Netherlands > Zurich Insurance Group AG,
Switzerland (Chairman) > Zürich Versicherungs-
Gesellschaft AG, Switzerland (Chairman)
Lothar Adler*Chairman of the Central Works Council, Siemens AG
Date of birth: February 22, 1949 Member since: January 23, 2003
Jean-Louis BeffaHonorary Chairman of Compagnie de Saint-Gobain
Date of birth: August 11, 1941 Member since: January 24, 2008
External positions
Positions outside Germany:
> Claude Bernard Participations S.A.S., France (Chairman)
> GDF SUEZ S.A., France > Groupe Bruxelles Lambert, Belgium > JL2B Conseils, France (Chairman) > Le Monde S.A., France > Le Monde & Partenaires
Associés S.A.S., France > Saint-Gobain Corporation, USA > Société Editrice du Monde S.A.,
France
Gerd von BrandensteinMember of the Supervisory Boards of Siemens AG and degewo AG
Date of birth: April 6, 1942 Member since: January 24, 2008
External positions
German supervisory board positions:
> degewo AG, Berlin
Michael DiekmannChairman of the Board of Management, Allianz SE
Date of birth: December 23, 1954 Member since: January 24, 2008
External positions
German supervisory board positions:
> Allianz Asset Management AG (Chairman), Munich
> Allianz Deutschland AG, Munich > BASF SE, Ludwigshafen am Rhein
(Deputy Chairman) > Linde AG, Munich
(Deputy Chairman)
Positions outside Germany:
> Allianz France S.A., France (Deputy Chairman)
> Allianz S.p.A., Italy
Hans Michael Gaul, Dr. iur.Supervisory board member
Date of birth: March 2, 1942 Member since: January 24, 2008
External positions
German supervisory board positions:
> BDO AG Wirtschaftsprüfungs-gesellschaft, Hamburg (Deputy Chairman)
> Evonik Industries AG, Essen > EWE AG, Oldenburg
(until October 29, 2012) > HSBC Trinkaus & Burkhardt AG,
Düsseldorf
Peter Gruss, Prof. Dr. rer. nat.President, Max-Planck-Gesellschaft zur Förderung der Wissenschaften e.V.
Date of birth: June 28, 1949 Member since: January 24, 2008
External positions
German supervisory board positions:
> Münchener Rückversicherungs- Gesellschaft Aktiengesellschaft in München, Munich
Positions outside Germany:
> Actelion Ltd., Switzerland
Bettina Haller*Chairwoman of the Combine Works Council, Siemens AG
Date of birth: March 14, 1959 Member since: April 1, 2007
Hans-Jürgen Hartung*Chairman of the Works Council, Siemens Energy Sector, Erlangen, Germany
Date of birth: March 10, 1952 Member since: January 27, 2009
Harald Kern*Chairman of the Siemens Europe Committee
Date of birth: March 16, 1960 Member since: January 24, 2008
Jürgen Kerner*Executive Managing Board Member, IG Metall
Date of birth: January 22, 1969 Member since: January 25, 2012
External positions
German supervisory board positions:
> MAN SE, Munich > Premium Aerotec GmbH, Augsburg
(Deputy Chairman)
D.7 SuperviSory BoarD anD Managing BoarD
D.7.1 Supervisory Board

135 D. Consolidated Financial Statements 239 E. Additional Information
140 D.5 Consolidated Statements of Changes in Equity 142 D.6 Notes to Consolidated Financial Statements 232 D.7 Supervisory Board and Managing Board
136 D.1 Consolidated Statements of Income 137 D.2 Consolidated Statements of Comprehensive Income 138 D.3 Consolidated Statements of Financial Position 139 D.4 Consolidated Statements of Cash Flow
233
Nicola Leibinger-Kammüller, Dr. phil.President and Chairwoman of the Managing Board, TRUMPF GmbH + Co. KG
Date of birth: December 15, 1959 Member since: January 24, 2008
External positions
German supervisory board positions:
> Axel Springer AG, Berlin > Deutsche Lufthansa AG, Cologne > Voith GmbH, Heidenheim
Werner Mönius*Chairman of the Works Council, Siemens Healthcare Sector, Erlangen, Germany
Date of birth: May 16, 1954 Member since: January 24, 2008
Håkan SamuelssonPresident and CEO, Volvo Car Corporation (since October 19, 2012)
Date of birth: March 19, 1951 Member since: January 24, 2008
External positions
German supervisory board positions:
> Scandferries Holding GmbH, Rostock (Chairman)1
> Scandlines GmbH, Rostock (Chairman)
Positions outside Germany:
> Volvo Car Corporation, Sweden
Dieter Scheitor*(until January 24, 2012)
Physicist
IG Metall headquarters Inactive phase of part-time pre- retirement scheme
Date of birth: November 23, 1950 Member since: January 25, 2007
Rainer Sieg,* Dr. iur.Chairman of the Committee of Spokespersons, Siemens Group; Chairman of the Central Committee of Spokespersons, Siemens AG
Date of birth: December 20, 1948 Member since: January 24, 2008
Birgit Steinborn*Deputy Chairwoman of the Central Works Council, Siemens AG
Date of birth: March 26, 1960 Member since: January 24, 2008
Lord Iain Vallance of TummelChairman, Amsphere Ltd.
Date of birth: May 20, 1943 Member since: January 23, 2003
Sibylle Wankel*Attorney, Bavarian Regional Headquarters, IG Metall
Date of birth: March 3, 1964 Member since: April 1, 2009
External positions
German supervisory board positions:
> Vaillant GmbH, Remscheid
The Supervisory Board of Siemens AG has 20 members. As stipulated by the German Codetermination Act, half of the members represent Company shareholders, and half represent Company employees. The shareholder representatives were elected at the Annual Shareholders’ Meeting on January 24, 2008, and the employee representatives, whose names are marked with an asterisk (*), either were elected in accordance with the provisions of the German Codetermination Act on September 27, 2007, effective as of the end of the Annual Shareholders’ Meeting on January 24, 2008, or replaced an employee represen-tative who had resigned from the Supervisory Board. The present Supervisory Board’s term of office will expire at the conclusion of the Annual Shareholders’ Meeting on January 23, 2013.
1 Advisory board as comparable supervisory body
As of September 30, 2012

1 A. To our Shareholders 49 C. Combined Management Report 21 B. Corporate Governance234
Committees Meetings in fiscal 2012
Duties and responsibilities Members as of September 30, 2012
Chairman’s Committee
6
5 decisions by notational voting using written circulations
The Chairman’s Committee deals, in particular, with matters concerning the Managing Board. The Committee makes rec-ommendations to the full Supervisory Board on the appoint-ment and revocation of the appointment of Managing Board members, handles the employment contracts of Managing Board members and prepares the Supervisory Board’s decision regarding Managing Board compensation and its review of the system of Managing Board compensation. The Chairman’s Committee concerns itself with issues relating to corporate governance at the Company and prepares the Supervisory Board’s decision regarding the Declaration of Conformity with the German Corporate Governance Code. In addition, the Committee makes recommendations to the full Supervisory Board on the composition of Supervisory Board committees and decides whether to approve business transactions with Managing Board members and parties related to them.
Gerhard Cromme, Dr. iur.(Chairman)
Lothar Adler
Josef Ackermann, Dr. oec.
Berthold Huber
Audit Committee
6 The Audit Committee’s duties include, in particular, preparing Supervisory Board reviews of the Annual Financial Statements of Siemens AG and of the Consolidated Financial Statements of Siemens worldwide. The Committee also discusses the Company ’s quarterly reports and half-year financial reports, liaises with the independent auditors (particularly with regard to awarding the audit contract, defining the focal points of the audit, determining the auditors’ fee and ensuring their inde-pendence) and monitors the effectiveness of the Company’s internal control system, risk management system and internal audit system.
Hans Michael Gaul, Dr. iur. 1, 2
(Chairman)
Gerhard Cromme, Dr. iur. 1
Bettina Haller
Jürgen Kerner
Birgit Steinborn
Lord Iain Vallance of Tummel
Compliance Committee
5 The Compliance Committee concerns itself with the Company ’s adherence to statutory provisions, official regulations and internal Company policies.
Gerhard Cromme, Dr. iur.(Chairman)
Lothar Adler
Hans Michael Gaul, Dr. iur.
Bettina Haller
Lord Iain Vallance of Tummel
Sibylle Wankel
1 Audit committee financial expert as defined by the Sarbanes-Oxley Act 2 Fulfills the requirements of Section 100 para. 5 and Section 107 para. 4 of the German Stock Corporation Act (Aktiengesetz)
D.7.1.1 SUPERVISORY BOARD COMMITTEESThe Supervisory Board of Siemens AG has established six standing committees. Information on their activities in fiscal 2012 is provided in THE REPORT OF THE SUPERVISORY BOARD,
PAGES 12-15 above.

135 D. Consolidated Financial Statements 239 E. Additional Information
140 D.5 Consolidated Statements of Changes in Equity 142 D.6 Notes to Consolidated Financial Statements 232 D.7 Supervisory Board and Managing Board
136 D.1 Consolidated Statements of Income 137 D.2 Consolidated Statements of Comprehensive Income 138 D.3 Consolidated Statements of Financial Position 139 D.4 Consolidated Statements of Cash Flow
235
Committees Meetings in fiscal 2012
Duties and responsibilities Members as of September 30, 2012
Finance and Investment Committee
3
5 decisions by notational voting using written circulations
The duties of the Finance and Investment Committee include laying the groundwork – on the basis of the Company’s overall strategy, which is the subject of an annual strategy meeting of the Supervisory Board – for the Supervisory Board’s nego-tiations and decisions regarding the Company’s financial situation and structure, its investments in property, plant and equipment and its financial investments. In addition, the Com-mittee decides on behalf of the Supervisory Board whether to approve business transactions requiring Super visory Board approval that have a value of less than €600 million. It also exercises the Supervisory Board’s rights under Section 32 of the German Codetermination Act to make decisions regarding the exercise of ownership rights resulting from interests in other companies. Decisions of the Finance and Investment Committee under Section 32 of the Act are made only by the Committee’s shareholder representatives.
Gerhard Cromme, Dr. iur.(Chairman)
Lothar Adler
Jean-Louis Beffa
Gerd von Brandenstein
Jürgen Kerner
Werner Mönius
Håkan Samuelsson
Birgit Steinborn
Nominating Committee
6 The Nominating Committee makes recommendations to the Supervisory Board’s shareholder representatives regarding the candidates for the office of Supervisory Board shareholder representative to be proposed for election by the Annual Shareholders’ Meeting.
Gerhard Cromme, Dr. iur.(Chairman)
Josef Ackermann, Dr. oec.
Hans Michael Gaul, Dr. iur.
Mediation Committee, under Section 27 para. 3 and Section 31 para. 3 and 5 of the German Codetermination Act
0 The Mediation Committee, whose establishment is mandato-ry under German law, makes recommendations to the Super-visory Board regarding the appointment and revocation of the appointment of Managing Board members if the Supervisory Board has not approved these appointments and / or revo-cations by the required two-thirds majority on the first vote.
Gerhard Cromme, Dr. iur.(Chairman)
Josef Ackermann, Dr. oec.
Lothar Adler
Berthold Huber
Further information on corporate governance at Siemens is available at
www.SIEMEnS.COM/CORPORATE-GOVERnAnCE

1 A. To our Shareholders 49 C. Combined Management Report 21 B. Corporate Governance236
Peter LöscherPresident and Chief Executive Officer, Siemens AG
Date of birth: September 17, 1957 First appointed: July 1, 2007 Term expires: March 31, 2017
External positions
German supervisory board positions:
> Deutsche Bank AG, Frankfurt am Main
> Münchener Rückversicherungs- Gesellschaft Aktiengesellschaft in München, Munich
Positions outside Germany:
> TBG Limited, Malta (Thyssen-Bornemisza Group)
Roland Busch, Dr. rer. nat.Date of birth: November 22, 1964 First appointed: April 1, 2011 Term expires: March 31, 2016
External positions
Positions outside Germany:
> Atos S.A., France
Group Company positions
German supervisory board positions:
> OSRAM AG,1 Munich
Positions outside Germany:
> Siemens Industry, Inc., USA > Siemens Ltd., China (Chairman) > Siemens Ltd., India > Siemens Pte. Ltd., Singapore > Siemens Schweiz AG, Switzerland
(Chairman)
Brigitte EdererDate of birth: February 27, 1956 First appointed: July 1, 2010 Term expires: June 30, 2015
External positions
German supervisory board positions:
> Jenoptik AG, Jena
Positions outside Germany:
> Boehringer Ingelheim RCV GmbH, Austria
> Österreichische Industrieholding AG (ÖIAG), Austria
Group Company positions
Positions outside Germany:
> Siemens AG Österreich, Austria (Chairwoman)
> Siemens France Holding S.A.S., France
> Siemens Holding S.p.A., Italy (Deputy Chairwoman)
> Siemens Holdings plc, UK > Siemens Nederland N.V.,
Netherlands (Chairwoman) > Siemens S.A., Spain (Chairwoman) > Siemens Sanayi ve Ticaret A.Ş.,
Turkey > Siemens S.p.A., Italy
(Deputy Chairwoman)
Klaus HelmrichDate of birth: May 24, 1958 First appointed: April 1, 2011 Term expires: March 31, 2016
External positions
German supervisory board positions:
> EOS Holding AG, Krailling
Group Company positions
German supervisory board positions:
> BSH Bosch und Siemens Hausgeräte GmbH, Munich
Positions outside Germany:
> Siemens Technology and Services Private Ltd., India (Chairman)
Joe KaeserDate of birth: June 23, 1957 First appointed: May 1, 2006 Term expires: March 31, 2016
External positions
German supervisory board positions:
> Allianz Deutschland AG, Munich
Positions outside Germany:
> NXP Semiconductors B.V., Netherlands
Group Company positions
German supervisory board positions:
> BSH Bosch und Siemens Hausgeräte GmbH, Munich (Chairman)
> OSRAM AG,1 Munich
Positions outside Germany:
> Nokia Siemens Networks B.V., Netherlands
> Siemens AG Österreich, Austria > Siemens Corp., USA
(Deputy Chairman) > Siemens Ltd., India
Barbara KuxDate of birth: February 26, 1954 First appointed: November 17, 2008 Term expires: November 16, 2013
External positions
Positions outside Germany:
> Total S.A., France
Group Company positions
Positions outside Germany:
> Nokia Siemens Networks B.V., Netherlands
Hermann Requardt, Prof. Dr. phil. nat.Date of birth: February 11, 1955 First appointed: May 1, 2006 Term expires: March 31, 2016
External positions
German supervisory board positions:
> Software AG, Darmstadt
Group Company positions
German supervisory board positions:
> OSRAM AG,1 Munich
Positions outside Germany:
> Siemens Healthcare Diagnostics Inc., USA
> Siemens Japan Holding K.K., Japan (Chairman)
> Siemens Japan K.K., Japan (Chairman)
> Siemens Medical Solutions USA, Inc., USA (Chairman)
D.7.2 Managing Board

135 D. Consolidated Financial Statements 239 E. Additional Information
140 D.5 Consolidated Statements of Changes in Equity 142 D.6 Notes to Consolidated Financial Statements 232 D.7 Supervisory Board and Managing Board
136 D.1 Consolidated Statements of Income 137 D.2 Consolidated Statements of Comprehensive Income 138 D.3 Consolidated Statements of Financial Position 139 D.4 Consolidated Statements of Cash Flow
237
Siegfried Russwurm, Prof. Dr.-Ing.Date of birth: June 27, 1963 First appointed: January 1, 2008 Term expires: March 31, 2017
External positions
German supervisory board positions:
> Deutsche Messe AG, Hanover
Group Company positions
German supervisory board positions:
> BSH Bosch und Siemens Hausgeräte GmbH, Munich
> OSRAM AG,1 Munich (Chairman)
Positions outside Germany:
> Arabia Electric Ltd. (Equipment), Saudi Arabia (Deputy Chairman)
> Siemens Industry, Inc., USA (Chairman)
> Siemens Ltd., China > Siemens Ltd., Saudi Arabia
(Deputy Chairman) > Siemens Ltd., South Africa
(Chairman) > Siemens Middle East, FZ-LLC,
United Arab Emirates > Siemens VAI Metals Technologies
GmbH, Austria > VA TECH T & D Co. Ltd.,
Saudi Arabia
Peter Y. SolmssenDate of birth: January 24, 1955 First appointed: October 1, 2007 Term expires: March 31, 2017 2
Group Company positions
German supervisory board positions:
> OSRAM AG,1 Munich
Positions outside Germany:
> Nokia Siemens Networks B.V., Netherlands
> Siemens Corp., USA (Chairman) > Siemens S.A., Colombia
(Chairman)
Michael Süß, Dr. rer. pol.Date of birth: December 25, 1963 First appointed: April 1, 2011 Term expires: March 31, 2016
External positions
German supervisory board positions:
> Herrenknecht AG, Schwanau > KION Group GmbH, Wiesbaden > KION Holding 1 GmbH, Wiesbaden
1 As of October 25, 2012: OSRAM GmbH
2 As a rule, reappointments are effected until the completion of the 60th year of life only, however, with the proviso that they are extended for another year at a time until a total maximum five-year term, provided that neither the member of the Managing Board nor the Supervisory Board objects.
As of September 30, 2012

238
Committee Meetings in fiscal year 2012
Duties and responsibilities Members as of September 30, 2012
Equity and Employee Stock Committee
6 decisions by notational voting using written circulations
This committee oversees the utilization of authorized capital in connection with the issuance of employee stock as well as the implementation of various capital measures. It also determines the scope and conditions of the stock-based compensation components and / or compensation programs offered to employees and managers (excluding the Managing Board).
Peter Löscher(Chairman)
Joe Kaeser
Brigitte Ederer
D.7.2.1 MAnAGInG BOARD COMMITTEES
Further information on corporate governance at Siemens is available at
www.SIEMEnS.COM/CORPORATE-GOVERnAnCE

240 E.1 Responsibility statement
241 E.2 Independent Auditors’ Report
243 E.3 Statement of the Managing Board
244 E.4 Five-year summary
246 E.5 Glossary
248 E.6 Index
250 E.7 Further information and information resources
251 E.8 Financial calendar
252 E.9 Company structure
E. Additional Information
E. A
dd
itio
nal
Info
rmat
ion

1 A. To our Shareholders 49 C. Combined Management Report 21 B. Corporate Governance240
E.1 RESPONSIBILITY STATEMENT
To the best of our knowledge, and in accordance with the applicable reporting principles, the Consolidated Financial Statements give a true and fair view of the assets, liabilities, financial position and profit or loss of the group, and the Group Management Report, which has been combined with
Munich, November 21, 2012
Siemens Aktiengesellschaft The Managing Board
Peter Löscher Dr. Roland Busch Brigitte Ederer Klaus Helmrich
Joe Kaeser Barbara Kux Prof. Dr. Hermann Requardt Prof. Dr. Siegfried Russwurm
Peter Y. Solmssen Dr. Michael Süß
the Management Report for Siemens Aktiengesellschaft, includes a fair review of the development and performance of the business and the position of the group, together with a description of the material opportunities and risks associated with the expected development of the group.

135 D. Consolidated Financial Statements 239 E. Additional Information
240 E.1 Responsibility statement 241 E.2 Independent Auditors’ Report 243 E.3 Statement of the Managing Board 244 E.4 Five-year summary 246 E.5 Glossary
248 E.6 Index 250 E.7 Further information and information resources 251 E.8 Financial calendar 252 E.9 Company structure
241
To Siemens Aktiengesellschaft, Berlin and Munich
RepoRt on the Consolidated FinanCial statementsWe have audited the accompanying consolidated financial statements of Siemens Aktiengesellschaft, Munich and Berlin, and its subsidiaries, which comprise the consolidated state-ments of income, comprehensive income, financial position, cash flow and changes in equity, and notes to the consolidated financial statements for the business year from October 1, 2011 to September 30, 2012.
Management’s Responsibility for the Consolidated Financial Statements The management of Siemens Aktiengesellschaft is responsi-ble for the preparation of these consolidated financial state-ments. This responsibility includes preparing these consoli-dated financial statements in accordance with International Financial Reporting Standards (IFRS) as adopted by the European Union (EU), the supplementary requirements of German law pursuant to Sec. 315a (1) HGB [“Handelsgesetz-buch“: German Commercial Code] and full IFRS as issued by the International Accounting Standards Board (IASB), to give a true and fair view of the net assets, financial position and results of operations of the group in accordance with these requirements. The company’s management is also responsi-ble for the internal controls that management determines are necessary to enable the preparation of consolidated financial statements that are free from material misstatement, whether due to fraud or error.
Auditor’s ResponsibilityOur responsibility is to express an opinion on these consolidat-ed financial statements based on our audit. We conducted our audit in accordance with Sec. 317 HGB and German generally accepted standards for the audit of financial statements pro-mulgated by the Institut der Wirtschaftsprüfer [Institute of Public Auditors in Germany] (IDW) as well as in supplementary compliance with International Standards on Auditing (ISA).
E.2 INdEPENdENT AudITORS’ REPORT
Accordingly, we are required to comply with ethical require-ments and plan and perform the audit to obtain reasonable as-surance about whether the consolidated financial statements are free from material misstatement.
An audit involves performing audit procedures to obtain audit evidence about the amounts and disclosures in the consolidat-ed financial statements. The selection of audit procedures de-pends on the auditor’s professional judgment. This includes the assessment of the risks of material misstatement of the consolidated financial statements, whether due to fraud or er-ror. In assessing those risks, the auditor considers the internal control system relevant to the entity’s preparation of the con-solidated financial statements that give a true and fair view. The aim of this is to plan and perform audit procedures that are appropriate in the given circumstances, but not for the pur-pose of expressing an opinion on the effectiveness of the group’s internal control system. An audit also includes evaluat-ing the appropriateness of accounting policies used and the reasonableness of accounting estimates made by manage-ment, as well as evaluating the overall presentation of the consolidated financial statements.
We believe that the audit evidence we have obtained is suffi-cient and appropriate to provide a basis for our audit opinion.
Audit OpinionPursuant to Sec. 322 (3) Sentence 1 HGB, we state that our audit of the consolidated financial statements has not led to any reservations.
In our opinion, based on the findings of our audit, the consoli-dated financial statements comply in all material respects with IFRS as adopted by the EU, the supplementary requirements of German commercial law pursuant to Sec. 315a (1) HGB and full IFRS as issued by the IASB and give a true and fair view of the net assets and financial position of the Group as at September 30, 2012 as well as the results of operations for the business year then ended, in accordance with these requirements.

1 A. To our Shareholders 49 C. Combined Management Report 21 B. Corporate Governance242
RepoRt on the GRoup manaGement RepoRt We have audited the accompanying group management report, which is combined with the management report of Siemens Aktiengesellschaft, for the business year from October 1, 2011 to September 30, 2012. The management of the company is responsible for the preparation of the group man-agement report in compliance with the applicable require-ments of German commercial law pursuant to Sec. 315a (1) HGB. We are required to conduct our audit in accordance with Sec. 317 (2) HGB and German generally accepted standards for the audit of the group management report promulgated by the IDW. Accordingly, we are required to plan and perform the audit of the group management report to obtain reasonable assurance about whether the group management report is consistent with the consolidated financial statements and the audit findings, and as a whole provides a suitable view of the Group’s position and suitably presents the opportunities and risks of future development.
Pursuant to Sec. 322 (3) Sentence 1 HGB, we state that our audit of the group management report has not led to any reservations.
In our opinion, based on the findings of our audit of the con-solidated financial statements and group management report, the group management report is consistent with the consoli-dated financial statements, and as a whole provides a suitable view of the Group’s position and suitably presents the opportu-nities and risks of future development.
Munich, November 21, 2012
Ernst & Young GmbH Wirtschaftsprüfungsgesellschaft
Krämmer Prof. Dr. Hayn Wirtschaftsprüfer Wirtschaftsprüfer [German Public Auditor] [German Public Auditor]

135 D. Consolidated Financial Statements 239 E. Additional Information
240 E.1 Responsibility statement 241 E.2 Independent Auditors’ Report 243 E.3 Statement of the Managing Board 244 E.4 Five-year summary 246 E.5 Glossary
248 E.6 Index 250 E.7 Further information and information resources 251 E.8 Financial calendar 252 E.9 Company structure
243
E.3 STATEMENT Of ThE MANAgINg BOARd
The Managing Board of Siemens Aktiengesellschaft is responsi-ble for preparing the Consolidated Financial Statements and the Group Management Report. The Consolidated Financial State-ments have been prepared in accordance with Inter national Fi-nancial Reporting Standards (IFRS), as adopted by the European Union as well as with the additional requirements set forth in Section 315a (1) of the German Commercial Code (Handelsge-setzbuch). The financial statements are also in accordance with IFRS as issued by the International Accounting Standards Board (IASB). The Group Management Report is consistent with the Consolidated Financial Statements and is combined with the Management Report of Siemens Aktiengesellschaft.
Siemens employs extensive internal controls, company-wide uniform reporting guidelines and additional measures, in-cluding employee training and continuing education, with the intention that the Consolidated Financial Statements and the Group Management Report are conducted correctly and in accordance with the applicable legal requirements. Mem-bers of the management of the Sectors, Divisions, Financial Services, Cross-Sector Services, Regional Clusters and certain Corporate Units, supported by certifications of management of entities under their responsibility have confirmed to us the
correctness of the financial data they have reported to Siemens’ corporate headquarters and the effectiveness of the related control systems. Compliance with the guidelines as well as the reliability and effectiveness of the control systems are continuously examined by Internal Corporate Audit throughout the Siemens Group. Our risk management sys-tem complies with the requirements of the German Corpora-tion Act (Aktiengesetz). Our risk management system is de-signed to enable the Managing Board to recognize potential risks early on and initiate timely countermeasures.
In accordance with the resolution adopted at the Annual Shareholders’ Meeting, Ernst & Young GmbH Wirtschafts-prüfungs gesellschaft has audited the Consolidated Financial Statements and Group Management Report, which is com-bined with the Management Report of Siemens Aktiengesell-schaft, and issued an unqualified opinion. Together with the independent auditors, the Supervisory Board has thoroughly examined the Consolidated Financial Statements, the Group Management Report, and the Independent Auditors’ Report. The result of this examination is included in the Report of the Supervisory Board ( a.1 oF the FinanCial seCtion oF this
annual RepoRt).
Munich, November 28, 2012
The Managing Board
Peter Löscher Dr. Roland Busch Brigitte Ederer Klaus Helmrich
Joe Kaeser Barbara Kux Prof. Dr. Hermann Requardt Prof. Dr. Siegfried Russwurm
Peter Y. Solmssen Dr. Michael Süß

1 A. To our Shareholders 49 C. Combined Management Report 21 B. Corporate Governance244
E.4 fivE-yEar summary
Revenue and earnings (in millions of €) 1 2012 2011 2010 2009 2008
Revenue 78,296 73,275 68,828 70,053 69,577
Gross profit 22,204 22,229 20,012 19,120 18,979
Income from continuing operations 5,184 7,376 4,329 2,533 1,574
Net income 4,590 6,321 4,068 2,497 5,886
Assets, liabilities and equity (in millions of €) 2012 2011 2010 2009 2008
Current assets 52,129 52,542 50,179 44,087 43,486
Current liabilities 42,637 43,560 40,610 36,510 42,142
Debt 20,707 17,940 19,913 19,638 16,079
Long-term debt 16,880 14,280 17,497 18,940 14,260
Net debt 2 9,292 4,995 5,560 9,309 9,034
Pension plans and similar commitments 9,926 7,307 8,464 5,938 4,361
Equity (including non-controlling interests) 31,302 32,156 29,096 27,287 27,380
as a percentage of total assets 29 31 28 29 29
Total assets 108,282 104,243 102,827 94,926 94,463
Cash flows (in millions of €) 1 2012 2011 2010 2009 2008
Net cash provided by (used in) operating activities – continuing operations 6,996 8,081 9,055 6,246 8,169
Amortization, depreciation and impairments 3 2,744 2,437 2,568 2,395 2,471
Net cash provided by (used in) investing activities – continuing operations (5,034) (2,739) (2,010) (2,588) (9,082)
Additions to intangible assets and property, plant and equipment (2,206) (2,163) (1,939) (2,159) (2,397)
Net cash provided by (used in) financing activities – continuing operations (3,591) (7,062) (3,189) (344) 3,935
Net increase (decrease) in cash and cash equivalents (1,561) (1,715) 4,023 3,275 1,989
Free cash flow – continuing operations 4,790 5,918 7,116 4,087 5,773
Employees – continuing operations 1 2012 2011 2010 2009 2008
Employees (September 30, in thousands) 370 359 335 333 346
Stock market information (in €, unless otherwise stated) 2012 2011 2010 2009 2008
Basic earnings per share (from continuing operations) 1 5.77 8.23 4.80 2.70 1.60
Diluted earnings per share (from continuing operations) 1 5.71 8.14 4.75 2.67 1.60
Dividend per share 3.004 3.00 2.70 1.60 1.60
Stock price range (Xetra closing price)
High 79.71 99.38 79.37 66.45 108.86
Low 63.06 64.45 60.20 35.52 64.91
Fiscal year-end 77.61 68.12 77.43 63.28 65.75
Performance of Siemens shares year-over-year (in percentage points)
Compared to DAX® (12.57) 2.17 15.53 2.24 (4.68)
Compared to MSCI World (3.01) (5.16) 18.53 1.86 (4.46)
Number of shares issued (September 30, in millions) 881 914 914 914 914
Market capitalization (in millions of €) 5 66,455 59,554 67,351 54,827 56,647
Credit rating – long-term debt
Standard & Poor’s A+ A+ A+ A+ AA-
Moody’s Investors Service Aa3 A1 A1 A1 A1
1 Regarding activities classified as discontinued operations, prior periods are presented on a comparable basis.
2 Net debt results from total debt less total liquidity. Total debt comprises short-term debt and current maturities of long-term debt as well as long-term debt. Total liquidity comprises cash and cash equivalents as well as available-for-sale financial assets (current).
3 Amortization, depreciation and impairments contains amortization and impairments, net of reversals of impairments, of intangible assets other than goodwill as well as depreciation and impairments of property, plant and equipment, net of reversals of impairments.
4 To be proposed to the Annual Shareholders’ Meeting.
5 On the basis of outstanding shares.

135 D. Consolidated Financial Statements 239 E. Additional Information
240 E.1 Responsibility statement 241 E.2 Independent Auditors’ Report 243 E.3 Statement of the Managing Board 244 E.4 Five-year summary 246 E.5 Glossary
248 E.6 Index 250 E.7 Further information and information resources 251 E.8 Financial calendar 252 E.9 Company structure
245
Quarterly data (in millions of €) 1 2012 4th Quarter 3rd Quarter 2nd Quarter 1st Quarter
Revenue 78,296 21,703 19,502 19,235 17,856
Net income 4,590 1,268 850 1,015 1,457
Quarterly data (in millions of €) 1 2011 4th Quarter 3rd Quarter 2nd Quarter 1st Quarter
Revenue 73,275 20,285 17,782 17,633 17,575
Net income 6,321 1,231 501 2,836 1,753
1 Regarding activities classified as discontinued operations, prior periods are presented on a comparable basis.
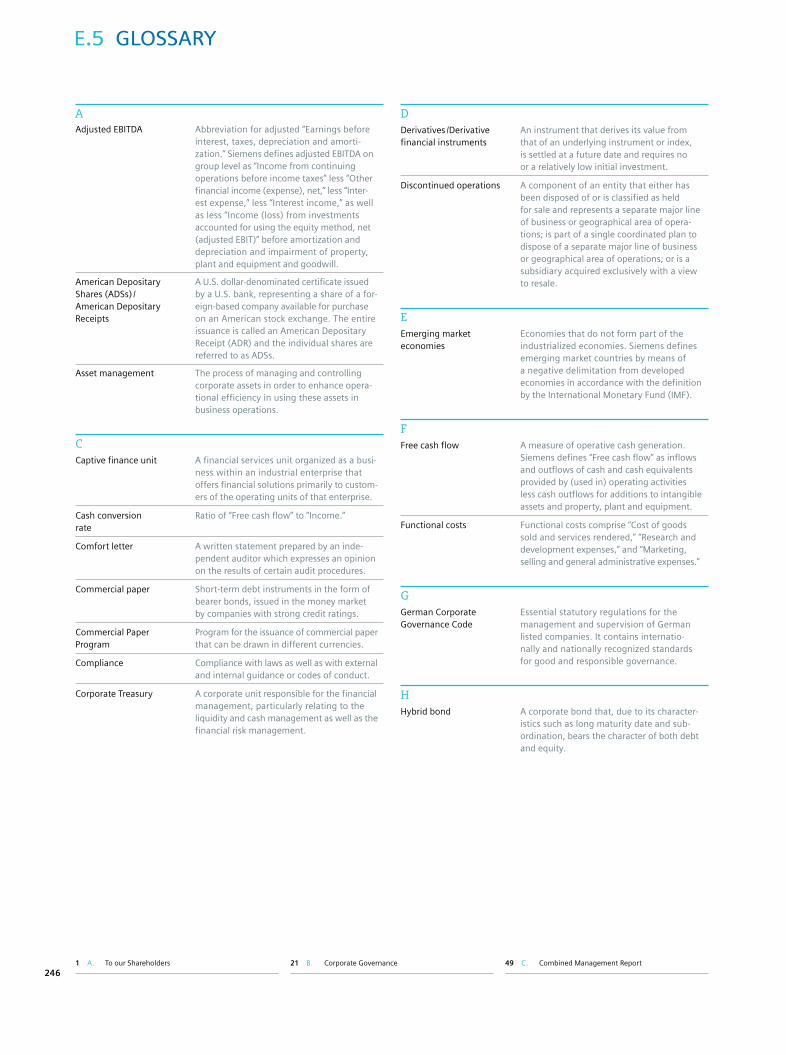
1 A. To our Shareholders 49 C. Combined Management Report 21 B. Corporate Governance246
E.5 glossary
AAdjusted EBITDA Abbreviation for adjusted “Earnings before
interest, taxes, depreciation and amortization.” Siemens defines adjusted EBITDA on group level as “Income from continuing operations before income taxes” less “Other financial income (expense), net,” less “Interest expense,” less “Interest income,” as well as less “Income (loss) from investments accounted for using the equity method, net (adjusted EBIT)” before amortization and depreciation and impairment of property, plant and equipment and goodwill.
American Depositary Shares (ADSs) / American Depositary Receipts
A U.S. dollardenominated certificate issued by a U.S. bank, representing a share of a foreignbased company available for purchase on an American stock exchange. The entire issuance is called an American Depositary Receipt (ADR) and the individual shares are referred to as ADSs.
Asset management The process of managing and controlling corporate assets in order to enhance operational efficiency in using these assets in business operations.
CCaptive finance unit A financial services unit organized as a busi
ness within an industrial enterprise that offers financial solutions primarily to customers of the operating units of that enterprise.
Cash conversion rate
Ratio of “Free cash flow” to “Income.”
Comfort letter A written statement prepared by an independent auditor which expresses an opinion on the results of certain audit procedures.
Commercial paper Shortterm debt instruments in the form of bearer bonds, issued in the money market by companies with strong credit ratings.
Commercial Paper Program
Program for the issuance of commercial paper that can be drawn in different currencies.
Compliance Compliance with laws as well as with external and internal guidance or codes of conduct.
Corporate Treasury A corporate unit responsible for the financial management, particularly relating to the liquidity and cash management as well as the financial risk management.
DDerivatives /Derivative financial instruments
An instrument that derives its value from that of an underlying instrument or index, is settled at a future date and requires no or a relatively low initial investment.
Discontinued operations A component of an entity that either has been disposed of or is classified as held for sale and represents a separate major line of business or geographical area of operations; is part of a single coordinated plan to dispose of a separate major line of business or geographical area of operations; or is a subsidiary acquired exclusively with a view to resale.
EEmerging market economies
Economies that do not form part of the industrialized economies. Siemens defines emerging market countries by means of a negative delimitation from developed economies in accordance with the definition by the International Monetary Fund (IMF).
FFree cash flow A measure of operative cash generation.
Siemens defines “Free cash flow” as inflows and outflows of cash and cash equivalents provided by (used in) operating activities less cash outflows for additions to intangible assets and property, plant and equipment.
Functional costs Functional costs comprise “Cost of goods sold and services rendered,” “Research and development expenses,” and “Marketing, selling and general administrative expenses.”
GGerman Corporate Governance Code
Essential statutory regulations for the management and supervision of German listed companies. It contains internationally and nationally recognized standards for good and responsible governance.
HHybrid bond A corporate bond that, due to its character
istics such as long maturity date and subordination, bears the character of both debt and equity.

135 D. Consolidated Financial Statements 239 E. Additional Information
240 E.1 Responsibility statement 241 E.2 Independent Auditors’ Report 243 E.3 Statement of the Managing Board 244 E.4 Fiveyear summary 246 E.5 Glossary
248 E.6 Index 250 E.7 Further information and information resources 251 E.8 Financial calendar 252 E.9 Company structure
247
MMedium Term Notes Program
A kind of framework agreement between companies and traders of notes (usually banks), enabling a company to issue securities in the capital market under predetermined terms and conditions, thus providing flexibility in raising debt within a very short period of time.
OOperating net working capital
The net amount of inventories less advance payments reveived plus trade and other receivables minus trade payables and minus billings in excess of costs and estimated earnings on uncompleted contracts and related advances.
Order backlog Inventory of orders for goods and services based on binding contractual arrangements with customers.
RRating Standardized indicator for the assessment
of issuers’ credit ratings; carried out by specialized agencies.
Return on capital employed (ROCE)
This indicator shows how efficiently a company works with the capital of its shareholders and lenders.
Risk management Systematic process to identify and assess potential opportunities and risks and to select and implement response strategies with respect to these opportunities and risks.
SSensitivity analysis
Analysis of effects of possible changes in assumptions. It is used, for example, to estimate how net periodic benefit cost is affected by decreasing / increasing discount rates.
Supply Chain Management
Comprises the planning and management of all processes in connection with supplier selection, procurement and logistics.
WWeighted Average Cost of Capital (WACC)
The rate that a company is expected to pay on average to all its providers of capital to finance its assets.

1 A. To our Shareholders 49 C. Combined Management Report 21 B. Corporate Governance248
E.6 IndEx
AAudit Committee II 14f., II 24, II 234
BBengaluru International Airport I 8ff.
Biograph mMR I 20ff.
BSH Bosch und Siemens Hausgeräte GmbH (BSH)
II 58, II 161, II 170, II 212
Building Technologies II 57f., II 78
Business and economic environment II 50ff.
CCapital efficiency and profitability II 64f.
Capital resources and requirements II 86ff.
Capital structure II 65, II 83f.
Chairman’s Committee II 12, II 23f., II 234
Clinical Products II 54
Collective action II 30, II 109f.
Combined Management Report II 49ff.
Company structure II 252f.
Compensation Report II 31ff.
Compliance II 29f., II 109f.
Compliance Committee II 14, II 22, II 234
Compliance Report II 29f.
Consolidated Financial Statements II 135ff.
Consolidated Statements of Cash Flow II 139f.
Consolidated Statements of Changes in Equity II 140f.
Consolidated Statements of Comprehensive Income II 137
Consolidated Statements of Financial Position II 138
Consolidated Statements of Income II 136
Continuing education II 107f., II 133
Corporate Governance Report II 22ff.
Corporate Governance statement II 28
Credit ratings II 19f.
Cross-business activities I 64f.
Customer focus I 81, II 63f., II 103f.
Customer Services (Industry) II 55
Customer Solutions (Energy) II 54
DDeclaration of Conformity with the German Corporate Governance Code II 28
Diagnostics II 54, II 75
Diversity I 66ff., II 107f.
Dividend policy II 18f., II 65f., II 89
Drive Technologies II 55, II 76
EEarnings per share II 18ff., II 147, II 211f.
Emerging countries II 111ff.
Employees I 76f., II 107ff., II 133
Employees and management culture I 76f.
Energy II 52f., II 72ff., II 212
Energy Service II 52
Environmental Portfolio I 33, I 52f., II 104ff.
Environmental program II 106f.
ePS Network Services I 54ff.
Equity and Employee Stock Committee II 238
Equity Investments II 58, II 78, II 212
FFinance and Investment Committee II14, II 24f., II 235
Financial calendar II 251
Financial performance measures II 64ff.
Financial position II 82ff.
Financial Services (SFS) II 58, II 78f., II 212
Five-year summary II 244f.
Fossil Power Generation II 52, II 73
Framework for sustainable value creation I 78ff., II 63f.
GGlobal presence I 18f.
HHealthcare II 53ff., II 74f., II 212
IImaging & Therapy Systems II 54
Independent Auditors’ report II 241f.
Industry II 55f., II 75f., II 212
Industry Automation II 55, II 76
Information recources II 250
Infrastructure & Cities II 56ff., II 77f., II 212
Integrated technology company I 4f., II 50, II 63, II 130
Integrity Initiative II 30, II 110
Invention reports I 32f., II 99
Investor Relations II 18ff.
IT-supported services I 54ff., I 64f.
KKey Account Management I 18f., II 103
Key figures fiscal 2012 Inside flap of the Financial Report

135 D. Consolidated Financial Statements 239 E. Additional Information
240 E.1 Responsibility statement 241 E.2 Independent Auditors’ Report 243 E.3 Statement of the Managing Board 244 E.4 Five-year summary 246 E.5 Glossary
248 E.6 Index 250 E.7 Further information and information resources 251 E.8 Financial calendar 252 E.9 Company structure
249
LLegal proceedings II 191ff.
Letter to our shareholders II 1ff.
Low and Medium Voltage II 57
MManagement and control structure II 22ff.
Managing Board of Siemens AG II 10f., II 236ff.
Mediation Committee II 14, II 24, II 235
Mobility and Logistics II 57
NNet assets position II 93ff.
New orders II 68f.
Nokia Siemens Networks (NSN) B.V. II 58, II 170
Nominating Committee II 14f., II 24, II 235
Notes and forward-looking statements II 134
Notes to Consolidated Financial Statements II 142ff.
OOil & Gas II 52, II 74
One Siemens I 78ff., II 63ff.
Open Innovation I 32f., II 98ff.
OSRAM Licht AG II 6, II 72, II 158f.
Overall assessment of the economic position II 95f.
PPatent applications I 32f., II 99f.
Portfolio management I 52f., II 63f.
Power Matrix I 52f.
Power Transmission II 53, II 74
RRelated party transactions II 215f.
Report of the Supervisory Board II 12ff.
Report on expected developments and associated material opportunities and risks II 111
Research and development (R&D) I 32f., II 98ff.
Responsibility statement II 240
Results of operations II 69ff.
Results of Siemens II 69ff.
Revenue growth II 64
Risk management II 116ff.
SService business I 54ff., I 64f., II 63f.
Share ownership II 33, II 41
Share-based payment II 20, II 208ff.
Siemens AG II 130ff.
Siemens Business Conduct Guidelines II 28, II 29, II 109
Siemens Real Estate II 58, II 79, II 212
Siemens share II 18ff.
SMART (Simple, Maintenance friendly, Affordable, Reliable and Timely to market) I 64f., I 81, II 126
Smart Grids I 46ff., II 98
Statement of the Managing Board II 243
Strategy I 78ff., II 63f.
Subsequent events II 96
Supervisory Board II 12ff., II 232ff.
Sustainability II 97ff.
TTeamcenter I 66ff.
Technology and innovation I 32f., II 98ff.
The Crystal – A Sustainable Cities Initiative by Siemens II 8
The Future of Energy (“Energiewende”) I 46ff., II 2
Training I 64f., I 76f., II 107ff.
VValues II 28, II 29
Vision II 63
WWind Power II 52, II 74

1 A. To our Shareholders 49 C. Combined Management Report 21 B. Corporate Governance250
Further information on the contents of this Annual Report is available from:Address Siemens AG
Wittelsbacherplatz 2 80333 Munich
Germany
Phone + 49 89 636 - 33443 (Media Relations) + 49 89 636 - 32474 (Investor Relations)Fax + 49 89 636 - 30085 (Media Relations) + 49 89 636 - 32830 (Investor Relations)E-mail [email protected] [email protected]
Copies of the Annual Report can be ordered at E-mail [email protected] www.siemens.com/order-annualreport
Fax + 49 7237 - 1736
Siemens employees may obtain copies at Intranet https://c4bs.gss.siemens.com
Fax + 49 911 654 - 4271 English Order no. A19100-F-V94-X-7600German Order no. A19100-F-V94
Employees should include their postal address and complete order data (Org-ID and cost center information) when ordering.
Concept and coordinationCorporate Communications and Government AffairsDr. Johannes von Karczewski
Corporate FinanceDr. Marcus Mayer
Layout | Productionhw.design GmbHPublicis München, ZN der PWW GmbH
Copyright noticeDesignations used in this document may be trademarks, the use of which by third parties for their own purposes could violate the rights of the trademark owners.
Ecofriendly productionThis Annual Report has been produced using chlorine-free bleached materials and climate-neutral production processes. In accordance with the guidelines of the Forest Stewardship Council (FSC), all the paper used in this Annual Report comes from controlled sources such as sustainable forests. The mill in which the paper was produced is certified in accordance with ISO 9001, 14001 and 18001 guidelines. It uses only chlorine-free bleached pulps (ECF), which are subsequently processed without the use of elemental chlorine.
© 2012 by Siemens AG, Berlin and Munich
E.7 furthEr InformatIon and InformatIon rEsourcEs
Additional informationThe Siemens Annual Report for 2012 is available online at
www.siemens.com/annual-report (website) www.siemens.com/ar-mobile (mobile application)
In addition to an Annual Report at the end of each fiscal year, Siemens publishes quarterly consolidated financial statements in the form of press releases. Conference calls and press con-ferences supplement these reports, giving journalists and analysts further opportunities to review developments in our businesses. Financial reporting for the first three quarters is complemented by extensive interim reports. These reports are submitted to Deutsche Börse and the U.S. Securities and Exchange Commission (SEC), among other organizations. Siemens also provides the SEC with the Annual Report on Form 20-F. All these financial reports are available at
www.siemens.com/financialreports
Information on the Company’s commitment to sustainability is available in the Siemens Sustainability Report at
www.siemens.com/sustainability-report
Information on research, development and innovation at Siemens is available at
www.siemens.com/innovation
The Siemens publication Pictures of the Future: The Magazine for Research and Innovation is available at
www.siemens.com/pof
Key to references reference within the publication
reference to an external publication
reference to the financial report
reference to the internet
reference to movies
135 D. Consolidated Financial Statements 239 E. Additional Information
240 E.1 Responsibility statement 241 E.2 Independent Auditors’ Report 243 E.3 Statement of the Managing Board 244 E.4 Five-year summary 246 E.5 Glossary
248 E.6 Index 250 E.7 Further information and information resources 251 E.8 Financial calendar 252 E.9 Company structure
251
E.8 Financial calEndar1
2013
January 23First-quarter financial report
2013
August 1Third-quarter financial report
2013
January 23Annual Shareholders’ Meeting for fiscal 2012
2013
November 7Preliminary figures for fiscal 2013
2013
January 24Ex-dividend date
2014
January 28Annual Shareholders’ Meeting for fiscal 2013
2013
May 2Second-quarter financial report
1 Provisional. Updates will be published at www.siemens.com/financial-calendar
E.
9 C
om
pan
y st
ruct
ure
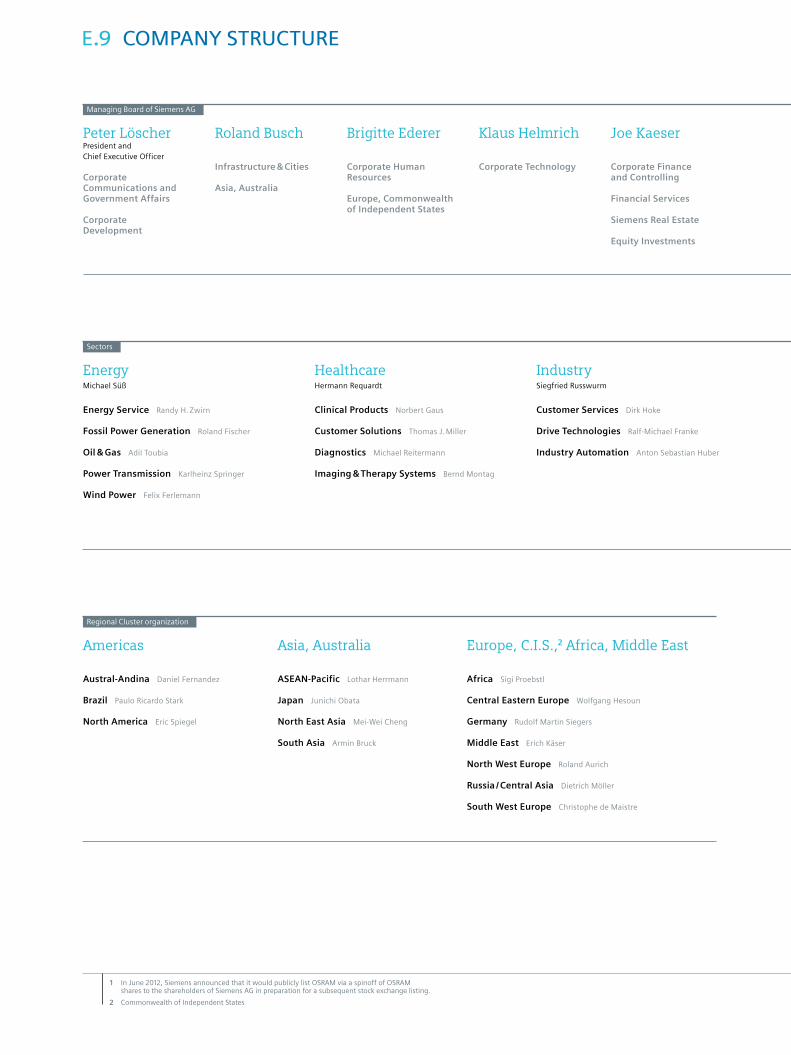
E.9 Company struCturE
1 In June 2012, Siemens announced that it would publicly list OSRAM via a spinoff of OSRAM shares to the shareholders of Siemens AG in preparation for a subsequent stock exchange listing.
2 Commonwealth of Independent States
Roland Busch
Infrastructure & Cities
Asia, Australia
Brigitte Ederer
Corporate Human Resources
Europe, Commonwealth of Independent States
Joe Kaeser
Corporate Finance and Controlling
Financial Services
Siemens Real Estate
Equity Investments
Klaus Helmrich
Corporate Technology
Peter Löscher President and Chief Executive Officer
Corporate Communications and Government Affairs
Corporate Development
Managing Board of Siemens AG
HealthcareHermann Requardt
Clinical Products Norbert Gaus
Customer Solutions Thomas J. Miller
Diagnostics Michael Reitermann
Imaging & Therapy Systems Bernd Montag
Asia, Australia
ASEAN-Pacific Lothar Herrmann
Japan Junichi Obata
North East Asia Mei-Wei Cheng
South Asia Armin Bruck
Europe, C.I.S.,2 Africa, Middle East
Africa Sigi Proebstl
Central Eastern Europe Wolfgang Hesoun
Germany Rudolf Martin Siegers
Middle East Erich Käser
North West Europe Roland Aurich
Russia / Central Asia Dietrich Möller
South West Europe Christophe de Maistre
IndustrySiegfried Russwurm
Customer Services Dirk Hoke
Drive Technologies Ralf-Michael Franke
Industry Automation Anton Sebastian Huber
Americas
Austral-Andina Daniel Fernandez
Brazil Paulo Ricardo Stark
North America Eric Spiegel
EnergyMichael Süß
Energy Service Randy H. Zwirn
Fossil Power Generation Roland Fischer
Oil & Gas Adil Toubia
Power Transmission Karlheinz Springer
Wind Power Felix Ferlemann
Sectors
Regional Cluster organization

1 In June 2012, Siemens announced that it would publicly list OSRAM via a spinoff of OSRAM shares to the shareholders of Siemens AG in preparation for a subsequent stock exchange listing.
2 Commonwealth of Independent States
Barbara Kux
Corporate Supply Chain Management
Corporate Sustainability
Global Shared Services
Hermann Requardt
Healthcare
Siegfried Russwurm
Industry
Corporate Information Technology
Africa, Middle East
Peter Y. Solmssen
Corporate Legal and Compliance
Americas
Michael Süß
Energy
Infrastructure & CitiesRoland Busch
Building Technologies Johannes Milde
Low and Medium Voltage Ralf Christian
Mobility and Logistics Sami Atiya
Rail Systems Jochen Eickholt
Smart Grid Jan Mrosik
Financial Services Roland Chalons-Browne
Global Shared Services Michel E. de Zeeuw
Siemens Real Estate Zsolt Sluitner
OSRAM Licht AG ¹ Wolfgang Dehen
Cross-Sector Activities Separate Business
As of November 28, 2012
The members of the Supervisory Board are listed in chapter D.7 SuperviSory BoarD anD Managing BoarD, pageS 232-233.

siemens.com/annual-report
Ord
er n
o. A
1910
0-F
-V94
-X-7
600
The activities of our Energy, Healthcare, Industry and Infrastructure & Cities Sectors have enabled us to capture leading market and tech-nology positions worldwide. Technological excellence, inno vation, quality, reliability and international focus have been our hallmarks for 165 years, making us strong and linking us to our shareholders, employees and customers as a partner of trust.
We’re one of the world’s largest providers of green technologies. Products and solutions from our Environmental Portfolio already account for some 42 % of our total revenue. In fiscal 2012, our roughly 370,000 employees generated revenue from continuing operations of about € 78 billion and income from continuing operations of € 5.2 billion.