truman state university | distinct by design
TRANSCRIPT


Truman State University
2021-2025 Strategic Plan
“Destiny is not a matter of chance; it is a matter of choice. It is not a thing to be waited for, it is a thing to be achieved.”
William Jennings Bryan
Introduction
In this ever more rapidly changing world, Truman State University’s overarching purpose has remained—to
provide a high-quality liberal arts and sciences education to academically talented and intellectually engaged
students from every corner of Missouri and all parts of the world. We exist to open opportunity, promote
access and social mobility, foster excellence and enable every student to pursue and achieve their unique
goals.
Through a renewed liberal arts and sciences curriculum that is deliberately built for the modern world, we are
dedicated to each of our student’s individual pursuits and ensure their engagement in learning and discovering
their personal and professional purpose by providing intentional curricular and co-curricular opportunities which
are applicable to real-world challenges.
While the challenges of declining state support, tuition caps, societal devaluation of the liberal arts, the
disaggregation of higher education and increased competition have not abated, this strategic plan is designed
to ensure engaged focus on the core areas essential to the present and future success of the University.
Utilizing a slightly modified version of the 4 Disciplines of Execution (McChesney et al., 2012), this plan
focuses on impacting SMART (Specific, Measurable, Attainable, Relevant, Timely) foundational metrics. The 4
Disciplines are: 1) Focus on the Wildly Important Goal (WIG); 2) Act on the Lead Measures; 3) Keep a
Compelling Scorecard; and 4) Create a Cadence of Accountability. Based on the concept of the Pareto
Principle/80-20 Rule in which 80% of consequences come from 20% of causes, the plan is composed of three
primary initiatives designed to impact the foundational metrics. Resource allocation will support the
implementation of the initiatives.
Undeterred by the COVID-19 pandemic, the campus community developed this initiative and metric focused
plan over the course of a year (see Appendices A and B).
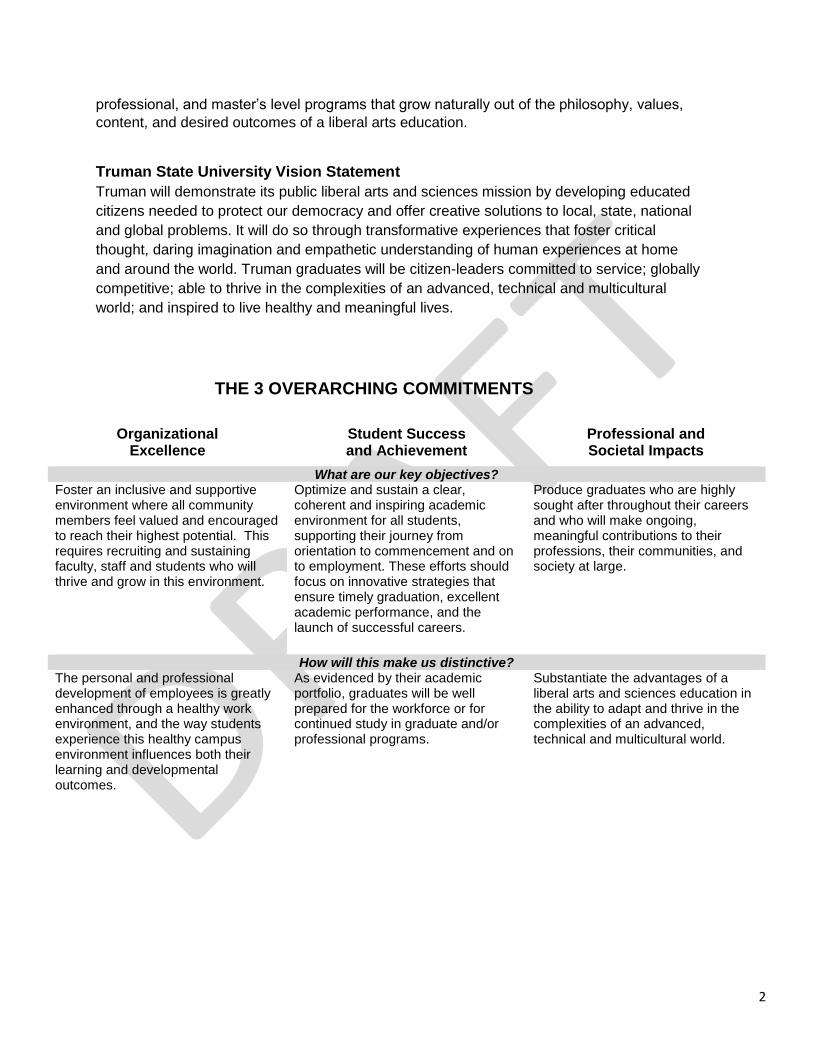
The grounding for the initiatives and metrics is three overarching commitments - Organizational Excellence,
Student Success and Achievement, and Professional and Societal Impacts. These three commitments are the
basis for realizing our mission and vision.
Truman State University Mission Statement
The mission of Truman State University is to offer an exemplary undergraduate education to
well-prepared students, grounded in the liberal arts and sciences, in the context of a public
institution of higher education. To that end, the University offers affordable undergraduate
studies in the traditional arts and sciences as well as selected pre-professional,
2
professional, and master’s level programs that grow naturally out of the philosophy, values,
content, and desired outcomes of a liberal arts education.
Truman State University Vision Statement
Truman will demonstrate its public liberal arts and sciences mission by developing educated
citizens needed to protect our democracy and offer creative solutions to local, state, national
and global problems. It will do so through transformative experiences that foster critical
thought, daring imagination and empathetic understanding of human experiences at home
and around the world. Truman graduates will be citizen-leaders committed to service; globally
competitive; able to thrive in the complexities of an advanced, technical and multicultural
world; and inspired to live healthy and meaningful lives.
THE 3 OVERARCHING COMMITMENTS
Organizational Excellence
Student Success and Achievement
Professional and Societal Impacts
What are our key objectives? Foster an inclusive and supportive environment where all community members feel valued and encouraged to reach their highest potential. This requires recruiting and sustaining faculty, staff and students who will thrive and grow in this environment.
Optimize and sustain a clear, coherent and inspiring academic environment for all students, supporting their journey from orientation to commencement and on to employment. These efforts should focus on innovative strategies that ensure timely graduation, excellent academic performance, and the launch of successful careers.
Produce graduates who are highly sought after throughout their careers and who will make ongoing, meaningful contributions to their professions, their communities, and society at large.
How will this make us distinctive? The personal and professional development of employees is greatly enhanced through a healthy work environment, and the way students experience this healthy campus environment influences both their learning and developmental outcomes.
As evidenced by their academic portfolio, graduates will be well prepared for the workforce or for continued study in graduate and/or professional programs.
Substantiate the advantages of a liberal arts and sciences education in the ability to adapt and thrive in the complexities of an advanced, technical and multicultural world.
3
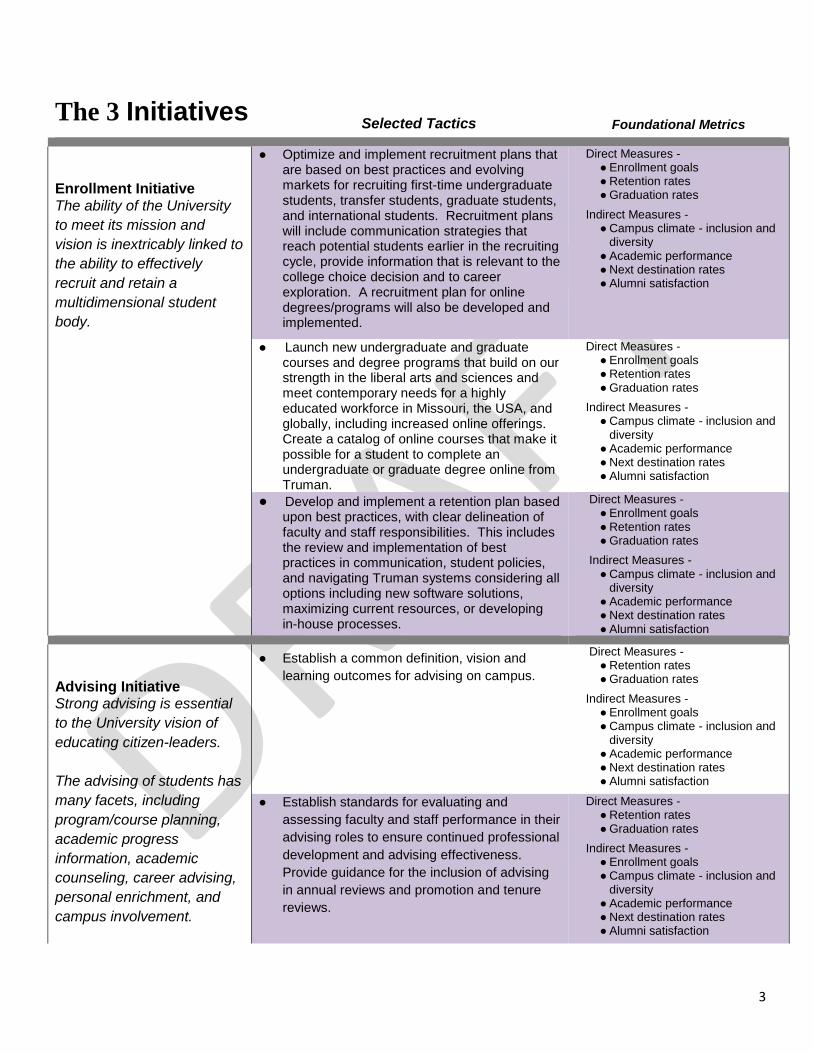
The 3 Initiatives
Selected Tactics
Foundational Metrics
Enrollment Initiative The ability of the University
to meet its mission and
vision is inextricably linked to
the ability to effectively
recruit and retain a
multidimensional student
body.
● Optimize and implement recruitment plans that are based on best practices and evolving markets for recruiting first-time undergraduate students, transfer students, graduate students, and international students. Recruitment plans will include communication strategies that reach potential students earlier in the recruiting cycle, provide information that is relevant to the college choice decision and to career exploration. A recruitment plan for online degrees/programs will also be developed and implemented.
Direct Measures - ● Enrollment goals ● Retention rates ● Graduation rates
Indirect Measures - ● Campus climate - inclusion and
diversity ● Academic performance ● Next destination rates ● Alumni satisfaction
● Launch new undergraduate and graduate courses and degree programs that build on our strength in the liberal arts and sciences and meet contemporary needs for a highly educated workforce in Missouri, the USA, and globally, including increased online offerings. Create a catalog of online courses that make it possible for a student to complete an undergraduate or graduate degree online from Truman.
Direct Measures - ● Enrollment goals ● Retention rates ● Graduation rates
Indirect Measures - ● Campus climate - inclusion and
diversity ● Academic performance ● Next destination rates ● Alumni satisfaction
● Develop and implement a retention plan based upon best practices, with clear delineation of faculty and staff responsibilities. This includes the review and implementation of best practices in communication, student policies, and navigating Truman systems considering all options including new software solutions, maximizing current resources, or developing in-house processes.
Direct Measures - ● Enrollment goals ● Retention rates ● Graduation rates
Indirect Measures - ● Campus climate - inclusion and
diversity ● Academic performance ● Next destination rates ● Alumni satisfaction
Advising Initiative Strong advising is essential
to the University vision of
educating citizen-leaders.
The advising of students has
many facets, including
program/course planning,
academic progress
information, academic
counseling, career advising,
personal enrichment, and
campus involvement.
● Establish a common definition, vision and
learning outcomes for advising on campus.
Direct Measures - ● Retention rates ● Graduation rates
Indirect Measures - ● Enrollment goals ● Campus climate - inclusion and
diversity ● Academic performance ● Next destination rates ● Alumni satisfaction
● Establish standards for evaluating and
assessing faculty and staff performance in their
advising roles to ensure continued professional
development and advising effectiveness.
Provide guidance for the inclusion of advising
in annual reviews and promotion and tenure
reviews.
Direct Measures - ● Retention rates ● Graduation rates
Indirect Measures - ● Enrollment goals ● Campus climate - inclusion and
diversity ● Academic performance ● Next destination rates ● Alumni satisfaction

4
● Develop and implement a training and
professional development plan to support
faculty, professional advisors, career
counselors, and others who perform an
advising or mentoring role in their work.
Direct Measures - ● Retention rates ● Graduation rates
Indirect Measures - ● Enrollment goals ● Campus climate - inclusion and
diversity ● Academic performance ● Next destination rates ● Alumni satisfaction
● Develop and implement a plan to provide
guidance to students on how to maximize their
relationship with their advisor.
Direct Measures - ● Retention rates ● Graduation rates
Indirect Measures - ● Enrollment goals ● Campus climate - inclusion and
diversity ● Academic performance ● Next destination rates ● Alumni satisfaction
Campus Climate Initiative A positive campus climate is crucial to the vitality of our campus community.
While campus climate is broadly defined as “the current attitudes, behaviors and standards of faculty, staff, administrators and students concerning the level of respect for individual needs, abilities and potential” (Rankin & Reason,
2008, p. 264), this initiative is focused on creating an inclusive environment where all community members feel valued and encouraged to reach their highest potential.
● Develop a Diversity and Inclusion strategic
plan that addresses Truman’s enduring
commitment to forming and strengthening
socially just learning and working environments
that foster a culture of excellence by engaging
diverse people, ideas, perspectives and the
community.
Direct Measures ● Campus climate - inclusion and
diversity
Indirect Measures ● Enrollment goals ● Retention rates ● Graduation rates ● Alumni satisfaction
● Strengthen student, staff, and faculty cultural
competency through curricular and co -
curricular opportunities to fulfill student needs
and expectations, so as to:
○ ensure graduates are prepared to
enter a diverse, global society;
○ expand the outreach and engagement
of alumni of color; and
○ expand networking opportunities.
Direct Measures ● Campus climate - inclusion and
diversity
Indirect Measures ● Enrollment goals ● Retention rates ● Graduation rates ● Alumni satisfaction
Institutional Effectiveness
In addition to the three initiatives mentioned above, Truman is committed to making continued improvements in
institutional effectiveness. That is, engaging in ongoing activities to organize evaluation, assessment, and improvement
efforts that demonstrate how well we are fulfilling our mission and achieving our goals.
5
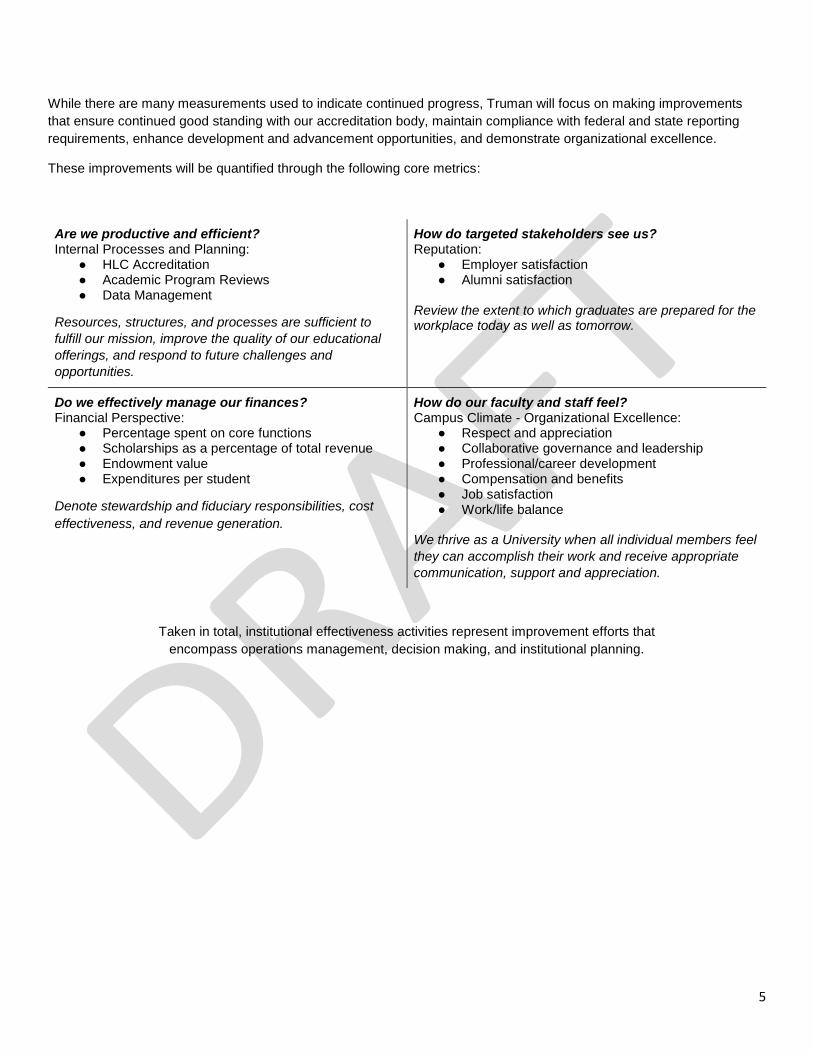
While there are many measurements used to indicate continued progress, Truman will focus on making improvements
that ensure continued good standing with our accreditation body, maintain compliance with federal and state reporting
requirements, enhance development and advancement opportunities, and demonstrate organizational excellence.
These improvements will be quantified through the following core metrics:
Are we productive and efficient? Internal Processes and Planning:
● HLC Accreditation ● Academic Program Reviews ● Data Management
Resources, structures, and processes are sufficient to
fulfill our mission, improve the quality of our educational
offerings, and respond to future challenges and
opportunities.
How do targeted stakeholders see us? Reputation:
● Employer satisfaction ● Alumni satisfaction
Review the extent to which graduates are prepared for the workplace today as well as tomorrow.
Do we effectively manage our finances? Financial Perspective:
● Percentage spent on core functions ● Scholarships as a percentage of total revenue ● Endowment value ● Expenditures per student
Denote stewardship and fiduciary responsibilities, cost
effectiveness, and revenue generation.
How do our faculty and staff feel? Campus Climate - Organizational Excellence:
● Respect and appreciation ● Collaborative governance and leadership ● Professional/career development ● Compensation and benefits ● Job satisfaction ● Work/life balance
We thrive as a University when all individual members feel
they can accomplish their work and receive appropriate
communication, support and appreciation.
Taken in total, institutional effectiveness activities represent improvement efforts that
encompass operations management, decision making, and institutional planning.

6
Appendix A
Development of the plan On November 11, 2019, a Town Hall Meeting was held to introduce the strategic plan framework and serve as the official kickoff of the planning process. With the core structure of the plan identified, the campus as a whole provided the opportunity to participate in the development of initiatives to be enacted that will impact one or more of the metrics.
To appropriately focus and stay the course on making improvement in these areas to be defined in quantitative
terms, the campus community was challenged to reframe thought processes away from the notion that new
initiatives translate to additional demands for all, to a more focused view that defines how we do differently,
and reprioritize what we do and how we advance, knowing that some things may need to be set aside for the
time being if they don’t align with stated objectives for each category. This new lens through which to view the
process opened the door to new and innovative ideas without the encumbrance of increased time and other
resource demands for each member of the community.
While the campus community continued to brainstorm initiatives, several working groups were established to
explore possible metrics to be used for those areas that did not have clearly defined measurements.
Specifically, working groups were established for campus climate, alumni satisfaction and employer
satisfaction. The working groups were also provided access to the Strategic Plan Oversight Metrics Group, and
a list of Strategic Plan Expert Liaisons who served as points of contact in regard to data collection and
available data sets, as well as content experts from various areas of campus will to provide guidance on their
respective functions and how various metrics and data sets may be most useful (see Appendix A for a list of
Metric Team Working Groups, Strategic Plan Oversight Metrics Group and Strategic Plan Expert Liaison
membership.)
A Strategic Plan Drafting Team was appointed by the President to examine all the feedback from individuals
and working teams and incorporate those ideas and concepts into an initial draft plan. The next phase will be
to have the draft plan vetted by appropriate stakeholders and submit the final version to the Board of
Governors for approval at their December 2020 meeting.
To ensure the campus community remains focused on the priorities, initiatives and progress, the University will
host a SPAW session twice per year (once in August, and once in January.) Engaging at regularly scheduled
points will provide opportunity to the University to discuss current status and progress toward goals, maintain
our focus on our specific goals, and ensure the plan remains a dynamic document, which is nimble and allows
changes to occur as needed.

7
Appendix B
Working Groups for 2021-2025 Strategic Plan – Metric Teams/Groups Campus Climate Strategic Plan Metric Team ● Melissa Garzanelli (Chair; Human Resources Generalist)
● Shania Montufar (Student)
● Sara Seifert (Director of Public Safety)
● Brad Turnbull (Interim Director of Center for Diversity and
Inclusion)
● Jonathan Vieker (Director of Retention)
Alumni Satisfaction Strategic Plan Metric Team ● Stacy Tucker Potter (Chair; Director of Engagement)
● Adam McMichael (Assistant Director of Union and
Involvement Services)
● Madison Peterson (Assistant Athletics Director –
Compliance and Operations)
● Amanda Shreves (Assistant Director of Admission –
Technology)
● Tim Wiser (Assistant Professor of Physics)
Employer Satisfaction Strategic Plan Metric Team ● Lance Ratcliff (Chair; Dean of the School of Health Sciences
and Education)
● Tara Hart (Director of Admission)
● Sarah Mohler (Assistant Professor of English)
● Jenni Nuhn (Assistant Director of Career Services)
● Trevor Shonhiwa (Assistant Professor of Accounting)
Strategic Plan Oversight Metric Group ● Steve Petersen (Point of Contact; Assistant to the Executive
Vice President for Academic Affairs)
● Nancy Asher (Registrar)
● Dean DeCock (Director of Assessment and Professor of
Statistics)
● Tammy Roberts (Director of Administrative Computing)
● Steve Wynn (Associate Dean of Libraries for Technical
Services and Systems)
Strategic Plan Drafting Team ● Tim Walston (Chair; Dean of the School of Science and
Mathematics)
● Carolyn Cox (Professor of Health Science)
● Mike Garzanelli (Comptroller)
● Kevin Minch (Associate Provost)
● William Nelsen (Assistant Director of Residence Life)
● Becky Pike (Director of Development, School of Business)
● Diane Richmond (Director of Learning Technologies)
● Emma Rollings (Student)
● Bridget Thomas (Director of Interdisciplinary Studies and
Professor of Classics)
Strategic Plan Expert Liaisons Advising - Andrea Maag (Interim Director of Center for Academic Excellence) Next Destination for Graduates (Career and Graduate/Professional School) – Dave Lusk (Associate Vice President for Career Development) Employers – Suzanne O’Mara (Director of Development/Corporations) External Reports – Arletta Nelson (Assistant to the Vice President for Administration, Finance and Planning) Financial Aid – Marla Fernandez (Director of Financial Aid) Governance –
● Scott Alberts (Faculty Senate President and Professor of Mathematics);
● Kara Jo Levery (Staff Council Chair and Career Ready Coach);
● Deanna Schmidt (Student Government President; Student)
International/Study Abroad – Tim Urbonya (Executive Director of International Education) Information Technology Services –
● Donna Liss (Chief Information Officer) ● Tammy Roberts (Director of Administrative Computing)
Recruitment – Tara Hart (Director of Admission) Retention – Jonathan Vieker (Director of Retention) Student Research – Jessica Colpoys (Office of Student Research Director and Assistant Professor of Agricultural Science) Underserved/Underrepresented Students –
● Heather Cianciola (Director of McNair Program and Assistant Professor of English)
● Brad Turnbull (Interim Director of Center for Diversity and Inclusion)


1
Truman State University Financial Report October 31, 2020 compared to October 31, 2019
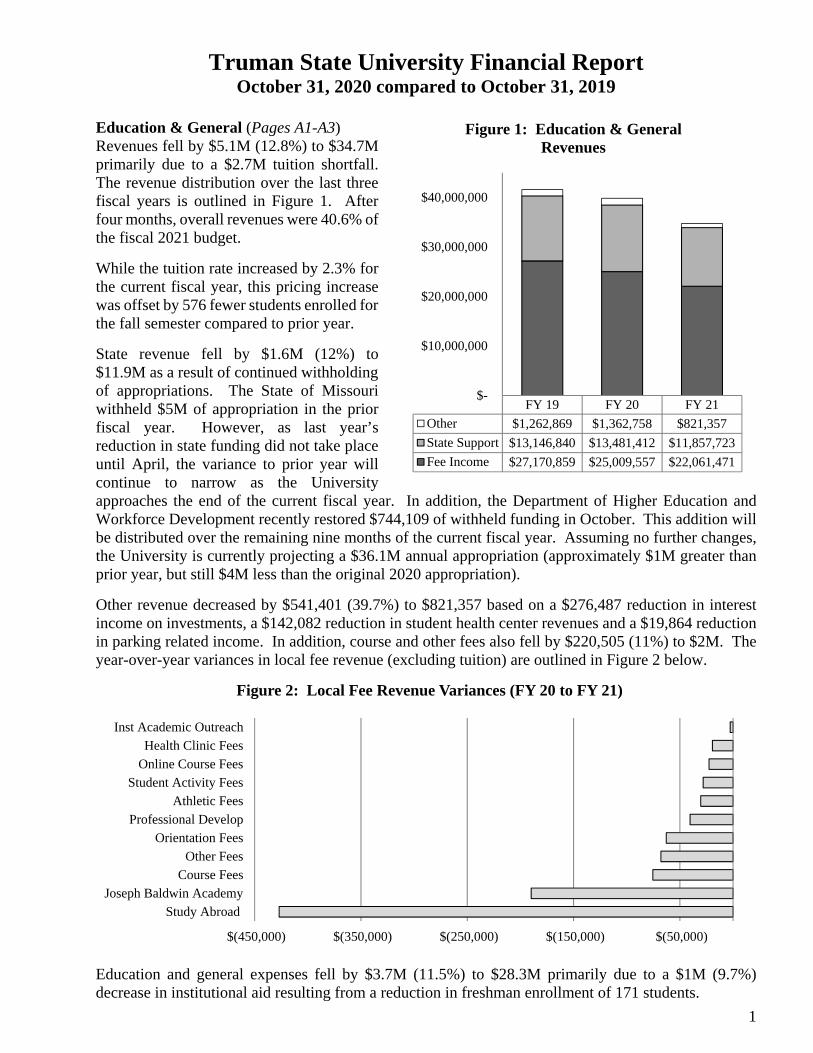
Education & General (Pages A1-A3) Revenues fell by $5.1M (12.8%) to $34.7M primarily due to a $2.7M tuition shortfall. The revenue distribution over the last three fiscal years is outlined in Figure 1. After four months, overall revenues were 40.6% of the fiscal 2021 budget.
While the tuition rate increased by 2.3% for the current fiscal year, this pricing increase was offset by 576 fewer students enrolled for the fall semester compared to prior year.
State revenue fell by $1.6M (12%) to $11.9M as a result of continued withholding of appropriations. The State of Missouri withheld $5M of appropriation in the prior fiscal year. However, as last year’s reduction in state funding did not take place until April, the variance to prior year will continue to narrow as the University approaches the end of the current fiscal year. In addition, the Department of Higher Education and Workforce Development recently restored $744,109 of withheld funding in October. This addition will be distributed over the remaining nine months of the current fiscal year. Assuming no further changes, the University is currently projecting a $36.1M annual appropriation (approximately $1M greater than prior year, but still $4M less than the original 2020 appropriation).
Other revenue decreased by $541,401 (39.7%) to $821,357 based on a $276,487 reduction in interest income on investments, a $142,082 reduction in student health center revenues and a $19,864 reduction in parking related income. In addition, course and other fees also fell by $220,505 (11%) to $2M. The year-over-year variances in local fee revenue (excluding tuition) are outlined in Figure 2 below.
Education and general expenses fell by $3.7M (11.5%) to $28.3M primarily due to a $1M (9.7%) decrease in institutional aid resulting from a reduction in freshman enrollment of 171 students.
$(450,000) $(350,000) $(250,000) $(150,000) $(50,000)
Study AbroadJoseph Baldwin Academy
Course Fees
Other FeesOrientation Fees
Professional Develop
Athletic FeesStudent Activity Fees
Online Course Fees
Health Clinic FeesInst Academic Outreach
Figure 2: Local Fee Revenue Variances (FY 20 to FY 21)
FY 19 FY 20 FY 21
Other $1,262,869 $1,362,758 $821,357
State Support $13,146,840 $13,481,412 $11,857,723
Fee Income $27,170,859 $25,009,557 $22,061,471
$-
$10,000,000
$20,000,000
$30,000,000
$40,000,000
Figure 1: Education & General Revenues

2
University salaries decreased by $719,110 (7.2%) to $9.3M due to a reduction of 21 faculty and staff positions and $146,462 in CARES Act reimbursements for COVID-related leave. The impact of this cost savings was partially offset by a 1.8% average wage increase that took effect in January 2020. Corresponding fringe benefits fell by $365,685 (8.7%) to $3.9M. Student employment expenses also decreased by $168,850 (14.1%) to $1M.
Expenses over the last three fiscal years are outlined in Figure 3. After four months, overall expenses were at 31.1% of the fiscal 2021 budget. Other notable expense variances included:
Office contracts grew by $75,831 (7.8%) based on increased software license renewals including Cisco ($28,463), Funnelback Search Engine ($15,272) and Ellucian ERP ($13,841).
Travel fell by $525,293 (94%) as nearly all University travel has been curtailed due to the pandemic. Professional services decreased by $281,974 (32.4%) due to non-recurring marketing, branding and
employee search costs expended in the prior fiscal year. Equipment and capital expenditures decreased by $278,330 (59.4%) due to non-recurring costs from
the prior year including a planetarium equipment upgrade ($144,500), the Pershing Arena video board ($118,000) and a replacement of the natatorium pool liner ($100,000).
Other expenses fell by $159,935 (22.1%) as a result of fleet fuel and repair savings. Utility costs decreased by $103,608 (12.5%) due to the summer campus closure, improved efficiency
resulting from the recent chiller project and closure of the Kirk building.
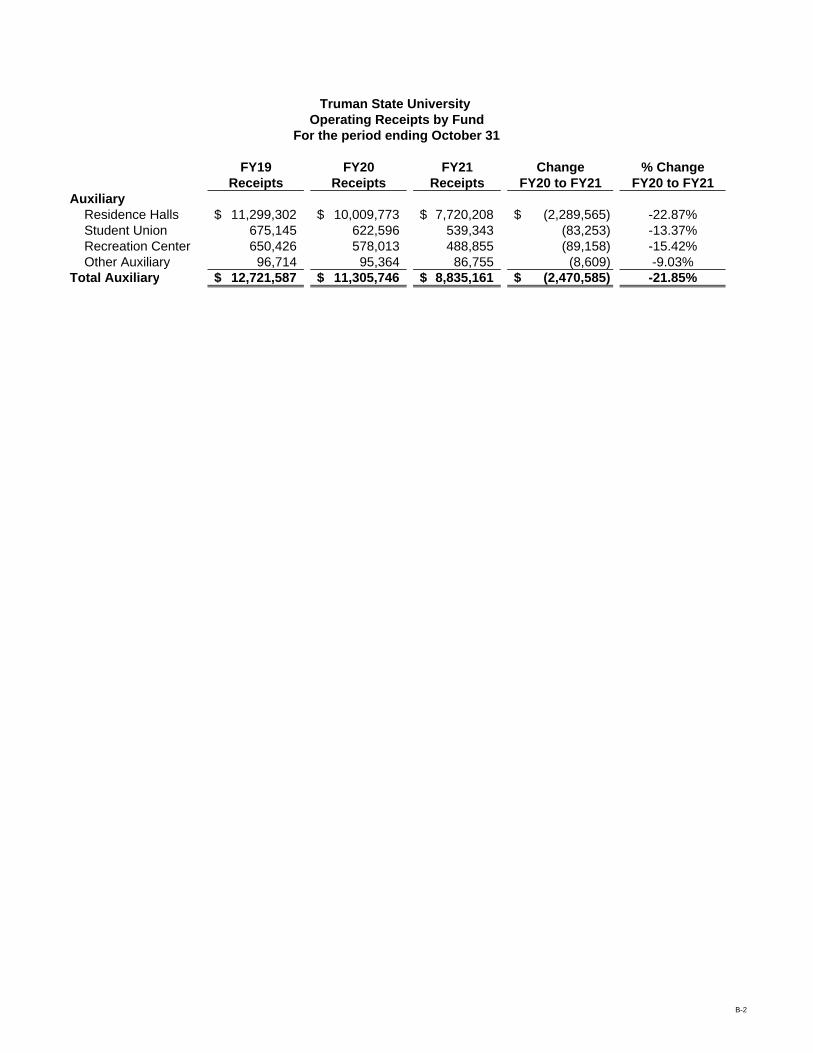
Auxiliary Systems (Pages B1-B3) Auxiliary revenues fell by $2.5M (21.9%) to $8.8M primarily due to a $2.3M (22.9%) shortfall in residence hall income. The variance was driven by a residency reduction of 360 students for the fall semester, and the absence of any on-campus summer residency.
The revenue distribution over the last three fiscal years is outlined in Figure 4. After four months, overall revenues were at 43.7% of the fiscal 2021 budget.
Reduced enrollment also impacted the Student Union and Recreation Center. Fees and revenue in these areas fell by $83,253 and $89,158, respectively. Finally, other auxiliary revenue decreased by $8,609 due to reduced printing services income.
FY 19 FY 20 FY 21
Equip & Capital $23,323 $467,986 $189,656
Other Operating $6,225,563 $6,128,236 $4,934,481
Institutional Aid $10,648,741 $9,952,134 $8,987,675
Salaries & Benefits $15,327,843 $15,431,815 $14,178,170
$-
$10,000,000
$20,000,000
$30,000,000
$40,000,000
Figure 3: Education & General Expenses
FY 19 FY 20 FY 21
Other Auxiliary $96,714 $95,364 $86,755
Recreation Center $650,426 $578,013 $488,855
Student Union $675,145 $622,596 $539,343
Residence Halls $11,299,302 $10,009,773 $7,720,208
$-
$3,000,000
$6,000,000
$9,000,000
$12,000,000
$15,000,000
Figure 4: Auxiliary Revenues
3
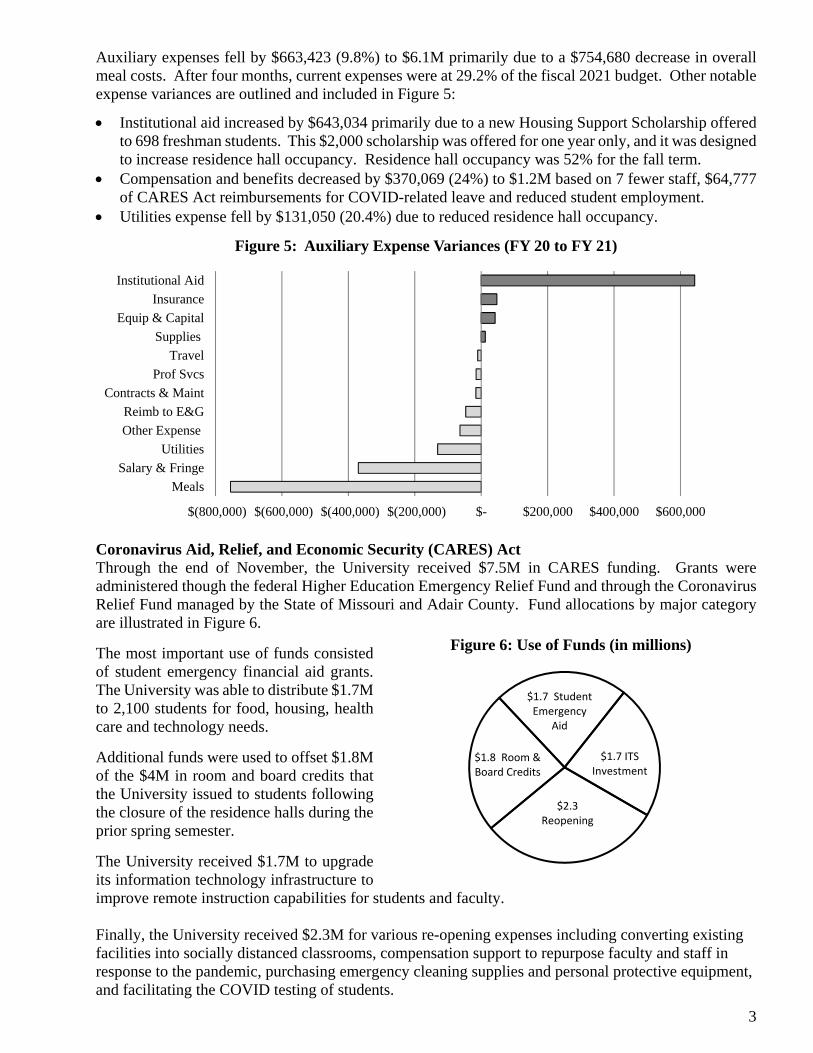
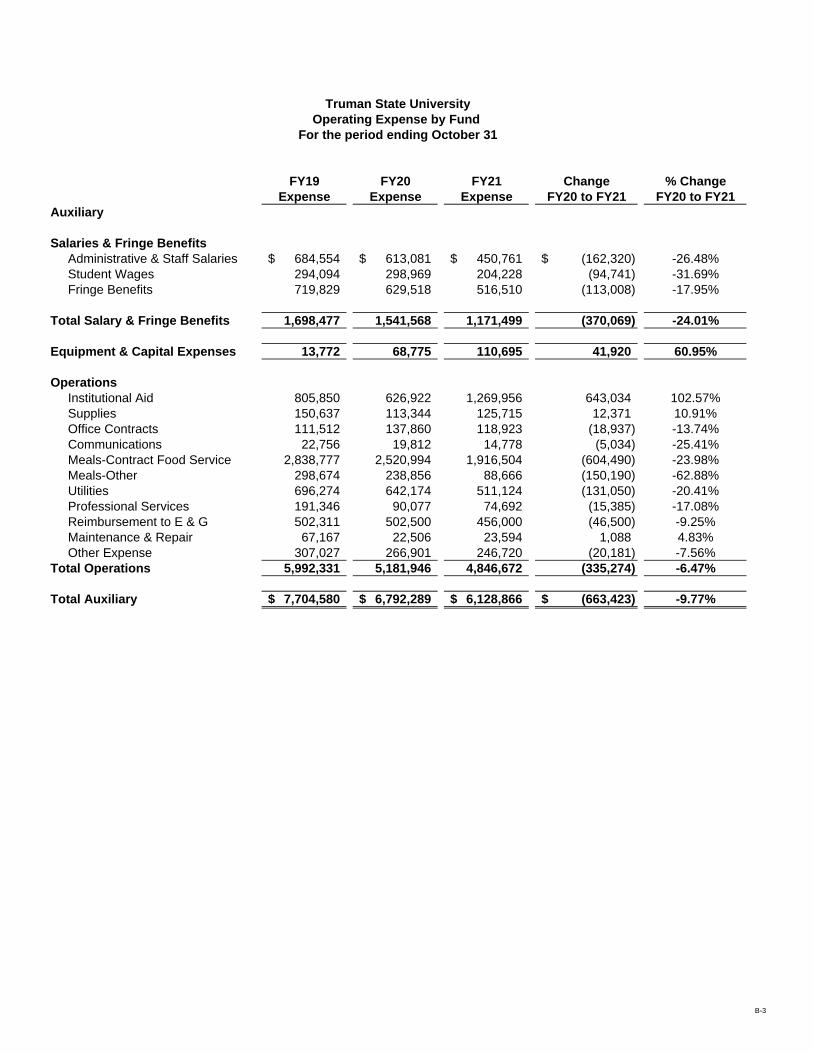
Auxiliary expenses fell by $663,423 (9.8%) to $6.1M primarily due to a $754,680 decrease in overall meal costs. After four months, current expenses were at 29.2% of the fiscal 2021 budget. Other notable expense variances are outlined and included in Figure 5: Institutional aid increased by $643,034 primarily due to a new Housing Support Scholarship offered
to 698 freshman students. This $2,000 scholarship was offered for one year only, and it was designed to increase residence hall occupancy. Residence hall occupancy was 52% for the fall term.
Compensation and benefits decreased by $370,069 (24%) to $1.2M based on 7 fewer staff, $64,777 of CARES Act reimbursements for COVID-related leave and reduced student employment.
Utilities expense fell by $131,050 (20.4%) due to reduced residence hall occupancy.
Coronavirus Aid, Relief, and Economic Security (CARES) Act Through the end of November, the University received $7.5M in CARES funding. Grants were administered though the federal Higher Education Emergency Relief Fund and through the Coronavirus Relief Fund managed by the State of Missouri and Adair County. Fund allocations by major category are illustrated in Figure 6.
The most important use of funds consisted of student emergency financial aid grants. The University was able to distribute $1.7M to 2,100 students for food, housing, health care and technology needs.
Additional funds were used to offset $1.8M of the $4M in room and board credits that the University issued to students following the closure of the residence halls during the prior spring semester.
The University received $1.7M to upgrade its information technology infrastructure to improve remote instruction capabilities for students and faculty. Finally, the University received $2.3M for various re-opening expenses including converting existing facilities into socially distanced classrooms, compensation support to repurpose faculty and staff in response to the pandemic, purchasing emergency cleaning supplies and personal protective equipment, and facilitating the COVID testing of students.
$(800,000) $(600,000) $(400,000) $(200,000) $- $200,000 $400,000 $600,000
Meals
Salary & Fringe
Utilities
Other Expense
Reimb to E&G
Contracts & Maint
Prof Svcs
Travel
Supplies
Equip & Capital
Insurance
Institutional Aid
Figure 5: Auxiliary Expense Variances (FY 20 to FY 21)
$2.3 Reopening
$1.8 Room & Board Credits
$1.7 Student Emergency
Aid
$1.7 ITS Investment
Figure 6: Use of Funds (in millions)

4
It is important to note that only $800,000 of the CARES funds received is reflected as expense reimbursements in the Education & General and Auxiliary current funds reported above. The majority of the CARES reimbursements were (1) applied to prior year costs, (2) applied to plant expenditures for capitalized ITS infrastructure upgrades or (3) represent a pass through of funds in the case of emergency financial aid payments to students.
Truman State University Foundation (Pages C1-C3) Statement of Net Position (Page C-1) Fiscal year-to-date net position improved by $4M to $62.6M. Current assets grew by $708,858 based on a corresponding $462,760 increase in short-term investments and a $227,796 increase in cash. The growth in short-term investments was due to a $500,000 July contribution from the Sunderland Foundation for improvements to the Greenwood Autism Center. The cash increase was due to a timing difference between the current and prior fiscal year associated with when funds were liquidated to support Foundation scholarships. Non-current assets also grew by $3.4M to $57.1M based on a growth in long-term investments. Current liabilities grew by $115,670 to $276,723 based on an $110,383 increase in accounts payable. The year-over-year variance in accounts payable included certain transfers in transit between the short-term and endowed funds. These transactions were subsequently cleared during the month of November. Long-term liabilities were comprised wholly of annuities and trusts payable of $473,029 ($7,760 less than prior year).
Statement of Revenues, Expenditures and Changes in Net Position (Page C-2) Contributions and additions to the permanent endowment additions fell $375,237 to $1M. However, investment gains increased by $1.3M to $2.3M. Expenses and transfers totaled $1.1M this year compared to $2.1M during the prior year. The variance was due to the $1M prior year transfer to Truman State University for the Sandra K. Giachino-Reavey Sesquicentennial Plaza.
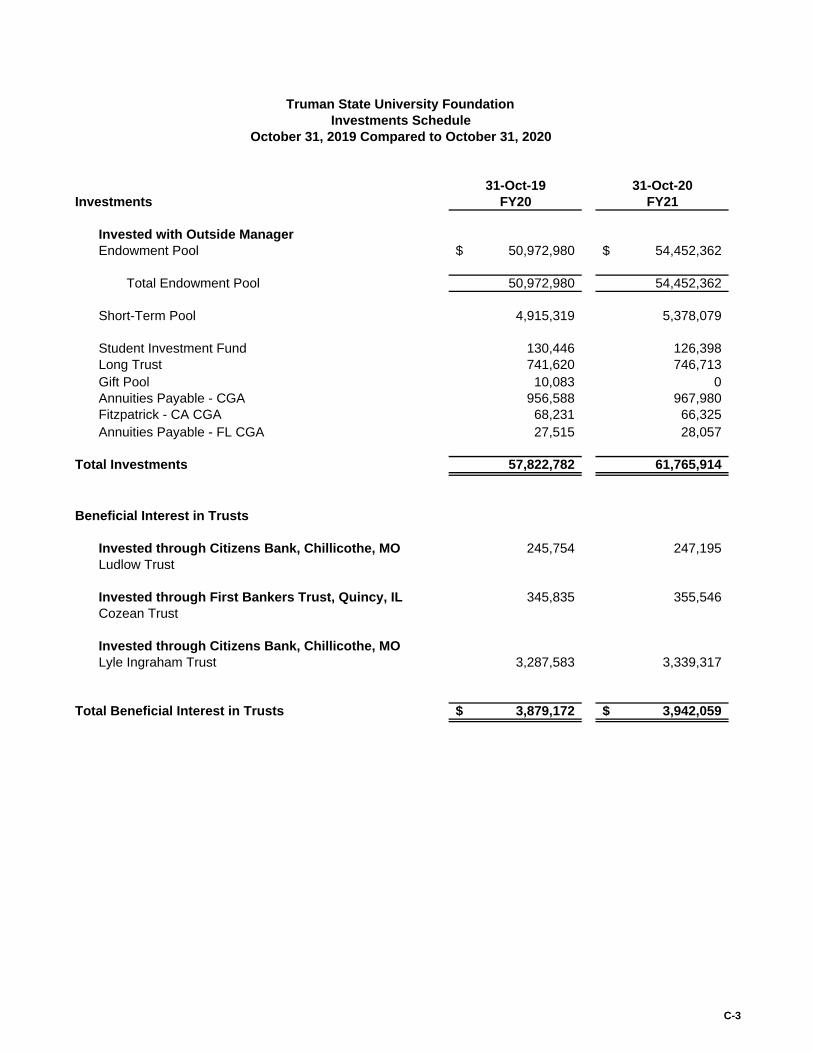
Investments Schedule (Page C-3) Investments (including endowed, short-term, long-term, trusts and annuities) increased by $3.9M to $61.8M with the majority of the growth ($3.5M) concentrated in the endowment. The Foundation also holds beneficial interests in three separate trusts. Their value increased $62,887 to $3.9M.
Percent of Percent of
FY21 FY21 Budget Budget
Budget To Date This Year Last Year
Education & General
Revenues
State Sourced Income 36,452,782$ 11,857,723$ 32.53%
Local Income 45,625,436 22,882,828 50.15%
Projected Draw on Reserves 3,408,699 0.00%
Total Budgeted Revenues 85,486,917 34,740,551 40.64% 42.19%
Rollover from prior year 5,446,847
Total Resources to Spend 90,933,764$
Expenses
Salaries & Fringe Benefits
Faculty/Staff Salaries 35,360,150 9,278,136 26.24%
Student Employment 3,896,377 1,032,705 26.50%
Fringe Benefits 14,820,162 3,867,329 26.10%
Total Salaries & Fringe Benefits 54,076,689 14,178,170 26.22% 27.32%
Equipment & Capitalized Expense 1,315,217 189,656 14.42% 15.48%
Operations
Other Expense 16,298,858 4,206,239 25.81%
Institutional Aid 16,643,000 8,987,675 54.00%
Utilities 2,600,000 728,242 28.01%
Total Operations 35,541,858 13,922,156 39.17% 40.16%
Total Education & General Expense 90,933,764$ 28,289,982$ 31.11% 32.10%
Truman State University
Budget to Actual
For the period ending October 31
A-1

FY19 FY20 FY21 Change % Change
Receipts Receipts Receipts FY20 to FY21 FY20 to FY21
Education & General
State Appropriation
State Appropriation 13,146,840$ 13,470,172$ 11,857,723$ (1,612,449)$ -11.97%
MOExcels Appropriation - 11,240 - (11,240) -100.00%
Total State Sourced Income 13,146,840 13,481,412 11,857,723 (1,623,689) -12.04%
Enrollment Fees
Enrollment Fees 24,698,003 22,786,188 20,058,607 (2,727,581) -11.97%
Course Fees 1,249,659 1,122,295 1,046,851 (75,444) -6.72%
Other Fees 521,651 474,381 407,234 (67,147) -14.15%
Student Activity Fees 214,923 191,108 163,003 (28,105) -14.71%
Athletic Fees 297,096 265,936 235,526 (30,410) -11.44%
Health Clinic Fees 189,527 169,649 150,250 (19,399) -11.43%
Total Student Fees 27,170,859 25,009,557 22,061,471 (2,948,086) -11.79%
Other Income 1,262,869 1,362,758 821,357 (541,401) -39.73%
Total Education & General 41,580,568$ 39,853,727$ 34,740,551$ (5,113,176)$ -12.83%
Truman State University
Operating Receipts by Fund
For the period ending October 31
A-2
FY19 FY20 FY21 Change % Change
Expense Expense Expense FY20 to FY21 FY20 to FY21
Education & General
Salaries & Fringe Benefits
Faculty & Staff Salaries 10,177,207$ 9,997,246$ 9,278,136$ (719,110)$ -7.19%
Student Employment 1,226,732 1,201,555 1,032,705 (168,850) -14.05%
Fringe Benefits 3,923,904 4,233,014 3,867,329 (365,685) -8.64%
Total Salary & Fringe Benefits 15,327,843 15,431,815 14,178,170 (1,253,645) -8.12%
Equipment & Capital Expenses 23,323 467,986 189,656 (278,330) -59.47%
Operations
Institutional Aid 10,648,741 9,952,134 8,987,675 (964,459) -9.69%
Travel 741,530 558,955 33,662 (525,293) -93.98%
Utilities 879,449 831,850 728,242 (103,608) -12.46%
Professional Services 696,867 858,579 576,605 (281,974) -32.84%
Supplies 768,149 696,504 640,920 (55,584) -7.98%
Office Contracts 898,513 976,438 1,052,269 75,831 7.77%
Library Acquisitions 690,911 659,019 573,832 (85,187) -12.93%
Communications 351,131 349,088 300,223 (48,865) -14.00%
Energy Lease Principal & Interest 420,000 420,000 420,000 - 0.00%
Maintenance & Repair 97,181 53,645 44,505 (9,140) -17.04%
Other Expense 681,832 724,158 564,223 (159,935) -22.09%
Total Operations 16,874,304 16,080,370 13,922,156 (2,158,214) -13.42%
Total Education & General 32,225,470$ 31,980,171$ 28,289,982$ (3,690,189)$ -11.54%
Truman State University
Operating Expense by Fund
For the period ending October 31
A-3
Percent of Percent of
FY21 FY21 Budget Budget
Budget To Date This Year Last Year
Auxiliary Systems
Revenues
Residence Halls 16,950,000$ 7,720,208$
Student Union 1,050,000 539,343
Recreation Center 945,000 488,855
Other Auxiliary 447,000 86,755
Projected Draw on Reserves 825,670
Total Budgeted Revenues 20,217,670 8,835,161 43.70% 44.97%
Rollover from prior year 771,722
Total Resources to Spend 20,989,392$
Expenses
Salaries & Fringe Benefits
Salaries 1,905,120 450,761
Student Salaries 652,686 204,228
Fringe Benefits 1,696,232 516,510
Total Salaries & Fringe Benefits 4,254,038 1,171,499 27.54% 32.87%
Equipment /Capitalized Expense 194,543 110,695 56.90% 1.60%
Operations
Bond Principal & Interest 2,591,779 - 0.00%
Meals-Contract Food Service 7,400,000 1,916,504 25.90%
Other Expense 3,275,032 1,149,088 35.09%
Institutional Aid 1,300,000 1,269,956 97.69%
Utilities 1,974,000 511,124 25.89%
Total Operations 16,540,811 4,846,672 29.30% 25.62%
Total Auxiliary Expense 20,989,392$ 6,128,866$ 29.20% 26.26%
Truman State University
Budget to Actual
For the period ending October 31
B-1
FY19 FY20 FY21 Change % Change
Receipts Receipts Receipts FY20 to FY21 FY20 to FY21
Auxiliary
Residence Halls 11,299,302$ 10,009,773$ 7,720,208$ (2,289,565)$ -22.87%
Student Union 675,145 622,596 539,343 (83,253) -13.37%
Recreation Center 650,426 578,013 488,855 (89,158) -15.42%
Other Auxiliary 96,714 95,364 86,755 (8,609) -9.03%
Total Auxiliary 12,721,587$ 11,305,746$ 8,835,161$ (2,470,585)$ -21.85%
Truman State University
Operating Receipts by Fund
For the period ending October 31
B-2
FY19 FY20 FY21 Change % Change
Expense Expense Expense FY20 to FY21 FY20 to FY21
Auxiliary
Salaries & Fringe Benefits
Administrative & Staff Salaries 684,554$ 613,081$ 450,761$ (162,320)$ -26.48%
Student Wages 294,094 298,969 204,228 (94,741) -31.69%
Fringe Benefits 719,829 629,518 516,510 (113,008) -17.95%
Total Salary & Fringe Benefits 1,698,477 1,541,568 1,171,499 (370,069) -24.01%
Equipment & Capital Expenses 13,772 68,775 110,695 41,920 60.95%
Operations
Institutional Aid 805,850 626,922 1,269,956 643,034 102.57%
Supplies 150,637 113,344 125,715 12,371 10.91%
Office Contracts 111,512 137,860 118,923 (18,937) -13.74%
Communications 22,756 19,812 14,778 (5,034) -25.41%
Meals-Contract Food Service 2,838,777 2,520,994 1,916,504 (604,490) -23.98%
Meals-Other 298,674 238,856 88,666 (150,190) -62.88%
Utilities 696,274 642,174 511,124 (131,050) -20.41%
Professional Services 191,346 90,077 74,692 (15,385) -17.08%
Reimbursement to E & G 502,311 502,500 456,000 (46,500) -9.25%
Maintenance & Repair 67,167 22,506 23,594 1,088 4.83%
Other Expense 307,027 266,901 246,720 (20,181) -7.56%
Total Operations 5,992,331 5,181,946 4,846,672 (335,274) -6.47%
Total Auxiliary 7,704,580$ 6,792,289$ 6,128,866$ (663,423)$ -9.77%
Truman State University
Operating Expense by Fund
For the period ending October 31
B-3

ASSETS 31-Oct-19 31-Oct-20 Change
FY20 FY21 FY20 to FY21
Current Assets
Cash 310,472$ 538,268$ 227,796$
Short Term Investments 4,915,319 5,378,079 462,760
Prepaid Expenses 1,000 - (1,000)
Interest Receivable 44,949 59,827 14,878
Loans Receivable, net of allowance 178,414 182,837 4,424
Total Current Assets 5,450,154 6,159,012 708,858
Non-Current Assets
Investments 52,907,463 56,387,835 3,480,372
Loans Receivable, net of allowance 671,176 612,108 (59,068)
Cash Value of Life Insurance 147,770 145,222 (2,548)
Total Non-Current Assets 53,726,409 57,145,165 3,418,756
Total Assets 59,176,563$ 63,304,177$ 4,127,614$
LIABILITIES
Current Liabilities
Accounts Payable 93,807$ 204,190$ 110,383$
Refundable Advance 13,840 15,481 1,641
Annuities & Trusts Payable 53,406 57,052 3,647
Total Current Liabilities 161,053 276,723 115,670
Non-Current Liabilities
Annuities & Trusts Payable 480,789 473,029 (7,760)
Total Non-Current Liabilities 480,789 473,029 (7,760)
Total Liabilities 641,842$ 749,752$ 107,910$
NET POSITION 58,534,721$ 62,554,425$ 4,019,704$
Truman State University Foundation
Statement of Net Position
October 31, 2019 Compared to October 31, 2020
C-1

31-Oct-19 31-Oct-20 Change
FY20 FY21 FY20 to FY21
Operating Revenue
Interest on Student Loan Receivable 8,321$ 6,690$ (1,631)$
Total Operating Revenues 8,321 6,690 (1,631)
Operating Expenses
Scholarships 617,990 514,800 (103,189)
Supplies & Other Services 173,424 143,665 (29,760)
Travel Expense 71,865 1,579 (70,286)
Other Expense 33,481 30,019 (3,462)
Total Operating Expenses 896,760 690,064 (206,697)
Operating Gain (Loss) (888,440) (683,374) 205,066
Non-Operating Revenues (Expenses)
Contributions 1,042,388 887,030 (155,358)
Interest & Dividends 309,445 148,480 (160,965)
Realized Gain (Loss) 4,347,489 4,392,859 45,369
Unrealized Gain (Loss) (3,666,576) (2,279,274) 1,387,302
Other Non-Operating Income 19,059 6,844 (12,215)
Other Non-Operating Expense (40,593) (82,607) (42,014)
Actuarial Loss on Annuity & Trust Obligation (10,110) - 10,110
Net Non-Operating Revenues (Expenses) 2,001,103 3,073,332 1,072,229
Income before other Revenues, Expenses, 1,112,663 2,389,958 1,277,294
Gains, Losses & Transfers
Additions to Permanent Endowments 379,654 159,775 (219,879)
Transfers to Education & General for Administration (39,767) (39,767) -
Transfers to Education & General (110,945) (195,271) (84,326)
Transfer to Auxiliary - Other (1,151) (4,517) (3,366)
Transfer to Fundraising (500) - 500
Transfer to Capital Fund - Plant (1,055,182) (55,556) 999,626
Increase (Decrease) in Net Assets 284,772 2,254,622 1,969,850
Net Position, Beginning of Year 58,249,949 60,299,803
Net Position Ending Balance 58,534,721$ 62,554,425$ 4,019,704$
Truman State University Foundation
Statement of Revenues, Expenses & Changes in Net Position
October 31, 2019 Compared to October 31, 2020
C-2
31-Oct-19 31-Oct-20
Investments FY20 FY21
Invested with Outside Manager
Endowment Pool 50,972,980$ 54,452,362$
Total Endowment Pool 50,972,980 54,452,362
Short-Term Pool 4,915,319 5,378,079
Student Investment Fund 130,446 126,398
Long Trust 741,620 746,713
Gift Pool 10,083 0
Annuities Payable - CGA 956,588 967,980
Fitzpatrick - CA CGA 68,231 66,325
Annuities Payable - FL CGA 27,515 28,057
Total Investments 57,822,782 61,765,914
Beneficial Interest in Trusts
Invested through Citizens Bank, Chillicothe, MO 245,754 247,195
Ludlow Trust
Invested through First Bankers Trust, Quincy, IL 345,835 355,546
Cozean Trust
Invested through Citizens Bank, Chillicothe, MO
Lyle Ingraham Trust 3,287,583 3,339,317
Total Beneficial Interest in Trusts 3,879,172$ 3,942,059$
Truman State University Foundation
Investments Schedule
October 31, 2019 Compared to October 31, 2020
C-3