true ad value white paper
TRANSCRIPT

True Ad ValueTM
DISCOVER WHICH ADS ARE TRULY DRIVING REVENUE
WWW.NINJAMETRICS.COM
© 2015 Ninja Metrics ®

www.ninjametrics.com
© 2015 Ninja Metrics®
www.ninjametrics.com | [email protected]
True Ad ValueTM | Page 2
Table Of Contents
Introduction 3
Back to Basics: Why Should We Care about Attribution? 5
Attribution Today, and Why It’s a Problem 6
Not All Users Are Created Equal 10
Measuring Social Impact 11
The Biggest Fish in the Sea: Social Whales® 14
You know that 50% of advertising works, but which 50%? 16
Examples of How This Will Change Your Life, Or At Least The Way You Bid On Ads 21

www.ninjametrics.com
© 2015 Ninja Metrics®
www.ninjametrics.com | [email protected]
True Ad ValueTM | Page 3
IntroductionThere’s an adage that 50 percent of advertising works — but no
one knows which 50 percent. With advancements in
technology and data tracking, there is no longer any excuse
for this — at least online. A growing infrastructure of data
tagging and tracking, combined with basic best practices
around databases and dashboards, means that the mystery
is disappearing. And, going beyond these block-and-tackle
steps, techniques like predictive analytics are giving
marketers more power still.
This white paper gives you the lay of the land, as well as the
method of True Ad ValueTM, which builds upon these basics by
incorporating social inputs from your app or game.

www.ninjametrics.com
© 2015 Ninja Metrics®
www.ninjametrics.com | [email protected]
True Ad ValueTM | Page 4
SECTION 1:
THE PROBLEM WITH ATTRIBUTION TODAY
www.ninjametrics.com
© 2015 Ninja Metrics®
www.ninjametrics.com | [email protected]
True Ad ValueTM | Page 5
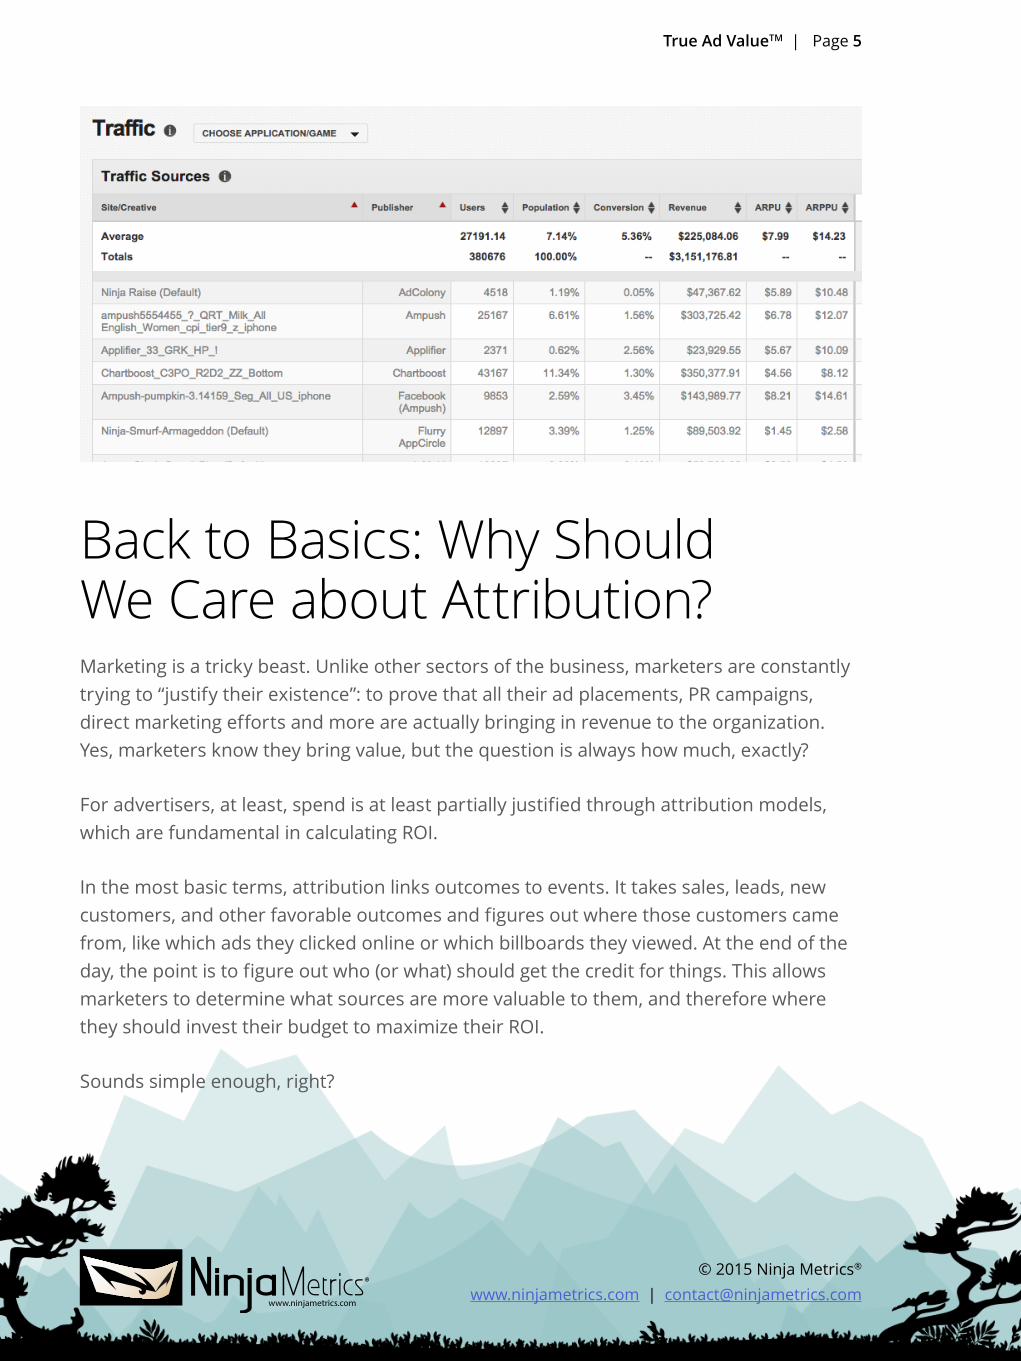
Back to Basics: Why Should We Care about Attribution? Marketing is a tricky beast. Unlike other sectors of the business, marketers are constantly
trying to “justify their existence”: to prove that all their ad placements, PR campaigns,
direct marketing efforts and more are actually bringing in revenue to the organization.
Yes, marketers know they bring value, but the question is always how much, exactly?
For advertisers, at least, spend is at least partially justified through attribution models,
which are fundamental in calculating ROI.
In the most basic terms, attribution links outcomes to events. It takes sales, leads, new
customers, and other favorable outcomes and figures out where those customers came
from, like which ads they clicked online or which billboards they viewed. At the end of the
day, the point is to figure out who (or what) should get the credit for things. This allows
marketers to determine what sources are more valuable to them, and therefore where
they should invest their budget to maximize their ROI.
Sounds simple enough, right?

www.ninjametrics.com
© 2015 Ninja Metrics®
www.ninjametrics.com | [email protected]
True Ad ValueTM | Page 6
Attribution Today, and Why It’s a ProblemThe problem is that current attribution models aren’t very accurate when you take into account the plethora of advertising sources out there, especially online.
Let’s say you have a customer — a super-loyal customer — who’s your follower on Twitter,
subscribes to your newsletter, searches for your product and sees your ads all over the
web, from Google to Facebook. This customer ends up buying lots
of your product. But what source did they come from?
You might say, “It doesn’t matter! They ended up buying, so that’s what counts, right?”
Though this super-loyal customer did end up buying,
that doesn’t help justify your massive marketing spend
to the CFO. You can blanket the web in ads, but who’s to
say you’re not overpaying for all the sources that did work
— and, if you’re pricing ads, who’s to say your ads aren’t
undervalued? Without an accurate gauge of advertising value,
click-throughs can be underreported, and the ad will be
devalued, leading to inaccurate ROI reporting. Even worse, the
process can go the other way, and you could be buying up
overvalued ads and sending your company over budget, much
to the chagrin of that CFO. You may sometimes hear the term
“optimizing,” and this is what it means in the most generic
sense: making sure you are spending efficiently given
the information and tools at hand.
www.ninjametrics.com
© 2015 Ninja Metrics®
www.ninjametrics.com | [email protected]
True Ad ValueTM | Page 7
So, how are people optimizing ad buys today? Not very well, actually. Attribution models
exist, of course, but the numbers for Cost of Customer Acquisition (CaC) and Cost Per
Install (CPI) can’t exactly be trusted with current models.
Let me put it bluntly: Current attribution models are broken. According to Adobe, 54% of
businesses use some form of attribution, but 58% think perfect attribution is impossible.
That means a good number of businesses are flying blind and doing it “just because” —
never a good way to build a foundation. To make matters worse, 38% of users attribute
ads manually, which causes lots of unnecessary headaches and leaves lots of room for
error.
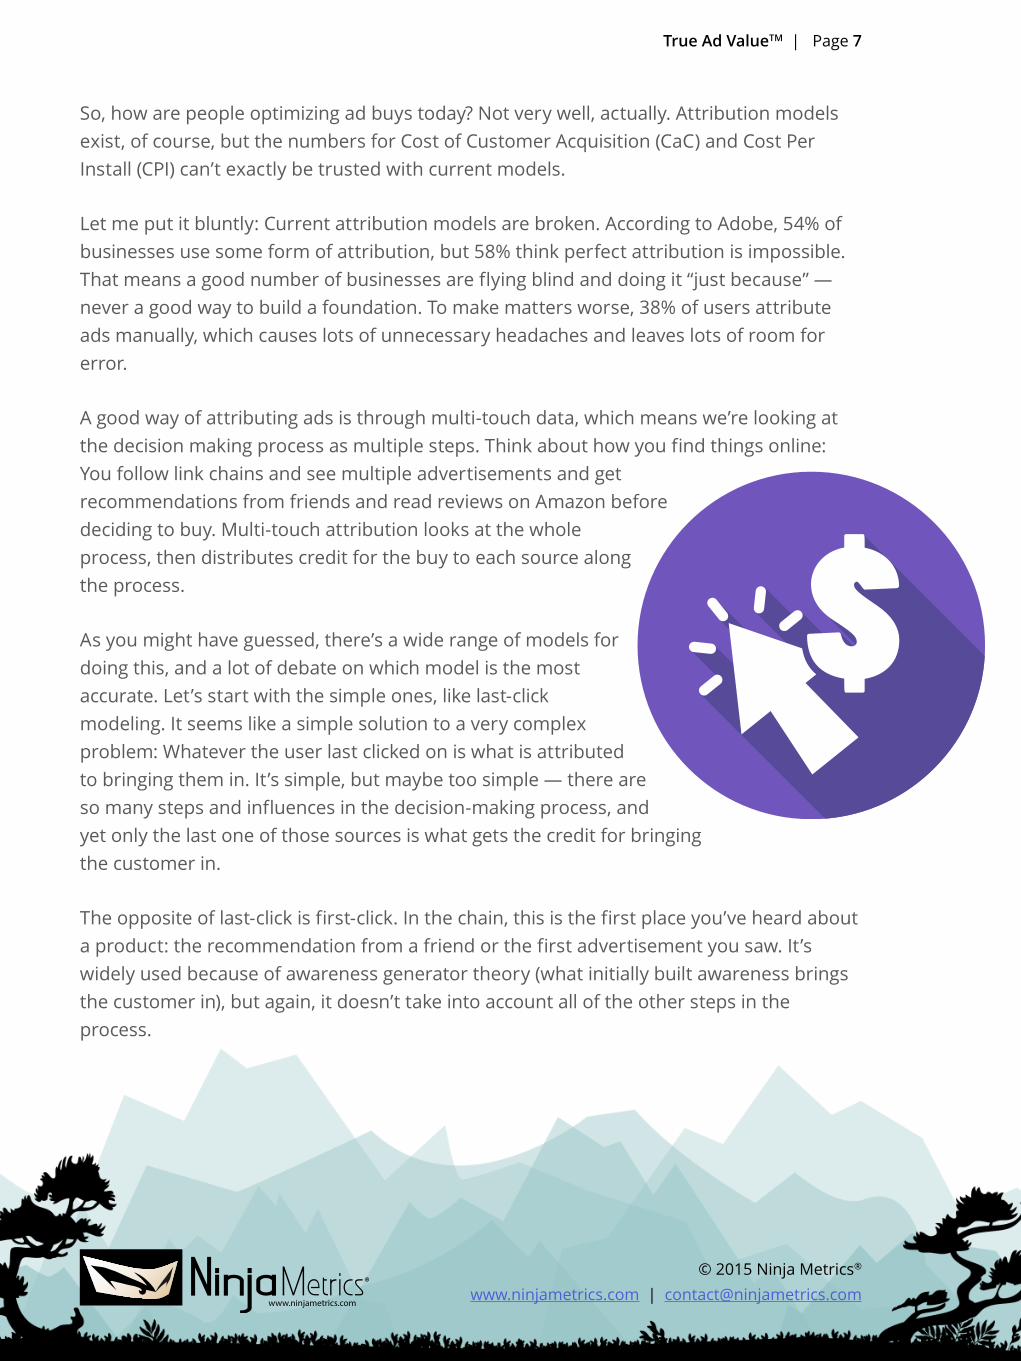
A good way of attributing ads is through multi-touch data, which means we’re looking at
the decision making process as multiple steps. Think about how you find things online:
You follow link chains and see multiple advertisements and get
recommendations from friends and read reviews on Amazon before
deciding to buy. Multi-touch attribution looks at the whole
process, then distributes credit for the buy to each source along
the process.
As you might have guessed, there’s a wide range of models for
doing this, and a lot of debate on which model is the most
accurate. Let’s start with the simple ones, like last-click
modeling. It seems like a simple solution to a very complex
problem: Whatever the user last clicked on is what is attributed
to bringing them in. It’s simple, but maybe too simple — there are
so many steps and influences in the decision-making process, and
yet only the last one of those sources is what gets the credit for bringing
the customer in.
The opposite of last-click is first-click. In the chain, this is the first place you’ve heard about
a product: the recommendation from a friend or the first advertisement you saw. It’s
widely used because of awareness generator theory (what initially built awareness brings
the customer in), but again, it doesn’t take into account all of the other steps in the
process.

www.ninjametrics.com
© 2015 Ninja Metrics®
www.ninjametrics.com | [email protected]
True Ad ValueTM | Page 8
There’s also linear attribution, which attributes to each of the steps in the chain equally.
Which is good because it takes into account multiple sources. However, it doesn’t take into
account that different ad sources might elicit different responses (and therefore interest)
from users.
As attribution has evolved, the models have become more advanced. Time decay starts to
take into account cognition and the decision making process, and says that interest (and
therefore attribution) grows as time goes on. The first-click doesn’t have too much credit
assigned, but it grows with each step in the chain. However, this model might overvalue
the last-click that “seals the deal.”
Another slightly more complex model is position-based attribution. The first and the last-
click are assigned the most credit, and the rest of the credit is distributed evenly on all the
touchpoints in between. Again, better: but all the values are ultimately arbitrary.
So now that we’ve pointed out all the problems, what’s the solution? Is there a perfect way
to attribute ads.
We think so. We live in an era where we are drowning in data, so instead of assigning
arbitrary values and guessing, let’s use data-driven models to attribute ads: models that
observe, look at patterns, and draw conclusions based on those patterns.
More on that later. Before we go into using this data, we first have to get a better picture
of our users.
0
20%
First Click Second Click Third Click Last Click
40%
60%
80%
100%
Cred
it As
signe
d
FIRST CLICK
0
20%
First Click Second Click Third Click Last Click
40%
60%
80%
100%
LAST CLICK
Cred
it As
signe
d

www.ninjametrics.com
© 2015 Ninja Metrics®
www.ninjametrics.com | [email protected]
True Ad ValueTM | Page 9
SECTION 2:
NOT ALL USERS ARE CREATED EQUAL
www.ninjametrics.com
© 2015 Ninja Metrics®
www.ninjametrics.com | [email protected]
True Ad ValueTM | Page 10
Not All Users Are Created EqualIf you’ve grokked the above, you have the basic mechanics of attribution down, and you
are in a good position to know your ROI. This puts you ahead of the majority of marketers.
However, what you now have also rests on a crucial assumption: all users are equal. Your
reaction should be, Wait, I just paired in-app spending with correct attribution, aren’t I
done? Well, if your users are socially interacting with each other, then no, you definitely are
not.
Social Value®: Ninja Metrics’ unique model based on your data, identifies the people who actually cause other people to play, stay and spend.
The strategically sound way is to figure out who your most important users are, determine
what ads they’re looking at and responding to, then place your spend there. New
attribution models should take this into
account.
The first step to this equation, then, is
figuring out who these important users are.
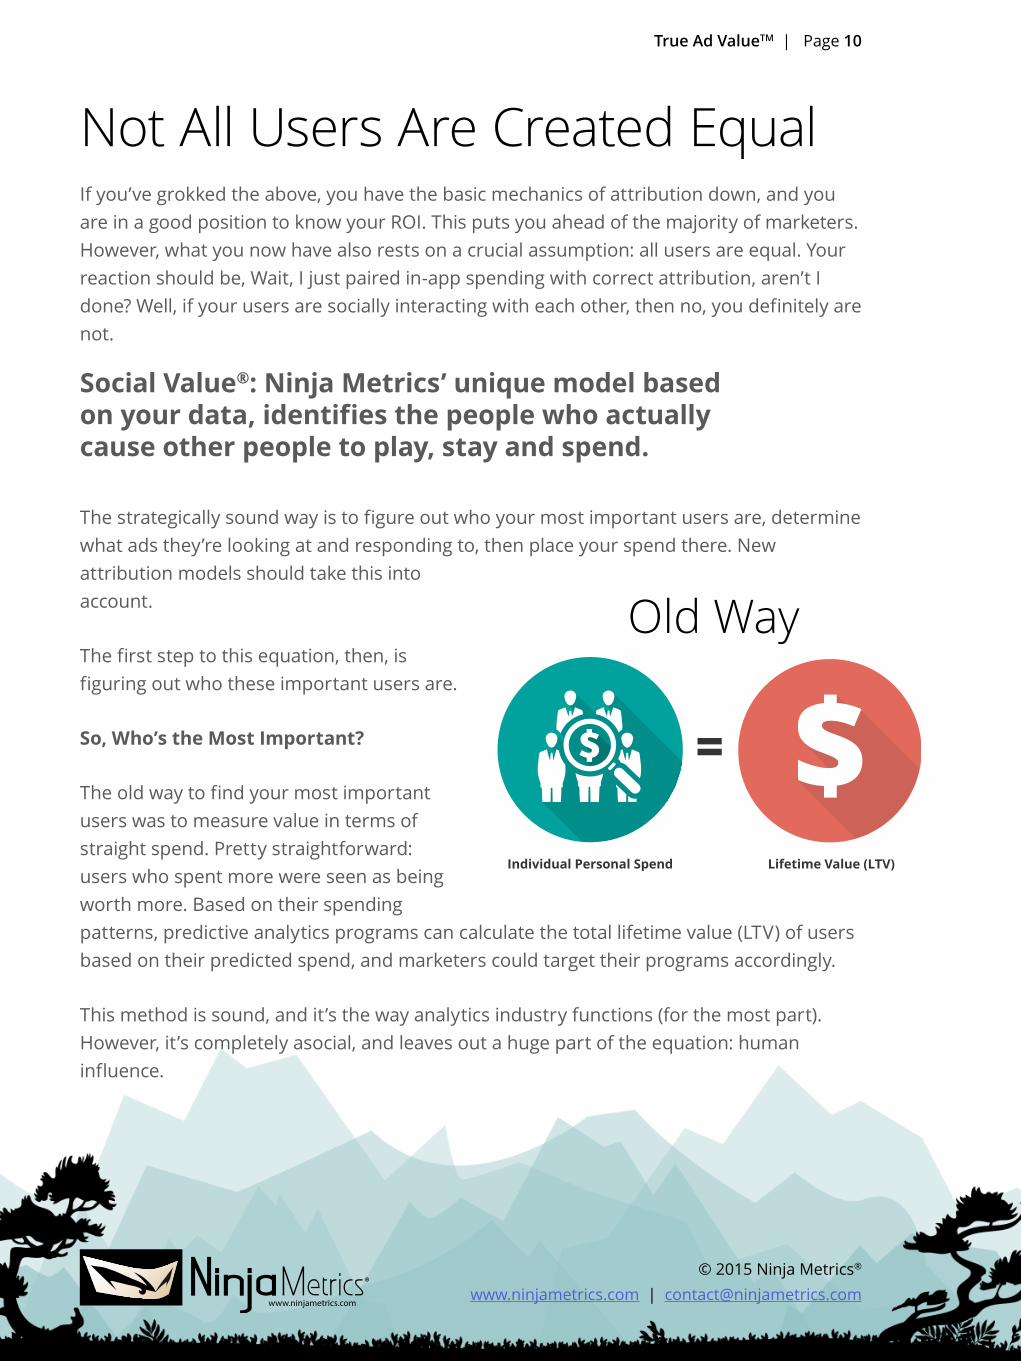
So, Who’s the Most Important?
The old way to find your most important
users was to measure value in terms of
straight spend. Pretty straightforward:
users who spent more were seen as being
worth more. Based on their spending
patterns, predictive analytics programs can calculate the total lifetime value (LTV) of users
based on their predicted spend, and marketers could target their programs accordingly.
This method is sound, and it’s the way analytics industry functions (for the most part).
However, it’s completely asocial, and leaves out a huge part of the equation: human
influence.
Old Way

www.ninjametrics.com
© 2015 Ninja Metrics®
www.ninjametrics.com | [email protected]
True Ad ValueTM | Page 11
Measuring Social ImpactLTV is a valuable metric, but it assumes that consumer exist in a social vacuum. As
consumers ourselves, we know this is not the case. We spend in part because we like the
product or service, and in part because of how others influence us. We see someone
else’s haircut, car, virtual machine gun, or music listening and it’s going to impact our own
decisions about spending and consumption. If you could parse that layer out, you’d be
able to see what really drives consumer behavior.
This new layer, developed by Ninja Metrics®, is known as Social Value®. Like the name
suggests, it’s purely a social aspect, and any product-related value is stripped out and
separated into separate values. Its core calculation doesn’t take into account marketing,
the mechanics, graphics, etc. It’s pure community and influence. And, it can be measured
down to the individual user.
Because of that, LTV and Social Value® are mutually exclusive, and can be combined to get
your true bottom line. The equation is simple:
The New Way

www.ninjametrics.com
© 2015 Ninja Metrics®
www.ninjametrics.com | [email protected]
True Ad ValueTM | Page 12
Why do we care about this extra step?
We can’t emphasize enough that users are
connected. LTV only looks at one side of the
equation: the relationship between the user
and your company. Take a look at the graphic
to the side: this is what your user base
actually looks like, with a connected web of
users influencing each other to spend.
Some users are positive, causing each other
to spend more. Others have negative Social
Value®, increasing churn rates (as you can
deduce, we don’t want to target those users).
Whether positive or negative, though, now
you know.
This is a causal relationship. It’s not just that
two users are connected and that they seem
to both spend, and so great, they’re
correlated. No, this is evidence of one user
increasing the spending of another user. In
other words, the influenced person is
spending more than they would have. That’s
a strong claim, and so it needs strong logic
and evidence.
Let’s walk through an example of these
connections in action. Imagine a person has an LTV of $43. Again, this is just pure spend:
We think they’ll spend that much more before they go away.
Great, now let’s say that same person also has a Social Value® of $53. This means that
their interactions with their friends (all mapped out in a social web) cause those people to
spend another $53. That means this person actually contributes $96 to your bottom line.
In other words, if this person were to go poof tomorrow, your business would make $96
less than if they stayed.
Lifetime Value
-$5k
-$200
-$200
-$200
-$200
-$200
Lifetime Value
-$2k
-$1k
-$1kUser Churns
Decreasing Network Spending
Social Value
$10k
LTV$3k
Lifetime Value
$5k
$200
$200
$200
$200
$200
Lifetime Value
$2k
$1k
$1kSocial InfluenceIncreased Spending
Social In�uence
SPENDING

www.ninjametrics.com
© 2015 Ninja Metrics®
www.ninjametrics.com | [email protected]
True Ad ValueTM | Page 13
The best LTV model in the world would only think they were worth $43. This highlights
something really important about these scores: your big spenders aren’t necessarily your
big influencers.
Now, how can we know that this is true? In predictive analytics, which this is, there’s only
one way to prove anything. You take the prediction, you wait for the reality, and then you
compare. In this case, the logic is that one person influences others to spend X. If that’s
true, then the only way to prove it is to observe cases where the person drops out of the
system and then to see if their friends’ spending indeed drops by X.
The Katana® system has now observed more than 365m users passing through it. For
each of them, it generates Social Value® numbers. And, inevitably, some of them drop out
of the game or app in question. Here, we are able to compare the prediction vs. the actual.
Over all the cases observed, the accuracy of the predictions as measured in dollars, is
85%. While this is an extremely strong number, the system continually improves and
updates it. System users will always be able to see the current performance of the
algorithm and to see if the accuracy is higher or lower. Transparency is an important
scientific value that has to exist for users to have faith in any system.
User XUser Y
$53LTV
$43LTV
Spending Inluence
Loss of Revenue
$96Lifetime Value
$43Social ValueTM
$53True Total Value
$96
Socially In�uenced Spending If User Churns...

www.ninjametrics.com
© 2015 Ninja Metrics®
www.ninjametrics.com | [email protected]
True Ad ValueTM | Page 14
The Biggest Fish in the Sea: Social Whales®
The biggest fish in the sea are the Social Whales®.
They’re the super-influencers: the ones with a high
combined personal spend and Social Value®.
Traditional LTV models wouldn’t catch these users
because, again, Social Whales® don’t necessarily
spend a lot. What’s valuable is their network and
how they impact it.
The picture of a Social Whale® varies across
industries, but they make up about 10% of
users. Think of it like a debate competition:
Your users with a high straight LTV are the
ones that are yelling the loudest, but the
Social Whales® are the ones with great
rhetoric that are persuading the audience.
And we all know who ends up taking home
the prize.
So, how valuable are these users, exactly?
That all depends on your user base and
what industry you’re in, but through Ninja’s eight years of research, we’ve found social
influence typically makes up about 6-60% of all spending. Sometimes it’s more. As a rule
of thumb, the more social the users are with each other, the higher the %. So, systems that
encourage interaction, social media use, interactive games, sharing, etc., tend to generate
the highest %s.
Now, back to attribution. How does this all relate?
Social ValueInfluenceIn
fluence
Social Whale
$30
$5
$5
$5$5
$5$5

www.ninjametrics.com
© 2015 Ninja Metrics®
www.ninjametrics.com | [email protected]
True Ad ValueTM | Page 15
SECTION 3:
LOOKING AT TRUE AD VALUETM

www.ninjametrics.com
© 2015 Ninja Metrics®
www.ninjametrics.com | [email protected]
True Ad ValueTM | Page 16
You know that 50% of advertising works, but which 50%?Enter Ninja Metrics® Traffic Reporting
Now you know which 50%!Just as adding Social Value® to LTV creates a more complete and
accurate picture of user value, adding Social Value® into the
advertising attribution equation creates a better model of ad value. How is that? Imagine
we have two users who each spend $100 a month in the system. One is an influencer and
the other is the influencee, to the tune of $50. So, the true value of the first person is really
$150 and the second person is really $50.
And if those two users both came from the same attribution source, then it’s all a wash.
$200 came from the source, and the ROI is still the same. But, what if the more valuable
user came from source A and the less valuable one came from source B? Now the
numbers in the basic ROI calculation are going to be wrong.

www.ninjametrics.com
© 2015 Ninja Metrics®
www.ninjametrics.com | [email protected]
True Ad ValueTM | Page 17
Now imagine that there are 1,000 users like the first person and they all came from source
A. And 1,000 like the inlfuencee who came from source B. Now the numbers are
systematically off. If you were to base your acquisition efforts on them, you’d be
overspending and underspending by 50% on the two sources. This is an obvious place to
optimize with the more accurate socially adjusted data.
Since so many of these acquisition sources exist in bidding markets, the knowledge of the
True Ad ValueTM becomes an unfair advantage to those who have it. Consider a close
analogy: If you are at an auction bidding on a classic car, and everyone thinks it’s worth
about $10k, then the auction plays out very straightforwardly. But what if you, alone in the
audience, know that the car is actually worth only $4k, or $25k? You’re going to have a
much better day than the other bidders.
This is what True Ad ValueTM allows you to do, on a large, automated scale. In the graphic
below you’ll see the basic infrastructure of bidding and ROI to the left of the line. On the
right, you see an adjustment with the % as calculated with the social adjustments. Values
over 100% are delivering more than they appear to be, and you see adjusted revenues,
ARPUs, etc. Those under 100% are worth less than they appear to be.
You get a complete picture never before seen in the advertising or game industry.

www.ninjametrics.com
© 2015 Ninja Metrics®
www.ninjametrics.com | [email protected]
True Ad ValueTM | Page 18
Consider that prior to this knowledge you are spending more, or less, than was necessary.
This is an easily correctable error across your ad spend. Portfolio-wide, we see that
companies have an existing error of anywhere from 5-40%. Put against your marketing
spend, that is how to estimate the potential savings.
“These new analytics show that old data make for portfolio-wide bidding errors
around 30-40%, while individual ad sources are often off by up to 300%.”
~Dmitri Williams, CEO of Ninja Metrics®
What’s more, by looking at the sources, you will get qualitative insights into why the
numbers may be off. After all, if you are collapsing entire publishing channels, then you
are seeing the true quality of their traffic. Compared to other channels. But if you are
looking within a channel, then you are seeing the appeal of the individual ads themselves.
It could be that the message, content, or format (e.g. video or banner ad), is what’s
bringing in the higher-, or lower-quality traffic.
This also lets you hold the creative team accountable, and for them to prove their own
value. Again, transparency is a crucial value in a system like this. You should expect some
resistance to it, but there’s no hiding in the long-run from accountability. In the end, good
people doing good work can prove it.

www.ninjametrics.com
© 2015 Ninja Metrics®
www.ninjametrics.com | [email protected]
True Ad ValueTM | Page 19
HOW DO YOU APPLY THIS IN YOUR BUSINESS? IT DEPENDS ON WHAT YOU WANT TO ACHIEVE.
TO START, KATANA® HELPS YOU:
Acquire more valuable users
The most valuable users aren’t your top spenders: they’re your Social Whales®. Identify these
users and the platforms they respond to, then target and utilize them as your brand advocates
to bring in more revenue.
Eliminate bot traffic and reporting duplication
One of the major problems in the advertising industry is inaccurate figures and valuations
based on bot traffic. As Katana® only takes into account human traffic
because of its advanced Social Value® algorithms, bot traffic is taken
out of the equation. Because each user is mapped out against a
social graph, reporting duplication is also eliminated.
Optimize portfolio-wide bidding by up to 40%
Transform your portfolio with groundbreaking industry
insights. Using Social Value® metrics from Katana®, you can
bid more accurately on all ad sources throughout your
portfolio.
Determine which ad sources and ad creative are your
best performers
Put the creative back in advertising! With complete transparency on
ad source performance, you can ensure it’s your message, not the
advertising source, that is or isn’t resonating with viewers. After identifying top-
performing platforms, creatives have the freedom they need to craft new campaigns.
Target your best performing ad publishers based on True ROI
True ROI shows you which ads are giving you the best bang for your buck, so take advantage of
them. Overhaul your portfolio and only focus on the ad sources that are most valuable to you
and your company.

www.ninjametrics.com
© 2015 Ninja Metrics®
www.ninjametrics.com | [email protected]
True Ad ValueTM | Page 20
SECTION 4:
EXAMPLES OF HOW THIS WILL CHANGE YOUR LIFE, OR AT LEAST THE WAY YOU BID ON ADS

www.ninjametrics.com
© 2015 Ninja Metrics®
www.ninjametrics.com | [email protected]
True Ad ValueTM | Page 21
Examples of How This Will Change Your
Life, Or At Least The Way You Bid On AdsNow, on to how this will revolutionize the advertising industry. That might sound a little
extreme, but we promise it isn’t: never before have we had the potential for such
transparency in ad buys. With True Ad ValueTM, the industry will have less smoke and
mirrors, and more sunlight to show what’s really going on.
For a real-world example, take an ad with $100,000 in spend. When you look at the
revenue driven by this ad, $350,377.91 with an ARPU of $4.56 and a ARPPU of $8.12, things
look pretty good. You have an ROI of 350%. However, by applying Social Value® to this and
looking at the true ad adjusted value, the picture is quite different. In this example, the
True Ad ValueTM has a 50% reduction. This now adjusts the Revenue, ARPU and ARPPU to
$175,188.96, $2.28 and $4.06 accordingly. Your actual ROI is 175%.
Now let’s look at an example where the True Ad ValueTM adjustment is positive. In this
example, the game developer has a spend of $10,000 with revenue of $58,769.05, an ARPU
of $2.56 and ARPPU of $4.56. Your ROI is 580%. By applying the True Ad ValueTM
adjustment, the real numbers look like this. Your actual ROI is now 1,760%.
There you have it. By factoring in Social Value®, this marketing manager now has that
much more to report back to his or her boss.
True Ad ValueTM can be applied in almost any industry that involves social sharing and
advertising. The more sharing that goes on, the more accurate Ninja Metrics’ models will
be — our predictive analytics algorithms work best where there’s plenty of data to sort
through and learn from.