tropical cyclone-ocean interactions - mitigation … cyclone-ocean interactions isaac ginis graduate...
TRANSCRIPT

Tropical Cyclone-Ocean Interactions Isaac Ginis Graduate School of Oceanography, University of Rhode Island Narragansett, RI 02882 USA
Abstract The advent of numerical weather prediction tropical cyclone models has demonstrably improved the forecasts of tropical cyclones over the last decades. But to establish useful warning systems for tropical cyclones, it is necessary to accurately predict both storm track and intensity. Whereas tropical cyclone tracks are determined almost exclusively by their large-scale atmospheric environment, storm intensity is influenced to a greater degree by smaller-scale features in both the atmosphere and ocean. The factors that control the intensity of tropical cyclones are still poorly understood, leading to almost no reliability in forecasts of tropical cyclone intensity evolution. This paper discusses the main characteristics of the tropical cyclone-ocean interactions and emphasizes the important role of these interactions in the tropical cyclone intensity. Three-dimensional, coupled atmosphere-ocean models have recently been developed to simulate the mutual response of a tropical cyclone and the ocean. These models demonstrate potentially significant improvements in tropical cyclone intensity prediction. Further advances on this problem require comprehensive simulations with very high resolution coupled air/sea/surface wave numerical models with improved surface flux parameterizations, tested against high-quality observations. 1 Introduction Tropical cyclones moving above a warm ocean represent an extreme case of air-sea interaction. They constitute one of the most important weather forecasting problems worldwide. In developing nations, tropical cyclones are the leading cause of death from natural phenomena, with a single event taking more than 100,000 lives as recently as 1991 in Bangladesh. In USA, the death toll of
Atmosphere-Ocean Interactions, Advances in Fluid Mechanics Series, No. 33, WIT Press, 83-114.

Hurricane Andrew in 1992 exceeded 60 with nearly $30 billion damage. Tropical cyclone modeling efforts over the past decades had been primarily concerned with perplexing problems of convective parameterization, vortex movement and vortex-flow interaction. Although there have been impressive strides in the quality of hurricane track predictions over the last 30 years, in contrast, there has been no perceptible improvement in the skill of tropical cyclone intensity prediction. Not surprisingly, in recent years, intensity prediction has become an important scientific and practical problem for investigation. Variability in tropical cyclone intensity originates from two sources: internal variability and environmental interactions. Most research on the influence of environmental interactions on tropical cyclone intensity has focused on interactions between tropical cyclones and their atmospheric environment, including interactions with upper tropospheric troughs and the influence of environmental wind shear. While there is ample evidence to suggest that these interactions are important in controlling storm intensity, thus far, their quantification has not led to increased skill in forecasting tropical cyclone intensity.
An important aspect of environmental interaction is the coupling between the storm and the underlying ocean. It is well known that tropical cyclones are driven by turbulent heat fluxes from the ocean (Ooyama, [1]). The substantial impact of sea surface temperature (SST) on the genesis and intensification of tropical cyclones has long been recognized (Palmén [2]; Miller [3]). Climatologically, tropical cyclones develop only over warm oceans with SSTs of 26oC or higher. Both theoretical (Emanuel [4]) and numerical models (e.g., Chang [5]; Tuleya and Kurihara [6]) also indicate a great sensitivity of maximum (or potential) storm intensity to SST. Emanuel ([7]) developed a theory of the tropical cyclone intensity in which a storm is treated as a Carnot heat engine. In this theory, the maximum intensity increases rapidly for increasing SST. DeMaria and Kaplan [8] found an empirical relationship between climatological SST and the maximum intensity of Atlantic hurricanes based on a 31-year archive and found a similar sensitivity of tropical cyclone intensity to SST.
One of the potentially significant constraints on dynamical predictions of tropical cyclones is the lack of knowledge about the ocean response to the storm forcing. For the vast majority of research and operational dynamical models, conditions of fixed SST in time are assumed. Yet numerous observational and numerical studies have shown that tropical cyclones produce significant changes in the underlying ocean thermodynamic structure. These changes include SST changes. SST may decrease up to 6oC as a result of strong wind forcing. Because of sea surface cooling due to storm forcing, the tropical cyclone-ocean system is one with positive and negative feedbacks. A positive feedback exists during the genesis and development stages. As the tropical cyclone strengthens,
Atmosphere-Ocean Interactions, Advances in Fluid Mechanics Series, No. 33, WIT Press, 83-114.

the evaporation rate grows due to the increase in the surface wind speed. The enhancement of the moisture supply from the ocean leads to an increase in the latent heat energy that drives the circulation of the tropical cyclone. As the storm continues to intensify, the increasing surface wind stress generates strong turbulent mixing that deepens the ocean mixed layer. The associated SST decrease can then result in a reduction of the total heat flux (latent plus sensible) into the atmosphere and this can lead to a decrease in storm intensity. The latter process represents a negative feedback mechanism.
The aim of this paper is to present an overview of the main features of the air-sea interaction in tropical cyclones. Section 2 is concerned with various aspects of the oceanic response to tropical cyclonic forcing and air-sea heat and momentum exchange in high wind conditions. Section 3 contains a discussion of coupled tropical cyclone-ocean modeling including simulations and forecasts of observed tropical cyclones. A summary is provided in Section 4. 2 Ocean response to tropical cyclone Tropical cyclones are known to generate vigorous responses in the open ocean, which can include surface waves higher than 20 m, upper-ocean currents of 1m s-1, and sea-surface temperature cooling of several degrees. In this section we will review the main features of the dynamic and thermodynamic responses in the ocean, mainly relying upon theoretical analyses and numerical ocean models. 2.1 Dynamic response Beneath a tropical cyclone the wind stress continuously performs work on the ocean. The energy supplied by the atmosphere is distributed to small-scale turbulent motions, as well as to large-scale currents in the ocean surface mixed layer. Since a tropical cyclone represents transient wind forcing for which the wind field changes significantly over time scales comparable with the local inertial period, it is a strong source of near-inertial frequency internal waves in the ocean. This is supported by observations (e.g., Brooks [9], Brink [10], Shay and Elsberry [11]). The internal wave wake of a steady moving tropical cyclone has a wedge-shaped pattern, analogous in some respects to the surface gravity wave wake behind a steady moving ship (Lighthill [12]). Behind the storm the wake disperses laterally in the cross-track direction. The difference, however, is in the vertical dispersion, owing to the three-dimensional propagation of internal waves. The structure of the internal wave wake in the along-track direction is represented by alternating cells of upwelling and downwelling of the isotherms (isopycnals).
Some important properties of the internal waves excited by a tropical cyclone can be inferred as simple consequences of the dispersion relation of
Atmosphere-Ocean Interactions, Advances in Fluid Mechanics Series, No. 33, WIT Press, 83-114.

inertia-gravity waves. Consider the following dispersion relation for inertial-gravity waves
0222 =−− kcf nω (1)
where ω is a frequency, f is the Coriolis parameter, k2=l2+m2, where l and m are the wave numbers in the x- and y-directions, respectively, and cn is the speed of long gravity waves of normal mode n. Values of cn, for internal (baroclinic) modes, usually range from 2 to 3 m s-1 for c1 and decrease for larger n. A typical value for co, the external (barotropic) mode, is about 200 ms-1, in a deep ocean. The phase velocity of the wave is cp= ω/ k and the group velocity is cg= ∂ω/∂k, defining the propagation speed of the wave energy. From eqn (1) we can get
2/1222 )/1( kcfcc nnp += , 2/1222 )/1( −+= kcfcc nng . (2) Consider a tropical cyclone moving in the negative x-direction with a constant velocity Uh and let’s focus on a wave pattern that is steady in a frame of reference in which the storm is at rest. Any wave crests in this steady field must be stationary. It is evident that since cp always exceeds cn no stationary waves exist with respect to the storm forcing, if cn > Uh. By contrast, cg is always less than cn and therefore the wave field will be confined in a wake behind the storm. Tropical cyclones generate predominately waves with wavelengths larger than the baroclinic Rossby radius of deformation Rn,. According to eqn (2) the group velocities of these waves are small and therefore the wave energy will disperse laterally very slowly after the storm’s passage.
Inertia-gravity waves that are steady relative to the tropical cyclone must have their phase velocity component in the along-direction equal to Uh. Therefore they must have frequencies defined by ω= Uh l . (3) The values of ω, l, and m that define these waves can be found by combining eqns (1) and (3). Real solutions are only possible if Uh > cn. Intersection lines of the plane, given by eqn (3), with the surface, eqn (1), may be projected onto the wave number plane (l,m)
0)()( 22222 =+−− mlcflU nh . (4) The longest waves (the waves with lowest wavenumber) are excited in the along-track direction with wavelength fcU nh /2)( 2/122 π− . Away from the storm
Atmosphere-Ocean Interactions, Advances in Fluid Mechanics Series, No. 33, WIT Press, 83-114.

track, the waves have higher wavenumbers and therefore propagate with smaller phase but larger group velocities. The waves in the wake propagate in the directions normal to the wavenumber curves. They fill a wedge between the normals to the asymptotes of the hyperbola, given by eqn (4). The semi-angle of the wedge is given by 2/1221 )1/(tan −− −= nh cUθ (5) The wider (narrower) wedges are associated with smaller (larger) values of Uh / cn. It is noteworthy that eqn (5) can also be derived from a right-angled triangle with the hypotenuse Uh and side length cn. This follows from the consideration that the wave energy generated by the storm, at any given point, travels radially a distance cg t, during the time period t, during which the storm has traveled a distance Uh t. The boundary of the wedge is formed by the waves having the fastest group velocity, which is equal to cn according to eqn (2).
The primary features of the ocean current response to a moving tropical cyclone in a stratified ocean can be reproduced with a two-layer model, that is, a warm layer above a colder and slightly denser layer (Geisler [13], Ginis and Sutyrin [14]). The vertical structure of this system can be described with two modes: a barotropic and a baroclinic mode. The barotropic mode behaves as if the ocean is unstratified and is associated with displacement of the sea surface. The baroclinic mode is associated with displacements of the interface between the layers, and for this mode, the ocean surface acts like a rigid lid. Geisler [13] was the first to point out that the nature of the baroclinic and barotropic responses is remarkably different because of the difference in the baroclinic and the barotropic wave speeds.
These differences can be readily illustrated with a help of the shallow water equations. The numerical simulations, as shown in Fig.1 and Fig. 2, solve mathematically identical shallow water equations, which have only different gravitational accelerations. Namely, the gravitational acceleration g in Fig. 1 is replaced by the reduced gravity g’=g(ρ2- ρ1)/ ρ2, in Fig. 2, where ρ1 and ρ2 are the densities of the upper and lower layers, respectively. Both numerical solutions represent the ocean response to an axisymmetric wind stress typical to a hurricane moving westward at 5 m s-1. While the characteristic feature of the baroclinic response is an oscillating wake behind the storm, formed by near-inertial gravity waves (Fig. 1), the barotropic response is characterized by a quasi-stationary circulation elongated in an along-track direction, which is geostrophically adjusted with a trough at the sea surface (Fig. 2).
Atmosphere-Ocean Interactions, Advances in Fluid Mechanics Series, No. 33, WIT Press, 83-114.

Figure 1 The displacement of the layer interface (left, meters) and current velocity field (right, m s-1) calculated from a 1 ½ reduced gravity model with initial depth h=100 m. The dashed contours indicate upward displacement. The hurricane wind stress was moving from the right to the left with a speed, 5 m s-1. The crosses indicate the initial and 6-day center positions.
Two notable features of the baroclinic response should be emphasized. Firstly, a strong asymmetry of the baroclinic currents relative to the storm track takes place immediately after the hurricane passage. This rightward bias occurs because the clockwise inertially rotating currents are effectively accelerated on the right side and decelerated on the left side, due to the rotation of the wind stress vectors produced by the moving storm. After the storm passage the amplitudes of the baroclinic currents on the right side of the track rapidly reduce, due to horizontal dispersion of the near-inertial gravity waves. Moreover, further behind the storm center, the dynamical structure in the wake becomes rather symmetric. Secondly, the first upwelling cycle of the inertial oscillations occurs well behind the hurricane. This distance may be estimated as Uh(π-α)/f, where α is the inflow angle (the angle between the wind and the azimuthal directions). For slower moving storms and larger inflow angles, the upwelling area is located closer to the hurricane center.
In contrast to the baroclinic response, the barotropic currents (Fig. 2) are nearly nondivergent and almost instantaneously adjusted, together with the sea surface elevation, to the wind stress. The physical reasoning for this behavior is discussed in Ginis and Sutyrin [14].
To better resolve the vertical structure of the ocean response, either a multilayered model or a continuously stratified model is needed. By contrast with a discrete-layer description, which has as many modes as layers, a continuous stratification is associated with an infinite number of baroclinic modes. In practice, however, only a limited number of modes are excited to appreciable amplitudes. Price [15] was the first to use a six-layer reduced gravity
Atmosphere-Ocean Interactions, Advances in Fluid Mechanics Series, No. 33, WIT Press, 83-114.

model to study the ocean response to a moving storm. In the model, vertical motions induced by the divergence of the upper (mixed) layer currents produce hydrostatic pressure anomalies within the upper ocean. These pressure anomalies generate currents within the main thermocline. Wave-induced energy transport in the vertical direction results in a rapid decay of the inertial motion in the mixed layer. Within a few inertial periods after the passage of the storm, nonlinear effects produce waves with higher frequencies and wavenumbers.
Figure 2. The sea surface elevation (left, centimeters) and current velocity field (right, m s-1) calculated from a single layer model, with depth of h=250 m. The hurricane wind stress was moving from the right to the left with a speed, 5 m s-1. The crosses indicate the initial and 6-day center positions.
In addition to generating near-inertial internal waves, a tropical cyclone produces non-oscillatory geostrophic currents and associated storm-elevated isopycnals (baroclinic ridges). By Coriolis force, the circular wind-stress pattern of the cyclone drives surface water away from the center, forcing upward cool water from below and lifting isopycnals. Uplift is typically 30-50~m, but can reach 100 m when a tropical cyclone moves very slowly or has a loop-shaped track. Important factors that determine the penetration depth and the amount of energy remaining in the geostrophic currents are the Froude number, Fr= Uh/cn, and the aspect ratio L/Rn, where L is the storm scale and Rn =cn/f is the baroclinic Rossby radius of deformation. Slower moving storms (with Froude numbers of order unity, or less) produce more energetic geostrophic response (Geisler [13], Pudov [16]), and larger values of L/ Rn which cause deeper penetration of the isopycnal elevations (Orlanski and Polinsky [17]). For larger Froude numbers (exceeding unity), more hurricane energy is supplied to the near-inertial wave field and less to the geostrophic currents.
Tropical cyclones also leave sea-surface height anomalies in their wakes. They are typically represented by sea-surface depressions (troughs) in the sea surface along the storm paths. Theoretical and numerical studies indicate that the
Atmosphere-Ocean Interactions, Advances in Fluid Mechanics Series, No. 33, WIT Press, 83-114.

anomalies may reach 0.5 - 0.6 m, depending on tropical cyclone size, translation speed, and ocean stratification (Shay et al. [18]; Ginis and Sutyrin [14]). These anomalies are primary caused by two physical processes: geostrophic adjustment to storm-generated depth-averaged currents (barotropic effect, Fig. 2), and a baroclinic effect associated with vertical displacement of isopycnals in the thermocline. The atmospheric pressure gradient (inverted-barometer effect) and wind-stress divergence cause sea-surface elevation too, but move with the storm, leaving no disturbances behind. In a deep open ocean, storm-generated depth-averaged currents and associated sea-surface anomalies are very small. Therefore, the main contribution to sea-surface depression in the tropical cyclone’s wake is the storm-induced displacement of the thermocline, that may persist more than a week, due to geostrophic adjustment of current and mass fields. Satellite altimeter measurements may sometimes detect sea-surface troughs in the wakes of tropical cyclones, as shown in Fig. 3.
Figure 3. Sea-surface height anomalies measured by the Geosat satellite altimeter after the 1987 passage of supertyphoon Lynn in the western Pacific: elevation in grey, depression in black; scale in upper right corner. Small circles show typhoon position every 6 hours; circles for 00 GMT have white centers, and are labeled with date-time and maximum wind speed. Dotted lines show 200 m and 1,000 m isobaths. All Geosat track crossings indicate a significant depression at the sea surface along the Lynn track. Courtesy of Amy Shubert (personal communication).
Atmosphere-Ocean Interactions, Advances in Fluid Mechanics Series, No. 33, WIT Press, 83-114.

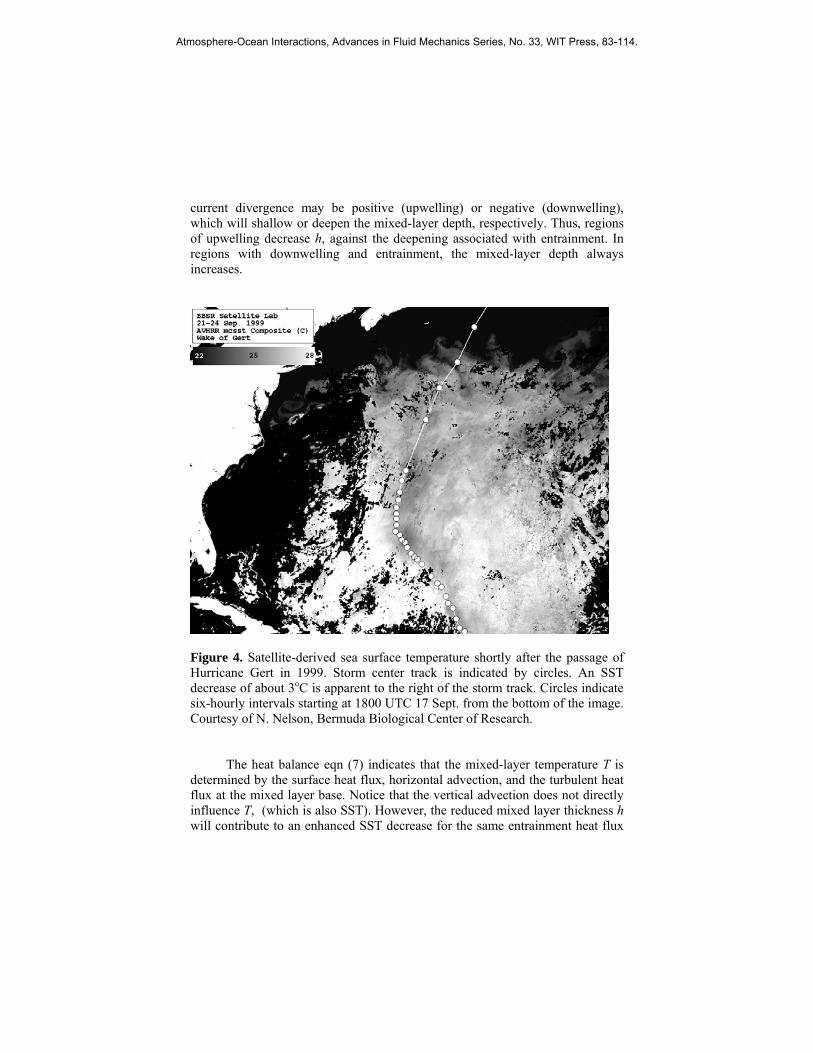
2.2 Temperature response In addition to generating near-inertial and non-oscillatory currents, tropical cyclones produce significant changes in the underlying ocean thermodynamic structure, which also involves sea surface temperature (SST) changes. Observations of anomalous cold wakes generated by tropical cyclones date back to the work of Fisher [19] and Jordan [20]. In the first systematic measurements of a hurricane-induced cold wake, Leipper [21] reported the SST decrease of up to 60C, for Hurricane Hilda in 1964. Bender el al. [22] summarized the maximum sea surface cooling observed after the passage of 16 tropical cyclones. The observations were grouped according to slow, medium and fast moving storms, and indicate average cooling for the three groups of 5.30, 3.50 and 1.80C, respectively. The cooling of the sea surface persists for about a week and is readily detected in satellite images (Stramma et al. [23], Nelson [24]). An example of cold wake produced by a hurricane is shown in Fig. 4, for Gert in 1999.
The key features of the upper ocean dynamics and associated SST changes occurring during hurricane forcing can be understood from the balance equations of mass and heat in the mixed layer
,)( ewVhth
+−∇=∂∂ r
(6)
hTwTV
hQ
tT
es ∆
−∇−=∂∂ )(
r , (7)
where h is the mixed layer depth, T is the mixed layer temperature, which is also SST, V
ris the current velocity vector, sQ is the net surface heat flux divided
by ρcp, ew the entrainment rate, and T∆ is the temperature difference between the mixed layer and the thermocline.
Equations (6) and (7) are derived by integration of the continuity and thermodynamic equations from the sea surface to the mixed layer base. In eqns (6), the time change in the mixed-layer depth is determined by the horizontal divergence )( Vh
r∇ and the turbulent mass flux ew across this surface
(entrainment). Notice that the entrainment rate ew is not a vertical velocity, as only a mixed-layer depth increase is possible by turbulent mixing, and therefore no layer swallowing (detrainment) is allowed by this process. By contrast,
Atmosphere-Ocean Interactions, Advances in Fluid Mechanics Series, No. 33, WIT Press, 83-114.
current divergence may be positive (upwelling) or negative (downwelling), which will shallow or deepen the mixed-layer depth, respectively. Thus, regions of upwelling decrease h, against the deepening associated with entrainment. In regions with downwelling and entrainment, the mixed-layer depth always increases.
Figure 4. Satellite-derived sea surface temperature shortly after the passage of Hurricane Gert in 1999. Storm center track is indicated by circles. An SST decrease of about 3oC is apparent to the right of the storm track. Circles indicate six-hourly intervals starting at 1800 UTC 17 Sept. from the bottom of the image. Courtesy of N. Nelson, Bermuda Biological Center of Research.
The heat balance eqn (7) indicates that the mixed-layer temperature T is determined by the surface heat flux, horizontal advection, and the turbulent heat flux at the mixed layer base. Notice that the vertical advection does not directly influence T, (which is also SST). However, the reduced mixed layer thickness h will contribute to an enhanced SST decrease for the same entrainment heat flux
Atmosphere-Ocean Interactions, Advances in Fluid Mechanics Series, No. 33, WIT Press, 83-114.

ew T∆ in the third term of eqn (7). In addition, upwelling may increase the entrainment rate by reducing the mixed-layer thickness. Thus, the SST decrease above the upwelling region may be larger than in adjacent downwelling areas. Although the SST decrease and mixed-layer depth increase will be correlated in the mixing-dominated regions, this will not be true in the upwelling-dominated regions. Downwelling, which is usually found on the left and right sides of the storm track, tends to thicken the mixed layer and reduce the effect of entrainment mixing and therefore SST decrease.
Figure 5. Numerical simulation of the ocean response to an idealized axisymmetric tropical cyclone moving at 5 m s-1 westward: sea surface temperature in the cold wake at 0.5oC intervals. The storm track is shown as the solid horizontal line, and the storm position is indicated with the ''X.'' Selected surface velocity vectors are displayed for reference.
Entrainment mixing in the mixed layer can be generated by the near-surface, wind-driven shear, convective overturning due to the surface buoyancy fluxes and velocity shear at the mixed layer base. In tropical cyclone conditions, among these three mechanisms, the vertical velocity shear dominates. The SST decrease, owing to sea surface fluxes and horizontal advection terms in eqn (7), accounts for less that 15% (Price [25], Ginis and Dikinov [26, 27]).
The primary features of the upper ocean temperature response are illustrated in Figs. 5 -7, as determined by the primitive equations ocean model
Atmosphere-Ocean Interactions, Advances in Fluid Mechanics Series, No. 33, WIT Press, 83-114.

described in Ginis et al. [28]. In this numerical experiment, the ocean is assumed to be initially at rest and horizontally uniform. The vertical structure is defined using the climatological temperature profile in the Gulf of Mexico (25oN, 90oW). An idealized axisymmetric wind stress is applied, typical to a hurricane with a 50 km radius of maximum winds moving westward at 5 m s-1. Figure 5 shows the SST and surface velocity fields for part of the model domain at day 4 of the integrations. The cold temperatures and strong near-inertial oscillations in the wake of the storm passage are well developed at this time, when the center of the storm is located near 13o longitude. The maximum cooling in the storm wake is near 3.7oC. The important feature of the cold wake is that the maximum SST decrease is located on the right of the storm track, at 1-2 radii of that of the maximum winds and behind the storm center. This is primarily due to the rightward bias in the vertical mixing caused by asymmetry in the mixed-layer currents. This also implies that much of the entrainment arises from the turbulence associated with velocity shears at the base of the mixed layer, rather than through the effect of surface-generated turbulence. The asymmetries in the SST distribution underneath the tropical cyclone can significantly modify the heat and moisture fluxes at the sea surface which may play an important role in the storm evolution.
Figure 6. As in Fig. 5, showing the temperature and meridional velocity section along 25.50N. The temperature is shaded and the velocity is contoured. The velocity contour interval is 20 cm s-1, and negative (southward) velocities are dashed.
Atmosphere-Ocean Interactions, Advances in Fluid Mechanics Series, No. 33, WIT Press, 83-114.

Figure 6 shows the vertical structure of the temperature and meridional velocity in the wake of the moving tropical cyclone. This zonal slice is taken just to the right of the storm track, near the radius of maximum wind (25.5oN). It is seen that a strong baroclinic response that includes three-dimensional, near-inertial gravity waves is generated. Notice that the thermocline currents are negligibly small underneath the hurricane and reach maximum amplitudes near the area of maximum upwelling. This is a characteristic feature of the deep open-ocean response to hurricane forcing.
In the present simulation, the maximum mixed layer deepening occurs about 100 km behind the storm center and to the right of the storm track, where both intense turbulent mixing and downward motion tend to increase the mixed-layer depth. About 300 km behind the storm, the mixed-layer depth shallows, due to strengthening of the upwelling and weakening of the turbulent mixing. In addition, the pressure-generated thermocline currents below the mixed layer may enhance (weaken) the turbulent mixing by increasing (decreasing) the shear instability across the mixed layer base.
Figure 7. As in Fig. 5, showing the cross-section of temperature anomalies normal to the storm track and 300 km behind the hurricane center. Negatives anomalies are shaded. The dashed line is drawn through the hurricane center.
Atmosphere-Ocean Interactions, Advances in Fluid Mechanics Series, No. 33, WIT Press, 83-114.

The vertical cross-section of the temperature anomalies normal to the storm track is shown in Fig. 7. This slice is taken 300 km behind the hurricane center where the first upwelling cycle occurs. The maximum cooling is observed to the right of the storm track where the mixed layer deepens to about 50 m. Near the track, the lower temperatures throughout the column indicate strong upwelling, with the maximal temperature anomalies at about 50 -70 m depths, where the largest gradients of temperature in the thermocline occur. The temperature anomalies occur at depths of 350 m in this experiment, which is consistent with observations (e.g., Pudov et al. [29]). Beyond the radius of maximum winds, relative to the storm center, there are two quite symmetric regions of warmer water (positive anomalies) which are due to downwelling on the storm periphery. The strength of downwelling is usually considerably weaker than the upwelling strength.
Figure 8. Maximum SST change in the cold wake of an idealized hurricane as a function of storm translation speed (left panel) for selected climatological temperature profiles (right panel) for the Gulf of Mexico (250N, 900W, solid line) and Caribbean Sea (200N, 850W, dashed line).
From the tropical cyclone-ocean interaction perspective, it is important to know the key factors determining the rate of SST decrease in response to storm forcing. These are: 1) storm intensity represented by the maximum surface winds, 2) storm translation speed, and 3) upper ocean stratification, primarily represented by the depth of the mixed layer. The effect of the first factor, storm intensity, on SST is obvious. The effects of the two other factors are illustrated in Fig. 8. Maximal SST reductions are shown, generated by an idealized hurricane moving with different translation speeds. The vertical ocean structure is defined using two different profiles: one for the Gulf of Mexico and another for the
Atmosphere-Ocean Interactions, Advances in Fluid Mechanics Series, No. 33, WIT Press, 83-114.
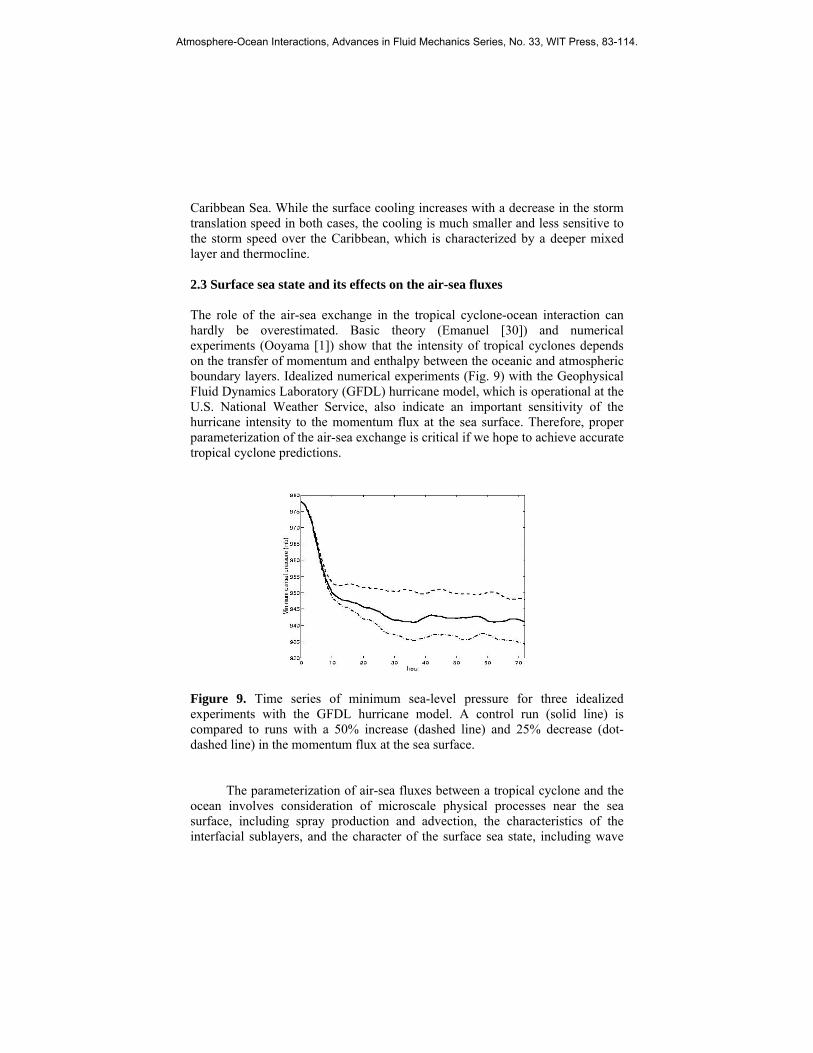
Caribbean Sea. While the surface cooling increases with a decrease in the storm translation speed in both cases, the cooling is much smaller and less sensitive to the storm speed over the Caribbean, which is characterized by a deeper mixed layer and thermocline. 2.3 Surface sea state and its effects on the air-sea fluxes The role of the air-sea exchange in the tropical cyclone-ocean interaction can hardly be overestimated. Basic theory (Emanuel [30]) and numerical experiments (Ooyama [1]) show that the intensity of tropical cyclones depends on the transfer of momentum and enthalpy between the oceanic and atmospheric boundary layers. Idealized numerical experiments (Fig. 9) with the Geophysical Fluid Dynamics Laboratory (GFDL) hurricane model, which is operational at the U.S. National Weather Service, also indicate an important sensitivity of the hurricane intensity to the momentum flux at the sea surface. Therefore, proper parameterization of the air-sea exchange is critical if we hope to achieve accurate tropical cyclone predictions.
Figure 9. Time series of minimum sea-level pressure for three idealized experiments with the GFDL hurricane model. A control run (solid line) is compared to runs with a 50% increase (dashed line) and 25% decrease (dot-dashed line) in the momentum flux at the sea surface.
The parameterization of air-sea fluxes between a tropical cyclone and the ocean involves consideration of microscale physical processes near the sea surface, including spray production and advection, the characteristics of the interfacial sublayers, and the character of the surface sea state, including wave
Atmosphere-Ocean Interactions, Advances in Fluid Mechanics Series, No. 33, WIT Press, 83-114.

breaking. As wind speed increases, the frequency of breaking waves (whitecaps) increases and spray begins to fill the air near the surface. At very high wind speeds, the air-sea interface begins to resemble an emulsion, with an almost smooth transition between bubble-filled ocean water and spray-filled air. Unfortunately, there are no in situ measurements of ocean surface characteristics at wind speeds greater than 25 m s-1, and the theory of air-sea interaction at very high wind speeds is poorly developed.
Existing parameterizations of air-sea fluxes have yet to account for all important mechanisms that can influence both media. For example, one candidate for influencing the air-sea enthalpy flux at high wind speeds is sea spray. In a recent study, Andreas and Emanuel [31] suggest that sea spray can significantly enhance enthalpy transfer. When a spray droplet is ejected from the ocean, it remains airborne long enough to cool to a temperature below the local air temperature but not long enough to evaporate an appreciable fraction of its mass. The spray droplet thus gives up sensible heat and returns to the sea before it has time to extract back from the atmosphere the heat necessary to continue evaporation. In other words, most spray droplets re-enter the ocean cooler than when they left and thus, they cool the ocean. This represents a net transfer of enthalpy to the atmosphere. Moreover, spray droplets must be accelerated by the airflow, and this represents a momentum sink. Also, because the droplets have experienced some evaporation as well, they represent a surface salt flux when they fall back into the sea. This input of cool, salty water at the sea surface may destabilize the mixed layer and enhance oceanic mixing.
Another potentially important process that can affect air-sea enthalpy transfer in tropical cyclones is bubble production. When a wave breaks, air is forcibly injected into the ocean and percolates back to the surface in the form of bubbles. The air in these bubbles is warmed and nearly saturated with water vapor when the bubbles return to the surface. Consequently, the bubbles may have a higher specific enthalpy than the ambient atmosphere and may thus enhance sea-air heat exchange.
In high wind conditions, the momentum fluxes may be significantly influenced by surface gravity waves. In general, the total momentum flux from atmosphere to ocean is partitioned into two parts: flux into surface waves and flux into surface currents. The former is evaluated by integrating the product of the wave growth rate and the momentum density of surface waves over all wavenumbers and directions. The latter is parameterized using a bulk formulation (e.g., an empirical formulation of shear stress over a surface that is assumed smooth and rigid). While the latter is always aligned with the wind direction, the former may not be, if the wind and the wave field are not aligned. Makin et al. [32] applied this idea to a typical form of ocean surface wave spectra proposed by Donelan et al. [33], and showed that more than 95% of the momentum flux was absorbed by surface waves at high winds.
Atmosphere-Ocean Interactions, Advances in Fluid Mechanics Series, No. 33, WIT Press, 83-114.

Similarly, the total momentum flux into surface currents is partitioned into two parts: flux from surface waves and direct flux from wind. The former is evaluated by integrating the product of the wave dissipation rate and the momentum density of surface waves over all wave frequencies and directions. Since a significant part of the momentum flux is supported by surface waves rather than by viscous stress, the total momentum flux from air to water strongly depends on sea state. Only if surface waves are in equilibrium (fully developed) with local wind forcing is it possible to use a bulk parameterization to uniquely relate the wind stress with the wind speed, including the wave effect. Under storm conditions with strong and transient wind forcing, wave fields are far from equilibrium, and a bulk parameterization may introduce significant errors in momentum flux estimates. Also, it is important to note that the momentum flux from wind to waves and from waves to currents may differ, if the waves are rapidly growing or decaying.
Since the surface wave field is not determined uniquely by local conditions, proper evaluation of the fluxes, including the surface wave effects on these fluxes, ultimately requires that wave prediction models be coupled with ocean-atmosphere models. There have been a few attempts to incorporate a wave prediction model into a coupled ocean-atmosphere model to improve air-sea flux parameterizations. Both Wu and Flather [34] and Mastenbroek et al. [35] studied the dynamical coupling of a wave model and a barotropic storm surge model, and demonstrated the importance of coupled modeling for storm surge prediction. However, at present, it is not clear how the explicit inclusion of surface wave models may influence tropical cyclone prediction.
In tropical cyclone conditions, the surface wave field is quite complex and fast-varying in space and time. In recent years there have been considerable efforts in the measurement of the storm-generated wave characteristics. Most recently, Walsh et al. [36] and Wright et al. [37] reported detailed measurements of the surface wave height, directional wave spectra in all quadrants of Hurricane Bonnie (1998) in the open water and at landfall using NASA airborne Scanning Radar Altimeter (SRA). Any surface wave model deemed to be coupled with a tropical cyclone-ocean model needs to be evaluated for its capability in reproducing the key characteristics of surface waves at high winds. Figure 10 shows an example of simulations of the Hurricane Bonnie – wave fields generated by the National Centers for Environmental Prediction (NCEP) WAVEWATCH (WW3) surface wave model (Tolman [38]). These simulations use 1/6o grid resolution for the wave model and NOAA /Hurricane Research Division wind fields. The wave spectrum is discretized into 25 frequency bands and 48 directional bands. The results indicate a reasonably good skill in reproducing spatial distributions and magnitudes of wave height, directional wave spectra and peak wave direction and frequency in the open ocean. However, as the hurricane makes landfall the simulated peak frequencies
Atmosphere-Ocean Interactions, Advances in Fluid Mechanics Series, No. 33, WIT Press, 83-114.

displayed noticeable disagreement with the SRA observations, probably due to the wave model’s limited ability to simulate shallower water depths.
Figure 10. A comparison of the directional wave spectra in Hurricane Bonnie (1998) as observed by SRA (synthetic aperture radar) and simulated by the NCEP WAVEWATCH (WW3) model. The dashed circles (outer to inner) correspond to wavelengths of 150m, 250m, and 350m. The solid circles indicate wavelengths of 100m, 200m, and 300m. The thick arrows extend in the downwind direction, in distance proportional to the surface wind vectors and the model input wind vectors, respectively, at that location on the space grid. A wind speed of 30 m s-1 corresponds to a length of 0.03 radian m-1. The location north and east of the eye, in km, is indicated in the upper left corner of the SRA spectrum. The maximum wave height is shown in the upper right corners, respectively. The peak wavenumber is in the upper left corner with the peak frequency in the upper right corner of the WW3 panel.
It should be noted that even though the NCEP WAVEWATCH model seems to be capable of reproducing the main features of the wave fields in tropical cyclones it does not necessarily imply that the momentum flux can be accurately determined. This is because the momentum flux is supported mainly by short waves in the wavelength range of 0.1-10 m, which are unresolved by the wave model. The high frequency range of the WW3 wave spectrum is empirically parameterized. The theoretical basis for such parameterizations is presently an active area of research.
Atmosphere-Ocean Interactions, Advances in Fluid Mechanics Series, No. 33, WIT Press, 83-114.

3 Modeling of tropical cyclone-ocean interactions While it has been known since the 1960s that tropical cyclones leave a cold wake at the sea surface, the effect of this cooling on the intensity of tropical cyclones has received surprisingly little attention. For the vast majority of research and operational tropical cyclones models, conditions of fixed SST in time are assumed. In spite of the application of sophisticated numerical models, there appears to be little skill in predicting tropical cyclone intensity changes. Recent modeling studies have shown that improvements in intensity forecasts can be achieved when a tropical cyclone model is coupled with an ocean model. Here we review these and earlier coupled tropical cyclone modeling efforts. 3.1 Idealized studies Early numerical simulations of the tropical cyclone-ocean interaction were performed with axisymmetric models neglecting the storm movement (Chang and Anthes [39]; Sutyrin and Khain [40]). Since these studies used coarse horizontal resolution, they resulted in only weak model storms, and the SST cooling did not have a large effect on the tropical cyclone intensity. Sutyrin and Khain [41] and Ginis et al. [42] coupled an axisymmetric tropical model with a 3D ocean model to simulate the effect of the storm movement on the storm intensity. In their simulations, the initial response of the tropical cyclone to the SST decrease was delayed, with significant impact on the storm intensity (i.e, weakening by about 5-7 hPa) occurring on the second day of integration. Sutyrin and Khain [41] investigated the sensitivity of storm intensity to the cyclone translation speed and the initial mixed layer depth. As expected, storm weakening was larger for slower moving storms and for shallower mixed-layer depths. When the ocean coupling was included from the beginning of the integration, development of the tropical cyclone was slower, and the maximum intensity was substantially weaker (10-15 mb). Khain and Ginis [43] also used the Ginis et al. [42] coupled model and crudely included the effect of a basic flow by moving the atmospheric grid over the ocean grid. The main conclusion from these experiments is that both the intensity (i.e., about 5-7 mb) and motion of the tropical cyclone were affected by the cooling of the upper ocean (i.e., 3.5-6oC). However, all these previous integrations were performed with coarse resolution of 40 to 60 km.
In Bender et al. [22], the tropical cyclone-ocean interaction was investigated more thoroughly using a high-resolution coupled model in which the GFDL hurricane model was coupled with a multi- layer primitive equation ocean model. In this study a set of idealized numerical experiments were performed in which a tropical cyclone vortex was embedded in either easterly and westerly basic flows or no initial basic flow. The experiments indicated that
Atmosphere-Ocean Interactions, Advances in Fluid Mechanics Series, No. 33, WIT Press, 83-114.

the cooling of the SST induced by the tropical cyclone resulted in a significant decrease in storm intensity. Consistent with the observational studies, the sea surface cooling was found to be larger when the storms moved slower. The latter case resulted in the largest decrease in storm intensity compared to experiments run without the effect of the coupling included. More recently Shade and Emanuel [44] performed a sensitivity study to various storm and ocean parameters using a simple coupled hurricane-ocean model. The coupled model was constructed from an axisymmetric hurricane model and a three-dimensional ocean model. Based on a large set of numerical experiments they concluded that the SST feedback effect can reduce the intensity of a hurricane, as measured by the pressure deficit in the eye of the storm, by more than 50% compared to a hypothetical storm over an ocean with constant SST. Only in cases of rapidly moving storms over deep ocean mixed layers is the SST negative feedback effect of minor importance.
Shen and Ginis [45] performed idealized numerical experiments with the GFDL coupled hurricane-ocean model of Bender and Ginis [46] to study the responses of coastal SSTs to landfalling hurricanes and their influences on hurricanes during landfall. They concluded that the hurricane-induced surface cooling is insensitive to the ocean depth as long as it is much deeper than the mixed layer. At landfall, the cold wake behind the hurricane acts to reduce the near-surface entropy advection into the hurricane core, thus reducing the major energy source during that time. The reduced entropy advection leads to an enhanced heat flux from the land surface to the right side of the hurricane track. However, this flux increase, with its magnitude depending on the land surface conditions is generally much smaller than the reduction of entropy advection from the ocean. The impacts of ocean coupling and ocean coupling-related intensity difference before landfall are mostly confined to the short periods of time after landfall and quickly diminish as the hurricane moves further inland.
The SST negative feedback effect on binary tropical cyclones, typically observed in the western Pacific, was studied by Falkovich et al. [47] and Khain et al. [48]. A coupled model consisting of a movable-nested-grid tropical cyclone model and a multi-layer three-dimensional ocean model was used. They found that not only the tropical cyclone intensity but also the binary storm tracks can be greatly affected by the coupling with the ocean. Binary storms, in the course of their mutual rotation, may cross each others’ cold wakes. As a result, their trajectories can be significantly modified compared to the uncoupled experiments, assuming a constant SST.
Although performed for idealized storms, these studies suggest that the tropical cyclone-ocean interaction is likely to play an important role in the intensity in real storms, as well. However, analyses of numerical simulations involving observed cases are still necessary to clarify the role of tropical cyclone-ocean interactions in the real atmosphere and ocean.
Atmosphere-Ocean Interactions, Advances in Fluid Mechanics Series, No. 33, WIT Press, 83-114.

3.2 Coupled atmosphere-ocean simulations of observed tropical cyclones Emanuel [49] applied a simple coupled model, consisting of an axisymmetric hurricane model and one-dimensional ocean model, to simulate several historic hurricanes in the Atlantic Ocean, including Hurricanes Hugo (1989), Andrew (1992), and Opal (1995). He demonstrated that significant improvements in the intensity predictions can be achieved if the SST negative feedback is taken into account. Storm intensity in the model was particularly sensitive to the thermal structure of the upper ocean. However, the use of climatological ocean data in this study was probably one of the reasons of failed forecasts in some cases, such as Hurricane Cammile of 1969. Also, the application of an axisymmetric hurricane model for real tropical cyclone predictions is limited in those cases when effects of vertical wind shear or dynamical interactions with other weather systems play an important role in the tropical cyclone evolution. Nevertheless, these simple model simulations clearly demonstrate that much of the intensity evolution of real tropical cyclones is largely controlled by thermodynamic properties of the atmosphere and upper ocean along the storm track.
The effect of tropical cyclone-ocean interactions on the intensity of observed hurricanes was investigated in Bender and Ginis [46] by coupling the GFDL hurricane model (Kurihara et al. [50]) with a high resolution version of the Princeton Ocean Model (Blumberg and Mellor [51]). The GFDL hurricane model has been the official operational hurricane prediction model for the U.S. National Weather Service since 1995 and has performed very well in providing accurate track forecasts. As far as intensity prediction is concerned, the performance of the model has shown little skill. Problem areas associated with the GFDL model's intensity forecasts include the 1/60 resolution of the innermost grid, which is still not sufficient to adequately resolve the interior storm structure, or adequately represent the model physics. Also, the operational GFDL model had no active interaction with the ocean, assuming a constant SST in time.
The simulations in Bender and Ginis [46] were run with inclusion of the ocean coupling for two cases of Hurricane Opal (1995) and one case of Hurricane Gilbert (1988) in the Gulf of Mexico and two cases of Hurricanes Felix (1995) and Fran (1996) in the western Atlantic. The results were compared with the operational (uncoupled) model forecasts. They confirmed the conclusions of the idealized studies regarding the impact of tropical cyclone-ocean interactions on hurricane intensity. In particular, it was shown that the coupling interactions produced a significant cooling of the sea surface resulting in a substantial decrease in the evaporation and boundary layer moist static energy over the cold wake. This had a large effect on the storm intensity, with a concomitant large decrease in SST, particularly when the storms were moving
Atmosphere-Ocean Interactions, Advances in Fluid Mechanics Series, No. 33, WIT Press, 83-114.

slowly. In each of the seven forecasts made, inclusion of the ocean coupling generally led to substantial improvements in the prediction of storm intensity, as measured by the storm's minimum sea-level pressure.
After moving across the Yucatan Peninsula, Hurricane Gilbert deepened only 4 hPa during the 48h period that it crossed the warm waters of the central Gulf of Mexico. Without the effect of the coupling, the operational GFDL model incorrectly predicted a continuous deepening of 25 hPa, until the final landfall on the Mexican coast. With the coupling included, the storm deepened only 10 hPa which was much closer to the observed rate. This strongly suggests that the cooling of the SSTs was one of the primary factors that prevented Hurricane Gilbert from re-intensifying as it moved across the very warm waters of the Gulf of Mexico under apparently favorable environmental conditions.
Similarly, Hurricane Opal moved very slowly during the period from 0000 UTC 2 October through 1200 UTC 3 October, in both coupled model forecasts. These started at 0000 UTC 1 and 2 October, respectively, and produced a large SST decrease just northwest of the Yucatan and only slow storm deepening during this period, consistent with the observed deepening. In contrast, without the coupling, the operational model predicted rapid deepening (58 hPa from the 0000 UTC 2 October initial time). On October 3rd, as Opal began to accelerate to the north, the hurricane rapidly began to strengthen. This trend was generally reproduced by the coupled model, although the rate of deepening was somewhat less than observed. This result was consistent with previous idealized and observational studies, which showed that the storm translational speed was an important parameter affecting the amount of SST decrease caused by the moving hurricane. Nevertheless the importance of the effect of coupling on intensity predictions in the Gulf of Mexico was again demonstrated, because the rapid intensification of Hurricane Opal, both model and observed, did not occur until the storm moved away from waters with large SST reductions. These were produced when the storm was slowly drifting in the southern Gulf of Mexico.
In the series of experiments involving Hurricane Fran, forecasts were made starting at 0000 UTC 1 and 2 September during which time Fran's intensity was influenced by the cold wake of Hurricane Edouard, which moved in nearly an identical path four days earlier. Since the wake of Hurricane Edouard was not resolved by the global SST analysis, the operational GFDL model incorrectly forecasted 40 hPa deepening while Fran remained at nearly constant intensity. To investigate the impact of Edouard's wake two sets of coupled and uncoupled experiments were run from the first forecast time. In the first set, Edouard’s cold wake was generated before the start of the forecast. In the second set of experiments, Edouard’s wake was not included. The cold wake significantly impacted the intensity of Fran (during the period that it crossed the wake) and the model storm intensity was considerably closer to the observed value, even
Atmosphere-Ocean Interactions, Advances in Fluid Mechanics Series, No. 33, WIT Press, 83-114.

without the ocean coupling. This demonstrates the importance of the effect of Edouard's cold wake on the intensity of Fran. With inclusion of both the wake and the ocean coupling the intensity prediction was much improved starting at both forecast periods. Therefore, for this storm both an accurate initial SST analysis as well as the inclusion of the ocean coupling proved essential for accurate hurricane intensity prediction using a dynamical model.
It should be pointed out that the differences in the storm track, defined as a difference between the observed and forecasted positions of the storm center, were small between forecasts run with and without ocean coupling for Hurricanes Gilbert, Opal and Felix, despite the large intensity differences. Significant difference in storm track for Fran only occurred between the coupled experiment with Edouard's wake and the operational forecast. For the two experiments of Fran, this led to a reduction in track error of about 12% at the 24, 48 and 72h time periods when the coupling and the initial wake of Edouard was added.
During the 1998-2000 hurricane seasons, the coupled GFDL hurricane-ocean model was run in near real time for more than 350 cases in the Atlantic and Gulf of Mexico. Improved intensity forecasts were again achieved, with the mean absolute error in the forecast of minimum sea-level pressure reduced by about 26% compared to the operational (uncoupled) GFDL model. The largest improvements (30.5 %) were achieved for the storms of hurricane (less than 980 hPa) intensity.
Figure 11. Time series of minimum sea-level pressure for the GFDL operational (uncoupled) forecast (solid line) and the GFDL coupled model (dot-dashed line) compared to observed values (circles indicating values at every 6 hours) for the forecasts of Hurricane Bonnie (left panel) and Danielle (right panel).
Shown in Fig.11 are the predicted 72 hour time series of the minimum sea-level pressure for one case each of Hurricanes Bonnie and Danielle in 1998.
Atmosphere-Ocean Interactions, Advances in Fluid Mechanics Series, No. 33, WIT Press, 83-114.

The observed values are also plotted. These examples represent some of the best cases and were obtained during important forecast periods. On August 23 Hurricane Bonnie was moving toward the U.S. east coast. The GFDL model track forecasts were generally fairly good. The model correctly predicted that the storm's forward speed would be reduced during that period. However, the intensity forecast indicated rapid storm intensification which resulted in large intensity overprediction. This overprediction occurred because the operational model had responded to very warm water underneath the storm in the global SST analysis. In the coupled model, the slow hurricane movement generated a large SST decrease below the storm. As a result, the storm intensity forecasts were significantly improved. At initial time 1200 UTC August 23 shown in Fig. 11, the coupled model correctly predicted that the hurricane would weaken by 1200 UTC August 24.
By comparison, the GFDL model predicted movement of Hurricane Danielle at initial time 18 UTC August 29 was accurate, although the intensity forecast indicated again a significant overprediction. This was because the hurricane was moving very close to the cold wake generated by Hurricane Bonnie a few days before. Inclusion of this effect in the coupled model resulted in a large improvement of the intensity forecast in this case.
Figure 12 shows the SST response to Hurricane Georges in 1998 over the Gulf of Mexico simulated by the coupled model. Shallow mixed layer depths in the Gulf were conducive to substantial cooling of the sea surface along the storm track. The maximum cooling found to the right of the track reached about 3oC. The inclusion of this effect in the coupled model also led to substantial improvements in the hurricane intensity forecast.
Observations suggest that hurricane evolution in the Gulf of Mexico may be affected by Loop Current Eddies (LCEs) shed by the Loop Current, which possess a relatively deep and warm ocean mixed layer (Shay et al. [52]). Passage over an LCE may potentially significantly reduce the SST negative feedback on the hurricane intensity. In two recent modeling studies, (Bao et al. [53] and Hong et al. [54]) coupled hurricane-ocean models were used to evaluate how a Loop Current Eddy affected the intensification of Hurricane Opal in the Gulf of Mexico. The coupled model used in Hong et al. [54] consisted of the Naval Research Laboratory’s Coupled Ocean-Atmosphere Mesoscale Prediction System (COAMPS) and the GFDL Modular Ocean Model (MOM). Several numerical experiments were conducted to isolate the effects of the LCE and the hurricane-ocean coupling. In the experiments with and without the LCE, Opal intensified by 17 hPa and 7 hPa correspondingly. Significant additional amounts of increased sensible and latent heat were found when Opal, in the model, crossed the LCE. It should be noted, that the observed acceleration of Opal that also likely contributed to the hurricane intensification (Emanuel [49] Bender and Ginis [46]) was not reproduced in these model simulations.
Atmosphere-Ocean Interactions, Advances in Fluid Mechanics Series, No. 33, WIT Press, 83-114.

In Bao et al. [53] a coupled air-sea modeling system was used that consisted of the Penn State-NCAR Mesoscale Model (MM5), the University of Colorado version of the Princeton Ocean Model, and the WAMDI wave model. The results of their simulations of Hurricane Opal were similar to those found by Bender and Ginis (2000). While the experiments in Bao et al. [53] were designed in such a way that Opal passed over an LCE, its effect on hurricane intensity was found insignificant. This is mainly because the hurricane was moving very rapidly over the LCE and potential positive feedback from the LCE on the storm intensity was reduced. Nevertheless, the presence of LCEs may play an important role on slow moving hurricanes because they posses much larger heat content than otherwise available in the Gulf of Mexico.
Figure 12. The SST distribution (0C) at 72 hours for the GFDL coupled model forecasts for Hurricane Georges in 1999 (1200 UTC 26 September initial time). The observed track is shown by a solid line and forecasted track is a dashed line.
Atmosphere-Ocean Interactions, Advances in Fluid Mechanics Series, No. 33, WIT Press, 83-114.

All air-sea interaction studies emphasize the importance of proper initialization of the coupled modeling system. It is well known that successful forecasts of the structure and movement of tropical cyclones using an atmospheric model alone are strongly dependent on good initialization. In the coupled model, the ocean initialization is equally important, because the SST response is very sensitive to the upper ocean structure. Therefore, accurate prediction of tropical cyclone intensity will require proper initialization of both atmospheric and oceanic components of the modeling system, as well as accurate measurements of the ocean ahead of the storm, and skillful assimilation of the ocean data into the ocean model.
4 Summary Tropical cyclones occur only over the oceans and rapidly decay after they make landfall or move into cooler waters, owing to the paramount importance of the surface fluxes as their energy source. From the oceanographer’s point of view, tropical cyclones constitute extremely fierce and rather localized surface wind forcing that generates significant ocean response. Thus, tropical cyclones represent an extreme case of air-sea interaction. During this interaction, heat, momentum, and mechanical energy are transported vertically in turbulent boundary layers, which develop on each side of the air-sea interface. Currents are accelerated in the oceanic mixed layer, large velocity gradients develop, and vertical mixing is generated. Cold water from below is thereby entrained into the mixed layer, which cools and deepens. Although the heat flux from the ocean is essential for intensification and maintenance of the tropical cyclone, the cooling of the sea surface is dominated by entrainment. The vertical mixing produces a cold-water scar in the wake of the storm which appears clearly in infrared satellite images.
The wind-driven currents in the oceanic mixed layer are spatially non-uniform and therefore force vertical motions. Near the storm center, surface water is transported outward and cold deep water is pumped upward (upwelling). In the periphery of the storm, surface water accumulates and weak downwelling occurs. As time evolves, the mechanical energy supplied by the tropical cyclone is dispersed laterally and vertically by the internal inertia-gravity waves. However, not all energy is radiated away by the waves. Some energy remains in steady currents elongated along the storm track, geostropically adjusted with associated storm-elevated isopycnals (baroclinic ridges).
There has been a steady improvement in tropical cyclone track forecasting over the last two decades, mostly due to improvements in dynamical models and satellite observations. In spite of the increase in the skill of tropical cyclone motion forecasts, there appears to be little skill in predicting storm intensity changes. Because the self-induced SST cooling can significantly decrease the
Atmosphere-Ocean Interactions, Advances in Fluid Mechanics Series, No. 33, WIT Press, 83-114.

air-sea exchange, it can also limit the intensity of the tropical cyclone. Therefore, the air-sea interaction in tropical cyclones has become an important area of research recently.
Idealized and real case simulations using coupled tropical cyclone models indicate great sensitivity of the tropical cyclone intensity to ocean coupling, especially for slow moving storms over ocean areas with a shallow mixed layer. These studies suggest that inclusion of ocean coupling is necessary for accurate tropical cyclone intensity prediction. They also indicate that besides the large-scale sea surface temperature field, the synoptic-scale subsurface ocean conditions can significantly affect the storm intensity. A successful intensity forecast therefore requires knowledge of the upper ocean conditions ahead of the storm. Such information could be collected on a routine basis with aircraft expendable bathythermographs as part of hurricane reconnaissance flights.
It is hoped that more attention will be focused on the role of the ocean in limiting tropical cyclone intensity in the nearest future. Much of the theory of turbulent transfer processes both in the ocean and at the interface between the ocean and the atmosphere is based on laboratory experiments and on the extrapolation to tropical cyclone conditions of measurements taken at low or moderate wind speeds. In light of the fundamental role these transfer processes play in supplying energy to the tropical cyclone, this aspect of the tropical cyclone problem seems to be one of the most promising for major improvements in tropical cyclone intensity forecasting. References [1] Ooyama, K. Numerical simulation of the life-cycle of tropical cyclones. J. Atmos. Sci., 26, pp. 3-40, 1969. [2] Palmén, E. On the formation and structure of the tropical hurricane. Geophysica, 3, pp. 26-38, 1948. [3] Miller, B.I. On the maximum intensity of hurricanes. J. Meteor., 15, pp. 184-195, 1958. [4] Emanuel, K.A. An air-sea interaction theory for tropical cyclones, Part 1: Steady-state maintenance. J. Atmos. Sci., 43, pp. 585-604, 1986. [5] Chang, S.W. The response of an axisymmetric model tropical cyclone to local variations of sea surface temperature. Mon. Wea. Rev., 107, pp. 662-666, 1979.
Atmosphere-Ocean Interactions, Advances in Fluid Mechanics Series, No. 33, WIT Press, 83-114.

[6] Tuleya, R.E., & Kurihara, Y. A note on the sea surface temperature sensitivity of a numerical model of tropical storm genesis. Mon. Wea. Rev., 12, pp. 2063-2068, 1982. [7] Emanuel, K.A.. The maximum intensity of hurricanes. J. Atmos. Sci., 45, pp. 1143-1155, 1988. [8] DeMaria, M., and J. Kaplan. Sea surface temperature and the maximum intensity of Atlantic tropical cyclones. J. Climate, 7, pp. 1424-1334, 1993. [9] Brooks, D.A. The wake of hurricane Allen in the western Gulf of Mexico. J. Phys. Oceanogr., 13, pp. 117-129, 1983. [10] Brink, K.H. Observations of the response of the thermocline currents to a hurricane. J. Phys. Oceanogr., 19, pp. 1017-1022, 1989. [11] Shay, L.K., & Elsberry, R.L. Near-inertial ocean current response to hurricane Frederic. J. Phys. Oceanogr., 17, pp. 1249-1269, 1987. [12] Lighthill, M. J. Waves in Fluids. Cambridge Univ. Press. 504 pp., 1978. [13] Geisler, J.E. Linear theory of the response of a two layer ocean to a moving hurricane. Geophys. Fluid Dyn., 1, pp. 249-272, 1970. [14] Ginis, I. & Sutyrin, G.G. Hurricane-generated depth-averaged currents and sea surface elevation. J. Phys. Oceanogr., 25, pp. 1218-1242, 1995. [15] Price, J.F. Inertial wave wake of a moving storm. Part 1: Scales, energy budget and observations. J. Phys. Oceanogr., 13, pp. 949-965, 1983. [16] Pudov, V.D. Measure of the temperature and current velocity fields of a baroclinic ocean layer in the wake of typhoon Virginia. Oceanology, 20, pp. 8-13, 1980.
[17] Orlanski, I., & Polinsky, L.J. Ocean response to mesoscale atmospheric forcing. Tellus, 354, pp. 296-323, 1983. [18] Shay, L.K., Chang, S.W. & Elsberry, R.L. Free surface effects on the near-inertial ocean current response to a hurricane. J. Phys. Oceanogr., 20, pp. 1405-1424, 1990.
Atmosphere-Ocean Interactions, Advances in Fluid Mechanics Series, No. 33, WIT Press, 83-114.

[19] Fisher, E. L. Hurricanes and the sea-surface temperature fields. J. Meteor., 15, pp. 328-333, 1958. [20] Jordan, C.L. On the influence of tropical cyclones on the sea surface temperature field. Proc. Symp. on Trop. Meteor., New Zealand Meteorological Service, Wellington, pp. 614-622. 1964. [21] Leipper, D.L. Observed ocean conditions and hurricane Hilda, 1964. J. Atm. Sci., 24, pp. 182-196, 1967. [22] Bender M.A., Ginis, I. & Kurihara, Y. Numerical simulations of the tropical cyclone-ocean interaction with a high-resolution coupled model. J. Geophys. Res., 98, pp. 23,245-23,263, 1993. [23] Stramma, L., Cornillon, P. & Price, J.F. Satellite observations of sea surface cooling by hurricanes. J. Geophys. Res., 91, pp. 5031-5035, 1986. [24] Nelson, N.B. Spatial and temporal extent of surface ocean modifications by hurricanes during the 1995 season. Mon. Wea. Rev., 126, pp. 1364-1368, 1998. [25] Price, J.F. Upper ocean response to a hurricane. J. Phys. Oceanogr., 11, pp. 153-175, 1981. [26] Ginis, I. & Dikinov, K. Z. Numerical simulations of the evolution of a tropical cyclone's thermodynamic wake in the ocean. Oceanology, 22, pp. 667-771, 1982. [27] Ginis, I. & Dikinov, K. Z. Modelling of the typhoon Virginia (1978) forcing on the ocean. Meteorology and Hydrology, 7, pp. 53-60. 1989. [28] Ginis, I., Richardson, R.A. & Rothstein, L.M. Design of a multiply - nested primitive equation ocean model. Mon. Wea. Rev., 126, pp. 1054-1079, 1998. [29] Pudov, V.D., Varfolomeyev, A..A. & Fedorov, K.N. Vertical structure of the wake of a typhoon in the upper ocean. Oceanology, 18, pp. 142-146, 1978. [30] Emanuel, K.A. Sensitivity of tropical cyclones to surface exchange coefficients and a revised steady-state model incorporating eye dynamics. J. Atmos. Sci., 52, pp. 3969-3976, 1995. [31] Andreas, E.L. & Emanuel, K. A. Effects of sea spray on tropical cyclone intensity. J. Atmos. Sci., 58, pp. 3741-3751, 2001.
Atmosphere-Ocean Interactions, Advances in Fluid Mechanics Series, No. 33, WIT Press, 83-114.

[32] Makin, V.K., Kudryavtsev, V.N. & Mastenbroek, C. Drag of the sea surface. Bound. Lay. Meteor., 73, pp. 159-182, 1995. [33] Donelan, M.A., Hamilton, J. & Hui, W.H. Directional spectra of wind generated waves. Philos. Trans. R. Soc. London, Ser. A, 315, pp. 509-562, 1985. [34] Wu, X. & Flather, R.A. Hindcasting waves using a coupled wave-tide-surge model. In Third international workshop on wave hindcasting and forecasting, Montreal, Quebec, 19-22 May; Environmental Canada, pp. 159-170, 1992. [35] Mastebroek, C., Burgers, G. & Janssen, P.A.E.M. The dynamical coupling of a wave model and a storm surge model through the atmospheric boundary layer. J. Phys Oceanogr., 23, pp. 1856-1866, 1993. [36] Walsh, E. J., Wright, C. W., Vandemark, D., Krabill, W. B., Garcia, A. W., Houston, S. H., Murillo, S. T., Powell, M. D., Black, P. G. & Marks, F. D. Hurricane directional wave spectrum spatial variation at landfall. Accepted in J. Phys. Oceanogr. [37] Wright, C. W., Walsh, E. J., Vandemark, D., Krabill, W. B., Garcia, A. W., Houston, S. H., Powell, M. D., Black, P. G. & Marks, F. D. Hurricane directional wave spectrum spatial variation in the open ocean. Accepted in J. Phys. Oceanogr. [38] Tolman, H. L. User manual and system documentation of WAVEWATCH-III version 1.18. NOAA/NWS/NCEP/OMB Technical Note 166, 1999. [39] Chang, S.W. & Anthes, R.A. The mutual response of the tropical cyclone and the ocean. J. Phys. Oceanogr., 9, pp. 128-135, 1979. [40] Sutyrin, G.G. & Khain, A.P. Interaction of the ocean and the atmosphere in the area of moving tropical cyclone. Dokl. Akad. Sci. USSR, 249, pp. 467-470, 1979. [41] Sutyrin, G.G. & Khain, A.P. On the effect of air-ocean interaction on intensity of moving tropical cyclone. Atmos. Ocean. Phys., 20, pp. 787-794, 1984. [42] Ginis, I., Dikinov, K. Z. & Khain, A.P. Three dimensional coupled model of the atmosphere and the ocean in the zone of typhoon. Dokl. Akad. Sci. USSR, 307, pp. 333-337, 1989.
Atmosphere-Ocean Interactions, Advances in Fluid Mechanics Series, No. 33, WIT Press, 83-114.

[43] Khain, A.P. & Ginis, I. The mutual response of a moving tropical cyclone and the ocean. Beitr. Phys. Atmosph., 64, pp. 125-141, 1991. [44] Shade, L.R. & Emanuel, K.A. The ocean’s effect on the intensity of tropical cyclones: Results from a simple coupled atmosphere-ocean model. J. Atmos. Sci, 56, pp. 642-651, 1999. [45] Shen, W. & Ginis, I. The impact of ocean coupling on hurricanes during landfall. Geophys. Res. Let. 28, No. 14, pp. 2839-2842, 2001. [46] Bender, M.A. & Ginis, I. Real case simulations of hurricane-ocean interaction using a high resolution coupled model: Effects on hurricane intensity. Mon. Wea. Rev., 126, pp. 917-946, 2000. [47] Falkovich A.I., Khain, A.P. & Ginis, I. Motion and evolution of binary tropical cyclones in a coupled atmosphere-ocean model. Mon. Wea. Rev., 123, pp. 1345-1363, 1995. [48] Khain A.P., Ginis, I. & Falkovich, A. Interaction of binary tropical cyclones in a coupled tropical cyclone-ocean model. J. Geophys. Res., 105 (D17), 22,337-22,354, 2000. [49] Emanuel, K.A. Thermodynamic control of hurricane intensity. Nature, 401, pp. 665-669, 1999. [50] Kurihara, Y., Tuleya, R.E. & Bender, M.A. The GFDL hurricane prediction system and its performance in the 1995 hurricane season. Mon. Wea. Rev., 126, pp. 1306-1322., 1998. [51] Blumberg A.F. & Mellor, G.L. A description of a three-dimensional coastal ocean circulation model. Three-Dimensional Coastal Ocean Models, ed. N.S. Heaps, AGU, pp. 1-16. 1987. [52] Shay, L.K., Goni, G.J. & Black, P.G. Effects of a warm oceanic feature on hurricane Opal. Mon. Wea., Rev., 128, pp. 1366-1383, 2000. [53] Bao, J.-W., Wilczak, J.M., Choi, J.-K. & Kantha, L. H. Numerical simulations of air-sea interaction under high wind conditions using a coupled model: a study of hurricane development. Mon. Wea. Rev., 128, pp. 2190–2210, 2000.
Atmosphere-Ocean Interactions, Advances in Fluid Mechanics Series, No. 33, WIT Press, 83-114.

[54] Hong, X., Chang, S.W., Raman, S., Shay, L.K. & Hodur, R. The interaction of hurricane Opal (1995) and a warm core ring in the Gulf of Mexico. Mon. Wea. Rev., 128, pp. 1347-1365, 2000.
Atmosphere-Ocean Interactions, Advances in Fluid Mechanics Series, No. 33, WIT Press, 83-114.