trophic level and overlap of sea lions (zalophus ...pkoch/pdfs/koch papers/2008/porras-peters...
TRANSCRIPT
MARINE MAMMAL SCIENCE, 24(3): 554–576 (July 2008)C© 2008 by the Society for Marine MammalogyDOI: 10.1111/j.1748-7692.2008.00197.x
Trophic level and overlap of sea lions (Zalophuscalifornianus) in the Gulf of California, Mexico
HEIDI PORRAS-PETERS
DAVID AURIOLES-GAMBOA
Laboratorio de Ecologıa de Pinnıpedos “Burney J. Le Boeuf,”Centro Interdisciplinario de Ciencias Marinas,
Instituto Politecnico Nacional,Ave. IPN s/n Colonia Playa Palo de Santa Rita,
La Paz, Baja California Sur, Mexico 23096E-mail: [email protected]
VICTOR HUGO CRUZ-ESCALONA
Laboratorio de Dinamica y Manejo de Ecosistemas Acuaticos,Centro Interdisciplinario de Ciencias Marinas,
Instituto Politecnico Nacional,Ave. IPN s/n Colonia Playa Palo de Santa Rita,
La Paz, Baja California Sur, Mexico 23096
PAUL L. KOCH
Department of Earth & Planetary Sciences,University of California,
Santa Cruz, California 95064, U.S.A.
ABSTRACT
Stable isotope and scat analyses were used in concert to determine trophic leveland dietary overlap among California sea lions from different rookeries in the Gulfof California. Isotopic analysis of the fur of sea lion pups revealed differences in�15N and �13C values among rookeries during the breeding season. Mean �15Nand �13C values varied from 20.2‰ to 22.4‰ and from −15.4‰ to −14.0‰,respectively. The pattern of differences among rookeries was similar between yearsin most cases. Isotopic variations among rookeries were associated with differencesin prey consumption. There was a significant correlation between �15N value andtrophic level, as determined by scat analysis. Joint application of isotopic and scatanalyses allowed us to identify how the feeding habits of sea lions vary with location.Our results suggest the presence of spatial structure in available prey as well as thelocalized use of prey by sea lions across the Gulf of California.
Key words: California sea lion, Zalophus californianus, Gulf of California, stableisotopes, trophic level, diet.
554

PORRAS-PETERS ET AL.: CALIFORNIA SEA LIONS 555
Thirteen California sea lion (Zalophus californianus) rookeries occur in the Gulf ofCalifornia, with 10 located north of 28◦N where sardine and anchovy are most abun-dant (Aurioles-Gamboa and Zavala-Gonzalez 1994). Adult females exhibit strongphilopatry (Hernandez-Camacho 2001), and feeding habits seem to show a regionalstructure (Garcıa Rodrıguez and Aurioles-Gamboa 2004). This is particularly true foranimals from rookeries that are in close proximity and that overlap in their potentialforaging space (Kuhn 2006). Several studies conducted in the Gulf of California haveshown that sea lions consume a broad variety of prey and that dietary differencesexist among rookeries (Aurioles-Gamboa et al. 1984, Orta-Davila 1988, Sanchez-Arias 1992, Gutierrez 2003). These studies have not been conducted at all majorrookeries, however, and they were done at different time periods, so differences ob-served among rookeries might be due to temporal shifts affecting all rookeries. Thesestudies used scat analyses, which offer invaluable, detailed information on prey con-sumption. Yet quantitative assessment of diet using scat analysis is subject to variouswell-known biases (da Silva and Neilson 1985, Dellinger and Trillmich 1988, Pierceand Boyle 1991, Cotrell et al. 1996, Tollit et al. 1997, Bowen 2000, Orr and Harvey2001).
Stable isotope analysis offers less detailed information on dietary composition thanscat analysis, but because it provides information on assimilated food, it avoids someof the biases in scat analysis (Tieszen et al. 1983, Hobson et al. 1994, Holst et al.2001). Moreover, because the turnover rates of elements in consumer tissues varyaccording to the metabolic rate of those tissues, stable isotope analysis can integratedietary information over different time periods (Dalerum and Angerbjorn 2005).Stable isotopes of elements in metabolically inactive tissues (e.g., fur, feathers, skin,and nails) do not turn over, and therefore reflect the diet or body chemistry of anindividual during a limited period of tissue formation (Tieszen et al. 1983).
Tissues of consumers tend to become enriched in 13C and 15N relative to thoseof their prey, a process referred to as fractionation or trophic enrichment. The 13C-enrichment per trophic step is roughly + 0.5‰ to + 2‰, based on studies of differenttissues of seals and other marine mammals (Kelly 2000, Lesage et al. 2002). The 15N-enrichment ranges from + 2‰ to + 5‰ per trophic step (Schoeninger and DeNiro1984, Hobson et al. 1996, Kelly 2000).
Both carbon and nitrogen isotope values may vary spatially in primary producersbecause of regional differences in factors such as nutrient or light levels, types of pri-mary producer, or the isotopic composition of carbon and nitrogen substrates (whichmight vary with the intensity of upwelling or the magnitude of fluvial or atmo-spheric inputs). Because of these effects, carbon isotope values differ between inshorevs. offshore and between benthic vs. pelagic food webs, with lower values in off-shore/pelagic systems, and higher values in inshore/benthic systems (McConnaugheyand McRoy 1979, Rau et al. 1983, Hobson et al. 1994, France 1995). There arelatitudinal differences in the nitrogen isotope composition of primary producers atthe base of food webs in the Gulf of California, with higher values north and lowervalues south of the Midriff Region (Fig. 1) (Altabet et al. 1999). In addition, becauseof strong trophic 15N-enrichement, nitrogen isotope values are a reliable indicatorof the relative trophic level of organisms within a food chain (Owens 1987, Kelly2000).
Stable isotope analysis of sea lion fur may allow us to examine the spatial structureof foraging by animals from different rookeries. If sea lions from different rookeriesforage in different locations, or if they take different types of prey, then isotopic valuesshould differ among sea lion rookeries. One weakness of the isotopic approach is thatdietary composition can only be determined at a coarse level (Holst et al. 2001).

556 MARINE MAMMAL SCIENCE, VOL. 24, NO. 3, 2008
Figure 1. Location of California sea lion rookeries where fur and scat samples were collected:1. Los Islotes (24◦35′N, 110◦23′W); 2. Farallon de San Ignacio (25◦26′N, 109◦22′W); 3.San Pedro Nolasco (26◦49′N, 121◦12′W); 4. San Pedro Martir (28◦24′N, 112◦25′W); 5. SanEsteban (28◦42′N, 112◦36′W); 6. El Rasito (28◦49′N, 112◦59′W); 7. El Partido (28◦53′N,113◦02′W); 8. Los Machos (29◦20′N, 113◦30′W); 9. Los Cantiles (29◦32′N, 113◦29′W);10. Isla Granito (29◦34′N, 113◦32′W); 11. Isla Lobos (30◦02′N, 114◦28′W); 12. San Jorge(31◦01′N, 113◦15′W); 13. Rocas Consag (31◦7′N, 114◦30′W). The Midriff Region is indi-cated by dash lines.
In our study we remedy this shortcoming by applying both stable isotope and scatanalyses to establish the spatial structure of the sea lion foraging throughout the Gulfof California and to assess the trophic level and potential trophic overlap among sealions at different rookeries.

PORRAS-PETERS ET AL.: CALIFORNIA SEA LIONS 557
METHODS
Fur and scat samples were collected at different California sea lion rookeries in theGulf of California, Mexico (Fig. 1). A total of 188 fur samples from sea lion pups werecollected at 13 rookeries, primarily during the breeding seasons of 2000 (16–25 July)and 2002 (15–31 July), with a small sample from 2004 (9–22 July). Fur was clippedwith scissors at the base from an area of approximately 5 × 5 cm on the middorsalregion.
In our study, we analyzed fur from suckling California sea lion pups (approximately2-mo old), assuming that they would accurately record differences in the foragingpatterns in their mothers (see Aurioles-Gamboa et al. 2006 for a similar applica-tion). To interpret maternal dietary patterns from pup fur, the isotopic fractionationsassociated with mother-to-offspring nutrient transfer during pregnancy, lactation,and weaning must be known. Unfortunately, these fractionations are still poorly un-derstood. Theoretically, if milk protein has a nitrogen isotope value similar to othermaternal tissues, then suckling offspring should have 15N-enriched values indicatingthat they are feeding one trophic level higher than their mother. This expected patternhas been observed in a number of species, including California sea lions (Newsomeet al. 2006). Because of the smaller magnitude of trophic level 13C-enrichment, andthe fact that milk is rich in 13C-depleted lipids, the fractionation from mother tosuckling infant is difficult to predict a priori, and appears to be negative in pinnipeds(Newsome et al. 2006). Here, we provide further constraints on these fractionationsthrough a comparison of isotope values for fur between adult females and sucklingpups at one rookery. The fur samples from eight adult females were collected fromthe Los Islotes rookery in April 2003. We did not attempt to match mother-puppairs, and we recognize that the fur sampled from adult females likely formed afterthe 2002 breeding season. However, given the difficulty of capturing adult females,it was not possible to sample them in previous seasons or at other rookeries.
Scat samples were collected from 11 rookeries during the breeding season of 2002(15–31 July). Most of the scat samples were from mothers with pups, as we werecollecting at breeding areas dominated by adult females.
Stable Isotope Analysis
Fur samples were rinsed with distilled water and then fully dried at 80◦C forapproximately 12 h. Lipids were removed using the Microwave Assisted Extraction(MAE) protocol (microwave oven model 1,000 MARS 5 x CEM) with 25 mL of a (1:1)solution of chloroform/methanol (Bligh and Dyer 1959). Samples were subsequentlydried and ground into a homogeneous fine powder. Stable carbon and nitrogen isotopemeasurements were performed on approximately 1.2 mg subsamples of homogenizedtissue loaded into tin foil boats using a continuous flow isotope ratio monitoring massspectrometer (20-20 PDZ Europa, Cheshire, U.K.) after sample combustion to CO2and N2 at 1,000◦C in an on-line elemental analyzer (PDZ Europa ANCA-GSL) (StableIsotope Lab., University of California, Davis, CA). Ammonium sulfate (�15N =1.33‰) was used as a secondary standard for nitrogen, and sucrose (�13C=−23.83‰)was used for carbon. The analytical error indicated by replicate measurements ofsecondary standards was ± 0.2‰ for both nitrogen and carbon.
Isotopic composition was expressed in the � notation, as the deviation from stan-dards in parts per thousand (‰) according to the following equation: �15N or �13C =[(Rsample/Rstandard) − 1] × 1,000, where R is the ratio of 15N/14N or 13C/12C for

558 MARINE MAMMAL SCIENCE, VOL. 24, NO. 3, 2008
the sample and the standard, respectively. The standards are atmospheric N2 (AIR;�15N = 0.004‰) for nitrogen and Vienna Pee Dee Belemnite limestone (V-PDB;�13C = 0.011‰) for carbon.
Student’s t-tests were performed for differences in �15N and �13C values in sea lionfur between the pups sampled in July 2002 and the adult females sampled 8 molater. Multivariate analyses of variance (MANOVA), followed by post hoc, pairwiseF-tests were performed for differences in �15N and �13C values in sea lion fur amongrookeries for each year (2000 and 2002). We compared MANOVA results between2000 and 2002 to assess inter-annual variation.
Scat Analysis
Individual scats were immersed in a detergent solution for 48 h and then screenedthrough a series of sieves with mesh widths of 2.0, 1.19, and 0.71 mm2. Fish otoliths,cephalopod beaks, and other prey remains (i.e., fish bones and scales, eye lenses offish and squid, and crustacean fragments) were extracted from the sieves. Cephalopodbeaks were stored in 70% alcohol; all other items were stored dry in vials. Fish andcephalopod species were identified by otoliths and beaks, respectively. Otolith identi-fication was determined to the lowest possible taxon, using photographs and illustra-tions (Fitch and Brownell 1968), as well as the reference collection from the CentroInterdisciplinario de Ciencias Marinas-Instituto Politecnico Nacional (CICIMAR-IPN), La Paz, B.C.S., Mexico. Cephalopod beaks were identified by Unai Markaida(ECOSUR).1
We used cumulative prey diversity curves to determine if an adequate numberof scat samples were collected to characterize the diets of animals at a rookery. Inorder to estimate a mean cumulative prey diversity curve and its SD, based on theShannon-Wiener (H’) Index (Krebs 1999), we followed the approach proposed byFerry and Cailliet (1996), Ferry et al. (1997), and modified by Cruz-Escalona andTurren (CICIMAR-IPN),2 implementing a Matlab routine, which computes 500random permutations from the original data. If the prey diversity curve reached anasymptote, we assumed that we had an adequate sample size.
The index of importance (IIMP) was used to quantify the relative abundance ofprey species in scats at each rookery (Garcıa-Rodrıguez and Aurioles-Gamboa 2004).IIMP is calculated as
IIMPi = 1
U
U∑j=1
xij
X j
where xij is the number of individuals of the ith prey in scat j; Xj is the total numberof individuals from all taxa found in scat j; U is the total number of scat samples withprey. IIMP yields the relative proportion of individuals of each prey species in scatsfrom a rookery; it is not a measure of prey importance in terms of biomass. IIMPvalues range from 0 to 1. For ease of communication, IIMP values in the text havebeen converted to percentages (IIMP × 100).
1U. Markaida, U. Laboratorio de Pesquerias Artesanales, ECOSUR, Campeche, Mexico; e-mail:[email protected].
2V. H. Cruz-Escalona and C. Turren, Laboratorio de Dinamica y Manejo de Ecosistemas Acuaticos,CICIMAR-IPN, La Paz, Baja California Sur, Mexico; e-mail: [email protected].

PORRAS-PETERS ET AL.: CALIFORNIA SEA LIONS 559
The index of Morisita-Horn (C�) was used to evaluate trophic overlap amongrookeries
C � = 2n∑
i=1
IIMPijIIMPik
/ n∑i=1
IIMP2ij +
n∑i=1
IIMP2ik
where IIMPij is the proportion of the ith prey used at rookery j, IIMPik is theproportion of the ith prey used at rookery k, and, n is the total number of prey. C�varies from zero to one. Values from 0 to 0.29 indicate no overlap, 0.30 to 0.65indicate a low degree of overlap, and those greater than 0.66 show a high degreeof overlap (Langton 1982, Krebs 1999). Pearson’s correlation was used to relate thetrophic overlap for each pair of rookeries with the distance between them (in km).
Following Christensen and Pauly (1992), aggregate trophic level (TL) of the ani-mals on a particular rookery was determined as
TL = 1 +(
n∑i=1
IIMPij
)(TLi )
where IIMPij is the proportion of the ith prey in the diet at rookery j; TLi is thetrophic level of the ith prey; n is the number of prey species in the diet at the rookeryj. Detritus and primary producers are defined as having a trophic level of 1. The TLsof the fish were obtained from Fishbase (Froese and Pauly 2003) and those of thecephalopods are from the literature (Pauly et al. 1998, Passarella and Hopkins 1991).When the TL for a prey item could not be found, we used the value for anotherspecies with similar feeding habits and distribution.
Pearson’s correlation was used to relate the �15N value for each rookery in the 2002breeding season with TL values. Statistical tests were performed using the Statisticaversion 6.0 or JMP.
RESULTS
Isotope Fractionation Between Adult Females and Pups
The fur of California sea lion pups (approximately 2-mo old) at Los Islotes was15N-enriched in relation to fur from adult females by 2.1‰ ± 0.1‰ (Student’s t-test: t16 = −15.81, P < 0.001) and 13C-depleted by 0.8‰ ± 0.2‰ (Student’s t-test:t16 = 7.23, P < 0.001).
Spatial and Temporal Dietary Variation Based on Stable Isotope Ratios
California sea lion fur showed significant separation in �15N and �13C values amongrookeries sampled in 2000 (MANOVA: Pillai’s Trace test, P < 0.0001). Post hoc F testsrevealed significant differences between most pairs of rookeries (Table 1). Most casesof non-significant differences occurred between rookeries that are in the same regionof the Gulf of California (i.e., San Pedro Martir-El Partido and San Esteban and ElPartido-Los Machos). Mean values ranged from 20.1‰ ± 0.3‰ to 21.6‰ ± 0.4‰for �15N and from −15.4‰ ± 0.2‰ to −14.3‰ ± 0.2‰ for �13C (Appendix I). Los

560 MARINE MAMMAL SCIENCE, VOL. 24, NO. 3, 2008
Tabl
e1.
Res
ults
ofM
AN
OV
Aan
dpo
stho
cFte
sts
for
�13C
and
�15N
valu
esin
(A)2
000
and
(B)2
002.
Islo
tes
Mar
tir
Est
eban
Par
tido
Mac
hos
Can
tile
sG
rani
to
(A)2
000
Islo
tes
––
––
––
Mar
tir
Y–
––
––
Est
eban
YN
––
––
Par
tido
YN
0.41
––
–M
acho
sY
YY
N–
–C
anti
les
0.00
08Y
YY
Y–
Gra
nito
YY
YY
Y0.
31
Islo
tes
Igna
cio
Nol
asco
Mar
tir
Est
eban
Ras
ito
Par
tido
Can
tile
sG
rani
toLo
bos
Con
sag
(B)2
002
Islo
tes
––
––
––
––
––
Igna
cio
Y–
––
––
––
––
Nol
asco
YN
––
––
––
––
Mar
tir
YY
Y–
––
––
––
Est
eban
YY
YN
––
––
––
Ras
ito
YY
YN
Y–
––
––
Par
tido
YY
YN
0.00
5Y
––
––
Can
tile
s0.
18Y
YY
YY
Y–
––
Gra
nito
YY
YY
YY
Y0.
0004
––
Lobo
sY
YY
YY
YY
NY
–C
onsa
gY
YY
YY
YY
YY
Y
Yin
dica
tes
that
the
post
hocF
test
ofdi
ffer
ence
sin
mea
nva
lue
was
stat
isti
call
ysi
gnifi
cant
(P=
0.05
);N
indi
cate
sth
atth
ete
stw
asno
tsi
gnifi
cant
(P>
0.05
).T
he15
pair
sth
atw
ere
anal
yzed
inbo
th20
00an
d20
02ar
eun
derl
ined
.Whe
nth
epo
stho
cF
test
syi
elde
ddi
ffer
ent
resu
lts
in20
00an
d20
02,P
valu
esar
esu
ppli
ed.

PORRAS-PETERS ET AL.: CALIFORNIA SEA LIONS 561
-16.0
-15.5
-15.0
-14.5
-14.0
-13.5
13C
IgnacioPartidoEstebanNolasco
Mártir RasitoCantiles
Machos GranitoLobos
JorgeConsagIslotes
19.5
20
20.5
21
21.5
22
22.5
2315
N2000 2002 2004
Figure 2. Inter-annual variations in �15N and �13C values (mean ± SD, in ‰) in fur ofCalifornia sea lion pups collected during the breeding seasons of 2000, 2002, and 2004.
Cantiles and Isla Granito had higher �15N values than the other rookeries, whereasSan Esteban, Los Machos, San Pedro Martir, and El Partido had higher �13C values(Fig. 2).
For 2002 we examined a larger set of rookeries and, again, found significant sep-aration in �15N and �13C values (MANOVA: Pillai’s Trace test, P < 0.0001). Mostpost hoc F tests revealed significant differences between rookeries (50 of 55) (Table 1).Three of the non-significant pair wise comparisons were between San Pedro Martirand a set of closely spaced rookeries (El Partido, El Rasito, and San Esteban) and onewas for a relatively closely spaced pair, Los Cantiles-Isla Lobos. In one case, how-ever, very distant rookeries had statistically indistinguishable �15N and �13C values(Farallon de San Ignacio-San Pedro Nolasco). The lowest and highest mean �15Nvalues were 20.2 ± 0.4 and 22.4 ± 0.5‰ and mean �13C values were −15.4‰ ±0.3‰ and −14.0‰ ± 0.2‰ (Appendix I). �15N values were higher at locationssouth of 28◦N (Los Islotes, Farallon de San Ignacio, and San Pedro Nolasco) andnorth of 29◦20’N (Los Cantiles, Isla Granito, Isla Lobos, and Rocas Consag), and
562 MARINE MAMMAL SCIENCE, VOL. 24, NO. 3, 2008
lower at locations between 28◦ and 29◦N (San Pedro Martir, San Esteban, El Rasitoand El Partido). �13C values were high at all sites south of 29◦20’N, except for LosIslotes, (i.e., Farallon de San Ignacio, San Pedro Nolasco, San Pedro Martir, San Este-ban, El Rasito and El Partido). Immediately north of 29◦20’N (i.e., at Los Cantiles)values drop and then rise again progressively at the northern-most rookeries (Fig. 2).Measurements taken at San Jorge rookery in 2004 fit this pattern.
The temporal consistency of these isotopic patterns was assessed in two ways.First, inspection of Figure 2 and Table 1 suggested that for most rookeries for whichmeasurements were taken in both 2000 and 2002, there was a strong overlap inboth �13C and �15N values. In most cases, the mean value of a measurement in 1 yrwas within roughly one SD of the mean in the other year. The largest shift in mean�15N values (0.6‰) occurred at Los Islotes whereas the largest shifts in mean �13Cvalues occurred at El Partido (0.5‰) and Isla Granito (0.4‰). Our second test was tocompare the results of post hoc F tests between the years (Table 1). For the 15 pairwiseF tests that were conducted in both 2000 and 2002, the results were the same for allbut three cases (El Partido-San Esteban, Los Cantiles-Los Islotes and Isla Granito-LosCantiles).
Diet Composition
Of the 274 scat samples collected, 98.0% contained fish remains, 19.5% molluskremains, and 7.3% crustacean remains. From the total scat samples, 155 (56.6%)contained identifiable hard parts of prey: 802 otoliths and 84 cephalopod beaks(damaged structures were not included) (Appendix II). Because the sample size wassmall and no identifiable preys were recovered from the scats at the Isla Granitorookery, this location was not included in these analyses.
Overall, sea lions fed on 52 different fish species (of which 42 were identified atleast to the family level) and five cephalopod species. The diet was dominated byserranids (six species), ophidiids (four species), and haemulids and sciaenids (threespecies). The Carangidae, Engraulidae, Merluccidae, Paralichthyidae, Scorpaenidae,and Sebastidae families were represented with two species, and the remaining familieswith only one species. When data from the 10 rookeries are averaged, six prey specieshad IIMP values ≥ 5%: the midshipman (Porichthys spp.), the Pacific anchoveta(Cetengraulis mysticetus), the Pacific jack mackerel (Trachurus symmetricus), the Pacificsardine (Sardinops sagax), the northern anchovy (Engraulis mordax), and the squid(Leachia spp.) (Appendix III).
Spatial Dietary Variation Based on Scat Sample Analysis
The cumulative prey diversity curves for Los Islotes, Farallon de San Ignacio, SanPedro Nolasco, San Pedro Martir, El Rasito, El Partido, Isla Lobos and Rocas Consagapproached an asymptote, indicating in each case that we had adequate scat samplesto describe sea lion diets. San Esteban and Los Cantiles, with low numbers of scats, didnot reach an asymptote (Fig. 3). Thus, any conclusions regarding diet compositionfor these rookeries should be viewed with caution.
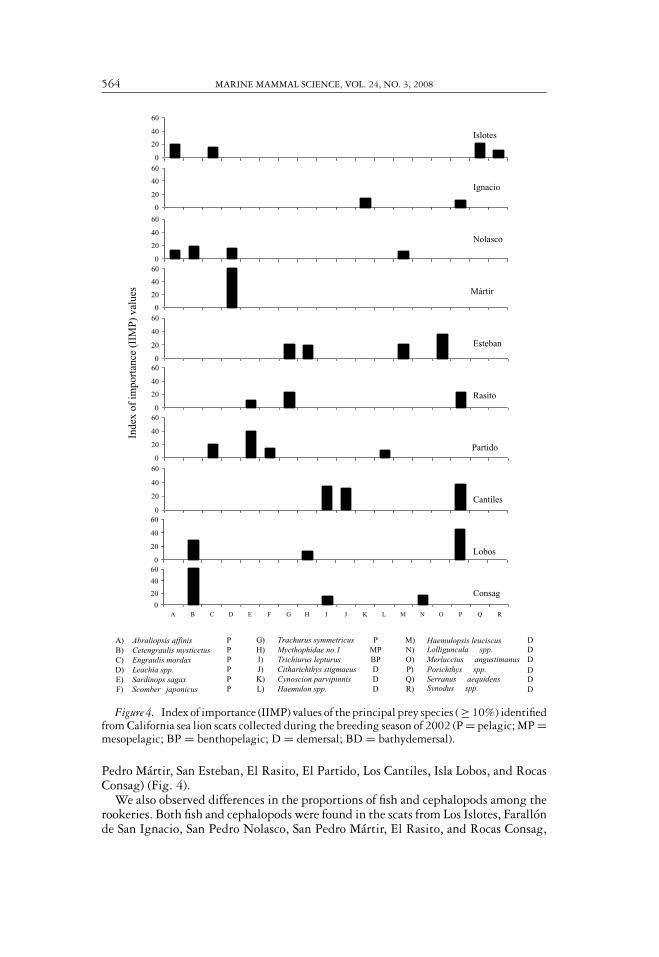
To compare diets among rookeries we considered only the prey items with IIMPvalues = 10% at any one rookery (18 species). Among these prey species, the rookeriesin the south of the Gulf of California (Los Islotes and Farallon de San Ignacio) wererepresented mostly by prey with demersal habits, whereas prey with pelagic habitswere more common in the central and northern regions (San Pedro Nolasco, San

PORRAS-PETERS ET AL.: CALIFORNIA SEA LIONS 563
0
0.5
1
1.5
2
2.5
3
3.5
4
4.5
0 5 10 15 20 25 30
0
1
2
3
4
0 5 10 15 20 25 30
Cum
ulat
ive
prey
div
ersi
ty
0
1
2
3
4
0 5 10 15 20 25 30
Number of scat samples
0
0.5
1
1.5
2
2.5
3
3.5
4
4.5
0 5 10 15 20 25 30
0
1
2
3
4
0 5 10 15 20 25 30
0
0.5
1
1.5
2
2.5
3
3.5
4
4.5
0 5 10 15 20 25 30
0
0.5
1
1.5
2
2.5
3
3.5
4
4.5
0 5 10 15 20 25 30
0
1
2
3
4
0 5 10 15 20 25 30
0
1
2
3
4
0 5 10 15 20 25 300
0.5
1
1.5
2
2.5
3
3.5
4
4.5
0 5 10 15 20 25
Lobos Consag
Partido Cantiles
Esteban Rasito
Nolasco Mártir
Islotes Ignacio
Figure 3. Mean cumulative prey diversity curves and its SD for California sea lions deter-mined from scat samples collected at 10 rookeries in the Gulf of California during the breedingseason of 2002. The cumulative prey diversity based on the Shannon-Wiener (H’) Index (Y )is plotted against the number of scat samples (X).
564 MARINE MAMMAL SCIENCE, VOL. 24, NO. 3, 2008
A) Abraliopsis affinis P G) Trachurus symmetricus P DDDDDD
M) B) Cetengraulis mysticetus P H) Mycthophidae no.1 MP N) C) Engraulis mordax P I) Trichiurus lepturus BP O) D) Leachia spp. P J) Citharichthys stigmaeus D P) E) Sardinops sagax P K) Cynoscion parvipinnis D Q) F) Scomber japonicus P L) Haemulon spp. D R)
0
20
40
60
0
20
40
60
0
20
40
60
0
20
40
60
0
20
40
60
0
20
40
60
0
20
40
60
0
20
40
60
0
20
40
60
0
20
40
60
A B C D E F G H I J K L M N O P Q R
Islotes Ignacio Nolasco
Mártir Esteban Rasito Partido Cantiles Lobos Consag
Inde
x of
impo
rtan
ce (
IIM
P)
valu
es
Lolliguncula spp.Merluccius angustimanusPorichthys spp. Serranus aequidensSynodus spp.
Haemulopsis leuciscus
Figure 4. Index of importance (IIMP) values of the principal prey species ( ≥ 10%) identifiedfrom California sea lion scats collected during the breeding season of 2002 (P = pelagic; MP =mesopelagic; BP = benthopelagic; D = demersal; BD = bathydemersal).
Pedro Martir, San Esteban, El Rasito, El Partido, Los Cantiles, Isla Lobos, and RocasConsag) (Fig. 4).
We also observed differences in the proportions of fish and cephalopods among therookeries. Both fish and cephalopods were found in the scats from Los Islotes, Farallonde San Ignacio, San Pedro Nolasco, San Pedro Martir, El Rasito, and Rocas Consag,

PORRAS-PETERS ET AL.: CALIFORNIA SEA LIONS 565
Table 2. Trophic overlap between rookeries (above the diagonal), measured by means ofMorisita-Horn’s inex (C�), and the distance between them in kilometers (below the diagonal).Light gray indicates no trophic overlap between rookeries; dark gray indicates a low degreeof trophic overlap
Islotes Ignacio Nolasco Martir Esteban Rasito Partido Cantiles Lobos Consag
Islotes 0.15 0.32 0.02 0.04 0.23 0.23 0.10 0.14 0Ignacio 137 0.04 0 0.02 0.26 0.03 0.19 0.25 0Nolasco 388 345 0.48 0.34 0.22 0.13 0.04 0.37 0.43Martir 464 439 104 0.02 0.03 0.03 0.03 0.08 0.14Esteban 510 479 144 40.2 0.42 0.08 0 0.10 0Rasito 541 523 188 84.8 41.4 0.45 0.34 0.48 0Partido 549 529 194 91.4 48.1 7.6 0.03 0.01 0Cantiles 632 609 272 171 122 92 83.5 0.50 0.12Lobos 738 717 384 282 239 196 189 114 0.49Consag 823 799 461 364 319 303 296 196 110
whereas the scats collected from the remaining rookeries contained no cephalopods.Among the rookeries that had cephalopods, San Pedro Martir had the highest per-centage (44.6%). At the rest of the rookeries, cephalopods made up less than 20% ofthe prey items (Appendix III).
Trophic Level
To determine the trophic level for each rookery, we only used prey items with IIMPvalues = 5% at any one rookery. The TLs calculated for rookeries ranged between3.54 and 4.95 with an overall mean value of 3.95 (Appendix II). Correlations betweenTL data and �15N value in 2002 were weak and not significant (Pearson’s correlation:r = 0.36, 8 df, P < 0.30). After excluding two rookeries that had very few scatscontaining prey hard parts (San Esteban and Los Cantiles), which might have yieldedanomalous TL estimates, the correlation was much stronger (Pearson’s correlation:r = 0.85, 6 df, P < 0.005).
Trophic Overlap
We used data for all prey to calculate trophic overlap using the Morisita-Hornindex. No trophic overlap was found between the majority of the rookeries (C� <0.29) (Table 2). Values between 0.30 and 0.65, which indicate a low degree of trophicoverlap, were obtained for 11 pairs of rookeries. No significant correlation was foundbetween C� values and the distance between the rookeries (Pearson’s correlation: r =−0.23, 43 df, P = 0.13).
DISCUSSION
Isotope Fractionation Between Adult Females and Pups
The 15N-enrichment between fur from suckling pups and adult females was ex-pected, as pups effectively forage on their mothers, who synthesize milk protein asthey do other body proteins. The 13C-depleted values in pups were also expected

566 MARINE MAMMAL SCIENCE, VOL. 24, NO. 3, 2008
due to the 12C-enrichment in the lipid-rich milk diet of the pups relative to thepiscivorous diet of older individuals. Adult female-to-suckling pup fractionations ofthis magnitude and direction have been observed in tooth dentin and bone growthseries from California sea lions and another otariid, the northern fur seal (Callorhi-nus ursinus) (Newsome et al. 2006), and offsets of this magnitude and direction arereported for other taxa as well (Hilderbrand et al. 1996, Jenkins et al. 2001, Polis-chuk et al. 2001). Thus while the fractionation between suckling pups and adultfemales was only examined at the Los Islotes rookery, we are confident that thesefractionations are consistent within the species and, therefore, that we can use �15Nand �13C values from the fur of 2–3-mo-old pups to characterize the diets of theirmothers.
Inter-annual Isotope Variation
We found little difference in �15N and �13C values within rookeries between 2000and 2002, suggesting inter-annual consistency in diet or foraging areas. According toHernandez-Camacho (2001), the California sea lion is highly philopatric to breedingand haul-out sites, as are numerous other pinnipeds (e.g., the northern elephant seal,Mirounga angustirostris, Reiter et al. 1981; Weddell seal, Leptonychotes weddellii, Croxalland Hiby 1983; harbor seal, Phoca vitulina, Yochem et al. 1987; Antarctic fur seal,Arctocephalus gazella, Boyd et al. 1990, Lunn and Boyd 1991; monk seal, Monachusschauinslandi, Gilmartin et al. 1993; northern fur seal, Callorhinus ursinus, Gentry1998; southern elephant seal, Mirounga leonina, Bradshaw et al. 2003). In the case ofthe California sea lion, adult females in particular appear to stay near their rookeries.This may be due to the high cost of dispersion and the energetic requirements ofgestation and lactation (Greenwood 1983, Clutton-Brock 1989). Adult female sealions give birth to one pup per year and nurse it for one year or longer (Petersonand Bartholomew 1967, Newsome et al. 2006). As a consequence, nursing femalesmust forage relatively close to their rookery sites. This in turn would tend to connectfemales from particular rookeries to local resources with particular environmentalcharacteristics (Santamarıa del Angel and Alvarez-Borrego 1994).
Diet and Trophic Level
Despite the limitations of small sample size, trophic level determined for sea lionsat the different rookeries by scat analysis correlated well with trophic level estimatesfrom nitrogen isotope analysis. Although each technique had biases and uncertainties,the combination of the two approaches made it possible to characterize the diets ofthe California sea lion with greater precision.
Nitrogen isotope values and scat analysis suggest a clear separation between rook-eries in the trophic level of their prey. Less 15N-enriched values were found mainlyin the Midriff Region, especially at the San Pedro Martir, San Esteban, El Rasito, ElPartido, and Los Machos rookeries. There, the diet was mainly represented by lowertrophic level prey, such as the Pacific sardine, northern anchovy, Pacific anchoveta,and cephalopods such as the squids, Leachia spp. and Abraliopsis affinis, which areabundant in this region (Markaida and Sosa-Nishizaki 2003). Conversely, the rook-eries located south of the Midriff Region (Los Islotes, Farallon de San Ignacio, SanPedro Nolasco), and those north of it (Los Cantiles, Isla Granito, and Isla Lobos)had more 15N-enriched values. This is probably due to the consumption of prey

PORRAS-PETERS ET AL.: CALIFORNIA SEA LIONS 567
such as the deep water serrano (Serranus aequidens), Pacific jack mackerel, speckledsanddab (Citharichthys stigmaeus), midshipman, bigeye scad (Selar crumenophthalmus),North Pacific hake (Merluccius productus), largehead hairtail (Trichiurus lepturus), lizard-fish (Synodus spp.), California flounder (Paralichthys californicus), and shortfin weakfish(Cynoscion parvipinnis). These prey should all have higher �15N values than clupeid andengraulid fish, since they largely forage at a higher trophic level (Garcia-Rodriguezand Aurioles-Gamboa 2004).
An anomalous case is that of the Rocas Consag rookery. It has the highest �15Nvalue (22.4‰ ± 0.5‰) of any rookery. Yet scat analysis indicates that sea lion dietsthere are dominated (61.2%) by Pacific anchoveta. This filter-feeding species occupiesa low trophic level, which should lead to lower �15N values. This inconsistency mayrelate to the location of this site near the mouth of the Colorado River. The sitemight experience significant 15N-enrichment at the base of the food web due tonutrient contributions from the Colorado River that are cascading up to label highertrophic levels (Aguıniga-Garcıa 1999). If correct, this interpretation suggests that�15N values are influenced by oceanographic conditions that exist in each region, aswell as the type of diet consumed.
Trophic Overlap
When the distribution of two or more species of otariids overlaps, the species tendto utilize different food resources and, therefore, have a low degree of dietary overlap(Everitt et al. 1981, Antonelis et al. 1990, Green et al. 1990, Dellinger and Trillmich1999, Aurioles-Gamboa and Camacho-Rıos 2007). Furthermore, recent research onthe foraging ecology of some marine mammals has shown that individuals within aspecies feeding under similar conditions may specialize on particular prey or foragingstrategies, regardless of age, sex, and morphology (Ford et al. 1999, Estes et al. 2003).
In this study, isotopic data for the fur of California sea lions from across the Gulfof California suggest some trophic segregation among rookeries, probably due to theuse of different foraging areas and the consumption of different types of prey. Spatialvariation in the diet of California sea lion was also observed by Garcıa-Rodrıguez andAurioles-Gamboa (2004). However, with the combination of both isotopic and scatanalyses we were able to estimate dietary structure at a wider geographic range.
According to the studies of Duran-Lizarraga (1998) and Kuhn (2006), Californiasea lions usually conduct feeding trips of 40–50 km from their rookeries. Theseestimates are greater than the distances that separate some of the rookeries in theGulf of California, such as El Rasito from El Partido (8 km) or Isla Granito from LosCantiles (16 km). Even so, differences in isotopic values and inferred diet compositionwere found among these rookeries. The foraging range for animals at these rookeriesmay be smaller than previously reported due to local oceanographic factors thatinfluence prey availability. Alvarez-Borrego (1983) noted that the Midriff Region,particularly in the Canal de Ballenas, has the highest nutrient concentration of theentire Gulf of California due to constant upwelling forced by strong tidal mixing.It is possible that the differences in the diet between closely spaced rookeries area reflection of the high productivity and availability of food near the rookeries,which results in shorter feeding trips compared to other areas (Garcıa-Rodrıguez andAurioles-Gamboa 2004).
The El Rasito and El Partido rookeries had a low degree of dietary overlap basedon scat analysis (C� = 0.45). �13C values also differed significantly between these

568 MARINE MAMMAL SCIENCE, VOL. 24, NO. 3, 2008
rookeries (MANOVA: P = 0.012), but �15N values did not (MANOVA: P = 0.142).Animals from these rookeries had diets that contained a number of the same preyspecies, but these prey occurred at different IIMP values, suggesting the differentialuse of the resources within the same geographic region or the use of different foragingareas. In the case of Isla Granito and Los Cantiles, although we were unable to comparetheir trophic overlap (because of a lack of scat data from Isla Granito), the �15N and�13C values showed a pattern similar to that between El Rasito and El Partido,suggesting again that sea lions may be using different foraging areas.
In summary, whereas similar isotopic values between rookeries cannot be inter-preted as evidence for similarity in diet, differences do indicate distinct feedingpatterns and trophic segregation. Together with conventional dietary approaches,stable isotope analysis should become a routine tool for characterizing diet and howthis might vary in space and time (Hobson et al. 1994).
ACKNOWLEDGMENTS
We acknowledge the support given by the Fondo Mexicano para la Conservacion y la Nat-uraleza for a research cruise, Africam Safari, Puebla Mexico, for providing the assistance withanesthesia and equipment, Francisco Garcıa-Rodrıguez for his help with the identification ofotoliths and Juan Fuentes for his assistance in the sample preparation and lipid extraction.Special thanks to Anthony J. Orr who provided useful comments on an early draft and to threereviewers for constructive comments. This research was funded by grants from UC-MEXUS-CONACYT (2004) and SEP-CONACYT 2004-C01-46086. All sampling was done underpermits No. SGPA/DGVS. – 0575 from the Direccion General de Vida Silvestre de la SEMER-NAT for the project “Evaluacion de la interaccion de las pesquerıas y el lobo marino Zalophuscalifornianus y la estructura del complejo Leptospira interrogans en las Colonias reproductoras delGolfo de California,” supported by Consejo Nacional de Ciencia y Tecnologıa-SEMARNAT(1230).
LITERATURE CITED
AGUıNIGA-GARCıA, S. 1999. Geoquımica de la cuenca estuarina del Rıo Colorado: �15N, �13Cy biomarcadores lipıdicos en sedimentos superficiales. Tesis de Doctorado, UniversidadAutonoma de Baja California, Ensenada, Baja California, Mexico.
ALTABET, M. A., C. PILSKALN, R. THUNELL, C. PRIDE, D. SIGMAN, F. CHAVEZ AND R.FRANCOIS. 1999. The nitrogen isotope biogeochemistry of sinking particles from themargin of the Eastern North Pacific. Deep-Sea Research I 46:655–679.
ALVAREZ-BORREGO, S. 1983. The Gulf of California. Pages 427–449 in B. H. KETCHUM, ed.Ecosystems of the world: Estuaries and enclosed seas. Elsevier Scientific Publishing Co.,Amsterdam, The Netherlands.
ANTONELIS, G. A., S. B. STEWART AND W. F. PERRYMAN. 1990. Foraging characteristics offemale northern fur seals (Callorhinus ursinus) and California sea lions (Zalophus californi-anus). Canadian Journal of Zoology 68:150–158.
AURIOLES-GAMBOA, D., AND J. F. CAMACHO-RıOS. 2007. Diet and feeding overlap of twootariids, Zalophus californianus and Arctocephalus townsendi: Implications to survive envi-ronmental uncertainty. Aquatic Mammals 33:315–326.
AURIOLES-GAMBOA, D., AND A. ZAVALA-GONZALEZ. 1994. Algunos factores ecologicos quedeterminan la distribucion y abundancia del lobo marino Zalophus californianus, en elGolfo de California. Ciencias Marinas 20:535–553.

PORRAS-PETERS ET AL.: CALIFORNIA SEA LIONS 569
AURIOLES-GAMBOA, D., C. FOX, F. SINSEL AND T. GRAYEB. 1984. Prey of the California sealion (Zalophus californianus) in La Paz B.C.S., Mexico. Journal of Mammalogy 65:519–521.
AURIOLES-GAMBOA, D., P. L. KOCH AND B. J. LE BOEUF. 2006. Differences in foraginglocation of Mexican and California elephant seals: Evidence from stable isotopes in pups.Marine Mammal Science 22:326–338.
BLIGH, E. S., AND W. J. DYER. 1959. A rapid method of total lipid extraction and purification.Canadian Journal of Biochemistry and Physiology 37:911–917.
BOWEN, W. D. 2000. Reconstruction of pinnipeds diets: Accounting for complete digestionof otoliths and cephalopod beaks. Canadian Journal of Fisheries and Aquatic Sciences57:898–905.
BOYD, I. L., J. N. LUNN, P. ROTHERY AND J. P. CROXALL. 1990. Age distribution of breedingfemale Antarctic fur seals in relation to changes in population growth rate. CanadianJournal of Zoology 68:2209–2213.
BRADSHAW, C. J. A., M. A. HINDELL, N. J. BEST, K. L. PHILLIPS, G. WILSON AND P. D.NICHOLS. 2003. You are what you eat: Describing the foraging ecology of southernelephant seals (Mirounga leonina) using blubber fatty acids. Proceedings of the RoyalSociety B 270:1283–1292.
CHRISTENSEN, V., AND D. PAULY. 1992. ECOPATH II—a software for balancing steady-state ecosystem models and calculating network characteristics. Ecological Modelling61:169–185.
CLUTTON-BROCK, T. H. 1989. Female transfer and inbreeding avoidance in social mammals.Nature 337:70–72.
COTTRELL, P. E., A. W. TRITES AND E. H. MILLER. 1996. Assessing the use of hard parts infaeces to identify harbour seal prey: Results of captive-feeding trials. Canadian Journalof Zoology 74:875–880.
CROXALL, J. P., AND L. HIBY. 1983. Fecundity, survival and site fidelity in Weddell seals,Leptonychotes weddelli. Journal of Applied Ecology 20:19–32.
DALERUM, F., AND A. ANGERBJORN. 2005. Resolving temporal variation in vertebrate dietsusing naturally occurring stable isotopes. Oecologia 144:647–658.
DA SILVA, J., AND J. NEILSON. 1985. Limitations of using otoliths recovered in scats toestimate prey consumption in seals. Canadian Journal of Fisheries and Aquatic Sciences42:1439–1442.
DELLINGER, T., AND F. TRILLMICH. 1988. Estimating diet composition from scat analy-sis in otariid seals (Otariidae): Is it reliable? Canadian Journal of Zoology 66:1865–1870.
DELLINGER, T., AND F. TRILLMICH. 1999. Fish prey of the sympatric Galapagos fur sealsand sea lions: Seasonal variation and niche separation. Canadian Journal of Zoology77:1204—1216.
DURAN-LIZARRAGA, M. E. 1998. Caracterizacion de los patrones de buceos de alimentacionde lobo marino Zalophus californianus y su relacion con variables ambientales en la Bahıade La Paz, B.C.S. Tesis de Maestrıa, CICIMAR-IPN, La Paz, Baja California Sur, Mexico.
EVERITT, R. D., P. J. GEARIN, J. S. SKIDMORE AND R. L. DELONG. 1981. Prey items of harborseals and California sea lions in Puget Sound, Washington. Murrelet 62:83–86.
ESTES, J. A., M. L. RIEDMAN, M. M. STAEDLER, M. T. TINKER AND B. E. LYON. 2003.Individual variation in prey selection by sea otters: Patterns, causes and implications.Journal of Animal Ecology 72:144–155.
FERRY, L. A., AND G. M. CAILLIET. 1996. Sample size and data analysis: Are we characterizingand comparing diet properly? Pages 71–80 in D. MacKinlay and K. Shearer, eds. Pro-ceedings of the symposium on the feeding ecology and nutrition in fish. InternationalCongress on the Biology of Fishes, American Fisheries Society, Bethesda, MD.
FERRY, L. A., S. L. CLARK AND G. M. CAILLIET. 1997. Food habits of spotted sand bass(Paralabrax maculatofasciatus, Serranidae) from Bahia de Los Angeles, Baja California.Bulletin of the Southern California Academy of Sciences 96:1–21.

570 MARINE MAMMAL SCIENCE, VOL. 24, NO. 3, 2008
FITCH, J. E., AND R. L. BROWNELL. 1968. Fish otoliths in Cetacean stomachs and their im-portance in interpreting feeding habits. Journal of the Fisheries Research Board Canada25:2561–2574.
FORD, J. K. B., G. M. ELLIS, L. G. BARRETT-LENNARD, A. B. MORTON, R. S. PALM ANDK. C. BALCOMB III. 1999. Dietary specialization in two sympatric populations of killerwhales (Orcinus orca) in coastal British Columbia and adjacent waters. Canadian Journalof Zoology 76:1456–1471.
FRANCE, R. L. 1995. Carbon-13 enrichment in benthic compared to planktonic algae: Food-web implications. Marine Ecology Progress Series 124:307–312.
FROESE, R., AND D. PAULY, eds. 2003. Fishbase. World Wide Web electronic publication.Available from http://www.fishbase.org.
GARCıA-RODRıGUEZ, F. J., AND D. AURIOLES-GAMBOA. 2004. Spatial and temporal variationin the diet of the California sea lion (Zalophus californianus) in the Gulf of California,Mexico. Fishery Bulletin 102:47–62.
GENTRY, R. L. 1998. Behavior and ecology of the northern fur seal. Princeton UniversityPress, Princeton, NJ.
GILMARTIN, W. G., L. L. EBERHARDT AND T. C. JOHANOS. 1993. Survival rates for theHawaiian monk seal (Monachus schauinslandi). Marine Mammal Science 9:407–420.
GREEN, K., R. WILLIAMS, K. A. HANDASYDE, H. R. BURTON AND P. D. SHAUGHNESSY. 1990.Interspecific and intraspecific differences in the diets of fur seals, Arctocephalus species(Pinnipedia: Otariidae), at Macquarie Island. Australian Mammalogy 13:193–200.
GREENWOOD, P. J. 1983. Mating systems and the evolutionary consequences of dispersal.Pages 116–131 in I. R. Swingland and P. J. Greenwood, eds. The ecology of animalmovement. Clarendon, Oxford, UK.
GUTIERREZ, O. M. 2003. Censos y habitos alimenticios del lobo marino de California (Zalophuscalifornianus californianus) en la lobera “El Farallon de San Ignacio,” Sinaloa, Mexico. Tesisde Licenciatura, Universidad de Occidente, Los Mochis, Sinaloa, Mexico.
HERNANDEZ-CAMACHO, C. J. 2001. Tabla de vida del lobo marino de California Zalophuscalifornianus californianus en la lobera Los Islotes, B.C.S., Mexico. Tesis de Maestrıa,CICIMAR-IPN, La Paz, Baja California Sur, Mexico.
HILDERBRAND, G. V., S. D. FARLEY, C. T. ROBBINS, T. A. HANLEY, K. TITUS AND C.SERVHEEN. 1996. Use of stable isotopes to determine diets of living and extinct bears.Canadian Journal of Zoology 74:2080–2088.
HOBSON, K. A., F. J. PIATT AND J. PITOCCHELLI. 1994. Using stable isotopes to determineseabird trophic relationships. Journal of Animal Ecology 63:786–798.
HOBSON, K. A., M. D. SCHELL, D. RENOUF AND E. NOSEWORTHY. 1996. Stable carbon andnitrogen isotopic fractionation between diet and tissues of captive seals: Implications fordietary reconstructions involving marine mammals. Canadian Journal of Fisheries andAquatic Sciences 53:528–533.
HOLST, M., I. STIRLING AND K. A. HOBSON. 2001. Diet of ringed seals (Phoca hispida) on theeast and west sides of the North Water Polynya, Northern Baffin Bay. Marine MammalScience 17:888–908.
JENKINS, S. G., S. T. PARTRIDGE, T. R. STEPHENSON, S. D. FARLEY AND C. T. ROBBINS.2001. Nitrogen and carbon isotope fractionation between mothers, neonates, and nursingoffspring. Oecologia 129:336–341.
KELLY, J. F. 2000. Stable isotopes of carbon and nitrogen in the study of avian and mammaliantrophic ecology. Canadian Journal of Zoology 78:1–27.
KREBS, C. J. 1999. Ecological methodology. Addison-Wesley Longman Educational Publish-ers, Upper Saddle River, NJ.
KUHN, C. E. 2006. Measuring at-sea feeding to understand the foraging behavior of pinnipeds.Ph.D. thesis, University of California, Santa Cruz, CA. 129 pp.
LANGTON, R. W. 1982. Diet overlap between the Atlantic cod Gadus morhua, silver hakeMerluccius bilinearis and fifteen other northwest Atlantic finfish. Fishery Bulletin 80:745–759.

PORRAS-PETERS ET AL.: CALIFORNIA SEA LIONS 571
LESAGE, V., O. M. HAMMILL AND M. K. KOVACS. 2002. Diet-tissue fractionation of sta-ble carbon and nitrogen isotopes in phocid seals. Marine Mammal Science 18:182–193.
LUNN, N. J., AND L. I. BOYD. 1991. Pupping-site fidelity of Antarctic fur seals at Bird Island,South Georgia. Journal of Mammalogy 72:202–206.
MARKAIDA, U., AND O. SOSA-NISHIZAKI. 2003. Food and feeding habits of jumbo squidDosidicus gigas (Cephalopoda: Ommastrephidae) from the Gulf of California, Mex-ico. Journal of the Marine Biological Association of the United Kingdom 83:507–522.
MCCONNAUGHEY, T., AND C. P. MCROY. 1979. Food web structure and fractionation ofcarbon isotopes in the Bering Sea. Marine Biology 53:262–275.
NEWSOME, S. D., M. A. ETNIER, D. AURIOLES-GAMBOA AND P. L. KOCH. 2006. Using carbonand nitrogen isotopes to investigate reproductive strategies in Northeast Pacific otariids.Marine Mammal Science 22:556–572.
ORR, A. J., AND J. T. HARVEY. 2001. Quantifying errors associated with using fecal samplesto determine the diet of the California sea lion (Zalophus californianus). Canadian Journalof Zoology 79:1080–1087.
ORTA-DAVILA, F. 1988. Habitos alimentarios y censos globales del lobo marino (Zalophuscalifornianus) en el Islote El Racito, Bahıa de las Animas, Baja California, Mexico, duranteoctubre 1986–1987. Tesis de Licenciatura, Universidad Autonoma de Baja California,Ensenada, Baja California, Mexico.
OWENS, P. J. N. 1987. Natural variations in 15N in the marine environment. Advances inMarine Biology 24:389–451.
PASSARELLA, K. C., AND T. L. HOPKINS. 1991. Species composition and food habits of themicronektonic cephalopod assemblage in the eastern Gulf of Mexico. Bulletin of MarineScience 49:638–659.
PAULY, D., A. W. TRITES, E. CAPULI AND V. CHRISTENSEN. 1998. Diet composition andtrophic levels of marine mammals. ICES Journal of Marine Science 55:467–481.
PETERSON, R. S., AND G. A. BARTHOLOMEW. 1967. The natural history and behavior of theCalifornia sea lion. American Society of Mammalogists Special Publication 1:79.
PIERCE, G. J., AND P. R. BOYLE. 1991. A review of methods for diet analysis in piscivo-rous marine mammals. Oceanography and Marine Biolology Annual Review 29:409–486.
POLISCHUK, S. C., K. A. HOBSON AND M. A. RAMSAY. 2001. Use of stable-carbon andnitrogen isotopes to assess weaning and fasting in female polar bears and their cubs.Canadian Journal of Zoology 79:499–511.
RAU, G. H., A. J. MEARNS, D. R. YOUNG, R. J. OLSON, H. A. SCHAFER AND I. R. KA-PLAN. 1983. Animal 13C/12C correlates with trophic level in pelagic food webs. Ecology64:1314–1318.
REITER, J., K. J. PANKEN AND B. J. LE BOEUF. 1981. Female competition and reproductivesuccess in northern elephant seals. Animal Behaviour 29:670–687.
SANCHEZ-ARIAS, M. 1992. Contribucion al conocimiento de los habitos alimentarios del lobomarino de California Zalophus californianus en las Islas Angel de la Guarda y Granito,Golfo de California, Mexico. Tesis de Licenciatura, Universidad Nacional Autonoma deMexico, Ciudad Universitaria, Mexico.
SANTAMARıA DEL ANGEL, E., AND S. ALVAREZ-BORREGO. 1994. Gulf of California biogeo-graphic regions based on coastal zone color scanner imagery. Journal of GeophysicalResearch 99:7411–7421.
SCHOENINGER, M. J., AND M. J. DENIRO. 1984. Nitrogen and carbon isotopic compositionof bone collagen from marine and terrestrial animals. Geochimica Cosmochimica Acta48:625–639.
TIESZEN, L. L., T. W. BOUTTON, K. G. TESDAHL AND N. A. SLADE. 1983. Fractionation andturnover of stable carbon isotopes in animal tissues: Implications for �13C analysis ofdiet. Oecologia 57:32–37.

572 MARINE MAMMAL SCIENCE, VOL. 24, NO. 3, 2008
TOLLIT, D. J., M. J. STEWARD, P. M. THOMPSON, G. J. PIERCE, M. B. SANTOS AND S. HUGHES.1997. Species and size differences in the digestion of otoliths and beaks: Implicationsfor estimates of pinniped diet composition. Canadian Journal of Fisheries and AquaticSciences 54:105–119.
YOCHEM, P. K., B. S. STEWART, R. L. DELONG AND D. P. DEMASTER. 1987. Diel hauloutpatterns and site fidelity of harbor seals (Phoca vitulina richardsi) on San Miguel Island,California, in autumn. Marine Mammal Science 3:323–332.
Received: 27 September 2006Accepted: 19 December 2007

PORRAS-PETERS ET AL.: CALIFORNIA SEA LIONS 573
Appendix I. The �15N and �13C values (mean ± SD, in ‰) in fur of California sea lionpups and adult females collected during different seasons at different rookeries in the Gulf ofCalifornia.
Site Sampling date Age class n �15N �13C
Summer 2000Islotes 16–25 July Pups 10 20.9 ± 0.6 −15.2 ± 0.5Martir 16–25 July Pups 10 20.5 ± 0.4 −14.3 ± 0.2Esteban 16–25 July Pups 8 20.6 ± 0.2 −14.4 ± 0.5Partido 16–25 July Pups 11 20.4 ± 0.5 −14.5 ± 0.4Machos 16–25 July Pups 10 20.1 ± 0.3 −14.6 ± 0.1Cantiles 16–25 July Pups 12 21.6 ± 0.4 −15.4 ± 0.2Granito 16–25 July Pups 9 21.6 ± 0.3 −15.1 ± 0.4
Summer 2002Islotes 15 July Pups 10 21.5 ± 0.3 −15.4 ± 0.3Ignacio 16 July Pups 10 21.6 ± 0.2 −14.2 ± 0.5Nolasco 18 July Pups 10 21.3 ± 0.4 −14.0 ± 0.2Martir 19 July Pups 10 20.6 ± 0.4 −14.4 ± 0.5Esteban 20 July Pups 10 20.8 ± 0.5 −14.5 ± 0.5Rasito 21 July Pups 10 20.2 ± 0.4 −14.6 ± 0.2Partido 22 July Pups 10 20.7 ± 0.5 −14.0 ± 0.4Cantiles 23 July Pups 9 21.3 ± 0.6 −15.3 ± 0.5Granito 23 July Pups 10 21.3 ± 0.5 −14.7 ± 0.3Lobos 24 July Pups 10 21.5 ± 0.3 −14.8 ± 0.4Consag 26 July Pups 9 22.4 ± 0.5 −14.1 ± 0.5
Spring 2003Islotes April Adult females 8 19.4 ± 0.2 −14.6 ± 0.1
Summer 2004Jorge 18 July Pups 10 21.1 ± 0.7 −14.1 ± 0.4
Total 196
Appendix II. Number of scats collected, number of scats with identifiable hard parts ofpreys, and number of otoliths and cephalopod beaks recovered from scats of 11 sea lion rookeriesduring the breeding season of 2002. S = species richness; TL = trophic level.
Sampling Scats with preySite date Scats hard parts Otoliths Beaks S TL
Islotes 9–30 July 22 17 182 21 14 3.93Ignacio 6 and 16 July 30 23 42 4 18 4.04Nolasco 18 July 20 16 75 20 15 3.59Martir 19 July 13 11 26 31 15 3.43Esteban 20 July 17 5 11 — 5 4.39Rasito 21 July 36 21 140 2 14 3.54Partido 22 July 46 29 178 — 15 3.66Cantiles 23 July 16 3 17 — 3 4.95Granito 23 July 14 — — — — —Lobos 24 July 19 9 50 — 6 3.99Consag 26 July 41 21 81 6 5 4.07
Total/Average 274 155 802 84 3.95

574 MARINE MAMMAL SCIENCE, VOL. 24, NO. 3, 2008
App
endi
xII
I.In
dex
ofim
port
ance
(IIM
P)v
alue
sofC
alif
orni
ase
ali
onpr
eyid
enti
fied
from
scat
sam
ples
coll
ecte
dat
diff
eren
troo
keri
esin
the
Gul
fofC
alif
orni
adu
ring
the
bree
ding
seas
onof
2002
.“—
”in
dica
tes
that
the
spec
ies
was
not
reco
rded
inth
edi
et.T
L=
trop
hic
leve
l.
Pre
yC
omm
onA
vera
geFa
mil
ysp
ecie
sna
me
TL
Islo
tes
Igna
cio
Nol
asco
Mar
tir
Est
eban
Ras
ito
Par
tido
Can
tile
sLo
bos
Con
sag
IIM
P
Fish
Arg
enti
nida
eA
rgen
tina
sial
isN
orth
Pac
ific
arge
ntin
e3.
1-
--
8.25
-2.
38-
--
-1.
06
Aul
opid
aeA
ulop
usba
jaca
liE
aste
rnP
acifi
cfla
gfin
3.07
8.11
--
--
--
--
-0.
81
Bat
rach
oidi
dae
Por
icht
hyss
pp.
mid
ship
man
3.71
6.72
10.6
52.
57-
-22
.54
0.66
36.1
144
.44
-12
.37
Car
angi
dae
Sela
rcr
umen
oph-
thal
mus
bige
yesc
ad4.
10.
595.
56-
--
-1.
15-
--
0.73
Trac
huru
ssy
mm
etri
cus
Pac
ific
jack
mac
kere
l3.
56-
-2.
451.
1420
23.3
69.
20-
--
5.61
Clu
peid
aeSa
rdin
opss
agax
Pac
ific
sard
ine
2.43
2.97
--
2.27
-10
.09
39.4
2-
--
5.47
Cyn
oglo
ssid
aeSy
mph
urus
spp.
—–
3.28
--
--
--
0.66
--
8.21
0.89
Eng
raul
idae
Cet
engr
auli
sm
ysti
cetu
sP
acifi
can
chov
eta
2.67
--
18.7
59.
09-
--
-28
.70
61.2
311
.78
Eng
raul
ism
or-
dax
nort
hern
anch
ovy
2.96
15.2
91.
119.
61-
-7.
1420
.29
--
-5.
35
Gob
iida
eB
ollm
ania
spp.
goby
3.22
--
--
--
--
5.56
-0.
56H
aem
ulid
aeA
niso
trem
usda
vids
onii
xant
icsa
rgo
3.54
-3.
24-
--
--
--
-0.
32
Hae
mul
onsp
p.gr
unt
3.3
--
--
--
10.5
1-
--
1.05
Hae
mul
opsi
sle
ucis
cus
whi
tegr
unt
3.03
--
10.6
3-
20-
--
2.78
-3.
34
Labr
idae
Bod
ianu
sdi
plot
aeni
aM
exic
anho
gfish
3.44
0.24
--
0.70
--
--
--
0.09
Mac
rour
idae
Cae
lori
nchu
ssc
apho
psis
shou
lder
spot
gren
adie
r3.
07-
--
1.40
--
--
--
0.14
Con
tinu
ed.

PORRAS-PETERS ET AL.: CALIFORNIA SEA LIONS 575
App
endi
xII
I.C
onti
nued
Pre
yC
omm
onA
vera
geFa
mil
ysp
ecie
sna
me
TL
Islo
tes
Igna
cio
Nol
asco
Mar
tir
Est
eban
Ras
ito
Par
tido
Can
tile
sLo
bos
Con
sag
IIM
P
Mal
acan
thid
aeC
aulo
lati
lus
prin
ceps
Oce
an whi
tefis
h3.
013.
59-
--
--
--
--
0.36
Mer
lucc
iida
eM
erlu
cciu
san
gust
iman
usP
anam
aha
ke3.
44-
-6.
25-
357.
30-
--
-4.
86
Mer
lucc
ius
prod
uctu
sN
orth
Pac
ific
hake
4.35
--
3.31
--
--
--
-0.
33
Mor
idae
Phy
sicu
lus
nem
atop
usch
arco
alm
ora
3.4
-6.
94-
0.70
-3.
06-
--
-1.
07
Myc
toph
idae
Myc
toph
idae
no.1
lant
ernfi
sh3.
01-
-6.
512.
2718
.33
3.81
0.16
-11
.11
-4.
22
Oph
idii
dae
Bro
tula
spp.
brot
ula
—–
-2.
78-
--
--
--
-0.
28C
hila
ria
tayl
ori
spot
ted
cusk
-eel
4.07
--
--
--
0.33
--
-0.
03
Lep
ophi
dium
pror
ates
prow
spin
ecu
skee
l3.
15-
--
--
--
-7.
41-
0.74
Oph
idii
dae
no.1
cusk
eel
3.51
-6.
48-
--
-0.
49-
--
0.70
Par
alic
hthy
idae
Cit
hari
chth
ysst
igm
aeus
spec
kled
sand
dab
3.69
--
-3.
22-
-1.
8130
.56
--
3.56
Par
alic
hthy
sca
lifo
rnic
usC
alif
orni
aflo
unde
r4.
5-
5.56
--
--
--
--
0.56
Scia
enid
aeC
ynos
cion
parv
ipin
nis
shor
tfin
wea
kfish
4.5
-12
.96
--
--
--
1.30
Ron
cado
rst
earn
sii
spot
fincr
oake
r3.
31-
5.09
--
--
--
--
0.51
Scia
enid
aeno
.1—
–—
–-
4.56
--
--
--
--
0.45
Scom
brid
aeSc
ombe
rja
poni
cus
chub m
acke
rel
3.09
--
0.69
--
5.44
13.8
5-
--
2.00
Scor
paen
idae
Pon
tinu
sfu
rcir
hinu
sre
dsc
orpi
-on
fish
3.34
-5.
56-
--
--
--
-0.
56
Con
tinu
ed.

576 MARINE MAMMAL SCIENCE, VOL. 24, NO. 3, 2008
App
endi
xII
I.C
onti
nued
Pre
yC
omm
onA
vera
geFa
mil
ysp
ecie
sna
me
TL
Islo
tes
Igna
cio
Nol
asco
Mar
tir
Est
eban
Ras
ito
Par
tido
Can
tile
sLo
bos
Con
sag
IIM
P
Scor
paen
idae
no.1
—–
—–
--
--
-2.
38-
--
-0.
24
Seba
stid
aeSe
bast
esex
sul
bucc
anee
rro
ckfis
h3.
08-
--
1.40
--
--
--
0.14
Seba
stes
mac
dona
ldi
Mex
ican
rock
fish
3.11
--
-4.
55-
--
--
-0.
45
Serr
anid
aeD
iple
ctru
mpa
cific
umin
shor
esa
ndpe
rch
3.99
-8.
33-
--
--
--
-0.
83
Hem
anth
ias
peru
anus
spli
ttai
lbas
s2.
660.
59-
--
--
--
--
0.06
Pro
noto
gram
mus
eos
bige
yeba
ss3.
045.
881.
39-
--
--
--
-0.
73
Pro
noto
gram
mus
mul
tifa
scia
tus
thre
adfin
bass
3.1
4.85
-4.
382.
27-
4.76
--
--
1.63
Serr
anid
aeno
.1—
–—
–-
--
--
-1.
15-
--
0.11
Serr
anus
aequ
iden
sde
epw
ater
serr
ano
3.33
20.8
2-
--
--
--
--
2.08
Syno
dont
idae
Syno
duss
pp.
liza
rdfis
h4.
5311
.51
4.17
--
6.67
-0.
16-
--
2.39
Tric
hiur
idae
Tric
hiur
usle
ptur
usla
rgeh
ead
hair
tail
4.45
--
--
--
-33
.33
-13
.89
4.72
Cep
halo
pods
All
opos
idae
Hal
iphr
onat
lant
icus
Seve
n-ar
moc
topu
s3.
2-
--
--
4.76
--
--
0.48
Cra
nchi
idae
Lea
chia
spp.
squi
d3.
2-
-16
.25
60.3
4-
--
--
-7.
66E
nopl
oteu
thid
aeA
bral
iops
isaf
finis
squi
d3.
218
.18
-11
.10
1.27
--
--
--
3.06
Loli
gini
dae
Lol
ligu
ncul
asp
p.sq
uid
3.2
--
--
--
--
-14
.29
1.43
Oct
opod
idae
Oct
opus
spp.
octo
pus
—–
-4.
44-
--
--
--
-0.
44