tribological study of high performance bio-lubricants
TRANSCRIPT
Rochester Institute of Technology Rochester Institute of Technology
RIT Scholar Works RIT Scholar Works
Theses
5-5-2016
Tribological Study of High Performance Bio-Lubricants Enhanced Tribological Study of High Performance Bio-Lubricants Enhanced
with Ionic Liquids for Use in Wind Turbines with Ionic Liquids for Use in Wind Turbines
Edward Cigno [email protected]
Follow this and additional works at: https://scholarworks.rit.edu/theses
Recommended Citation Recommended Citation Cigno, Edward, "Tribological Study of High Performance Bio-Lubricants Enhanced with Ionic Liquids for Use in Wind Turbines" (2016). Thesis. Rochester Institute of Technology. Accessed from
This Thesis is brought to you for free and open access by RIT Scholar Works. It has been accepted for inclusion in Theses by an authorized administrator of RIT Scholar Works. For more information, please contact [email protected].
i
ROCHESTER INSTITUTE OF TECHNOLOGY
Tribological Study of High Performance Bio-Lubricants Enhanced
with Ionic Liquids for Use in Wind Turbines
Submitted by,
Edward Cigno
A Thesis Submitted in Partial Fulfillment of the Requirements for Master of Science
in Mechanical Engineering
Department of Mechanical Engineering
Kate Gleason College of Engineering
Approved by:
Dr. Patricia Iglesias -----------------------------------------------------
Department of Mechanical Engineering (Advisor)
Dr. Rui Liu -----------------------------------------------------
Department of Mechanical Engineering (Committee Member)
Dr. Michael Haselkorn -----------------------------------------------------
Golisano Institute for Sustainability (Committee Member)
Dr. Agamemnon Crassidis -----------------------------------------------------
Department of Mechanical Engineering (Department Representative)
Rochester Institute of Technology
Rochester, New York
5/5/2016
ii
Abstract
Wind power is one of the fastest growing power sources worldwide. Large installations of wind power
generation are prominent in Asia, Europe and the United States. The gear boxes and bearings of large wind
turbines continue to be huge liabilities and fail well short of their 20 year design life. These mechanical
failures impose long and expensive repairs. The reliability of wind turbine drive systems may be improved
through advances in lubrication. Furthermore, increasing environmental regulations and public policy have
ushered in the need for development and implementation of environmentally friendly lubricants. Over the
past decade, ionic liquids have emerged as high performance fluids and lubricant additives due to their
unique characteristics. Ionic liquids have the ability to form stable ordered layers in liquid state and have
been shown to have the potential to be used as high-performance lubricants; however, most of the ionic
liquids currently used in lubrication are composed of halogen-containing anions. It is well known that these
anions will decompose in presence of water, liberating highly toxic and corrosive species. There is an
urgent need to design halogen-free and hydrolytically stable ionic liquids to avoid this negative effect. In
this study, the tribological behavior of two phosphonium-based ionic liquids, is investigated as additives of
a commercially available bio-oil in steel-steel contact. One of the ionic liquids is halogen-free and will be
compared to an ionic liquid that contains halogens. Bio-oil and ionic liquid mixtures containing 0.5 ,1 and
2.5 wt.% of both ionic liquids are studied using a pin on disk tribometer and compared to a commercially
available, fully formulated lubricant over a range of three speeds. Results showed, that under the fastest
speed tested, At the optimal concentration of 1% [THTDP][NTf2], a wear reduction of 74% was achieved
with respect to the base Biotelex. A 66% reduction was observed with respect to the Mobilgear. Similarly,
the optimal concentration of 2.5% [THTDP][Phos] displayed a 68% wear reduction compared to the base
Biotelex and a 58% reduction compared to the Mobilgear.
iii
Acknowledgements
I would like to thank all those involved with my research for their help, support and good times. I
especially would like to thank Dr. Patricia Iglesias for the opportunity to work under her guidance. There
have been a lot of tough and uncertain times throughout the past year. I am grateful to Dr. Iglesias for
providing motivation and encouragement throughout the whole process. Her confidence and trust in me
inspires me to do my best.
I would also like to thank my thesis committee of Dr. Rui Liu, Dr. Michael Haselkorn,
and Dr. Agamemnon Crassidis for evaluating my research. A special thanks goes out to Mr. Robert Kraynik
and Mr. Jan Maneti for their help with the fabrication of my experimental set up and sample preparation.
They taught me a lot about precision machining and assembly. I couldn’t have done it without them.
Thanks to my fellow graduate students Karthik Janardhanan and Paarth Mehta for your help and
the good times in the lab.
Edward Cigno
iv
Contents ABSTRACT ................................................................................................................................................................II
ACKNOWLEDGEMENTS ..................................................................................................................................... III
LIST OF FIGURES .................................................................................................................................................... V
LIST OF TABLES .................................................................................................................................................... VI
1 INTRODUCTION .................................................................................................................................................... 1
2 THE RESEARCH QUESTION ............................................................................................................................... 2
3 LITERATURE REVIEW ........................................................................................................................................ 3
3.1 WIND TURBINE MARKET AND FAILURE STATISTICS ............................................................................................ 3 3.1.1 Wind Power Growth and Market Projections .............................................................................................. 3 3.1.2 Wind Turbine Failures and Maintenance .................................................................................................... 4
3.2 TRIBOLOGY PROBLEMS IN WIND TURBINE GEAR BOXES ..................................................................................... 5 3.2.1 Bearing and Gear Box Failure Modes ......................................................................................................... 5
3.2.1.1 Lubrication Failure ................................................................................................................................................. 7 3.2.1.1.1 Operating Temperature Range ........................................................................................................................ 7 3.2.1.1.2 Vibration ......................................................................................................................................................... 7 3.2.1.1.3 Contamination ................................................................................................................................................ 8
3.3 IONIC LIQUIDS ...................................................................................................................................................... 9 3.3.1 Properties of Ionic Liquids .......................................................................................................................... 9
3.3.1.1 Low Vapor Pressure ............................................................................................................................................... 9 3.3.1.2 Thermal Stability .................................................................................................................................................. 10 3.3.1.3 Miscibility ............................................................................................................................................................ 10 3.3.1.4 Toxicology ........................................................................................................................................................... 10
3.3.2 Potential Applications of Ionic Liquids ...................................................................................................... 10 3.3.2.1 Solvent Applications ............................................................................................................................................ 11 3.3.2.2 Applications in Catalysis ...................................................................................................................................... 12 3.3.2.3 Electrochemical Applications ............................................................................................................................... 12 3.3.2.4 Thermofluid and Heat Transfer Applications ....................................................................................................... 12
3.3.3 Ionic Liquids in Tribology.......................................................................................................................... 12 3.3.3.1 Ionic Liquids in Lubrication of Light Alloys ........................................................................................................ 13 3.3.3.2 Ionic Liquids in Lubrication of Steel-Steel Contacts ............................................................................................ 14 3.3.3.4 Ionic Liquids in Wind Turbine Applications ........................................................................................................ 14
4 OBJECTIVES OF THE PROPOSED WORK .................................................................................................... 16
5 PRELIMINARY WORK ....................................................................................................................................... 17
6 EXPERIMENTAL WORK .................................................................................................................................... 18
6.1 FRICTION AND WEAR TESTING ........................................................................................................................... 18 6.1.1 Sample Preparation ................................................................................................................................... 18 6.1.2 Sample Material Properties ....................................................................................................................... 18 6.1.3 Lubricant Properties .................................................................................................................................. 19 6.1.4 Experimental Details ................................................................................................................................. 20
6.2 VISCOSITY TESTING ........................................................................................................................................... 23 6.3 THERMAL STABILITY TESTING ........................................................................................................................... 23 6.4 X-RAY PHOTOELECTRON SPECTROSCOPY TESTING............................................................................................. 23
7 RESULTS AND DISCUSSION ............................................................................................................................. 24
7.1 VISCOSITY .......................................................................................................................................................... 24 ................................................................................................................................................................................. 24 7.2 THERMAL STABILITY ......................................................................................................................................... 25 7.3 FRICTION ............................................................................................................................................................ 26 7.4 WEAR ................................................................................................................................................................. 30
v
7.4.1 Slow Speed ................................................................................................................................................. 30 7.4.1.1 Wear Mechanisms at slow speed .......................................................................................................................... 32
7.4.2 Medium Speed ............................................................................................................................................ 33 7.4.2.1 Wear Mechanisms at Medium speed .................................................................................................................... 34
7.4.3 Fast Speed .................................................................................................................................................. 36 7.4.3.1 Wear Mechanisms ................................................................................................................................................ 38
7.5 SALT WATER CONTAMINATION ......................................................................................................................... 38 7.6 TRIBOCHEMISTRY .............................................................................................................................................. 41
8 CONCLUSIONS ..................................................................................................................................................... 43
8.1 FUTURE RESEARCH ............................................................................................................................................ 44
REFERENCES .......................................................................................................................................................... 45
List of Figures
Figure 1: Cumulative Market forecast by Region 2014-2019 [17] ............................................................ 3 Figure 2: Market Forecast for 2014-2019 [17].......................................................................................... 3 Figure 3: Failure Rate and Downtime from 3 Large Surveys of European Onshore Wind Turbines Over 13
Years [22] ............................................................................................................................................... 4 Figure 4: Cause of Wind Turbine Component Failure [19] ....................................................................... 5 Figure 5: White structure flaking formation driver summary in wind turbine gearboxes and possible
solutions. H=hydrogen [32]. .................................................................................................................... 6 Figure 6: Potential Applications of Ionic Liquids [52] ............................................................................ 11 Figure 7: Ionic Liquid Surface Interaction (Al2O3) [17] .......................................................................... 13 Figure 8: AISI 52100 Test Sample ......................................................................................................... 18 Figure 9: Pin-on-Disk Tribometer .......................................................................................................... 21 Figure 10: ASTM G99 Standard ............................................................................................................ 22 Figure 11: Profile Area .......................................................................................................................... 22 Figure 12: LabVIEW Front Panel .......................................................................................................... 22 Figure 13: LabVIEW Front Panel .......................................................................................................... 22 Figure 14: [THTDP][Phos] Viscosity ..................................................................................................... 24 Figure 15: TGA Analysis ....................................................................................................................... 25 Figure 16: Friction Coefficient vs Time Slow Speed .............................................................................. 26 Figure 17: Friction Summary 0.05 m/s Sliding Velocity ......................................................................... 27 Figure 18: Friction Coefficient vs time Medium Speed .......................................................................... 28 Figure 19: Friction Summary 0.13 m/s Sliding Velocity ......................................................................... 28 Figure 20: Friction Coefficient vs time Fast Speed ................................................................................. 29 Figure 21: Friction Summary 0.26 m/s Sliding Velocity ......................................................................... 29 Figure 22: Coefficient of Friction vs Sliding Velocity ............................................................................ 30 Figure 23: Wear Rate 0.05 m/s .............................................................................................................. 31 Figure 24: Optical Microscope Wear Track Images 0.05 m/s ................................................................. 32 Figure 25: Wear Mechanisms 0.05 m/s .................................................................................................. 32 Figure 26: Wear Rate 0.13 m/s .............................................................................................................. 33 Figure 27: Optical Microscope Wear Track Images 0.13 m/s ................................................................. 34 Figure 28: Wear Mechanisms 0.13 m/s .................................................................................................. 35 Figure 29: Wear Rate 0.26 m/s .............................................................................................................. 36 Figure 30: Wear Rate 0.26 m/s .............................................................................................................. 36
vi
Figure 31: Optical Microscope Wear Track Images 0.26 m/s ................................................................. 37 Figure 32: Wear Mechanisms 0.26 m/s .................................................................................................. 38 Figure 33: Friction Coefficient vs time Fast Speed with Salt Water Contamination ................................ 39 Figure 34: Friction Summary 0.26 m/s Sliding Velocity with Salt Water Contamination ........................ 39 Figure 35: Wear Rate 0.26 m/s with Salt Water Contamination .............................................................. 40 Figure 36: BT + 2.5% [THTDP][Phos] Pre-Etching ............................................................................... 41 Figure 37: BT + 2.5% [THTDP][Phos] Post-Etching ............................................................................. 41 Figure 38: BT + 2.5% [THTDP][Phos] Surface Chemistry Depth Profile ............................................... 42
List of Tables
Table 1: Required Oil Cleanliness for Wind Turbine Gear Boxes [42] ..................................................... 8 Table 2: Water Contamination Problems in Wind Turbine Gearboxes [43] ............................................... 9 Table 3: Common Ionic Liquids in Tribology ........................................................................................ 13 Table 4: Ionic Liquids Used for Wind Turbines Thus Far [72] ............................................................... 15 Table 5: Ionic Liquid Structure and Name ............................................................................................. 16 Table 6: Relevant Steel Properties Used in Experimentation .................................................................. 18 Table 7: AISI Sample Hardness ............................................................................................................. 19 Table 8: Base Lubricant Properties ........................................................................................................ 20 Table 9: Lubricant Viscosity .................................................................................................................. 24 Table 10: TGA Onset Temperature ........................................................................................................ 26 Table 11: Wear Rate Values 0.05 m/s .................................................................................................... 31 Table 12: Wear Rate Values 0.13 m/s .................................................................................................... 34 Table 13: Wear Rate Values 0.26 m/s .................................................................................................... 37 Table 14: Wear Rate Values 0.26 m/s with Salt Water Contamination.................................................... 40
1
1 Introduction
It is estimated that industry losses due to wear is approximately 1-2 % of the GNP (Gross National
Product) of a country [1]. An article published by ASME predicts that this amount could be between $270-
$800 billion in the United States [2]. Better tribological practices have the potential to contrive huge
economic benefits. Between 1998 and 2012, the amount of worldwide research in tribology had tripled [3].
The growing trend can also be seen in BRIC countries (Brazil, Russia, India and China), which showed
between 30% and 60% growth in tribology research between 2006 and 2010 [4]. Economics is a huge
motivator for any type of research. It is estimated that between 1%-1.5% of the GNP could be saved due
to better tribological practices [5,6]. In the United States, it is possible to reduce energy consumption by
11% in the areas of transportation, power generation, and manufacturing by reducing the friction and wear
of mechanical components [6]. However, money is not the only motivator. As engineers, scientists,
researchers and innovators, it is our job to derive solutions with the highest safety and lowest environmental
impact possible. Since industrialization, new policies, technologies and practices have been implemented
to reduce our environmental impact and increase public safety. This consciousness of environmental and
human safety is an ongoing trend and will undoubtedly continue into the future.
A large portion of these energy losses come from the automobile industry. Holmberg et al. [6] state
that about one third of fuel energy of a car is used to overcome friction in the engine. By reducing the
amount of friction and wear in passenger cars alone could save hundreds of millions of euros, millions of
liters of fuel, and tons of CO2 emissions. Another industry subject to large losses due to friction and wear
is the power generation industry. Wind turbines, like vehicles, lose efficiency in the drive train. The gear
boxes are required to increase the speed of the rotor between 5- 30 RPM to the required generator speeds
of about 1000-1500 RPM. Due to the high torque and large gear ratios, these gearboxes commonly fail
within 5 years and need to be overhauled or replaced [4-6]. For off shore wind turbines, these operational
and maintenance cost can be as much as 20%-35% of the power generation cost [8]. Furthermore, a
catastrophic gearbox failure could result in a repair cost of up to 20% of the total turbine cost. The main
causes of these problems are the friction and wear, consequent of contacting surfaces from improper
lubrication as well as a lack of routine maintenance [4-6].
Research and development of new coatings, lubricants, and lubrication practices may greatly
reduce the effects of friction and wear in mechanical components. The implementation of even small
improvements to wear and friction problems can save huge amounts of money, time, and other resources.
Moreover, solutions may reduce environmentally virulent effects. One of these emerging technologies is
2
the replacement of traditional lubricants and lubricant additives, which often contain compounds harmful
to the environment [5,6,10–12] with “greener” and more effective compounds. A promising substitution
is the use of Ionic liquids. Ionic liquids (IL’s) are salts with a melting temperature below the boiling point
of water (100 °C). When melted, they form a liquid comprised entirely of ions. Usually they exist as a
large organic cation paired with a smaller organic or inorganic anion. It has been estimated that the number
of cation- anion combinations could produce up to one trillion (1012) different IL’s. Research on the
chemical and physical properties of these compounds has expanded greatly in the last few years [13–15].
The large number of combinations promotes the implementation of “design-specific” compounds. The
properties of IL’s that make them attractive in lubrication are their high thermal and chemical stability,
negligible vapor pressure and non-flammability, high polarity (miscible with many organic and inorganic
media) and many others. IL’s have the ability to form absorbed ordered layers on material surfaces reducing
friction and wear [11,16,17]. The use of IL’s as a neat lubricant was first reported in 2001 [18]. Since then,
IL’s have shown promise as next generation lubricants [11,19,20] and lubricant additives [21–24]. Many
of the IL’s used in lubricant additive research contain environmentally toxic halogen elements such as
fluorine. IL’s with fluorine in the anion have shown positive results in reducing friction and wear [25–28].
With environmental regulations and consciousness getting stricter, it is imperative to find more
environmentally friendly alternatives. Research is also progressing with the use of halogen-free IL’s in
lubrication. Many studies have shown that halogen free IL’s can also reduce friction and wear
[10,11,29,30].
2 The Research Question
The goal of this Thesis is to derive an environmentally friendly improvement to the reliability issues
affecting wind turbine mechanical systems. This will be done by formulating new lubricant mixtures with
IL’s that protect the mechanical systems from friction and wear better than or equal to than existing gear
oils with a lower environmental impact. The research questions that must be answered are:
Can IL’s outperform existing lubricants when used as additives in a base lubricant?
Is it possible to formulate an effective environmentally friendly lubricant?
Can IL’s be tailored to be additives of lubricants for specific environments/conditions?
What types of wear and tribocorrosive mechanisms are presented on the metal surfaces when IL’s
are introduced as additives?
3
3 Literature Review
3.1 Wind Turbine Market and Failure Statistics
3.1.1 Wind Power Growth and Market Projections
Wind Power is one of the fastest growing power sources worldwide. In 2014, global wind power
investments rose 11% while its cumulative market growth increased 16%. Overall the annual growth was
44% in 2014 [16]. Although 2014 was a great year for wind power, it is expected that the global growth
rate will drop. However, it is still projected that global wind power will grow about 12% each year for the
next 5 years. China alone is expected to implement 200 GW of wind power over the next 5 years to reach
its 2020 targets. It is also expected that a total of 140 GW will be installed in other Asian countries.
Throughout Europe, it is estimated that another 70 GW of wind power will be added in the next 5 years. A
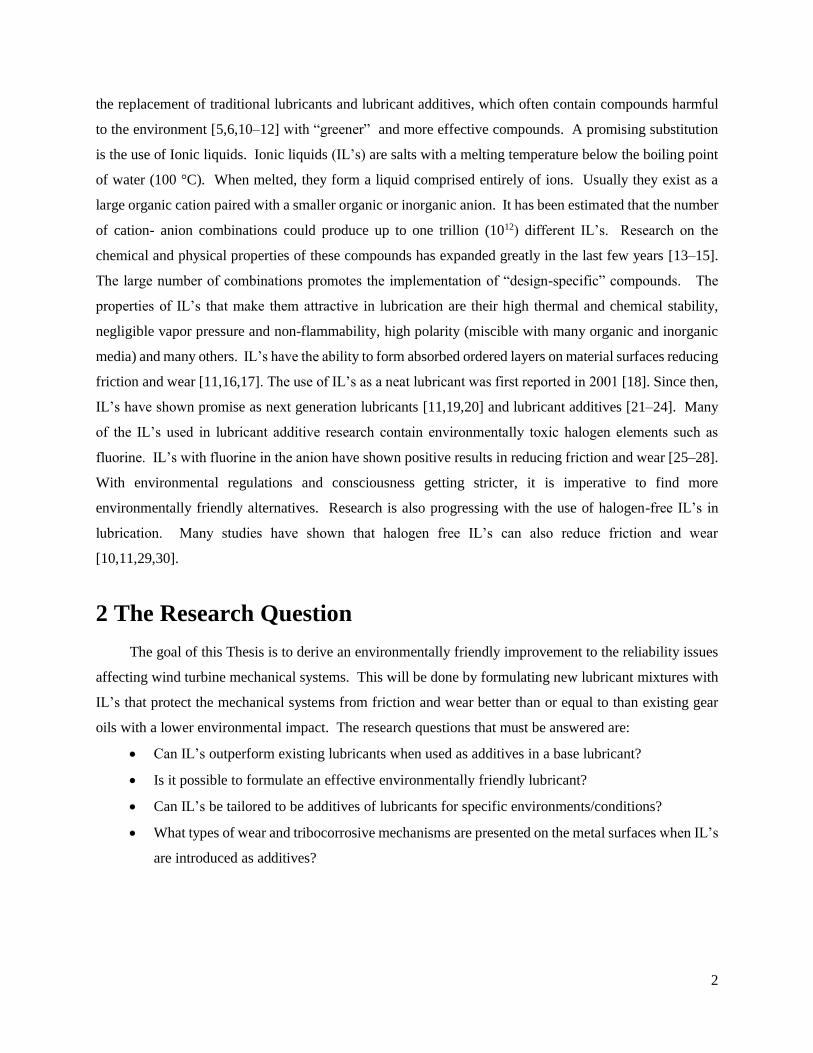
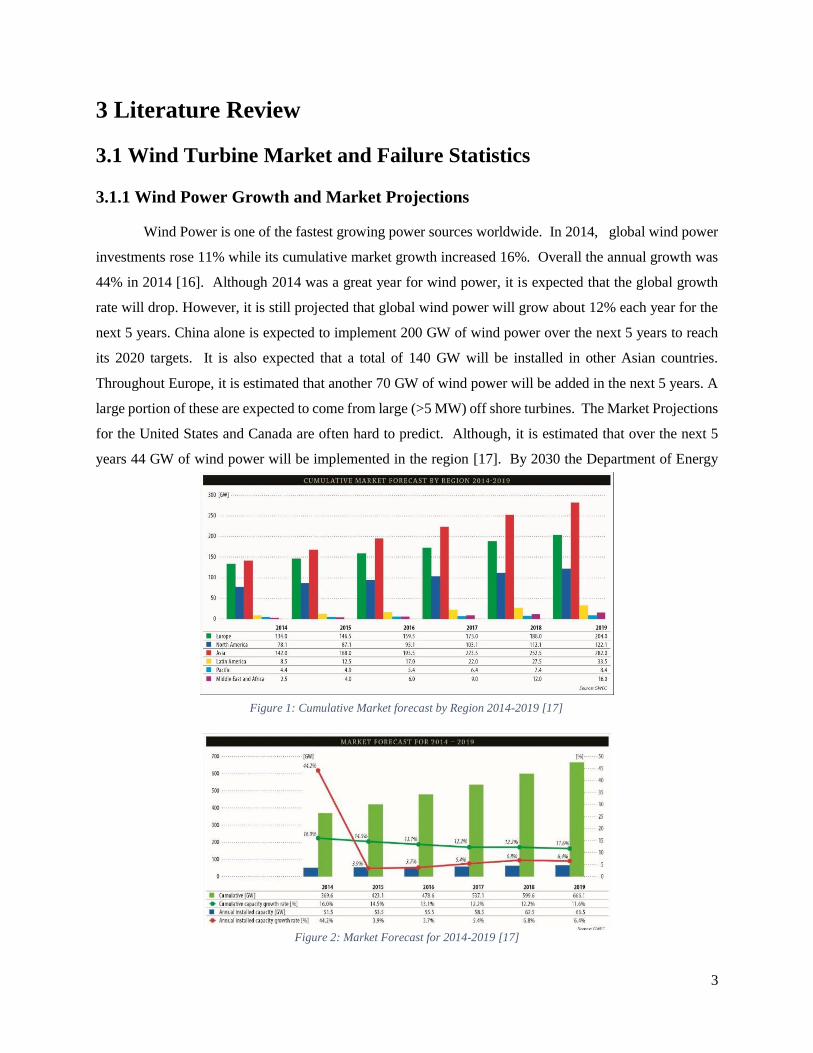
large portion of these are expected to come from large (>5 MW) off shore turbines. The Market Projections
for the United States and Canada are often hard to predict. Although, it is estimated that over the next 5
years 44 GW of wind power will be implemented in the region [17]. By 2030 the Department of Energy
Figure 2: Market Forecast for 2014-2019 [17]
Figure 1: Cumulative Market forecast by Region 2014-2019 [17]
4
expects 20% of US power to come from wind turbines [18]. These Market projections can be seen in Fig.
1 and 2.
3.1.2 Wind Turbine Failures and Maintenance
The projected growth of wind power provides a clear incentive to increase the efficiency and
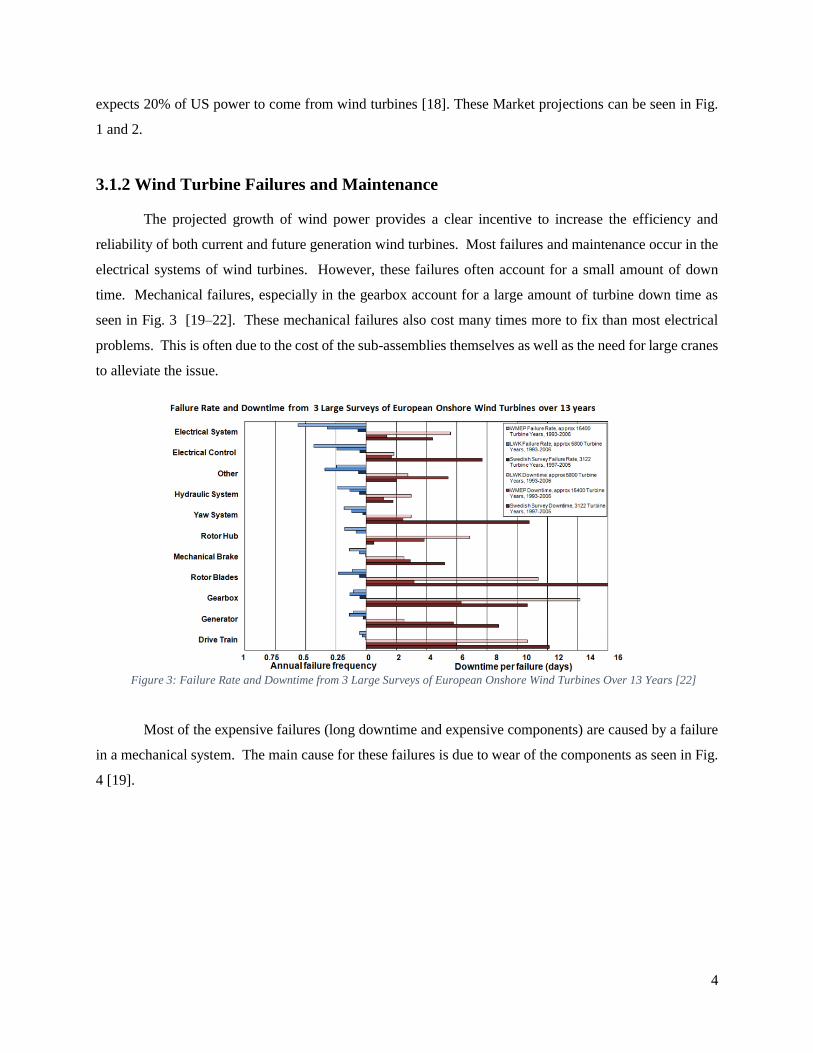
reliability of both current and future generation wind turbines. Most failures and maintenance occur in the
electrical systems of wind turbines. However, these failures often account for a small amount of down
time. Mechanical failures, especially in the gearbox account for a large amount of turbine down time as
seen in Fig. 3 [19–22]. These mechanical failures also cost many times more to fix than most electrical
problems. This is often due to the cost of the sub-assemblies themselves as well as the need for large cranes
to alleviate the issue.
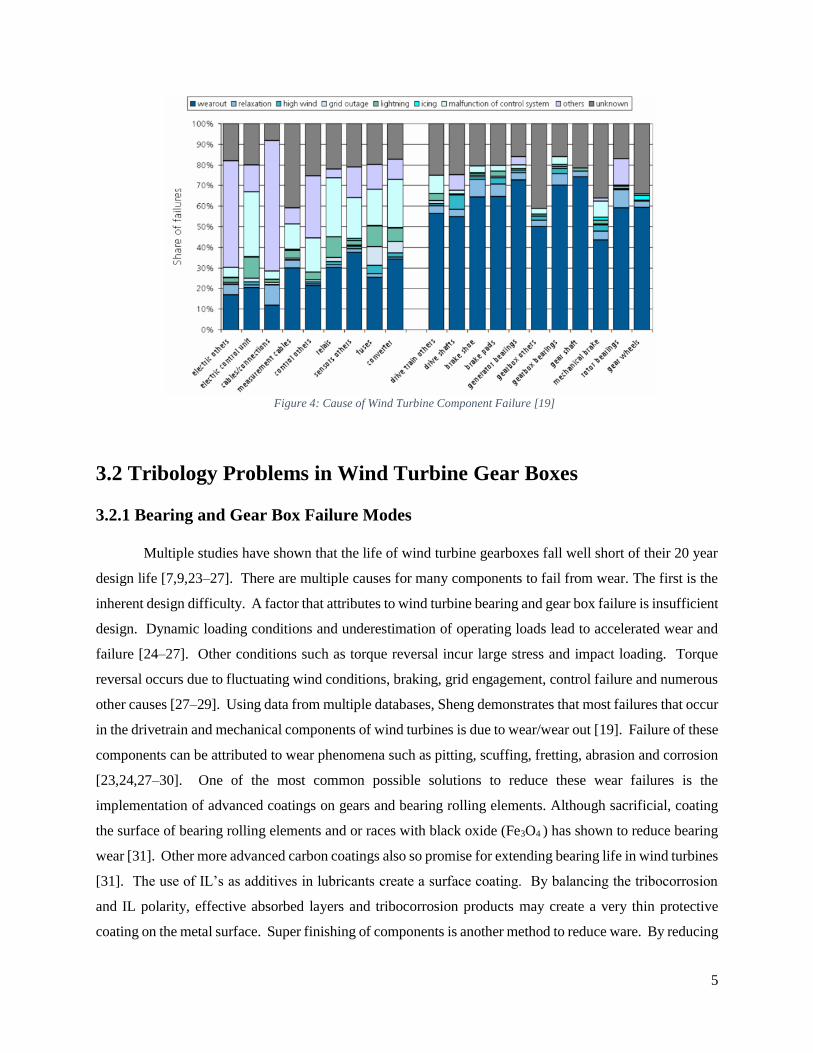
Most of the expensive failures (long downtime and expensive components) are caused by a failure
in a mechanical system. The main cause for these failures is due to wear of the components as seen in Fig.
4 [19].
Figure 3: Failure Rate and Downtime from 3 Large Surveys of European Onshore Wind Turbines Over 13 Years [22]
5
3.2 Tribology Problems in Wind Turbine Gear Boxes
3.2.1 Bearing and Gear Box Failure Modes
Multiple studies have shown that the life of wind turbine gearboxes fall well short of their 20 year
design life [7,9,23–27]. There are multiple causes for many components to fail from wear. The first is the
inherent design difficulty. A factor that attributes to wind turbine bearing and gear box failure is insufficient
design. Dynamic loading conditions and underestimation of operating loads lead to accelerated wear and
failure [24–27]. Other conditions such as torque reversal incur large stress and impact loading. Torque
reversal occurs due to fluctuating wind conditions, braking, grid engagement, control failure and numerous
other causes [27–29]. Using data from multiple databases, Sheng demonstrates that most failures that occur
in the drivetrain and mechanical components of wind turbines is due to wear/wear out [19]. Failure of these
components can be attributed to wear phenomena such as pitting, scuffing, fretting, abrasion and corrosion
[23,24,27–30]. One of the most common possible solutions to reduce these wear failures is the
implementation of advanced coatings on gears and bearing rolling elements. Although sacrificial, coating
the surface of bearing rolling elements and or races with black oxide (Fe3O4 ) has shown to reduce bearing
wear [31]. Other more advanced carbon coatings also so promise for extending bearing life in wind turbines
[31]. The use of IL’s as additives in lubricants create a surface coating. By balancing the tribocorrosion
and IL polarity, effective absorbed layers and tribocorrosion products may create a very thin protective
coating on the metal surface. Super finishing of components is another method to reduce ware. By reducing
Figure 4: Cause of Wind Turbine Component Failure [19]
6
the roughness of components in contact, a thinner lubricating film is needed to prevent asperity contact
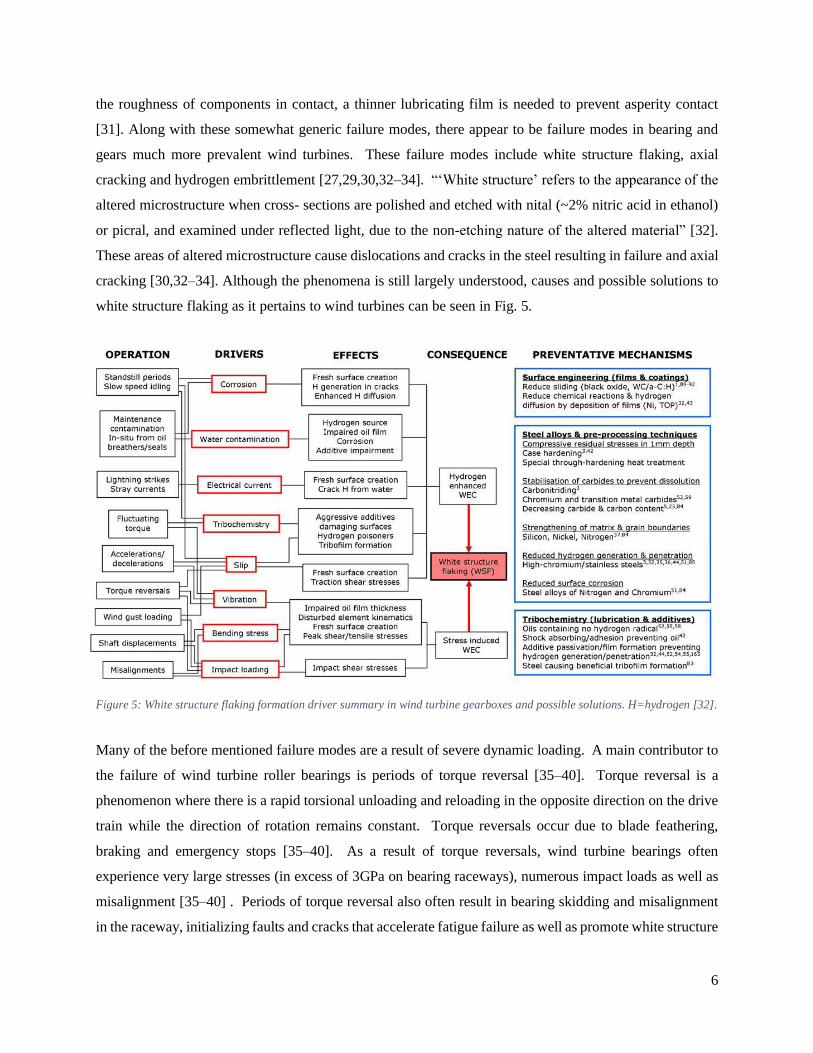
[31]. Along with these somewhat generic failure modes, there appear to be failure modes in bearing and
gears much more prevalent wind turbines. These failure modes include white structure flaking, axial
cracking and hydrogen embrittlement [27,29,30,32–34]. “‘White structure’ refers to the appearance of the
altered microstructure when cross- sections are polished and etched with nital (~2% nitric acid in ethanol)
or picral, and examined under reflected light, due to the non-etching nature of the altered material” [32].
These areas of altered microstructure cause dislocations and cracks in the steel resulting in failure and axial
cracking [30,32–34]. Although the phenomena is still largely understood, causes and possible solutions to
white structure flaking as it pertains to wind turbines can be seen in Fig. 5.
Figure 5: White structure flaking formation driver summary in wind turbine gearboxes and possible solutions. H=hydrogen [32].
Many of the before mentioned failure modes are a result of severe dynamic loading. A main contributor to
the failure of wind turbine roller bearings is periods of torque reversal [35–40]. Torque reversal is a
phenomenon where there is a rapid torsional unloading and reloading in the opposite direction on the drive
train while the direction of rotation remains constant. Torque reversals occur due to blade feathering,
braking and emergency stops [35–40]. As a result of torque reversals, wind turbine bearings often
experience very large stresses (in excess of 3GPa on bearing raceways), numerous impact loads as well as
misalignment [35–40] . Periods of torque reversal also often result in bearing skidding and misalignment
in the raceway, initializing faults and cracks that accelerate fatigue failure as well as promote white structure
7
flaking [35–38,40]. During these periods, the lubricant film is often compromised helping to attribute to
these failures [35–40]. The promotion of a protective tribolayer may be beneficial in helping to prevent
failure in times of lubricant failure.
3.2.1.1 Lubrication Failure
Mechanical failure in wind turbines can also be attributed to lubrication failure. Due to the dynamic
and unpredictable loading conditions previously mentioned [24–27], along with other difficult lubrication
challenges. In this study, a contact pressure of 2 GPa and 3 sliding speeds will be examined.
3.2.1.1.1 Operating Temperature Range
One of the challenges in wind turbine lubrication is the large operating temperature range (-30ºC
to +100ºC) [25,41]. It is known that the viscosity of a lubricant is highly dependent on temperature
(viscosity index). To be effective, wind turbine lubricants need to exhibit sufficient viscosity throughout a
wide temperature range as well as good thermal and chemical stability [27,42–44]. Temperature also
increase the rate of oxidation reducing the life of the lubricant [29,41]. In this study, densities at room
temperature will be determined by weighing a known volume. Viscosities at 40 °C and 100 °C will be
obtained using a Brookfield DV II+ viscometer with a small sample attachment. Thermogravimetric
analysis (TGA) will be carried out on a TA Instruments TGA-2950 at a 10 °C/min heating rate in a nitrogen
atmosphere.
3.2.1.1.2 Vibration
Bearing and gear components that experience low displacements or structural vibrations often
exhibit failure due to false brinelling and or fretting corrosion. This is due to the lubricant being squeezed
out. The small amplitude of motion causes the lubricant film inadequate to replenish. The resulting asperity
contact of the surfaces promotes failure [25,28–31]. To alleviate this problem, research is trending toward
surface coating or conditioning. Super finishing, carburizing and boriding appear to reduce failure to low
amplitude motion by greatly increasing the hardness (up to 200%) of the steel surface. The use of thermally
coated ceramic carbides (such as WC,TiC,Cr3C2, and SiC) have also been studied [45]. Results show that
these techniques reduce wear on steel-steel contacts [27,39,40]. The influence of steel type in wind turbine
bearings is also being investigated [47].
8
3.2.1.1.3 Contamination
As component wear occurs, the wear debris gets incorporated into the lubricant. Wind turbines
also accumulate contaminants due their harsh environments. For example, dust, sand, dirt, water and salt
often assimilate with the lubricant. The additives in the lubricant can also pose a problem. As the lubricant
ages, contaminants from the lubricant additives (through chemical breakdown) suspend themselves in the
lubricant [42]. Once contaminated, the lubricant not only losses its effectiveness, but also accelerates wear
due to abrasion. It has been found that by using a 3mm filter compared to a 40mm filter can increase
bearing life by up to 7 times. It has also been found that permanent damage can occur in as little as 30
minutes during the run in period if the gearbox is not clear or contaminants after assembly. During
operation, it is imperative to keep the lubricant clean. Debris can cause abrasion as well as large stress
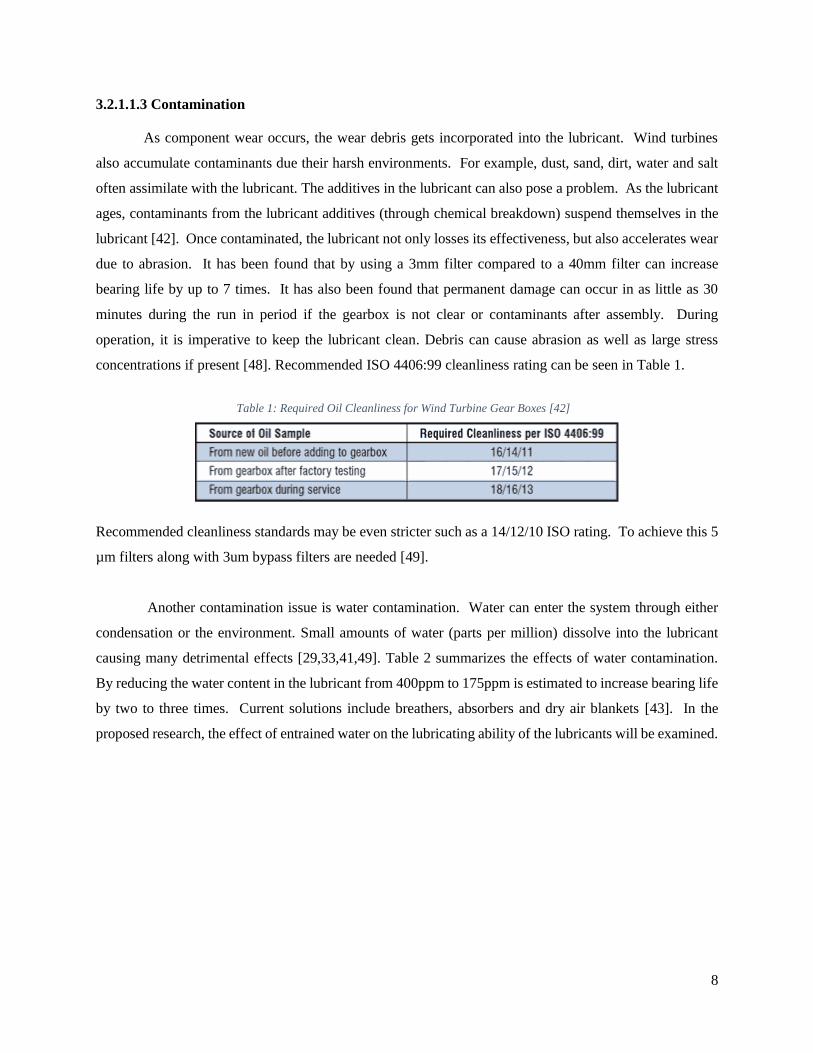
concentrations if present [48]. Recommended ISO 4406:99 cleanliness rating can be seen in Table 1.
Recommended cleanliness standards may be even stricter such as a 14/12/10 ISO rating. To achieve this 5
µm filters along with 3um bypass filters are needed [49].
Another contamination issue is water contamination. Water can enter the system through either
condensation or the environment. Small amounts of water (parts per million) dissolve into the lubricant
causing many detrimental effects [29,33,41,49]. Table 2 summarizes the effects of water contamination.
By reducing the water content in the lubricant from 400ppm to 175ppm is estimated to increase bearing life
by two to three times. Current solutions include breathers, absorbers and dry air blankets [43]. In the
proposed research, the effect of entrained water on the lubricating ability of the lubricants will be examined.
Table 1: Required Oil Cleanliness for Wind Turbine Gear Boxes [42]

9
3.3 Ionic Liquids
Ionic liquids (IL’s) are salts with a melting temperature below the boiling point of water (100 °C).
When melted, they form a liquid comprised entirely of ions. Usually they exist as a large organic cation
paired with a smaller organic or inorganic anion. It has been estimated that the number of cation- anion
combinations could produce up to one trillion (1012) different IL’s [13–15]. Research on the chemical and
physical properties of these compounds has expanded greatly in the last few years [13,50]. The large
number of combinations promotes the implementation of “design-specific” compounds.
3.3.1 Properties of Ionic Liquids
The physical/chemical properties that IL’s contain has promoted research for their use in many
fields. For example, IL’s are being considered for next generation solvents and electrolytes. The properties
that make them candidates for the above mentioned applications also makes them contenders as lubricants
and lubricant additives. These properties such as negligible vapor pressure, high thermal, chemical, and
electrical stability, non-flammability and low environmental impact make them attractive compounds.
3.3.1.1 Low Vapor Pressure
IL’s have a negligible vapor pressure. This means that they are non-volatile. Even in the presence
of high temperatures or vacuum pressures. Not only is this beneficial from an application stand point, but
it is also beneficial from a health, safety and environmental perspective [12,13,15,50–56].
Table 2: Water Contamination Problems in Wind Turbine Gearboxes [43]
10
3.3.1.2 Thermal Stability
IL’s are very thermally stable compounds. They have large operating temperature ranges (up to a
300°C differential) where they maintain their fluidity and volume [13]. IL’s also resist degradation at high
temperatures. Many formulations can survive temperatures above 200°C before they begin to break down.
The thermal stability IL’s makes them applicable from cryogenic conditions to very hot (500°C) conditions
[12,13,15,50–56]. As mentioned before, Thermogravimetric analysis (TGA) will be carried out on a TA
Instruments TGA-2950 at a 10 °C/min heating rate in a nitrogen atmosphere.
3.3.1.3 Miscibility
IL’s possess the ability to be miscible with many different compounds, both polar and non-polar,
organic and inorganic [13,14,50–52,54,57]. The anion of the IL has the greatest effect on
miscibility/solubility. For example, by subtly changing the anion, an IL can be transformed from a
hydrophilic compound to a hydrophobic compound (with the same cation) [13–15,50,52–54]. This property
not only allows IL’s to interact/dissolve in a wide variety of substances, but give IL’s “tailorable properties”.
3.3.1.4 Toxicology
The environmental and health effects of IL’s still needs to be thoroughly investigated. It is
imperative to gather more toxicology and ecotoxicity data in order to truly understand the environmental
impact of IL’s [13,15,50]. However, with non-halide formulations, the environmental impact is much less
harmful than many traditional solvents, other industrial compounds [10–13,15,50,51,58]. However, it has
been shown that the most commonly used IL’s today do contain various levels of toxicity as well as
biodegradability (particularly when exposed to water) [59–62]. With correct formulation, it seems possible
to create non-toxic, environmentally friendly alternatives to many industrial chemicals in use today. Due to
the ability to formulate specific IL’s, the environmental impact of new IL’s seems to have a very positive
outlook [13,14,52,55]. The use of one halogen free IL will be examined in this study.
3.3.2 Potential Applications of Ionic Liquids
The research pertaining to IL’s has been growing exponentially over the past few decades
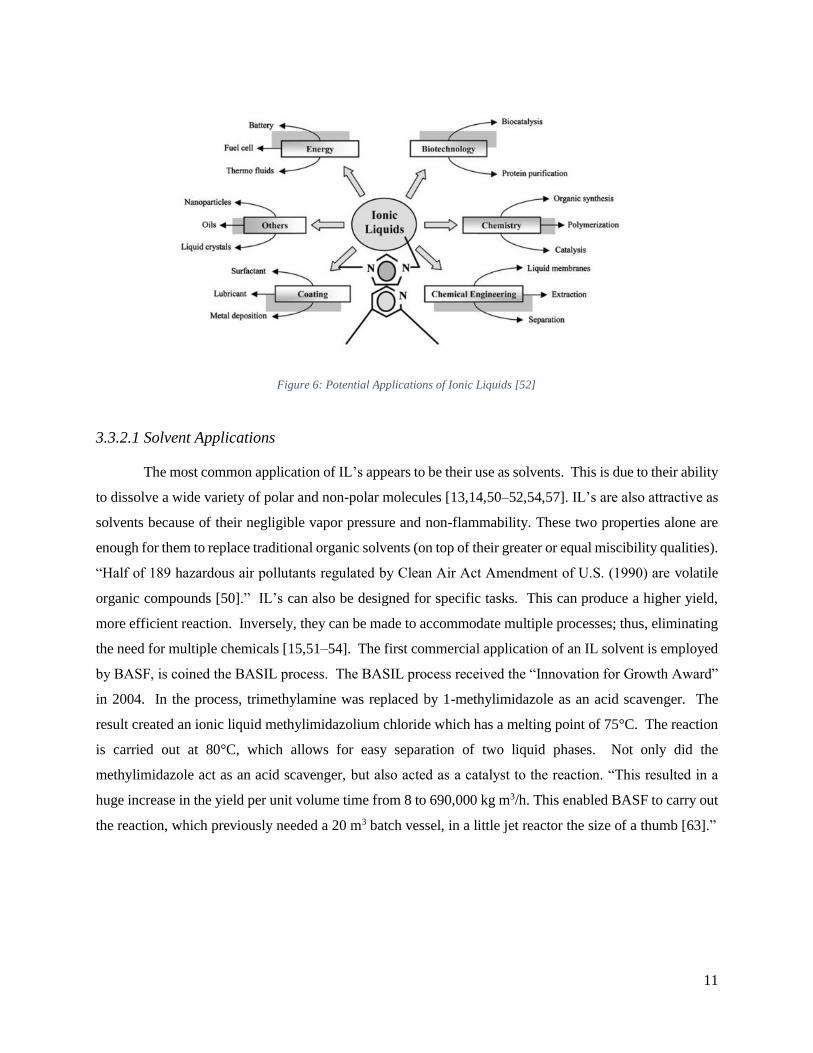
[13,15,54]. As a result, many potential applications for IL’s are emerging in multiple industries. Figure 6
shows a general summary of where and how IL’s can be used. Due to the properties and customization of
IL’s, they contain high functionality. Many of these functions are beginning to be explored.
11
3.3.2.1 Solvent Applications
The most common application of IL’s appears to be their use as solvents. This is due to their ability
to dissolve a wide variety of polar and non-polar molecules [13,14,50–52,54,57]. IL’s are also attractive as
solvents because of their negligible vapor pressure and non-flammability. These two properties alone are
enough for them to replace traditional organic solvents (on top of their greater or equal miscibility qualities).
“Half of 189 hazardous air pollutants regulated by Clean Air Act Amendment of U.S. (1990) are volatile
organic compounds [50].” IL’s can also be designed for specific tasks. This can produce a higher yield,
more efficient reaction. Inversely, they can be made to accommodate multiple processes; thus, eliminating
the need for multiple chemicals [15,51–54]. The first commercial application of an IL solvent is employed
by BASF, is coined the BASIL process. The BASIL process received the “Innovation for Growth Award”
in 2004. In the process, trimethylamine was replaced by 1-methylimidazole as an acid scavenger. The
result created an ionic liquid methylimidazolium chloride which has a melting point of 75°C. The reaction
is carried out at 80°C, which allows for easy separation of two liquid phases. Not only did the
methylimidazole act as an acid scavenger, but also acted as a catalyst to the reaction. “This resulted in a
huge increase in the yield per unit volume time from 8 to 690,000 kg m3/h. This enabled BASF to carry out
the reaction, which previously needed a 20 m3 batch vessel, in a little jet reactor the size of a thumb [63].”
Figure 6: Potential Applications of Ionic Liquids [52]
12
3.3.2.2 Applications in Catalysis
Another application of IL’s is their use as catalysts. The properties of IL’s allow them to either act
as a catalyst or transport a catalyst. The greatest benefit of using IL’s in catalysis is that they can easily be
separated from the product/ reaction increasing efficiency and purity. IL’s are also easier to recycle than
other catalysts [15,50,52,53].
3.3.2.3 Electrochemical Applications
IL’s also have potential in electrochemical applications. IL’s have high conductivity paired with
high thermal and chemical stability. These properties along with a high electrochemical window (water is
1.23 V, IL’s could be 5– 6 V) make them excellent candidates for electrochemical processes and give them
much greater operating ranges compared to traditional electrolytes. IL’s have uses in batteries, capacitors,
fuel cells, solar cells and electrodeposition of metals [13,15,51,53,54].
3.3.2.4 Thermofluid and Heat Transfer Applications
IL’s are beginning to be looked at for heat transfer applications. A common research topic for this
application is IL’s use in solar power. IL’s have been studied as a potential heat transfer fluid for solar
thermal electric power [55,64,65]. It has been found that IL’s can outperform traditional heat transfer fluids,
especially in harsh conditions [55,64,65]. The IL’s studied provided high thermal conductivity as well has
high specific heats. Combined, they create an energy dense thermal storage medium in a liquid state. Due
to the low melting point and nonvolatile nature of IL’s, their capability for latent energy storage is poor.
However when only a liquid phase is needed they show potential as a heat transfer fluid [55,64,65].
3.3.3 Ionic Liquids in Tribology
The topic to be investigated concerns the use of IL’s in Tribology. Specifically, as a replacement
to traditional lubricant additives in harsh operating conditions. Since first proposed in 2001 by Liu et al.
[66], ionic liquids have attracted the attention of the Tribology community. Due to their physical and
chemical properties, IL’s have the potential to solve many challenging lubrication problems. The most
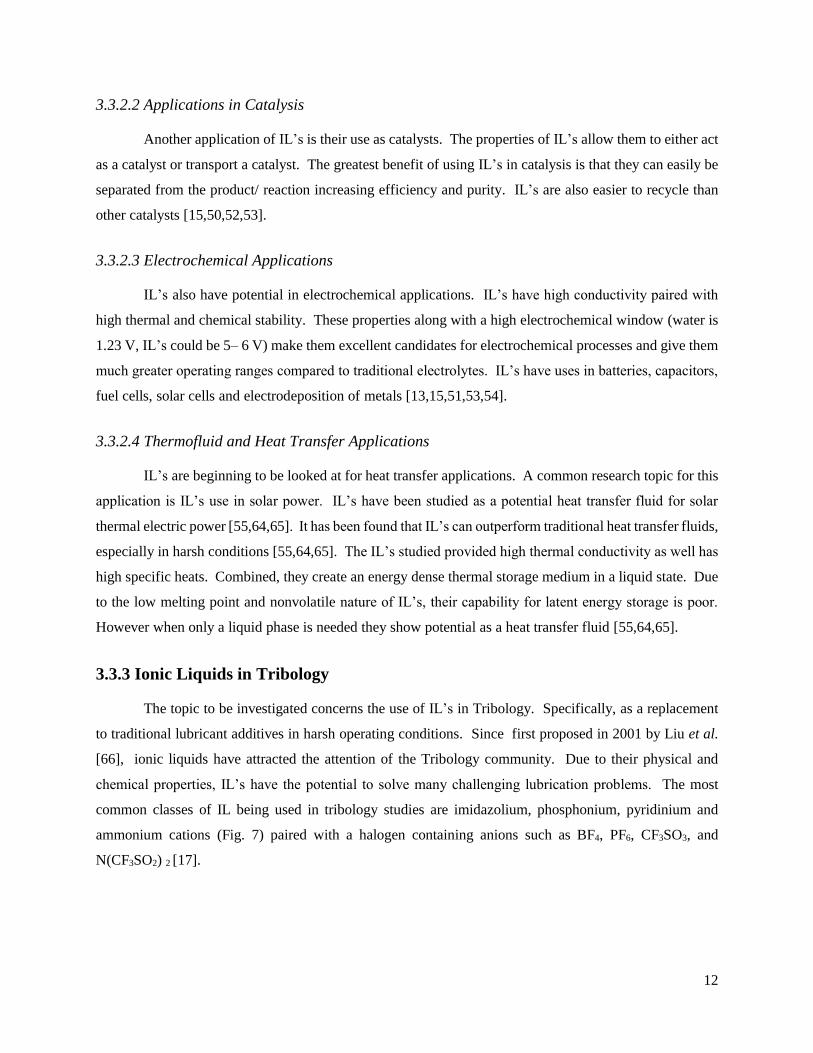
common classes of IL being used in tribology studies are imidazolium, phosphonium, pyridinium and
ammonium cations (Fig. 7) paired with a halogen containing anions such as BF4, PF6, CF3SO3, and
N(CF3SO2) 2 [17].
13
Liu et al. [59] showed that Alkylimidazolium tetrafluoroborate ionic liquids reduced friction and wear for
steel/steel, steel/aluminium, steel/copper, steel/SiO2, Si3N4/SiO2, steel/Si(100), steel/sialon ceramics and
Si3N4/sialon ceramic contacts.
3.3.3.1 Ionic Liquids in Lubrication of Light Alloys
Numerous studies [10,56–58,66–69] have concentrated of the use of IL’s in the lubrication of light
alloys, most commonly aluminum. Traditional lubricants often fail due to the reactive nature and low
hardness of these light alloys. Additionally, light alloy contacts often appear in environments where
lubrication is difficult. For example, automotive and aerospace applications that see wide temperature and
pressure ranges. The studies above have shown good results for the use of IL’s in light alloy contacts in a
general sense. However, it has also been shown that IL’s can be optimized for a particular application. Mu
et al. [70] showed that the functional groups of an IL can be designed for a specific condition with good
results (in this case aluminum-steel contacts). The optimization of IL’s for a specific application is derived
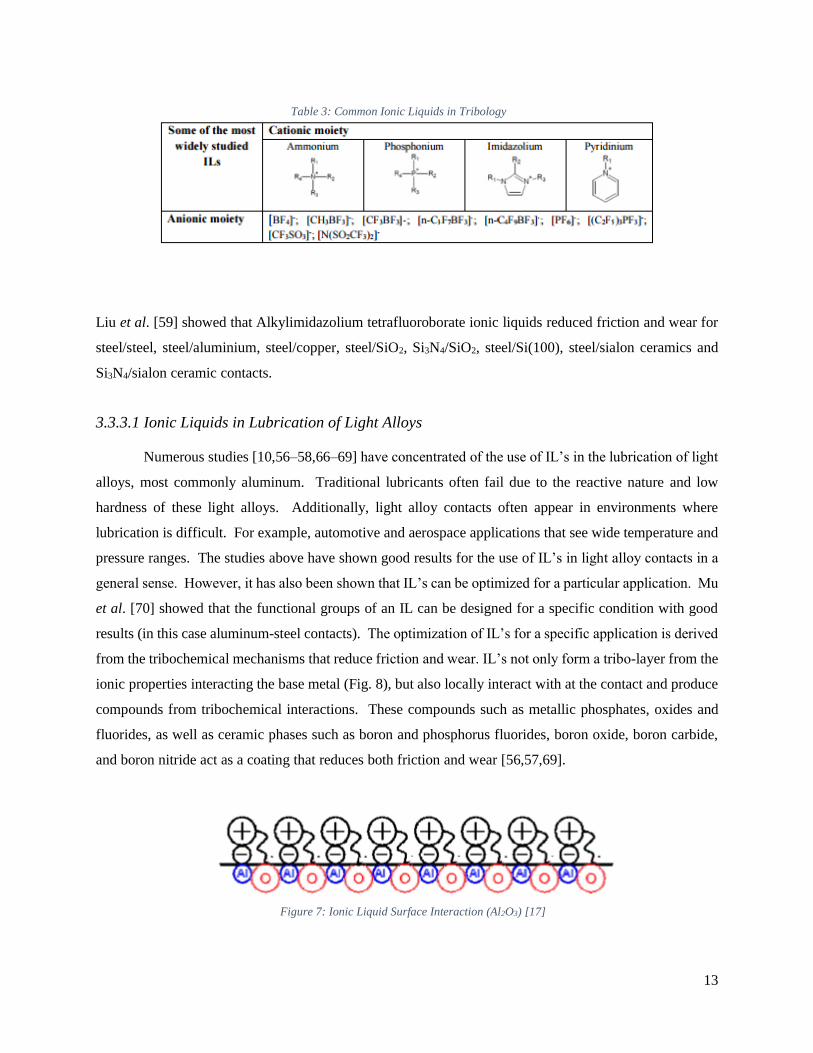
from the tribochemical mechanisms that reduce friction and wear. IL’s not only form a tribo-layer from the
ionic properties interacting the base metal (Fig. 8), but also locally interact with at the contact and produce
compounds from tribochemical interactions. These compounds such as metallic phosphates, oxides and
fluorides, as well as ceramic phases such as boron and phosphorus fluorides, boron oxide, boron carbide,
and boron nitride act as a coating that reduces both friction and wear [56,57,69].
Table 3: Common Ionic Liquids in Tribology
Figure 7: Ionic Liquid Surface Interaction (Al2O3) [17]
14
3.3.3.2 Ionic Liquids in Lubrication of Steel-Steel Contacts
The most studied contact implementing the use of ionic liquids is steel on steel contact. This is
because it is the most common interaction in most machines. Many studies focus on the imidazolium cation
paired with fluoroborates and fluorophosphates (BF4 PF6) [56,57,69,71–73]. This is due to the imidazole
cation being a versatile building block for designing molecules and having appropriate chemical and
physical properties [56]. However, it has been found that other anions such as sulfates, phosphates and
borates show better tribolological properties and wear reduction in steel-steel contacts [10–12,56,58]. Other
formulations are being considered to create more environmentally friendly alternatives along with superior
performance. This is accomplished by using a phosphonium or ammonium derived IL paired with non-
halogen anions [10,11,56–58,74]. The superior wear reduction of these types of IL’s is attributed to the
creation of metal phosphate as opposed to metal fluoride tribo-layer on the metal surface [75]. Almost all
of the studies above show that when IL’s are used as an additive to traditional lubricants (between 5 wt%
to 15 wt%) wear and friction results are better than when used as a neat lubricant. This is mainly attributed
to the amount of tribo-corrosion that takes place as well as the friction reducing characteristics of long
hydrocarbon chains present in most traditional lubricants [11,12,45,46,56,57,69,72,74].
3.3.3.4 Ionic Liquids in Wind Turbine Applications
Ionic liquids may have the ability to alleviate some of the problems seen in wind turbine gearboxes.
Fernandes et al. have shown that wind turbine lubrication often lies in the mixed and boundary lubrication
regimes [43,76]. This results in direct contact of gear and bearing surfaces which causes the wear and
failure modes previously mentioned. Xiao et al. compared the film thickness of imidazolium based IL’s
with silicone oils under high pressure. The results showed that not only can IL’s maintain a film thickness
at high pressure, but maintain a thicker film than silicone oil of similar viscosity [77]. Fernandes et al. also
showed that the friction characteristics of the lubricant is highly dependent on the base oil [43]. This
explains why the addition of IL’s to a base lubricant in the numerous other studies only slightly modified
the friction coefficient. The majority of improvement is seen in the reduction of wear. This year (2015),
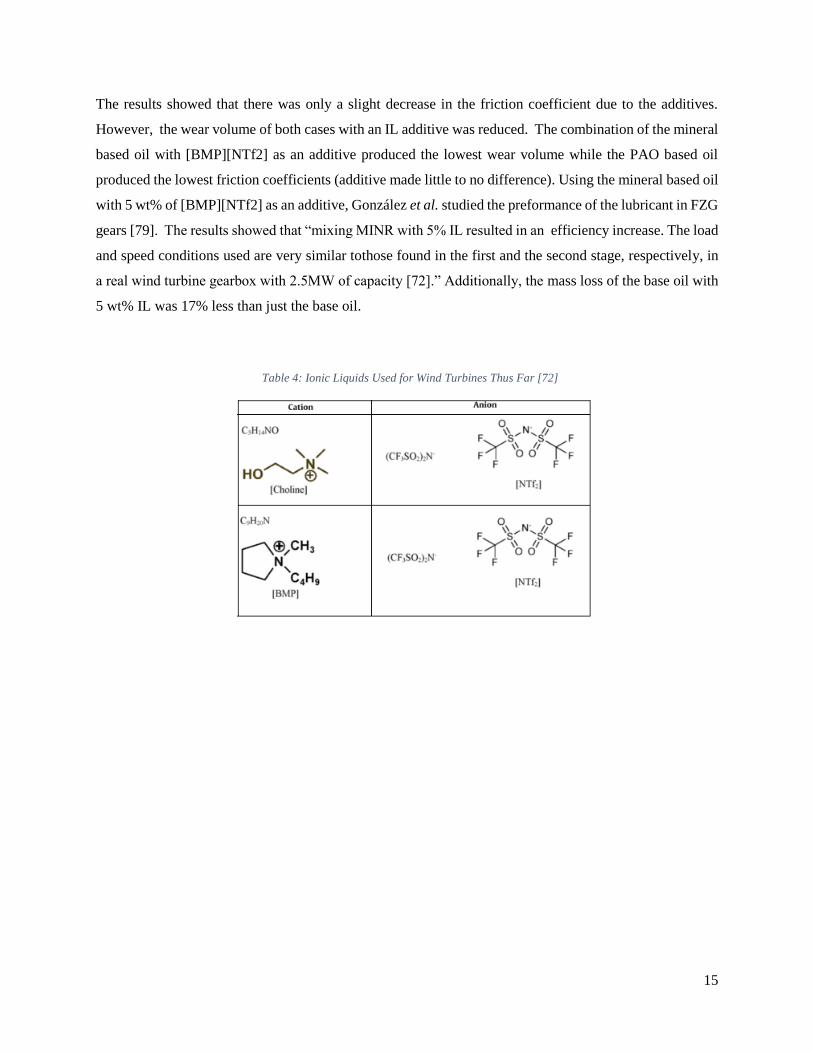
González et al. [78] studied the effect of using two IL’s [Choline][NTf2]: Choline
bis(trifluoromethylsulfonyl)imid and [BMP][NTf2]: 1-Butyl-1-methylpyrrolidinium
bis(trifluoromethylsulfonyl)imid (Table 4.) as an additive (5 wt%) to two fully formulated ISOVG 320 gear
oils. A polyalphaolefin-based and a mineral-based.
15
The results showed that there was only a slight decrease in the friction coefficient due to the additives.
However, the wear volume of both cases with an IL additive was reduced. The combination of the mineral
based oil with [BMP][NTf2] as an additive produced the lowest wear volume while the PAO based oil
produced the lowest friction coefficients (additive made little to no difference). Using the mineral based oil
with 5 wt% of [BMP][NTf2] as an additive, González et al. studied the preformance of the lubricant in FZG
gears [79]. The results showed that “mixing MINR with 5% IL resulted in an efficiency increase. The load
and speed conditions used are very similar tothose found in the first and the second stage, respectively, in
a real wind turbine gearbox with 2.5MW of capacity [72].” Additionally, the mass loss of the base oil with
5 wt% IL was 17% less than just the base oil.
Table 4: Ionic Liquids Used for Wind Turbines Thus Far [72]
16
4 Objectives of the Proposed Work
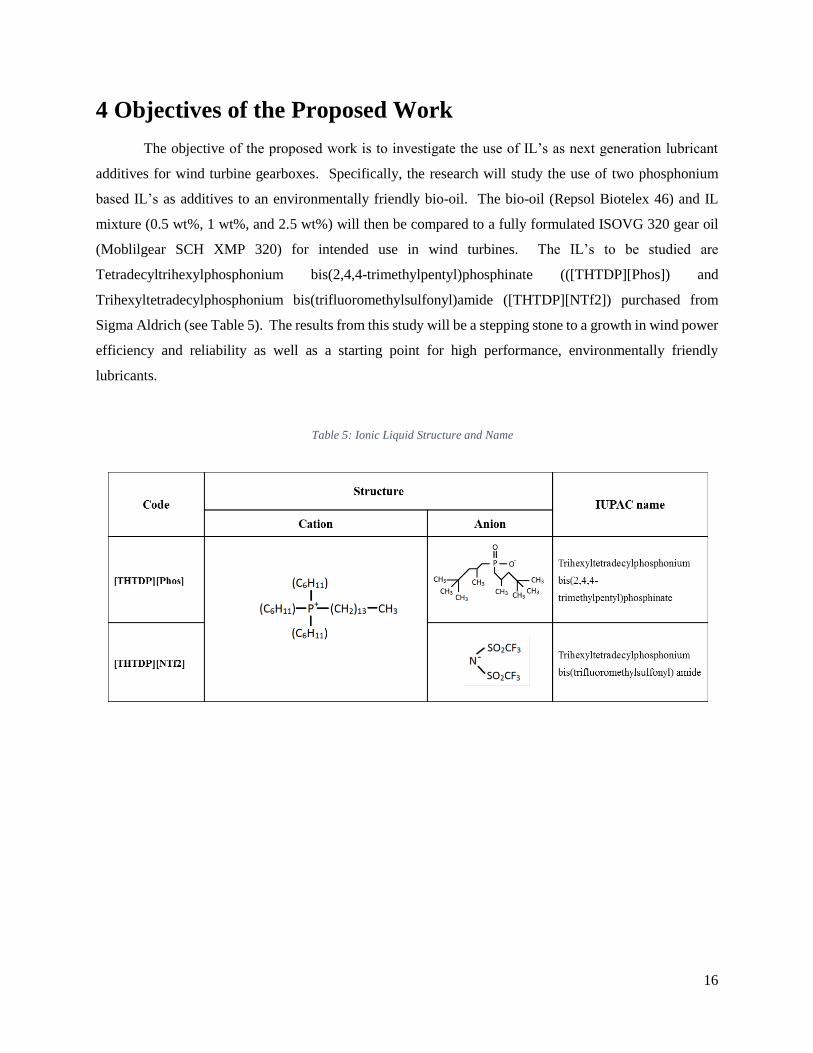
The objective of the proposed work is to investigate the use of IL’s as next generation lubricant
additives for wind turbine gearboxes. Specifically, the research will study the use of two phosphonium
based IL’s as additives to an environmentally friendly bio-oil. The bio-oil (Repsol Biotelex 46) and IL
mixture (0.5 wt%, 1 wt%, and 2.5 wt%) will then be compared to a fully formulated ISOVG 320 gear oil
(Moblilgear SCH XMP 320) for intended use in wind turbines. The IL’s to be studied are
Tetradecyltrihexylphosphonium bis(2,4,4-trimethylpentyl)phosphinate (([THTDP][Phos]) and
Trihexyltetradecylphosphonium bis(trifluoromethylsulfonyl)amide ([THTDP][NTf2]) purchased from
Sigma Aldrich (see Table 5). The results from this study will be a stepping stone to a growth in wind power
efficiency and reliability as well as a starting point for high performance, environmentally friendly
lubricants.
Table 5: Ionic Liquid Structure and Name
17
5 Preliminary Work
Prior to starting the experiments, alterations to the pin-on-disk tribometer were necessary. The
stepper motor (Anaheim Automation 23MD106D-04-00-00) installed on the old version lacked both the
torque and speed capacity needed for the experiments. A new brushless DC motor (Anaheim Automation
BLWRPG173S-24V-4000-R4.9) was installed. A new drive shaft and sample holder were also fabricated
in the RIT machine shop to increase concentricity and improve experimental precision. New strain gages
were installed to capture the friction coefficient more accurately. The LabVIEW program that ran the
tribometer was re-written from scratch to incorporate more features and run the new motor and strain gages.
18
6 Experimental Work
6.1 Friction and Wear Testing
A pin-on-disk tribometer is used to study the effects on friction and wear when using ionic liquids
as additives to a bio-oil. The experiments consist of a steel-steel Hertzian contact between a ball and a disk.
6.1.1 Sample Preparation
The test samples (disks) are fabricated from AISI 52100 bar stock. The bar stock has an outer
diameter of 1.25 inches (31.75mm). Sections of the bar stock are cut to approximately 0.5 inches (12.7mm)
in thickness using an abrasive cut off wheel. The disks are then faced on a lathe using a carbide cutting
tool. A speed of 500 RPM and a feed rate of 0.003 in/rev is used to face both sides of the disks flat. Once
both sides of the disk are faced, both sides of the disk are then surface ground. The surface grinding ensures
that both faces of the disk are parallel to one another as well as provides the desired surface roughness.
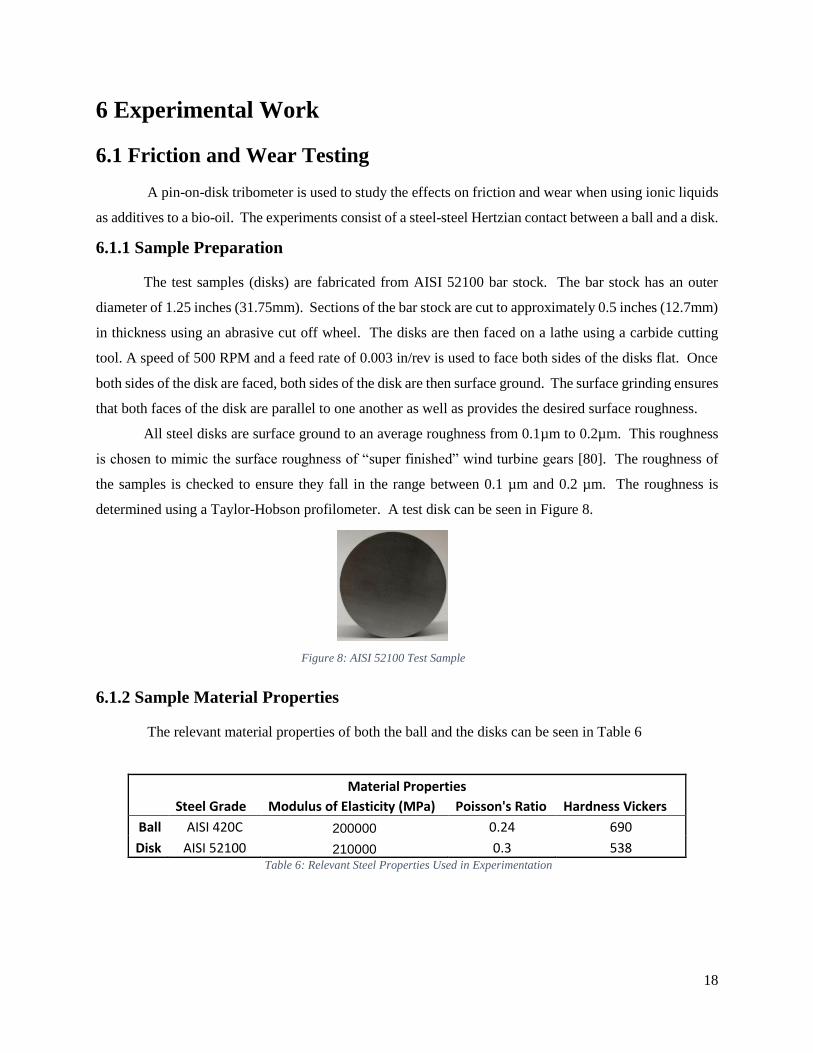
All steel disks are surface ground to an average roughness from 0.1µm to 0.2µm. This roughness
is chosen to mimic the surface roughness of “super finished” wind turbine gears [80]. The roughness of
the samples is checked to ensure they fall in the range between 0.1 µm and 0.2 µm. The roughness is
determined using a Taylor-Hobson profilometer. A test disk can be seen in Figure 8.
6.1.2 Sample Material Properties
The relevant material properties of both the ball and the disks can be seen in Table 6
Table 6: Relevant Steel Properties Used in Experimentation
Material Properties
Steel Grade Modulus of Elasticity (MPa) Poisson's Ratio Hardness Vickers
Ball AISI 420C 200000 0.24 690
Disk AISI 52100 210000 0.3 538
Figure 8: AISI 52100 Test Sample
19
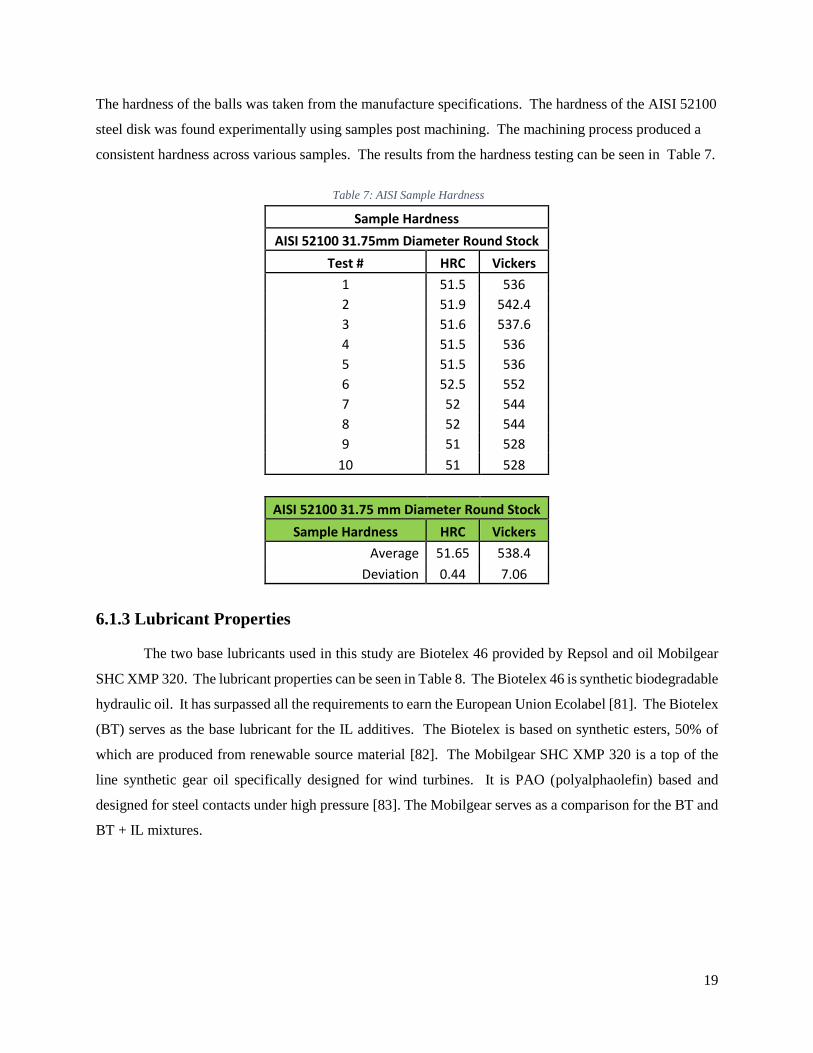
The hardness of the balls was taken from the manufacture specifications. The hardness of the AISI 52100
steel disk was found experimentally using samples post machining. The machining process produced a
consistent hardness across various samples. The results from the hardness testing can be seen in Table 7.
Table 7: AISI Sample Hardness
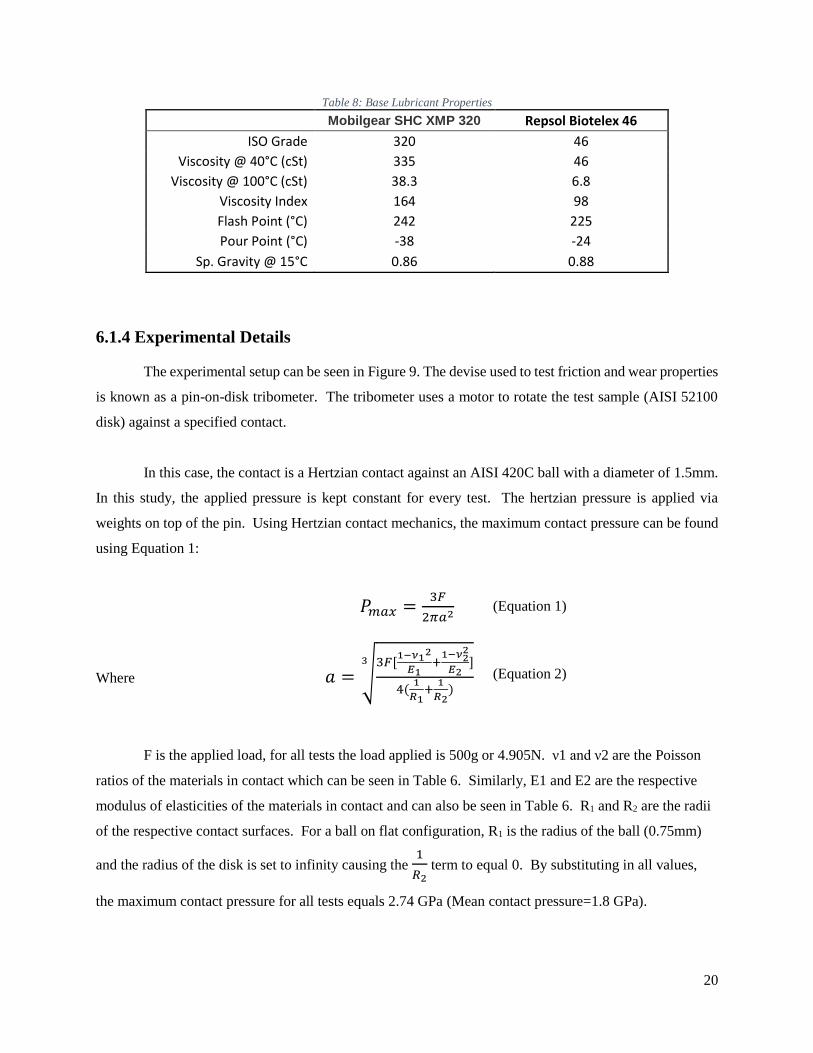
6.1.3 Lubricant Properties
The two base lubricants used in this study are Biotelex 46 provided by Repsol and oil Mobilgear
SHC XMP 320. The lubricant properties can be seen in Table 8. The Biotelex 46 is synthetic biodegradable
hydraulic oil. It has surpassed all the requirements to earn the European Union Ecolabel [81]. The Biotelex
(BT) serves as the base lubricant for the IL additives. The Biotelex is based on synthetic esters, 50% of
which are produced from renewable source material [82]. The Mobilgear SHC XMP 320 is a top of the
line synthetic gear oil specifically designed for wind turbines. It is PAO (polyalphaolefin) based and
designed for steel contacts under high pressure [83]. The Mobilgear serves as a comparison for the BT and
BT + IL mixtures.
Sample Hardness
AISI 52100 31.75mm Diameter Round Stock
Test # HRC Vickers
1 51.5 536
2 51.9 542.4
3 51.6 537.6
4 51.5 536
5 51.5 536
6 52.5 552
7 52 544
8 52 544
9 51 528
10 51 528
AISI 52100 31.75 mm Diameter Round Stock
Sample Hardness HRC Vickers
Average 51.65 538.4
Deviation 0.44 7.06
20
Table 8: Base Lubricant Properties
Mobilgear SHC XMP 320 Repsol Biotelex 46
ISO Grade 320 46
Viscosity @ 40°C (cSt) 335 46
Viscosity @ 100°C (cSt) 38.3 6.8
Viscosity Index 164 98
Flash Point (°C) 242 225
Pour Point (°C) -38 -24
Sp. Gravity @ 15°C 0.86 0.88
6.1.4 Experimental Details
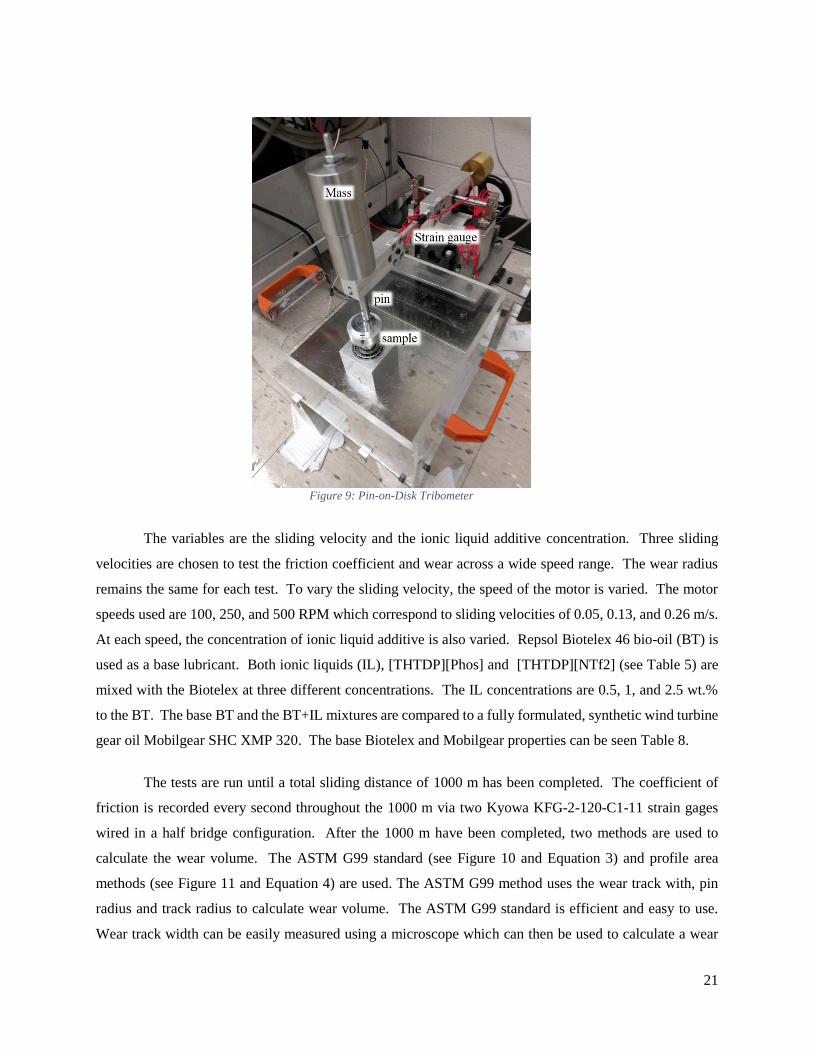
The experimental setup can be seen in Figure 9. The devise used to test friction and wear properties
is known as a pin-on-disk tribometer. The tribometer uses a motor to rotate the test sample (AISI 52100
disk) against a specified contact.
In this case, the contact is a Hertzian contact against an AISI 420C ball with a diameter of 1.5mm.
In this study, the applied pressure is kept constant for every test. The hertzian pressure is applied via
weights on top of the pin. Using Hertzian contact mechanics, the maximum contact pressure can be found
using Equation 1:
𝑃𝑚𝑎𝑥 =3𝐹
2𝜋𝑎2
Where 𝑎 = √3𝐹[
1−𝜈12
𝐸1+1−𝜈2
2
𝐸2]
4(1
𝑅1+
1
𝑅2)
3
F is the applied load, for all tests the load applied is 500g or 4.905N. ν1 and ν2 are the Poisson
ratios of the materials in contact which can be seen in Table 6. Similarly, E1 and E2 are the respective
modulus of elasticities of the materials in contact and can also be seen in Table 6. R1 and R2 are the radii
of the respective contact surfaces. For a ball on flat configuration, R1 is the radius of the ball (0.75mm)
and the radius of the disk is set to infinity causing the 1
𝑅2 term to equal 0. By substituting in all values,
the maximum contact pressure for all tests equals 2.74 GPa (Mean contact pressure=1.8 GPa).
(Equation 1)
(Equation 2)
21
The variables are the sliding velocity and the ionic liquid additive concentration. Three sliding
velocities are chosen to test the friction coefficient and wear across a wide speed range. The wear radius
remains the same for each test. To vary the sliding velocity, the speed of the motor is varied. The motor
speeds used are 100, 250, and 500 RPM which correspond to sliding velocities of 0.05, 0.13, and 0.26 m/s.
At each speed, the concentration of ionic liquid additive is also varied. Repsol Biotelex 46 bio-oil (BT) is
used as a base lubricant. Both ionic liquids (IL), [THTDP][Phos] and [THTDP][NTf2] (see Table 5) are
mixed with the Biotelex at three different concentrations. The IL concentrations are 0.5, 1, and 2.5 wt.%
to the BT. The base BT and the BT+IL mixtures are compared to a fully formulated, synthetic wind turbine
gear oil Mobilgear SHC XMP 320. The base Biotelex and Mobilgear properties can be seen Table 8.
The tests are run until a total sliding distance of 1000 m has been completed. The coefficient of
friction is recorded every second throughout the 1000 m via two Kyowa KFG-2-120-C1-11 strain gages
wired in a half bridge configuration. After the 1000 m have been completed, two methods are used to
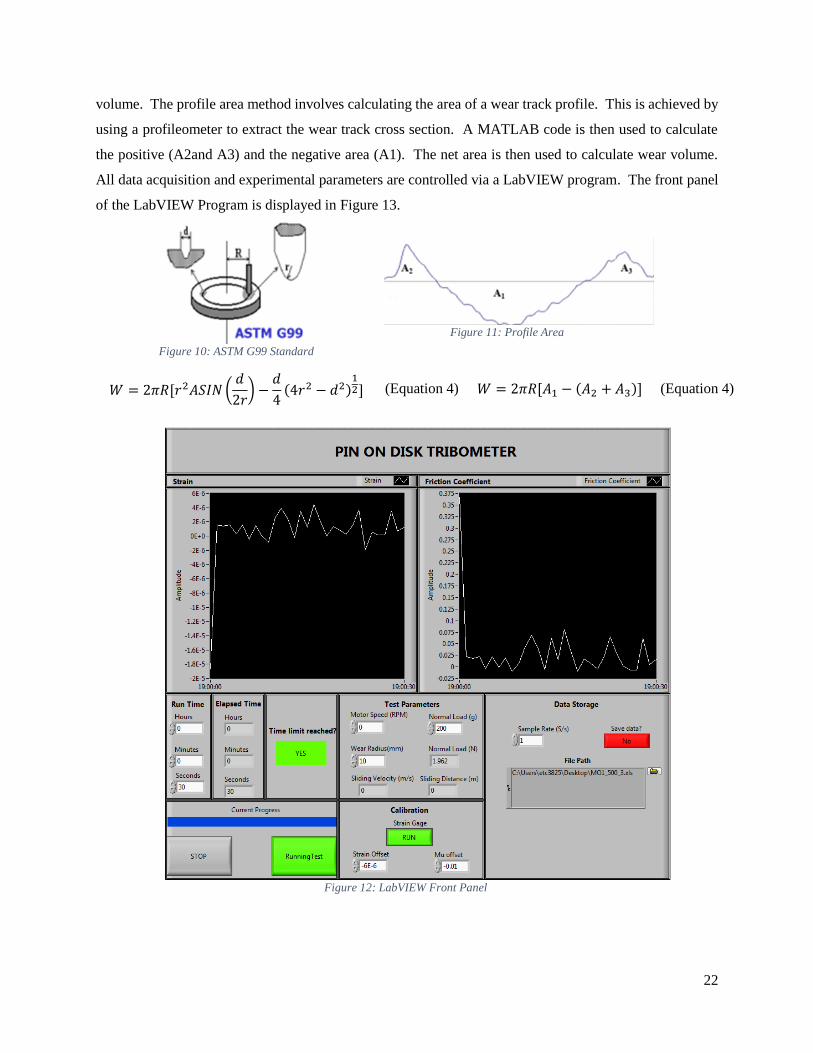
calculate the wear volume. The ASTM G99 standard (see Figure 10 and Equation 3) and profile area
methods (see Figure 11 and Equation 4) are used. The ASTM G99 method uses the wear track with, pin
radius and track radius to calculate wear volume. The ASTM G99 standard is efficient and easy to use.
Wear track width can be easily measured using a microscope which can then be used to calculate a wear
Figure 9: Pin-on-Disk Tribometer
22
volume. The profile area method involves calculating the area of a wear track profile. This is achieved by
using a profileometer to extract the wear track cross section. A MATLAB code is then used to calculate
the positive (A2and A3) and the negative area (A1). The net area is then used to calculate wear volume.
All data acquisition and experimental parameters are controlled via a LabVIEW program. The front panel
of the LabVIEW Program is displayed in Figure 13.
Figure 10: ASTM G99 Standard
Figure 11: Profile Area
𝑊 = 2𝜋𝑅[𝑟2𝐴𝑆𝐼𝑁 (𝑑
2𝑟) −
𝑑
4(4𝑟2 − 𝑑2)
12] (Equation 4) 𝑊 = 2𝜋𝑅[𝐴1 − (𝐴2 + 𝐴3)] (Equation 4)
Figure 12: LabVIEW Front Panel
23
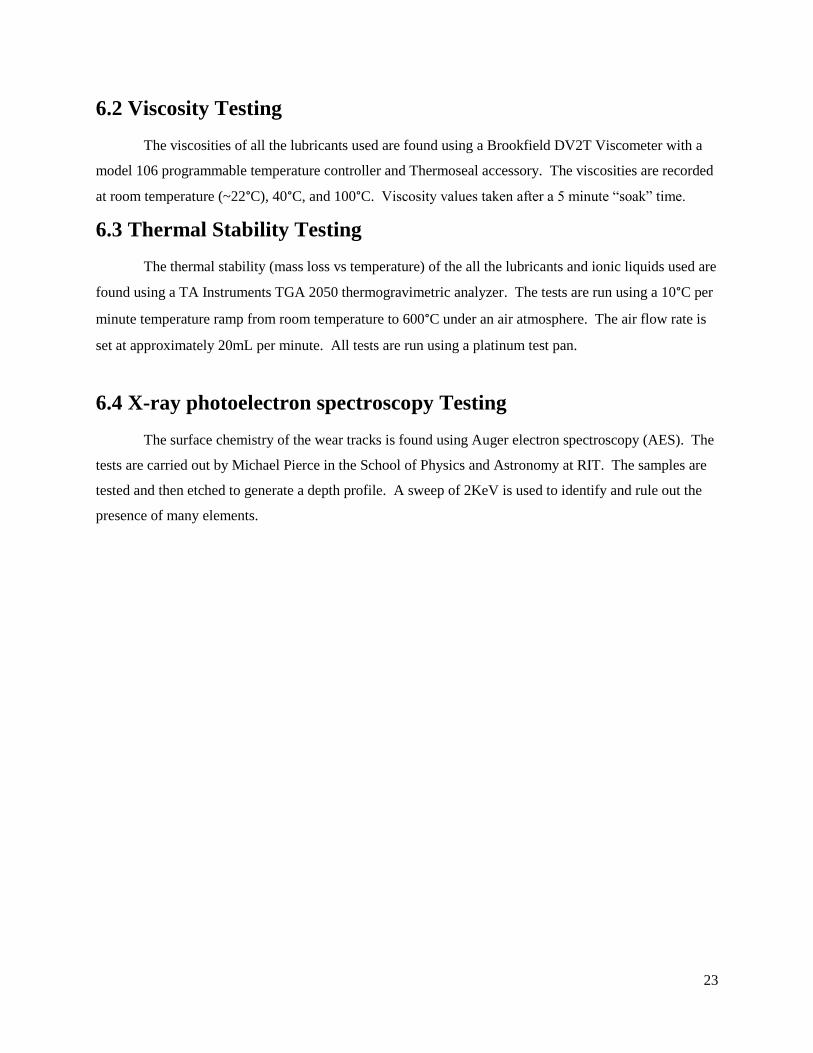
6.2 Viscosity Testing
The viscosities of all the lubricants used are found using a Brookfield DV2T Viscometer with a
model 106 programmable temperature controller and Thermoseal accessory. The viscosities are recorded
at room temperature (~22°C), 40°C, and 100°C. Viscosity values taken after a 5 minute “soak” time.
6.3 Thermal Stability Testing
The thermal stability (mass loss vs temperature) of the all the lubricants and ionic liquids used are
found using a TA Instruments TGA 2050 thermogravimetric analyzer. The tests are run using a 10°C per
minute temperature ramp from room temperature to 600°C under an air atmosphere. The air flow rate is
set at approximately 20mL per minute. All tests are run using a platinum test pan.
6.4 X-ray photoelectron spectroscopy Testing
The surface chemistry of the wear tracks is found using Auger electron spectroscopy (AES). The
tests are carried out by Michael Pierce in the School of Physics and Astronomy at RIT. The samples are
tested and then etched to generate a depth profile. A sweep of 2KeV is used to identify and rule out the
presence of many elements.
24
7 Results and Discussion
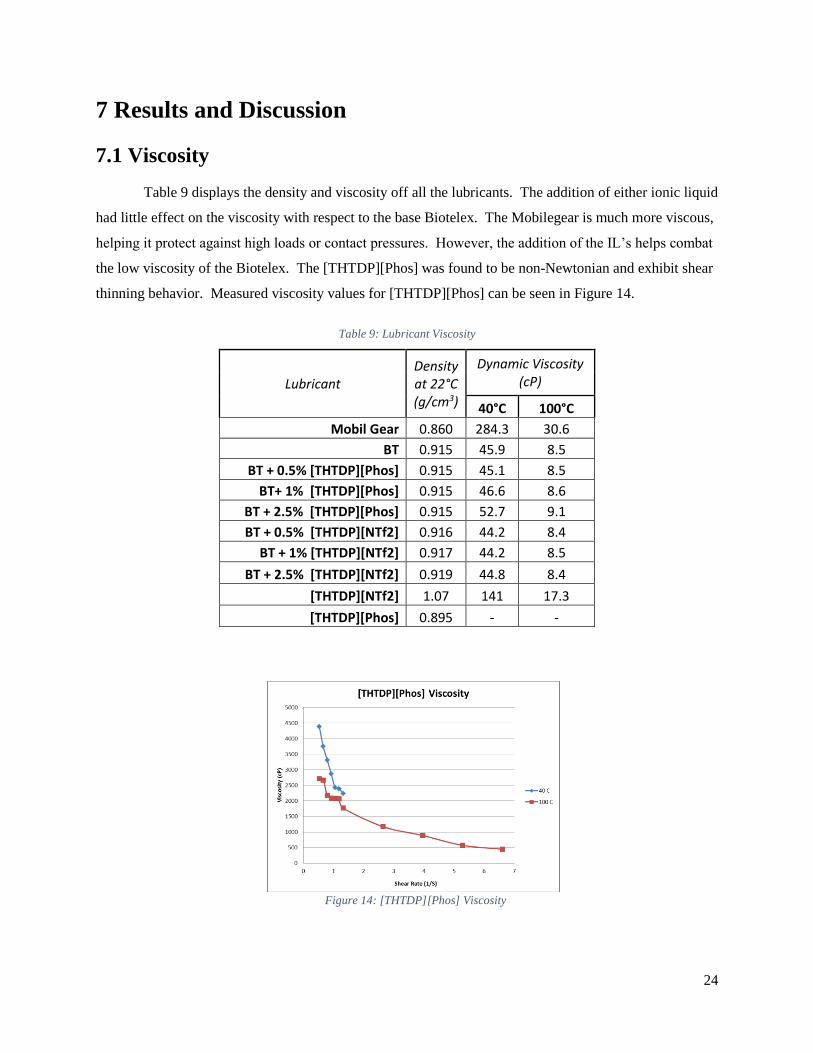
7.1 Viscosity
Table 9 displays the density and viscosity off all the lubricants. The addition of either ionic liquid
had little effect on the viscosity with respect to the base Biotelex. The Mobilegear is much more viscous,
helping it protect against high loads or contact pressures. However, the addition of the IL’s helps combat
the low viscosity of the Biotelex. The [THTDP][Phos] was found to be non-Newtonian and exhibit shear
thinning behavior. Measured viscosity values for [THTDP][Phos] can be seen in Figure 14.
Table 9: Lubricant Viscosity
Lubricant Density at 22°C (g/cm3)
Dynamic Viscosity (cP)
40°C 100°C
Mobil Gear 0.860 284.3 30.6
BT 0.915 45.9 8.5
BT + 0.5% [THTDP][Phos] 0.915 45.1 8.5
BT+ 1% [THTDP][Phos] 0.915 46.6 8.6
BT + 2.5% [THTDP][Phos] 0.915 52.7 9.1
BT + 0.5% [THTDP][NTf2] 0.916 44.2 8.4
BT + 1% [THTDP][NTf2] 0.917 44.2 8.5
BT + 2.5% [THTDP][NTf2] 0.919 44.8 8.4
[THTDP][NTf2] 1.07 141 17.3
[THTDP][Phos] 0.895 - -
Figure 14: [THTDP][Phos] Viscosity
25
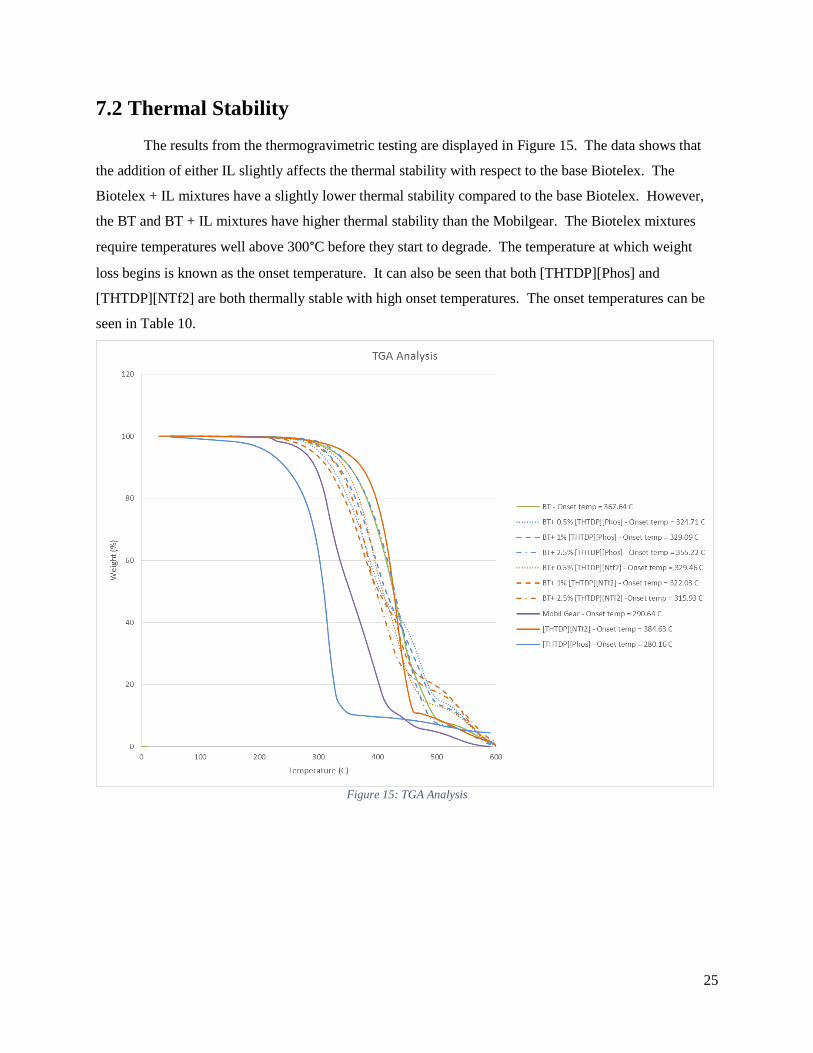
7.2 Thermal Stability
The results from the thermogravimetric testing are displayed in Figure 15. The data shows that
the addition of either IL slightly affects the thermal stability with respect to the base Biotelex. The
Biotelex + IL mixtures have a slightly lower thermal stability compared to the base Biotelex. However,
the BT and BT + IL mixtures have higher thermal stability than the Mobilgear. The Biotelex mixtures
require temperatures well above 300°C before they start to degrade. The temperature at which weight
loss begins is known as the onset temperature. It can also be seen that both [THTDP][Phos] and
[THTDP][NTf2] are both thermally stable with high onset temperatures. The onset temperatures can be
seen in Table 10.
Figure 15: TGA Analysis
26
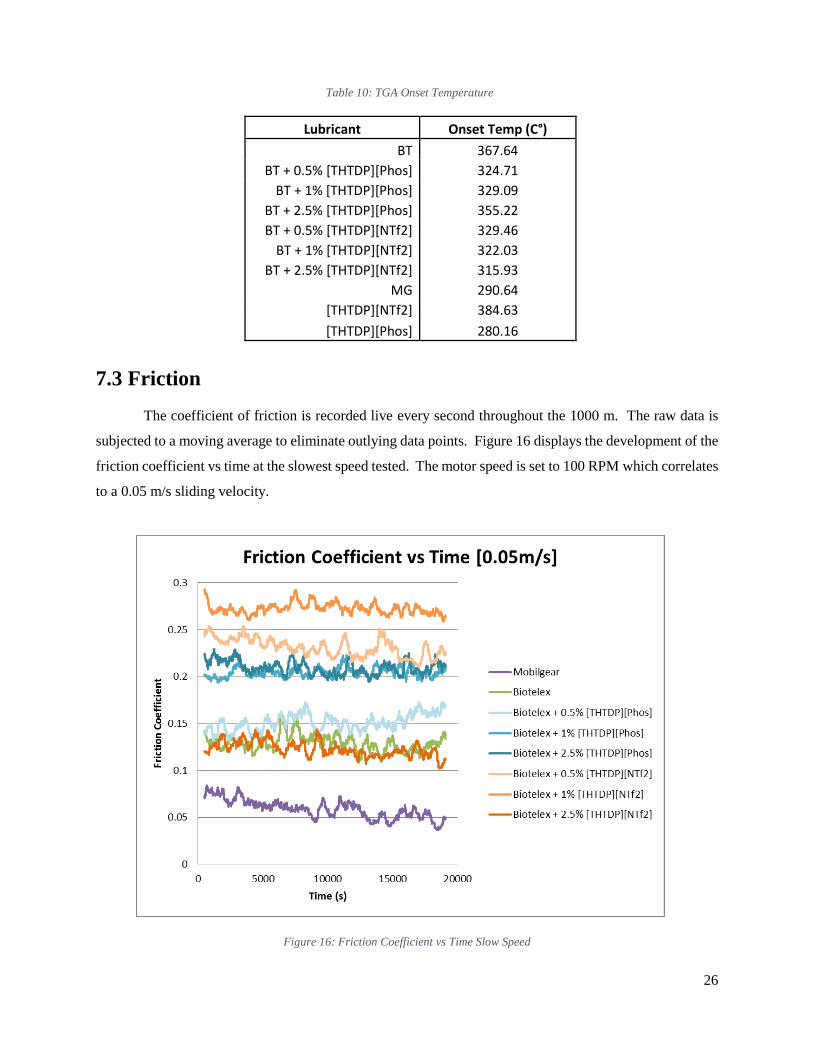
7.3 Friction
The coefficient of friction is recorded live every second throughout the 1000 m. The raw data is
subjected to a moving average to eliminate outlying data points. Figure 16 displays the development of the
friction coefficient vs time at the slowest speed tested. The motor speed is set to 100 RPM which correlates
to a 0.05 m/s sliding velocity.
Figure 16: Friction Coefficient vs Time Slow Speed
Lubricant Onset Temp (C°)
BT 367.64
BT + 0.5% [THTDP][Phos] 324.71
BT + 1% [THTDP][Phos] 329.09
BT + 2.5% [THTDP][Phos] 355.22
BT + 0.5% [THTDP][NTf2] 329.46
BT + 1% [THTDP][NTf2] 322.03
BT + 2.5% [THTDP][NTf2] 315.93
MG 290.64
[THTDP][NTf2] 384.63
[THTDP][Phos] 280.16
Table 10: TGA Onset Temperature
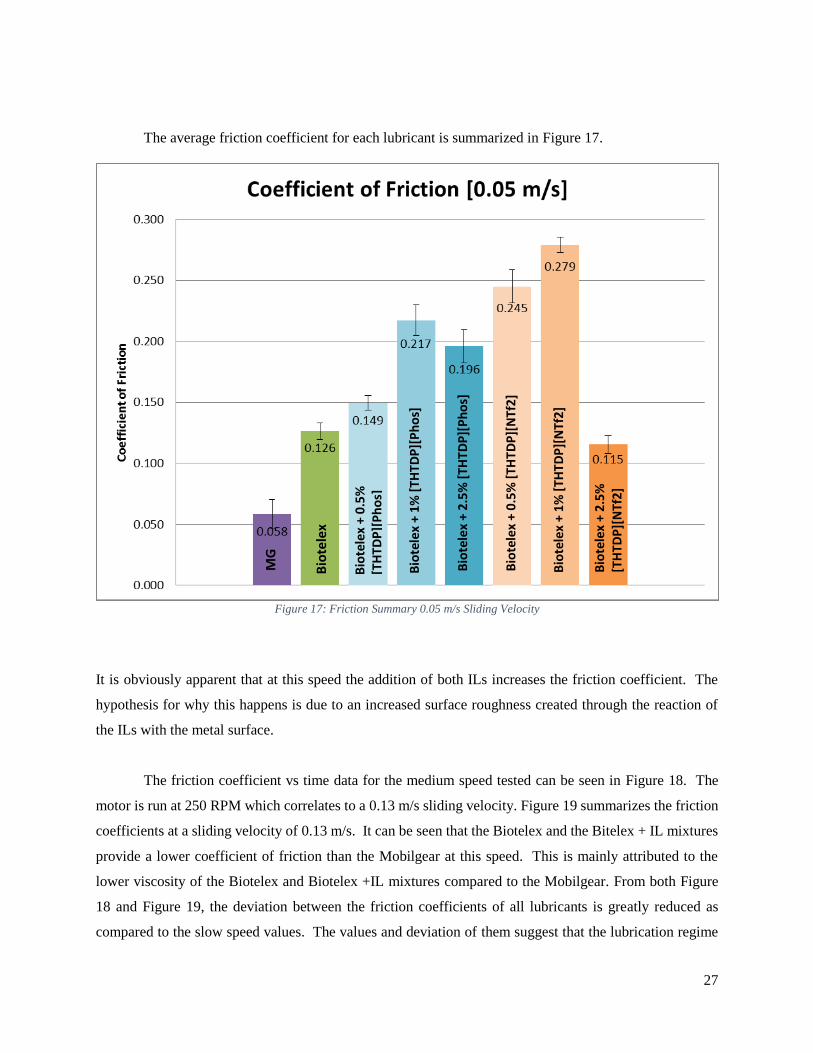
27
The average friction coefficient for each lubricant is summarized in Figure 17.
Figure 17: Friction Summary 0.05 m/s Sliding Velocity
It is obviously apparent that at this speed the addition of both ILs increases the friction coefficient. The
hypothesis for why this happens is due to an increased surface roughness created through the reaction of
the ILs with the metal surface.
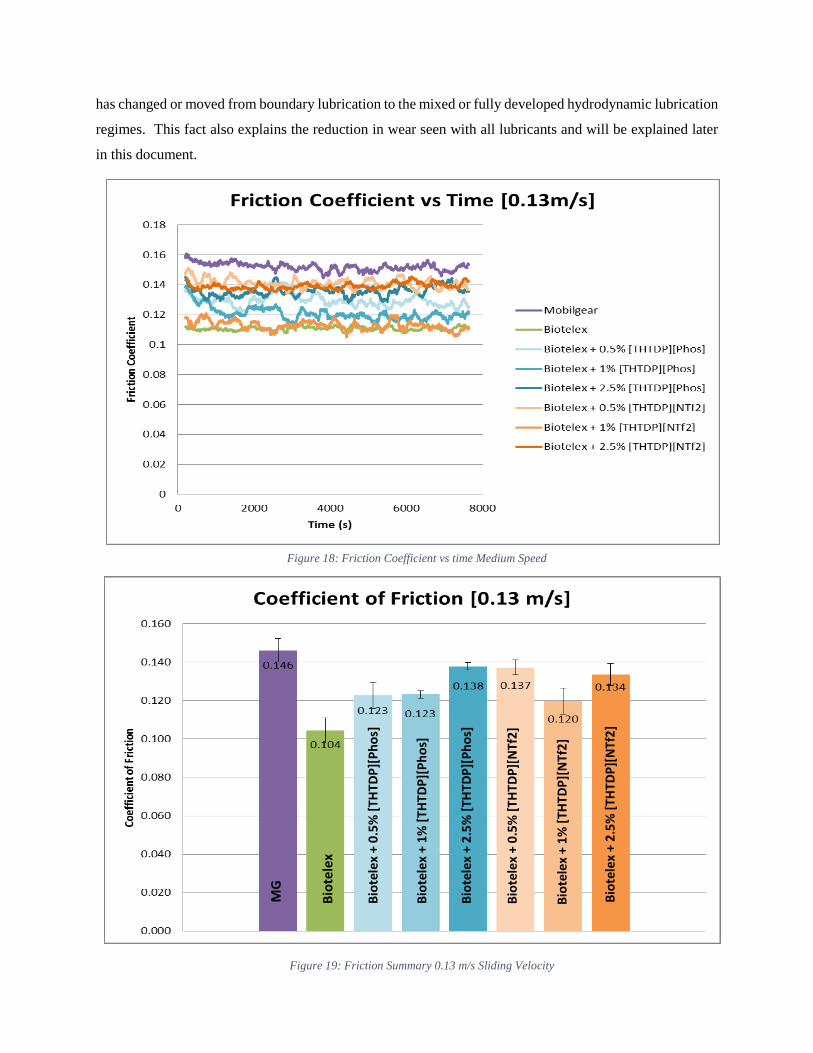
The friction coefficient vs time data for the medium speed tested can be seen in Figure 18. The
motor is run at 250 RPM which correlates to a 0.13 m/s sliding velocity. Figure 19 summarizes the friction
coefficients at a sliding velocity of 0.13 m/s. It can be seen that the Biotelex and the Bitelex + IL mixtures
provide a lower coefficient of friction than the Mobilgear at this speed. This is mainly attributed to the
lower viscosity of the Biotelex and Biotelex +IL mixtures compared to the Mobilgear. From both Figure
18 and Figure 19, the deviation between the friction coefficients of all lubricants is greatly reduced as
compared to the slow speed values. The values and deviation of them suggest that the lubrication regime
MG
Bio
tele
x
Bio
tele
x +
0.5
%
[TH
TDP
][P
ho
s]
Bio
tele
x +
1%
[TH
TDP
][P
ho
s]
Bio
tele
x +
2.5
% [
THTD
P][
Ph
os]
Bio
tele
x +
0.5
% [
THTD
P][
NTf
2]
Bio
tele
x +
1%
[TH
TDP
][N
Tf2
]
Bio
tele
x +
2.5
%
[TH
TDP
][N
Tf2
]
28
has changed or moved from boundary lubrication to the mixed or fully developed hydrodynamic lubrication
regimes. This fact also explains the reduction in wear seen with all lubricants and will be explained later
in this document.
Figure 18: Friction Coefficient vs time Medium Speed
MG
Bio
tele
x
Bio
tele
x +
0.5
% [
THTD
P][
Ph
os]
Bio
tele
x +
1%
[TH
TDP
][P
ho
s]
Bio
tele
x +
2.5
% [
THTD
P][
Ph
os]
Bio
tele
x +
0.5
% [
THTD
P][
NTf
2]
Bio
tele
x +
1%
[TH
TDP
][N
Tf2
]
Bio
tele
x +
2.5
% [
THTD
P][
NTf
2]
Figure 19: Friction Summary 0.13 m/s Sliding Velocity
29
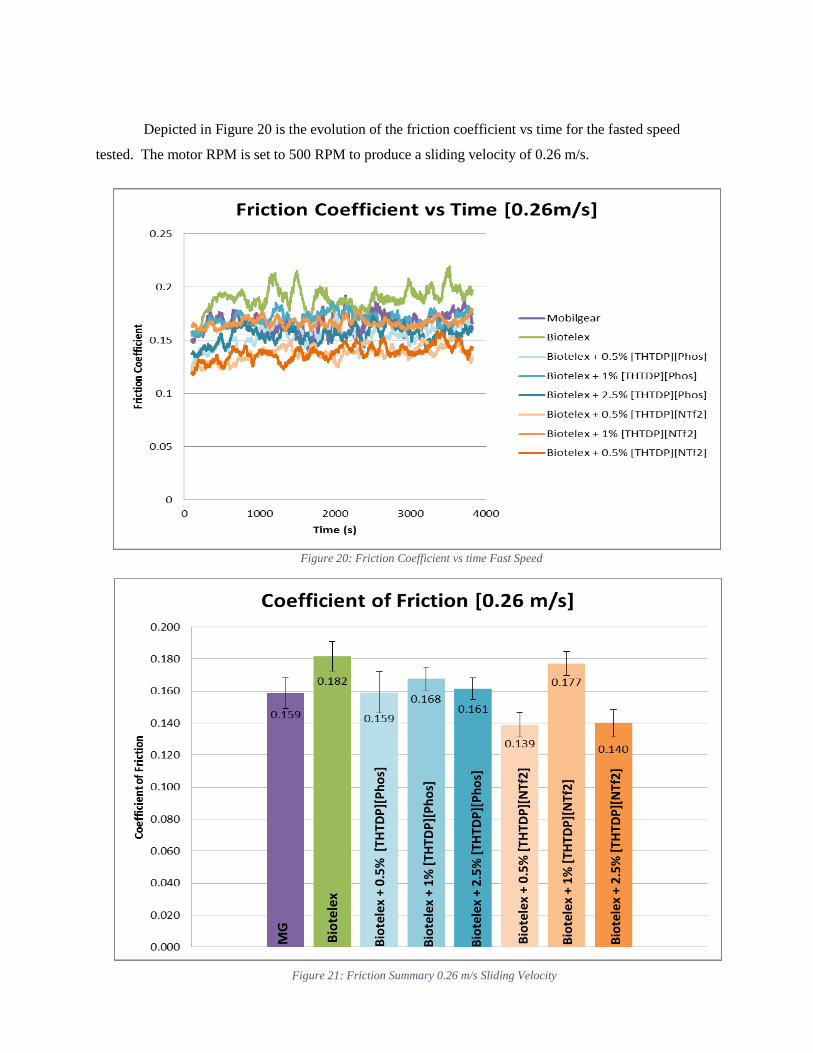
Depicted in Figure 20 is the evolution of the friction coefficient vs time for the fasted speed
tested. The motor RPM is set to 500 RPM to produce a sliding velocity of 0.26 m/s.
Figure 20: Friction Coefficient vs time Fast Speed
MG
Bio
tele
x
Bio
tele
x +
0.5
% [
THTD
P][
Ph
os]
Bio
tele
x +
1%
[TH
TDP
][P
ho
s]
Bio
tele
x +
2.5
% [
THTD
P][
Ph
os]
Bio
tele
x +
0.5
% [
THTD
P][
NTf
2]
Bio
tele
x +
1%
[TH
TDP
][N
Tf2
]
Bio
tele
x +
2.5
% [
THTD
P][
NTf
2]
Figure 21: Friction Summary 0.26 m/s Sliding Velocity
30
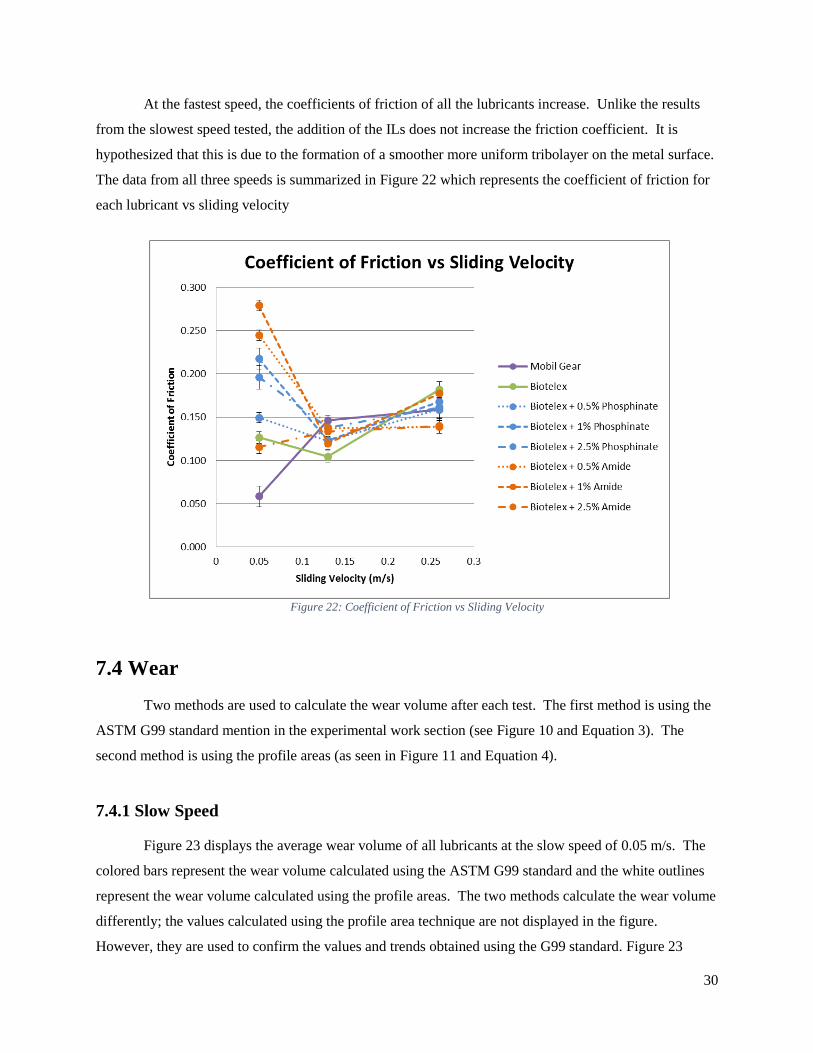
At the fastest speed, the coefficients of friction of all the lubricants increase. Unlike the results
from the slowest speed tested, the addition of the ILs does not increase the friction coefficient. It is
hypothesized that this is due to the formation of a smoother more uniform tribolayer on the metal surface.
The data from all three speeds is summarized in Figure 22 which represents the coefficient of friction for
each lubricant vs sliding velocity
7.4 Wear
Two methods are used to calculate the wear volume after each test. The first method is using the
ASTM G99 standard mention in the experimental work section (see Figure 10 and Equation 3). The
second method is using the profile areas (as seen in Figure 11 and Equation 4).
7.4.1 Slow Speed
Figure 23 displays the average wear volume of all lubricants at the slow speed of 0.05 m/s. The
colored bars represent the wear volume calculated using the ASTM G99 standard and the white outlines
represent the wear volume calculated using the profile areas. The two methods calculate the wear volume
differently; the values calculated using the profile area technique are not displayed in the figure.
However, they are used to confirm the values and trends obtained using the G99 standard. Figure 23
Figure 22: Coefficient of Friction vs Sliding Velocity
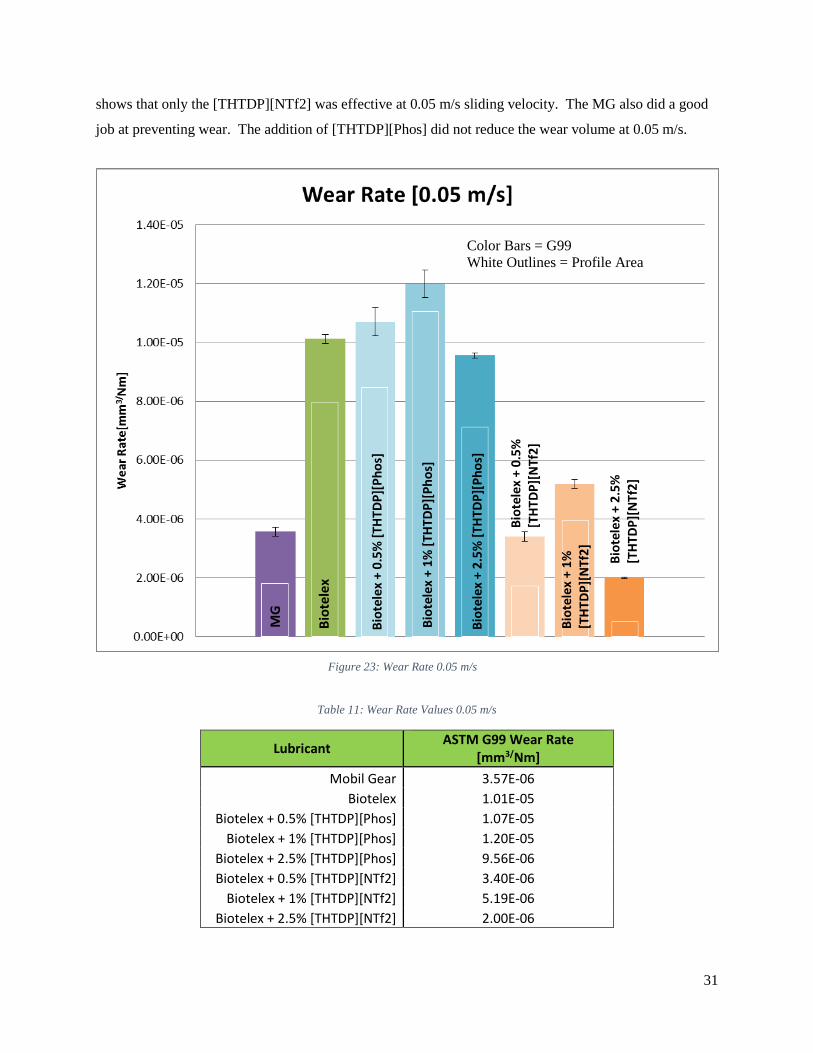
31
shows that only the [THTDP][NTf2] was effective at 0.05 m/s sliding velocity. The MG also did a good
job at preventing wear. The addition of [THTDP][Phos] did not reduce the wear volume at 0.05 m/s.
Table 11: Wear Rate Values 0.05 m/s
Lubricant ASTM G99 Wear Rate
[mm3/Nm]
Mobil Gear 3.57E-06
Biotelex 1.01E-05
Biotelex + 0.5% [THTDP][Phos] 1.07E-05
Biotelex + 1% [THTDP][Phos] 1.20E-05
Biotelex + 2.5% [THTDP][Phos] 9.56E-06
Biotelex + 0.5% [THTDP][NTf2] 3.40E-06
Biotelex + 1% [THTDP][NTf2] 5.19E-06
Biotelex + 2.5% [THTDP][NTf2] 2.00E-06
MG
Bio
tele
x
Bio
tele
x +
0.5
% [
THTD
P][
Ph
os]
Bio
tele
x +
1%
[TH
TDP
][P
ho
s]
Bio
tele
x +
2.5
% [
THTD
P][
Ph
os]
Bio
tele
x +
0.5
%
[TH
TDP
][N
Tf2
]
Bio
tele
x +
1%
[T
HTD
P][
NTf
2] B
iote
lex
+ 2
.5%
[T
HTD
P][
NTf
2]
Colored Bars = ASTM G99
White Outlines = Profile Areas
MG
Bio
tele
x
Bio
tele
x +
0.5
% [
THTD
P][
Ph
os]
Bio
tele
x +
1%
[TH
TDP
][P
ho
s]
Bio
tele
x +
2.5
% [
THTD
P][
Ph
os]
Bio
tele
x +
0.5
%
[TH
TDP
][N
Tf2
]
Bio
tele
x +
1%
[T
HTD
P][
NTf
2]
Bio
tele
x +
2.5
%
[TH
TDP
][N
Tf2
]
Figure 23: Wear Rate 0.05 m/s
Color Bars = G99
White Outlines = Profile Area
32
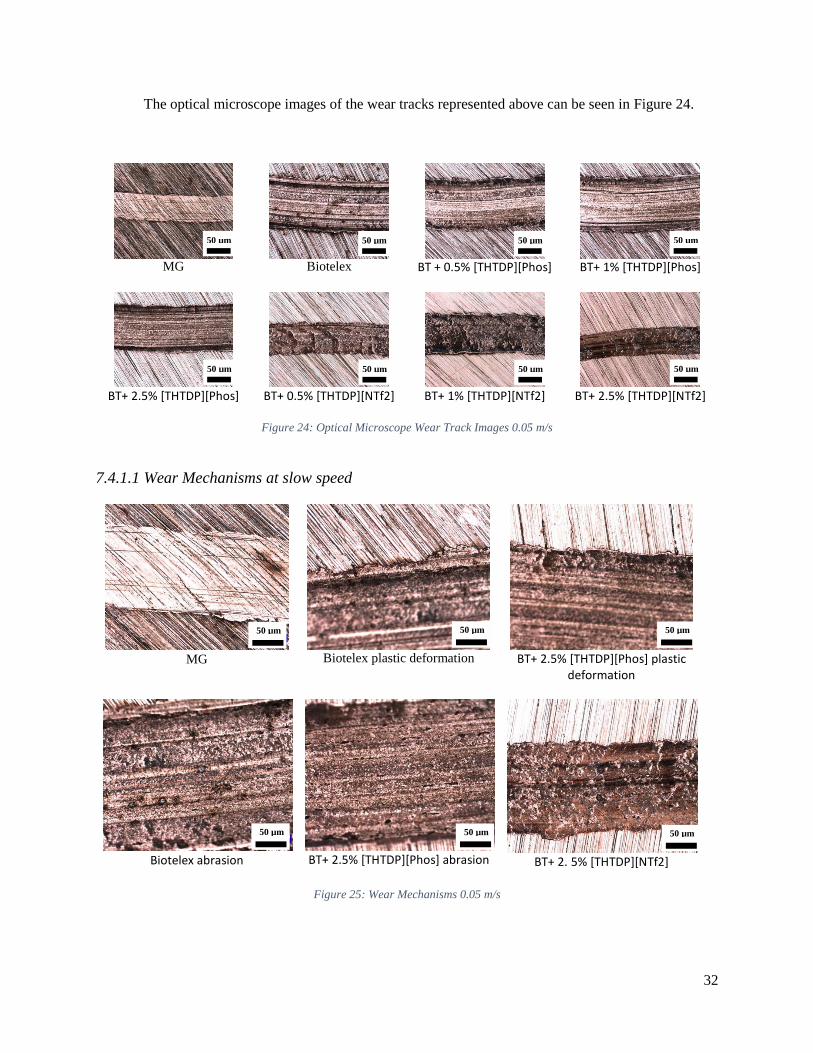
The optical microscope images of the wear tracks represented above can be seen in Figure 24.
MG
Biotelex
BT + 0.5% [THTDP][Phos]
BT+ 1% [THTDP][Phos]
BT+ 2.5% [THTDP][Phos]
BT+ 0.5% [THTDP][NTf2]
BT+ 1% [THTDP][NTf2]
BT+ 2.5% [THTDP][NTf2]
Figure 24: Optical Microscope Wear Track Images 0.05 m/s
7.4.1.1 Wear Mechanisms at slow speed
MG
Biotelex plastic deformation
BT+ 2.5% [THTDP][Phos] plastic
deformation
Biotelex abrasion
BT+ 2.5% [THTDP][Phos] abrasion
BT+ 2. 5% [THTDP][NTf2]
Figure 25: Wear Mechanisms 0.05 m/s
50 µm 50 µm 50 µm 50 µm
50 µm 50 µm 50 µm 50 µm
50 µm 50 µm 50 µm
50 µm 50 µm 50 µm
33
At slow speed, the dominant wear mechanism appears to be abrasive wear. This is indicated by
the parallel scratches and grooves in the wear track, the effects of both ploughing and micro cutting is
evident and can be seen in both Figure 24 and Figure 25. The Mobilgear and BT + [THTDP][NTf2]
mixtures mitigate most of this abrasive wear present with the other mixtures. The addition of
[THTDP][Phos] had no significant effect on wear prevention. In fact, the addition of small amounts of
[THTDP][Phos] increased the wear observed. However, the addition of both IL’s reduced the amount of
plastic deformation present on the edge of the wear tracks. The addition of [THTDP][NTf2] created a
tribocorrosion reaction on the surface, creating a tribolayer, which was effective at mitigating the abrasive
wear and plastic deformation seen with no additives or [THTDP][Phos] additives.
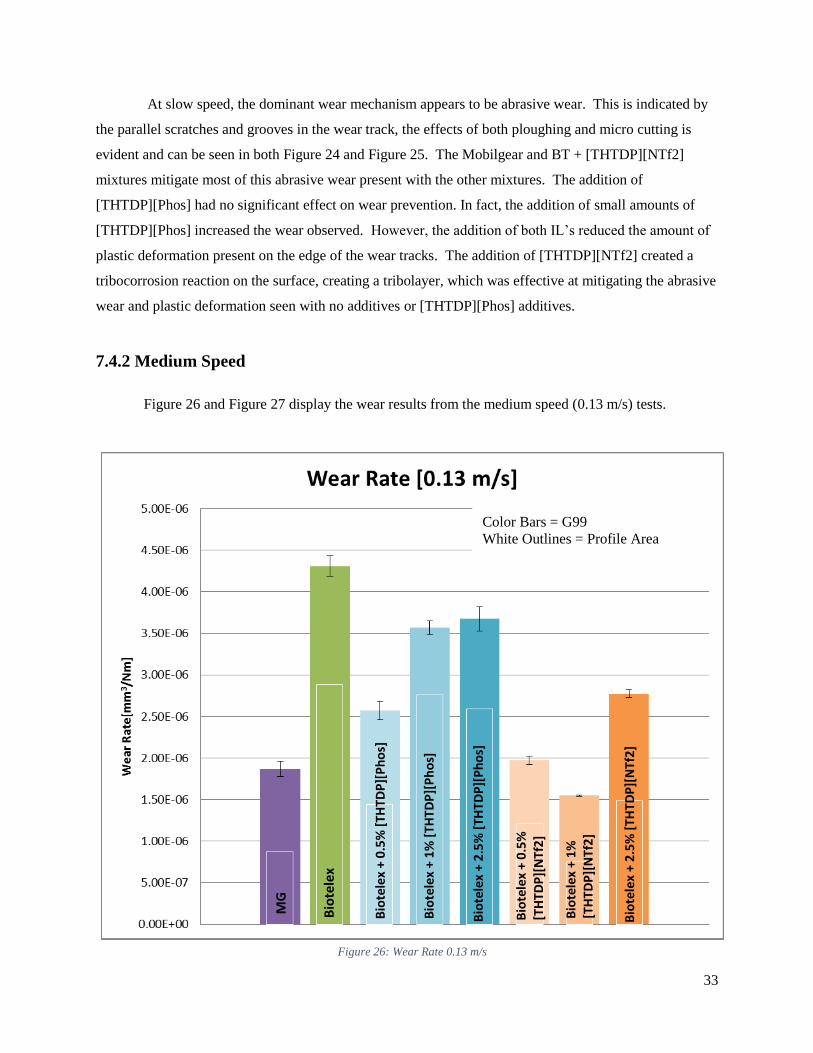
7.4.2 Medium Speed
Figure 26 and Figure 27 display the wear results from the medium speed (0.13 m/s) tests.
Bio
tele
x
Bio
tele
x +
0.5
% [
THTD
P][
Ph
os]
Bio
tele
x +
1%
[TH
TDP
][P
ho
s]
Bio
tele
x +
2.5
% [
THTD
P][
Ph
os]
Bio
tele
x +
0.5
%
[TH
TDP
][N
Tf2
]
Bio
tele
x +
1%
[T
HTD
P][
NTf
2]
Bio
tele
x +
2.5
% [
THTD
P][
NTf
2]
MG
Figure 26: Wear Rate 0.13 m/s
Color Bars = G99
White Outlines = Profile Area
34
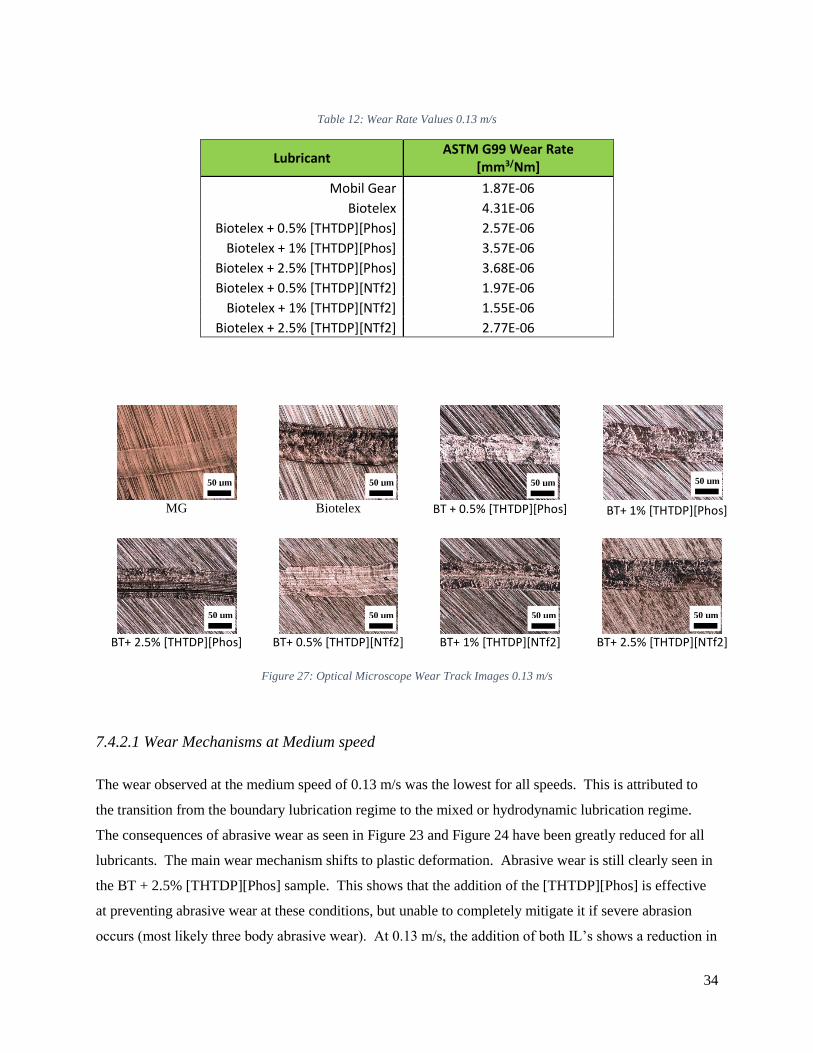
Table 12: Wear Rate Values 0.13 m/s
Lubricant ASTM G99 Wear Rate
[mm3/Nm]
Mobil Gear 1.87E-06
Biotelex 4.31E-06
Biotelex + 0.5% [THTDP][Phos] 2.57E-06
Biotelex + 1% [THTDP][Phos] 3.57E-06
Biotelex + 2.5% [THTDP][Phos] 3.68E-06
Biotelex + 0.5% [THTDP][NTf2] 1.97E-06
Biotelex + 1% [THTDP][NTf2] 1.55E-06
Biotelex + 2.5% [THTDP][NTf2] 2.77E-06
MG
Biotelex
BT + 0.5% [THTDP][Phos]
BT+ 1% [THTDP][Phos]
BT+ 2.5% [THTDP][Phos]
BT+ 0.5% [THTDP][NTf2]
BT+ 1% [THTDP][NTf2]
BT+ 2.5% [THTDP][NTf2]
Figure 27: Optical Microscope Wear Track Images 0.13 m/s
7.4.2.1 Wear Mechanisms at Medium speed
The wear observed at the medium speed of 0.13 m/s was the lowest for all speeds. This is attributed to
the transition from the boundary lubrication regime to the mixed or hydrodynamic lubrication regime.
The consequences of abrasive wear as seen in Figure 23 and Figure 24 have been greatly reduced for all
lubricants. The main wear mechanism shifts to plastic deformation. Abrasive wear is still clearly seen in
the BT + 2.5% [THTDP][Phos] sample. This shows that the addition of the [THTDP][Phos] is effective
at preventing abrasive wear at these conditions, but unable to completely mitigate it if severe abrasion
occurs (most likely three body abrasive wear). At 0.13 m/s, the addition of both IL’s shows a reduction in
50 µm 50 µm 50 µm 50 µm
50 µm 50 µm 50 µm 50 µm
35
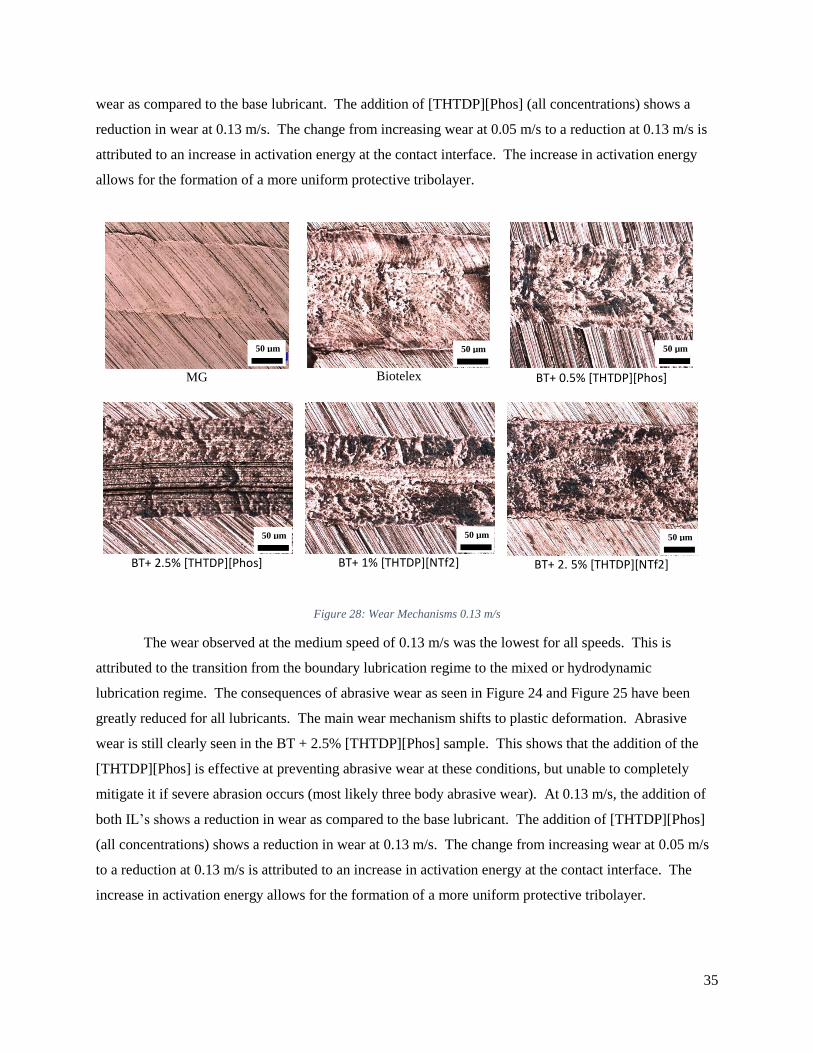
wear as compared to the base lubricant. The addition of [THTDP][Phos] (all concentrations) shows a
reduction in wear at 0.13 m/s. The change from increasing wear at 0.05 m/s to a reduction at 0.13 m/s is
attributed to an increase in activation energy at the contact interface. The increase in activation energy
allows for the formation of a more uniform protective tribolayer.
MG
Biotelex
BT+ 0.5% [THTDP][Phos]
BT+ 2.5% [THTDP][Phos]
BT+ 1% [THTDP][NTf2]
BT+ 2. 5% [THTDP][NTf2]
Figure 28: Wear Mechanisms 0.13 m/s
The wear observed at the medium speed of 0.13 m/s was the lowest for all speeds. This is
attributed to the transition from the boundary lubrication regime to the mixed or hydrodynamic
lubrication regime. The consequences of abrasive wear as seen in Figure 24 and Figure 25 have been
greatly reduced for all lubricants. The main wear mechanism shifts to plastic deformation. Abrasive
wear is still clearly seen in the BT + 2.5% [THTDP][Phos] sample. This shows that the addition of the
[THTDP][Phos] is effective at preventing abrasive wear at these conditions, but unable to completely
mitigate it if severe abrasion occurs (most likely three body abrasive wear). At 0.13 m/s, the addition of
both IL’s shows a reduction in wear as compared to the base lubricant. The addition of [THTDP][Phos]
(all concentrations) shows a reduction in wear at 0.13 m/s. The change from increasing wear at 0.05 m/s
to a reduction at 0.13 m/s is attributed to an increase in activation energy at the contact interface. The
increase in activation energy allows for the formation of a more uniform protective tribolayer.
50 µm 50 µm 50 µm
50 µm 50 µm 50 µm
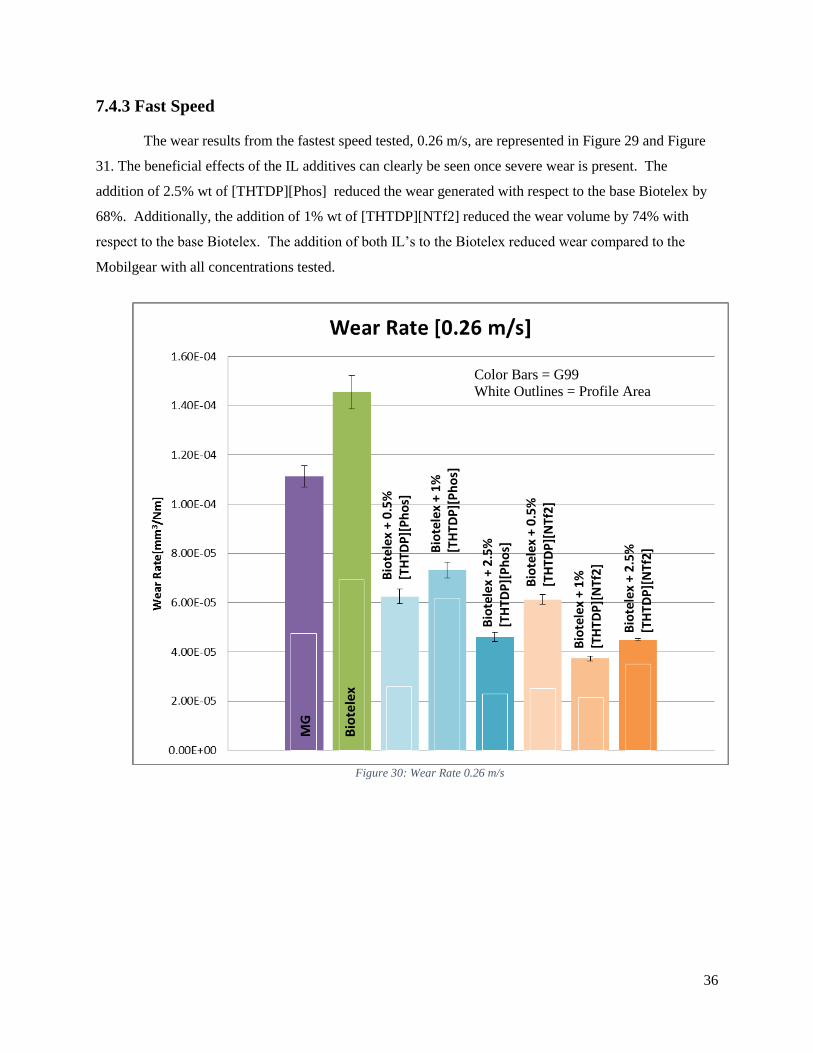
36
7.4.3 Fast Speed
The wear results from the fastest speed tested, 0.26 m/s, are represented in Figure 29 and Figure
31. The beneficial effects of the IL additives can clearly be seen once severe wear is present. The
addition of 2.5% wt of [THTDP][Phos] reduced the wear generated with respect to the base Biotelex by
68%. Additionally, the addition of 1% wt of [THTDP][NTf2] reduced the wear volume by 74% with
respect to the base Biotelex. The addition of both IL’s to the Biotelex reduced wear compared to the
Mobilgear with all concentrations tested.
Bio
tele
x +
0.5
%
[TH
TDP
][P
ho
s]
Bio
tele
x +
1%
[T
HTD
P][
Ph
os]
Bio
tele
x +
2.5
%
[TH
TDP
][P
ho
s]
Bio
tele
x +
1%
[T
HTD
P][
NTf
2]
Bio
tele
x +
0.5
%
[TH
TDP
][N
Tf2
]
Bio
tele
x +
2.5
%
[TH
TDP
][N
Tf2
]
Color Bars = G99
White Outlines = Profile Area
MG
Bio
tele
x
Figure 30: Wear Rate 0.26 m/s
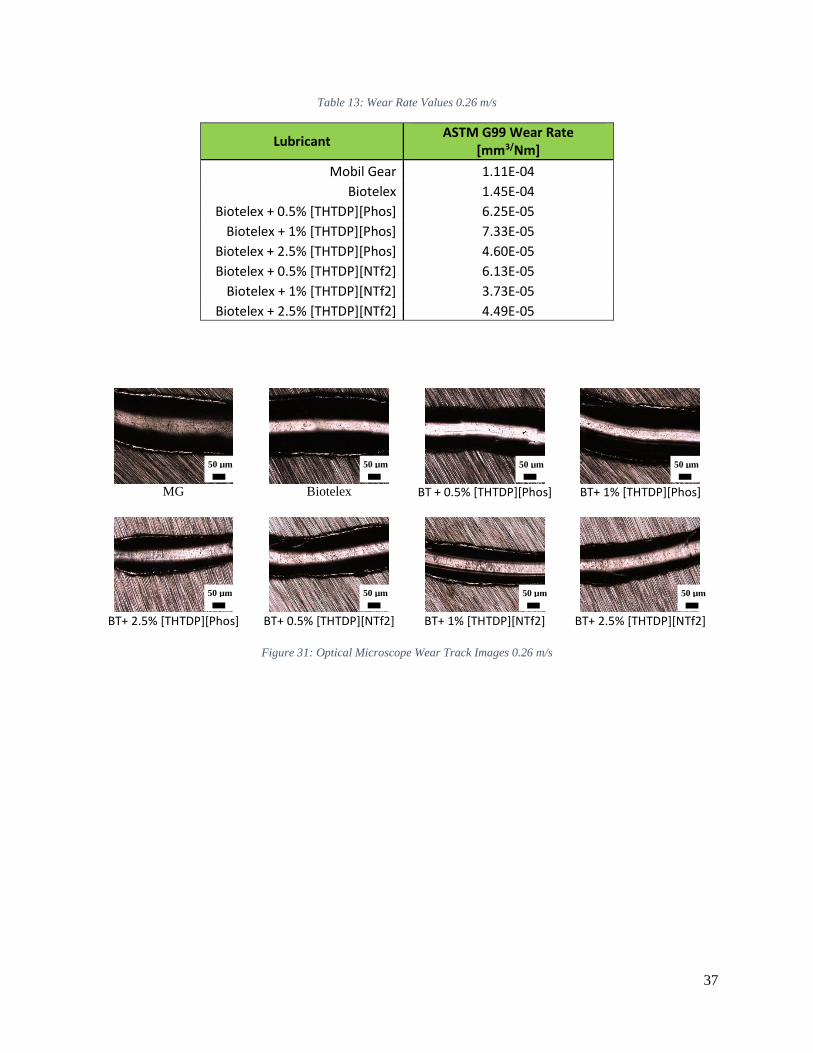
37
Table 13: Wear Rate Values 0.26 m/s
Lubricant ASTM G99 Wear Rate
[mm3/Nm]
Mobil Gear 1.11E-04
Biotelex 1.45E-04
Biotelex + 0.5% [THTDP][Phos] 6.25E-05
Biotelex + 1% [THTDP][Phos] 7.33E-05
Biotelex + 2.5% [THTDP][Phos] 4.60E-05
Biotelex + 0.5% [THTDP][NTf2] 6.13E-05
Biotelex + 1% [THTDP][NTf2] 3.73E-05
Biotelex + 2.5% [THTDP][NTf2] 4.49E-05
MG
Biotelex
BT + 0.5% [THTDP][Phos]
BT+ 1% [THTDP][Phos]
BT+ 2.5% [THTDP][Phos]
BT+ 0.5% [THTDP][NTf2]
BT+ 1% [THTDP][NTf2]
BT+ 2.5% [THTDP][NTf2]
Figure 31: Optical Microscope Wear Track Images 0.26 m/s
50 µm 50 µm 50 µm 50 µm
50 µm 50 µm 50 µm 50 µm
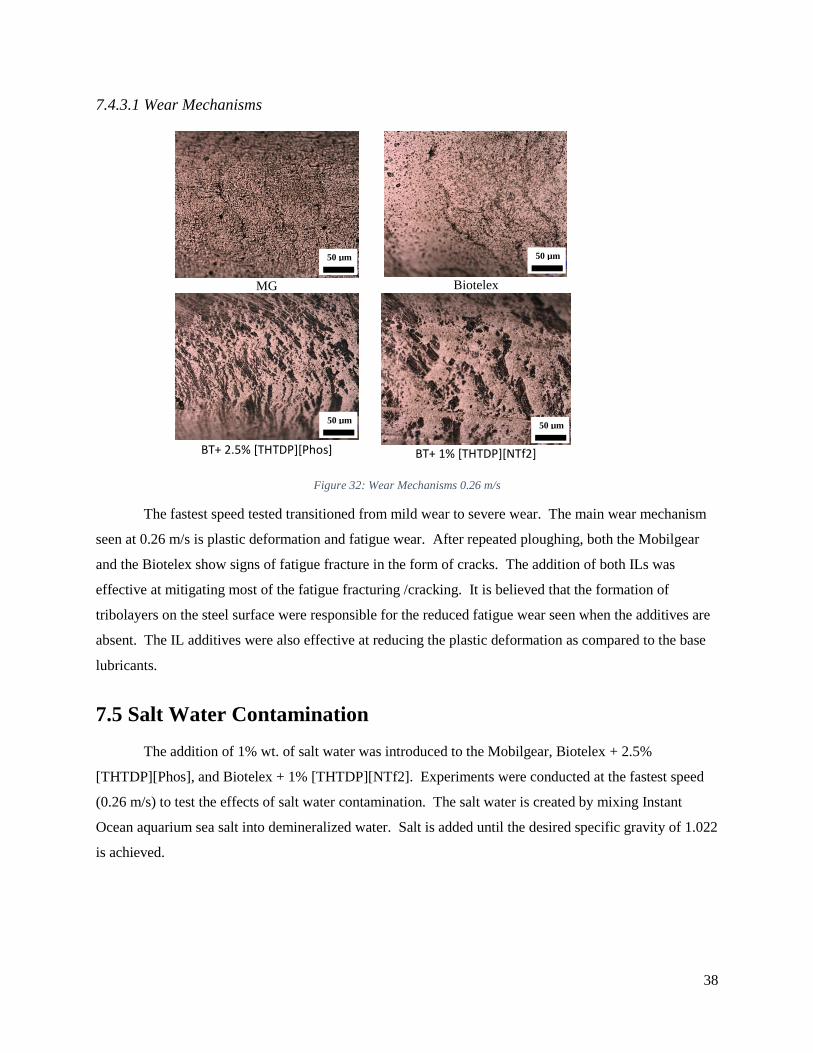
38
7.4.3.1 Wear Mechanisms
MG
Biotelex
BT+ 2.5% [THTDP][Phos]
BT+ 1% [THTDP][NTf2]
Figure 32: Wear Mechanisms 0.26 m/s
The fastest speed tested transitioned from mild wear to severe wear. The main wear mechanism
seen at 0.26 m/s is plastic deformation and fatigue wear. After repeated ploughing, both the Mobilgear
and the Biotelex show signs of fatigue fracture in the form of cracks. The addition of both ILs was
effective at mitigating most of the fatigue fracturing /cracking. It is believed that the formation of
tribolayers on the steel surface were responsible for the reduced fatigue wear seen when the additives are
absent. The IL additives were also effective at reducing the plastic deformation as compared to the base
lubricants.
7.5 Salt Water Contamination
The addition of 1% wt. of salt water was introduced to the Mobilgear, Biotelex + 2.5%
[THTDP][Phos], and Biotelex + 1% [THTDP][NTf2]. Experiments were conducted at the fastest speed
(0.26 m/s) to test the effects of salt water contamination. The salt water is created by mixing Instant
Ocean aquarium sea salt into demineralized water. Salt is added until the desired specific gravity of 1.022
is achieved.
50 µm 50 µm
50 µm 50 µm
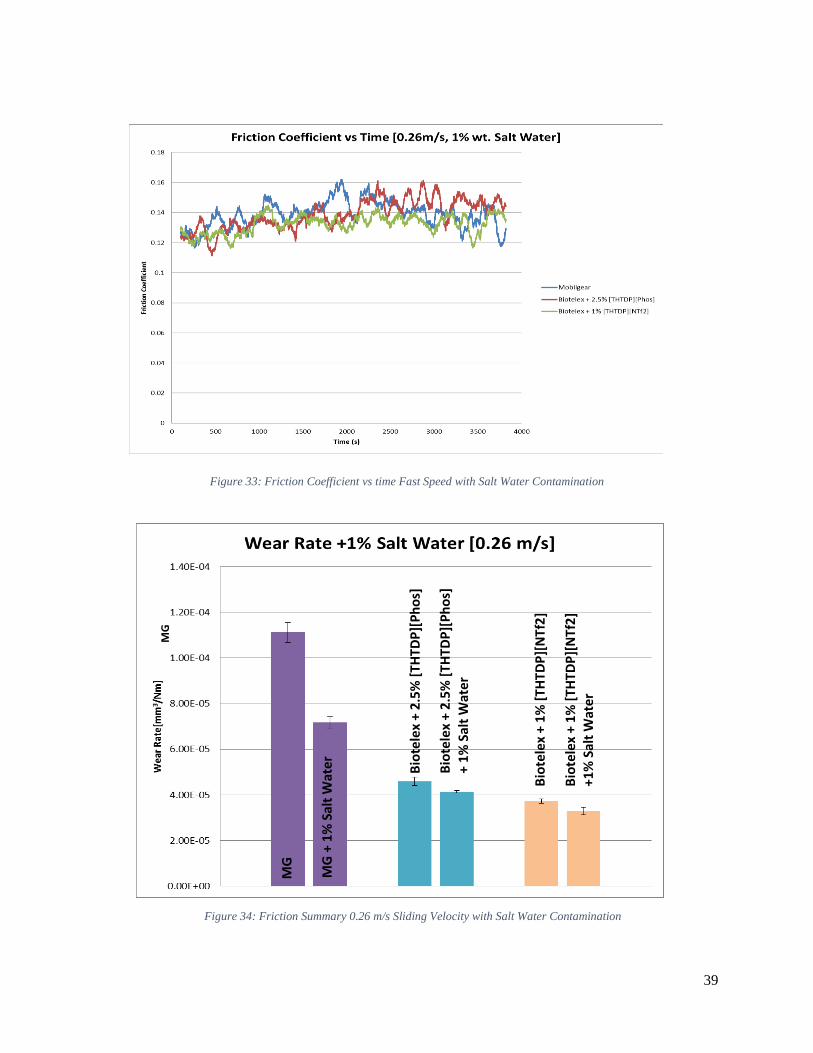
39
Figure 33: Friction Coefficient vs time Fast Speed with Salt Water Contamination
Figure 34: Friction Summary 0.26 m/s Sliding Velocity with Salt Water Contamination
MG
MG
+ 1
% S
alt
Wat
er
Bio
tele
x +
2.5
% [
THTD
P][
Ph
os]
Bio
tele
x +
2.5
% [
THTD
P][
Ph
os]
+
1%
Sal
t W
ate
r
Bio
tele
x +
1%
[TH
TDP
][N
Tf2
] B
iote
lex
+ 1
% [
THTD
P][
NTf
2]
+1%
Sal
t W
ate
r
MG
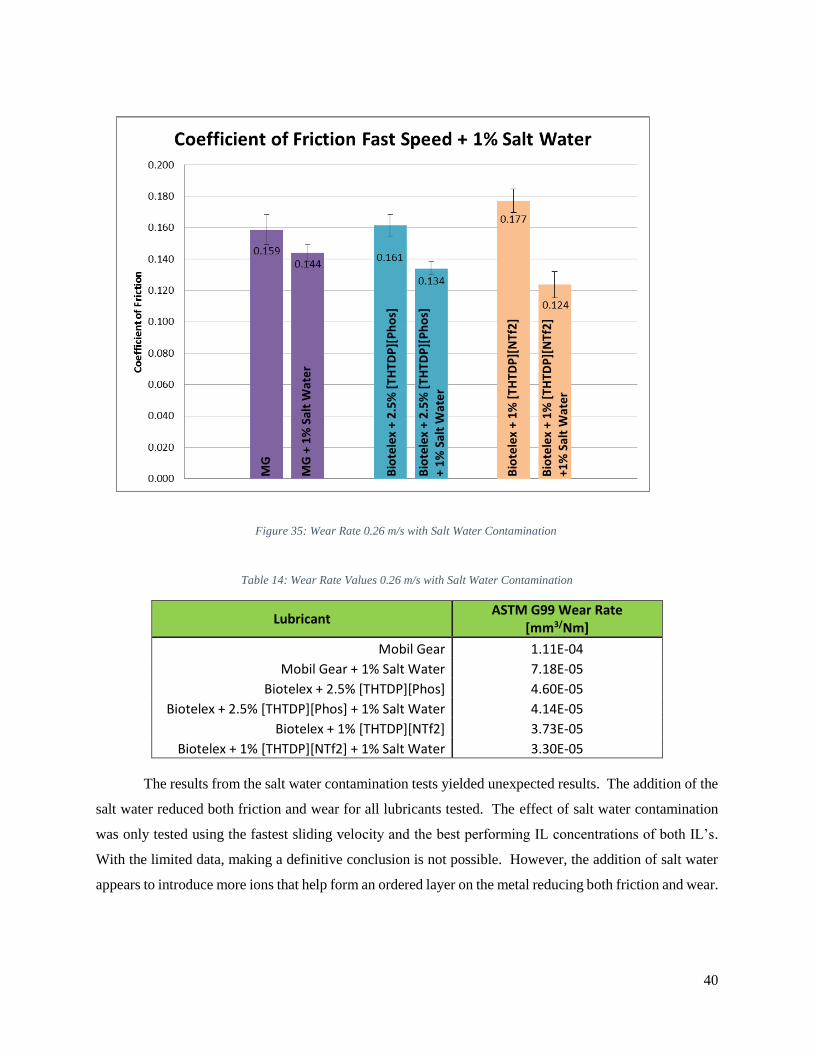
40
Table 14: Wear Rate Values 0.26 m/s with Salt Water Contamination
Lubricant ASTM G99 Wear Rate
[mm3/Nm]
Mobil Gear 1.11E-04
Mobil Gear + 1% Salt Water 7.18E-05
Biotelex + 2.5% [THTDP][Phos] 4.60E-05
Biotelex + 2.5% [THTDP][Phos] + 1% Salt Water 4.14E-05
Biotelex + 1% [THTDP][NTf2] 3.73E-05
Biotelex + 1% [THTDP][NTf2] + 1% Salt Water 3.30E-05
The results from the salt water contamination tests yielded unexpected results. The addition of the
salt water reduced both friction and wear for all lubricants tested. The effect of salt water contamination
was only tested using the fastest sliding velocity and the best performing IL concentrations of both IL’s.
With the limited data, making a definitive conclusion is not possible. However, the addition of salt water
appears to introduce more ions that help form an ordered layer on the metal reducing both friction and wear.
Figure 35: Wear Rate 0.26 m/s with Salt Water Contamination
MG
+ 1
% S
alt
Wat
er
Bio
tele
x +
2.5
% [
TH
TD
P][
Ph
os]
Bio
tele
x +
2.5
% [
TH
TD
P][
Ph
os]
+
1%
Sal
t W
ate
r
Bio
tele
x +
1%
[TH
TDP
][N
Tf2
] B
iote
lex
+ 1
% [
THTD
P][
NTf
2]
+1%
Sal
t W
ate
r M
G
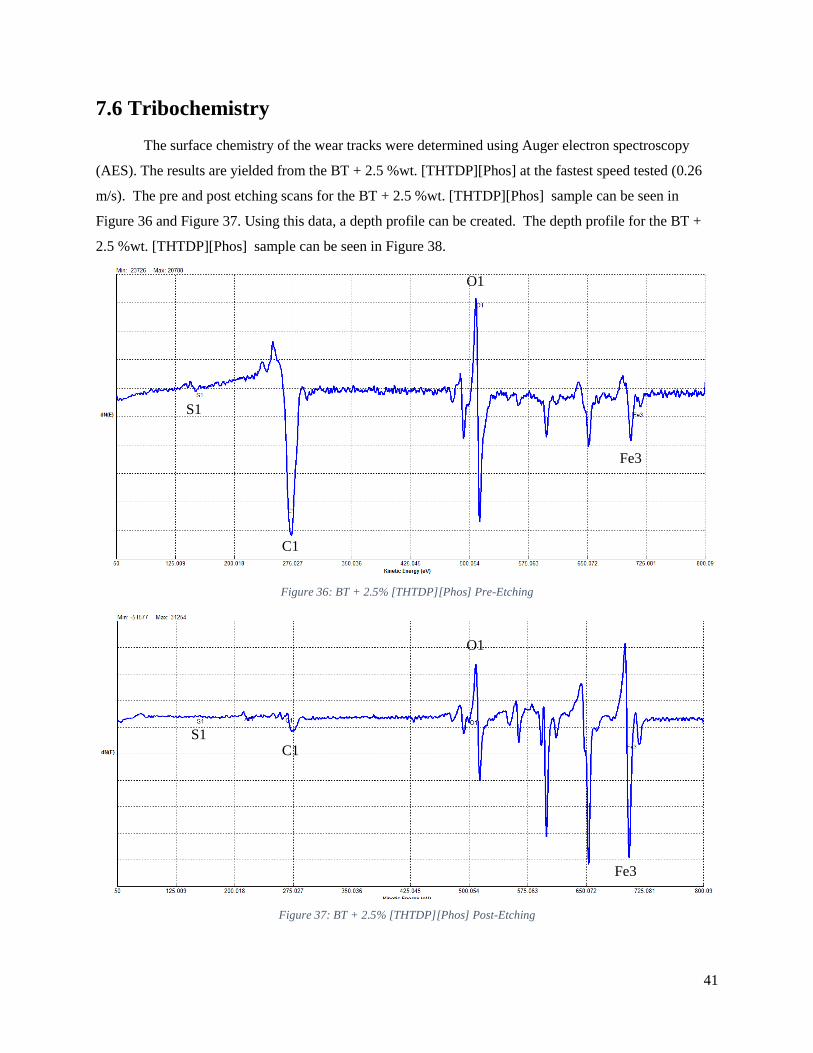
41
7.6 Tribochemistry
The surface chemistry of the wear tracks were determined using Auger electron spectroscopy
(AES). The results are yielded from the BT + 2.5 %wt. [THTDP][Phos] at the fastest speed tested (0.26
m/s). The pre and post etching scans for the BT + 2.5 %wt. [THTDP][Phos] sample can be seen in
Figure 36 and Figure 37. Using this data, a depth profile can be created. The depth profile for the BT +
2.5 %wt. [THTDP][Phos] sample can be seen in Figure 38.
Figure 36: BT + 2.5% [THTDP][Phos] Pre-Etching
Figure 37: BT + 2.5% [THTDP][Phos] Post-Etching
S1
C1
O1
Fe3
S1 C1
O1
Fe3
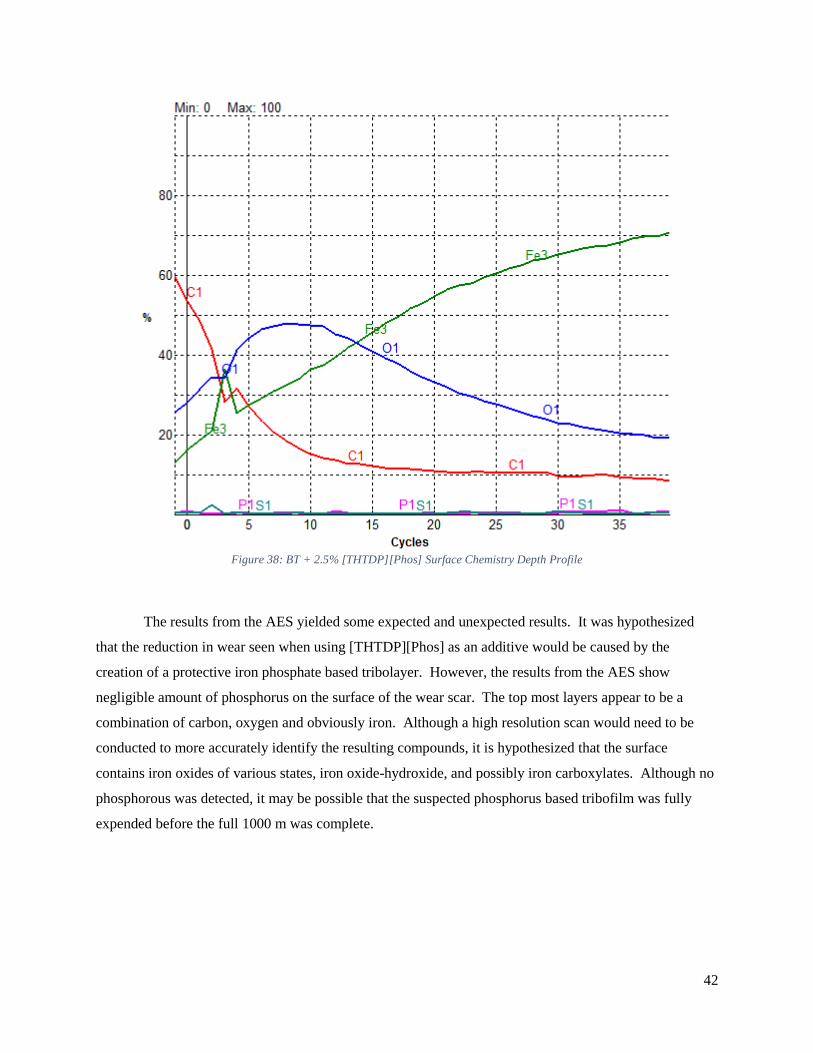
42
Figure 38: BT + 2.5% [THTDP][Phos] Surface Chemistry Depth Profile
The results from the AES yielded some expected and unexpected results. It was hypothesized
that the reduction in wear seen when using [THTDP][Phos] as an additive would be caused by the
creation of a protective iron phosphate based tribolayer. However, the results from the AES show
negligible amount of phosphorus on the surface of the wear scar. The top most layers appear to be a
combination of carbon, oxygen and obviously iron. Although a high resolution scan would need to be
conducted to more accurately identify the resulting compounds, it is hypothesized that the surface
contains iron oxides of various states, iron oxide-hydroxide, and possibly iron carboxylates. Although no
phosphorous was detected, it may be possible that the suspected phosphorus based tribofilm was fully
expended before the full 1000 m was complete.
43
8 Conclusions
The tribological effects of using two ionic liquids as additives to a bio-oil was studied. A
halogen-free and halogenated IL additive were compared against each other as well as against a fully
formulated, high performance synthetic oil. The effects of IL additive concentration and sliding velocity
were studied. Conclusions from the results of the research can be summarized with a few points.
1.) The use of ionic liquids as lubricant additives reduced friction and wear under the most severe
conditions tested, namely, a contact pressure of 2.74 GPa and a sliding velocity of 0.26 m/s. At
the optimal concentration of 1% [THTDP][NTf2], a wear reduction of 74% was achieved with
respect to the base Biotelex. A 66% reduction was observed with respect to the Mobilgear.
Similarly, the optimal concentration of 2.5% [THTDP][Phos] displayed a 68% wear reduction
compared to the base Biotelex and a 58% reduction compared to the Mobilgear.
2.) Optimal IL concentration is based on specific conditions. At 0.26 m/s optimal concentrations
were 2.5 wt.% for [THTDP][Phos] and 1 wt.% for [THTDP][NTf2]
3.) Halogen-free ionic liquids can perform similarly to ionic liquids that contain halogen elements
under the most sever conditions tested (2.74 GPa contact pressure and a sliding velocity of 0.26
m/s).
4.) The use of ionic liquid additives in wind turbine gear oil may offer improvements from a
performance standpoint, especially under severe loading conditions such as torque reversals.
44
8.1 Future Research
The research presented poses as a good stepping stone for future research. Many things were
learned along the way and some positive conclusions reached. The use of ionic liquids as lubricant
additives should continue to be studied. The research conducted in this paper can easily be built upon.
Recommendations for future studies are as follows. Firstly, both ionic liquids used in this study
contained the same cation and different anions. It would be beneficial to begin to understand the cation
effects by studying the performance of ionic liquids with the same anion and different cations. The ionic
liquids used in this study are also commercially available. The range of ionic liquids that can be tested
are far greater if they are able to be synthesized in a lab. Additionally, if lab synthesis is used, the ionic
liquids may be tailored to augment their effects further; for example, more reactive, better lubricant
synergy, targeted surface chemistry etc. The results from the salt water contamination tests also pose an
interesting topic. The interaction of the salt water with the metal surface may also have some interesting
effects that aid in wear prevention. The effects of the salt water were only tested under one condition (the
fastest speed, therefore shortest duration). Adverse effects may be found with longer testing periods.
Lastly, a more thorough study of the surface chemistry is also recommended. Using less severe testing
conditions, and more analysis time for XPS/AES the surface interactions may be better understood.
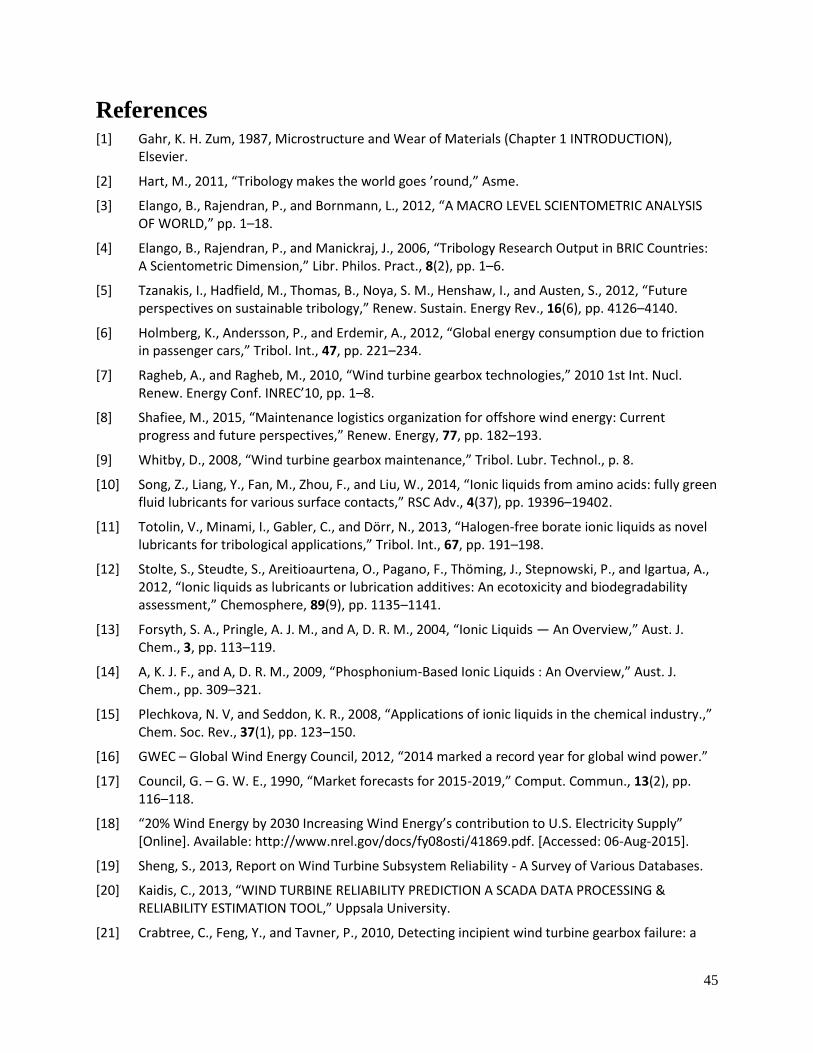
45
References [1] Gahr, K. H. Zum, 1987, Microstructure and Wear of Materials (Chapter 1 INTRODUCTION),
Elsevier.
[2] Hart, M., 2011, “Tribology makes the world goes ’round,” Asme.
[3] Elango, B., Rajendran, P., and Bornmann, L., 2012, “A MACRO LEVEL SCIENTOMETRIC ANALYSIS OF WORLD,” pp. 1–18.
[4] Elango, B., Rajendran, P., and Manickraj, J., 2006, “Tribology Research Output in BRIC Countries: A Scientometric Dimension,” Libr. Philos. Pract., 8(2), pp. 1–6.
[5] Tzanakis, I., Hadfield, M., Thomas, B., Noya, S. M., Henshaw, I., and Austen, S., 2012, “Future perspectives on sustainable tribology,” Renew. Sustain. Energy Rev., 16(6), pp. 4126–4140.
[6] Holmberg, K., Andersson, P., and Erdemir, A., 2012, “Global energy consumption due to friction in passenger cars,” Tribol. Int., 47, pp. 221–234.
[7] Ragheb, A., and Ragheb, M., 2010, “Wind turbine gearbox technologies,” 2010 1st Int. Nucl. Renew. Energy Conf. INREC’10, pp. 1–8.
[8] Shafiee, M., 2015, “Maintenance logistics organization for offshore wind energy: Current progress and future perspectives,” Renew. Energy, 77, pp. 182–193.
[9] Whitby, D., 2008, “Wind turbine gearbox maintenance,” Tribol. Lubr. Technol., p. 8.
[10] Song, Z., Liang, Y., Fan, M., Zhou, F., and Liu, W., 2014, “Ionic liquids from amino acids: fully green fluid lubricants for various surface contacts,” RSC Adv., 4(37), pp. 19396–19402.
[11] Totolin, V., Minami, I., Gabler, C., and Dörr, N., 2013, “Halogen-free borate ionic liquids as novel lubricants for tribological applications,” Tribol. Int., 67, pp. 191–198.
[12] Stolte, S., Steudte, S., Areitioaurtena, O., Pagano, F., Thöming, J., Stepnowski, P., and Igartua, A., 2012, “Ionic liquids as lubricants or lubrication additives: An ecotoxicity and biodegradability assessment,” Chemosphere, 89(9), pp. 1135–1141.
[13] Forsyth, S. A., Pringle, A. J. M., and A, D. R. M., 2004, “Ionic Liquids — An Overview,” Aust. J. Chem., 3, pp. 113–119.
[14] A, K. J. F., and A, D. R. M., 2009, “Phosphonium-Based Ionic Liquids : An Overview,” Aust. J. Chem., pp. 309–321.
[15] Plechkova, N. V, and Seddon, K. R., 2008, “Applications of ionic liquids in the chemical industry.,” Chem. Soc. Rev., 37(1), pp. 123–150.
[16] GWEC – Global Wind Energy Council, 2012, “2014 marked a record year for global wind power.”
[17] Council, G. – G. W. E., 1990, “Market forecasts for 2015-2019,” Comput. Commun., 13(2), pp. 116–118.
[18] “20% Wind Energy by 2030 Increasing Wind Energy’s contribution to U.S. Electricity Supply” [Online]. Available: http://www.nrel.gov/docs/fy08osti/41869.pdf. [Accessed: 06-Aug-2015].
[19] Sheng, S., 2013, Report on Wind Turbine Subsystem Reliability - A Survey of Various Databases.
[20] Kaidis, C., 2013, “WIND TURBINE RELIABILITY PREDICTION A SCADA DATA PROCESSING & RELIABILITY ESTIMATION TOOL,” Uppsala University.
[21] Crabtree, C., Feng, Y., and Tavner, P., 2010, Detecting incipient wind turbine gearbox failure: a
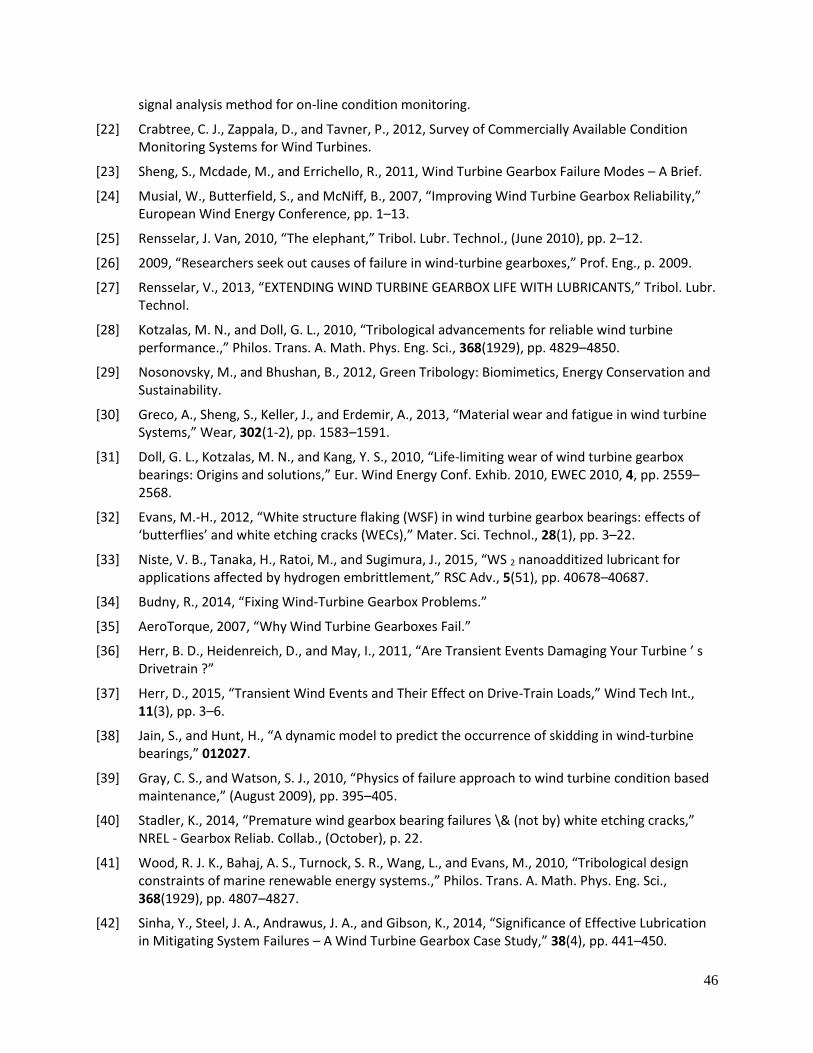
46
signal analysis method for on-line condition monitoring.
[22] Crabtree, C. J., Zappala, D., and Tavner, P., 2012, Survey of Commercially Available Condition Monitoring Systems for Wind Turbines.
[23] Sheng, S., Mcdade, M., and Errichello, R., 2011, Wind Turbine Gearbox Failure Modes – A Brief.
[24] Musial, W., Butterfield, S., and McNiff, B., 2007, “Improving Wind Turbine Gearbox Reliability,” European Wind Energy Conference, pp. 1–13.
[25] Rensselar, J. Van, 2010, “The elephant,” Tribol. Lubr. Technol., (June 2010), pp. 2–12.
[26] 2009, “Researchers seek out causes of failure in wind-turbine gearboxes,” Prof. Eng., p. 2009.
[27] Rensselar, V., 2013, “EXTENDING WIND TURBINE GEARBOX LIFE WITH LUBRICANTS,” Tribol. Lubr. Technol.
[28] Kotzalas, M. N., and Doll, G. L., 2010, “Tribological advancements for reliable wind turbine performance.,” Philos. Trans. A. Math. Phys. Eng. Sci., 368(1929), pp. 4829–4850.
[29] Nosonovsky, M., and Bhushan, B., 2012, Green Tribology: Biomimetics, Energy Conservation and Sustainability.
[30] Greco, A., Sheng, S., Keller, J., and Erdemir, A., 2013, “Material wear and fatigue in wind turbine Systems,” Wear, 302(1-2), pp. 1583–1591.
[31] Doll, G. L., Kotzalas, M. N., and Kang, Y. S., 2010, “Life-limiting wear of wind turbine gearbox bearings: Origins and solutions,” Eur. Wind Energy Conf. Exhib. 2010, EWEC 2010, 4, pp. 2559–2568.
[32] Evans, M.-H., 2012, “White structure flaking (WSF) in wind turbine gearbox bearings: effects of ‘butterflies’ and white etching cracks (WECs),” Mater. Sci. Technol., 28(1), pp. 3–22.
[33] Niste, V. B., Tanaka, H., Ratoi, M., and Sugimura, J., 2015, “WS 2 nanoadditized lubricant for applications affected by hydrogen embrittlement,” RSC Adv., 5(51), pp. 40678–40687.
[34] Budny, R., 2014, “Fixing Wind-Turbine Gearbox Problems.”
[35] AeroTorque, 2007, “Why Wind Turbine Gearboxes Fail.”
[36] Herr, B. D., Heidenreich, D., and May, I., 2011, “Are Transient Events Damaging Your Turbine ’ s Drivetrain ?”
[37] Herr, D., 2015, “Transient Wind Events and Their Effect on Drive-Train Loads,” Wind Tech Int., 11(3), pp. 3–6.
[38] Jain, S., and Hunt, H., “A dynamic model to predict the occurrence of skidding in wind-turbine bearings,” 012027.
[39] Gray, C. S., and Watson, S. J., 2010, “Physics of failure approach to wind turbine condition based maintenance,” (August 2009), pp. 395–405.
[40] Stadler, K., 2014, “Premature wind gearbox bearing failures \& (not by) white etching cracks,” NREL - Gearbox Reliab. Collab., (October), p. 22.
[41] Wood, R. J. K., Bahaj, A. S., Turnock, S. R., Wang, L., and Evans, M., 2010, “Tribological design constraints of marine renewable energy systems.,” Philos. Trans. A. Math. Phys. Eng. Sci., 368(1929), pp. 4807–4827.
[42] Sinha, Y., Steel, J. A., Andrawus, J. A., and Gibson, K., 2014, “Significance of Effective Lubrication in Mitigating System Failures – A Wind Turbine Gearbox Case Study,” 38(4), pp. 441–450.
47
[43] Fernandes, C. M. C. G., Marques, P. M. T., Martins, R. C., and Seabra, J. H. O., 2015, “Film thickness and traction curves of wind turbine gear oils,” Tribol. Int., 86, pp. 1–9.
[44] Pohrer, B., Zuercher, M., Westerholt, A., Bösmann, A., Siebert, D., Völkl, J., Holweger, W., Wehrum, N., Arlt, W., Wasserscheid, P., and Schlücker, E., 2015, “CO 2 as a Viscosity Index Improver for Wind Turbine Oils,” Ind. Eng. Chem. Res., 54(21), pp. 5810–5819.
[45] Mubarok, F., Armada, S., Fagoaga, I., and Espallargas, N., 2013, “Thermally sprayed SiC coatings for offshore wind turbine bearing applications,” J. Therm. Spray Technol., 22(8), pp. 1303–1309.
[46] Greco, A., Mistry, K., Sista, V., Eryilmaz, O., and Erdemir, A., 2011, “Friction and wear behaviour of boron based surface treatment and nano-particle lubricant additives for wind turbine gearbox applications,” Wear, 271(9-10), pp. 1754–1760.
[47] Evans, R. D., Doll, G. L., Hager, C. H., and Howe, J. Y., 2010, “Influence of steel type on the propensity for tribochemical wear in boundary lubrication with a wind turbine gear oil,” Tribol. Lett., 38(1), pp. 25–32.
[48] Muller, J., and Errichello, R., 2002, “Oil Cleanliness in Wind Turbine Gearboxes,” Mach. Lubr., pp. 1–5.
[49] Needelman, B. W. M., Barris, M. a, and Lavallee, G. L., 2009, “Contamination Control for Wind Turbine Gearboxes,” Power Eng., 5(November), pp. 1–3.
[50] Keskin, S., Kayrak-Talay, D., Akman, U., and Hortaçsu, Ö., 2007, “A review of ionic liquids towards supercritical fluid applications,” J. Supercrit. Fluids, 43(1), pp. 150–180.
[51] Armand, M., Endres, F., MacFarlane, D. R., Ohno, H., and Scrosati, B., 2009, “Ionic-liquid materials for the electrochemical challenges of the future.,” Nat. Mater., 8(8), pp. 621–629.
[52] Zhao, D., Wu, M., Kou, Y., and Min, E., 2002, “Ionic liquids: Applications in catalysis,” Catal. Today, 74(1-2), pp. 157–189.
[53] Olivier-Bourbigou, H., Magna, L., and Morvan, D., 2010, “Ionic liquids and catalysis: Recent progress from knowledge to applications,” Appl. Catal. A Gen., 373(1-2), pp. 1–56.
[54] Pandey, S., 2006, “Analytical applications of room-temperature ionic liquids: A review of recent efforts,” Anal. Chim. Acta, 556(1), pp. 38–45.
[55] Valkenburg, M. E. Van, Vaughn, R. L., Williams, M., and Wilkes, J. S., 2005, “Thermochemistry of ionic liquid heat-transfer fluids,” Thermochim. Acta, 425(1-2), pp. 181–188.
[56] Minami, I., 2009, “Ionic liquids in tribology.,” Molecules, 14(6), pp. 2286–2305.
[57] Bermúdez, M. D., Jiménez, A. E., Sanes, J., and Carrión, F. J., 2009, “Ionic liquids as advanced lubricant fluids,” Molecules, 14(8), pp. 2888–2908.
[58] Reeves, C. J., Garvey, S., Menezes, P. L., Dietz, M., Jen, T., and Lovell, M. R., 2015, “Tribological Performance of Environmentally Friendly Ionic Liquid Lubricants,” pp. 7–9.
[59] Thuy Pham, T. P., Cho, C. W., and Yun, Y. S., 2010, “Environmental fate and toxicity of ionic liquids: A review,” Water Res., 44(2), pp. 352–372.
[60] Wells, A. S., and Coombe, V. T., 2006, “On the freshwater ecotoxicity and biodegradation properties of some common ionic liquids,” Org. Process Res. Dev., 10(4), pp. 794–798.
[61] Romero, a., Santos, a., Tojo, J., and Rodríguez, a., 2008, “Toxicity and biodegradability of imidazolium ionic liquids,” J. Hazard. Mater., 151(1), pp. 268–273.
[62] Zhao, D., Liao, Y., and Zhang, Z. D., 2007, “Toxicity of ionic liquids,” Clean - Soil, Air, Water, 35(1),
48
pp. 42–48.
[63] Matthias, M., Klemens, M., and Uwe, V., 2005, “BASILTM—BASF’s Processes Based on Ionic Liquids _ Sigma-Aldrich,” Chemfiles, p. 4.
[64] Wu, B., Reddy, R. G., and Rogers, R. D., 2001, “Novel ionic liquid thermal storage for solar thermal electric power systems,” Solar Energy: The Power to Choose, pp. 445–452.
[65] Bridges, N. J., Visser, A. E., and Fox, E. B., 2011, “The Potential of Nanoparticle Enhanced Ionic Liquids (NEILs) as Advanced Heat Transfer Fluids,” Energy & Fuels, p. 110926144335005.
[66] Ye, C., Liu, W., Chen, Y., and Yu, L., 2001, “Room-temperature ionic liquids: a novel versatile lubricant.,” Chem. Commun. (Camb)., (21), pp. 2244–2245.
[67] Liu, X., Zhou, F., Liang, Y., and Liu, W., 2006, “Tribological performance of phosphonium based ionic liquids for an aluminum-on-steel system and opinions on lubrication mechanism,” Wear, 261(10), pp. 1174–1179.
[68] Jiménez, a. E., Bermúdez, M. D., Iglesias, P., Carrión, F. J., and Martínez-Nicolás, G., 2006, “1-N-alkyl -3-methylimidazolium ionic liquids as neat lubricants and lubricant additives in steel-aluminium contacts,” Wear, 260(7-8), pp. 766–782.
[69] Zhou, F., Liang, Y., and Liu, W., 2009, “Ionic liquid lubricants: designed chemistry for engineering applications.,” Chem. Soc. Rev., 38(9), pp. 2590–2599.
[70] Mu, Z., Zhou, F., Zhang, S., Liang, Y., and Liu, W., 2005, “Effect of the functional groups in ionic liquid molecules on the friction and wear behavior of aluminum alloy in lubricated aluminum-on-steel contact,” Tribol. Int., 38(8), pp. 725–731.
[71] Wang, H., Lu, Q., Ye, C., Liu, W., and Cui, Z., 2004, “Friction and wear behaviors of ionic liquid of alkylimidazolium hexafluorophosphates as lubricants for steel/steel contact,” Wear, 256(1-2), pp. 44–48.
[72] Battez, a. H., González, R., Viesca, J. L., Blanco, D., Asedegbega, E., and Osorio, a., 2009, “Tribological behaviour of two imidazolium ionic liquids as lubricant additives for steel/steel contacts,” Wear, 266(11-12), pp. 1224–1228.
[73] Cai, M., Liang, Y., Yao, M., Xia, Y., Zhou, F., and Liu, W., 2010, “Imidazolium ionic liquids as antiwear and antioxidant additive in poly(ethylene glycol) for steel/steel contacts,” ACS Appl. Mater. Interfaces, 2(3), pp. 870–876.
[74] Totolin, V., Minami, I., Gabler, C., Brenner, J., and Dörr, N., 2014, “Lubrication mechanism of phosphonium phosphate ionic liquid additive in alkylborane-imidazole complexes,” Tribol. Lett., 53(2), pp. 421–432.
[75] Minami, I., Inada, T., Sasaki, R., and Nanao, H., 2010, “Tribo-chemistry of phosphonium-derived ionic liquids,” Tribol. Lett., 40(2), pp. 225–235.
[76] Fernandes, C. M. C. G., Martins, R. C., and Seabra, J. H. O., 2013, “Friction torque of thrust ball bearings lubricated with wind turbine gear oils,” Tribol. Int., 58, pp. 47–54.
[77] Xiao, H., Guo, D., Liu, S., Pan, G., and Lu, X., 2011, “Film thickness of ionic liquids under high contact pressures as a function of alkyl chain length,” Tribol. Lett., 41(2), pp. 471–477.
[78] Monge, R., González, R., Hernández Battez, a., Fernández-González, a., Viesca, J. L., García, a., and Hadfield, M., 2015, “Ionic liquids as an additive in fully formulated wind turbine gearbox oils,” Wear, 328-329, pp. 50–63.

49
[79] Fernandes, C. M. C. G., Battez, a. H., González, R., Monge, R., Viesca, J. L., García, a., Martins, R. C., and Seabra, J. H. O., 2015, “Torque loss and wear of FZG gears lubricated with wind turbine gear oils using an ionic liquid as additive,” Tribol. Int., 90, pp. 306–314.
[80] Winkelmann, L., 2011, “Surface Roughness and Micropitting,” NREL Wind turbine tribology seminar.
[81] Application, C., and Lubricants, P., 2014, European Union Ecolabel application pack for lubricants.
[82] “Repsol Corporate Information and general contents: cars, motor, the weather and more - repsol.com.”
[83] Exxon Mobil Corporation, 2013, “Mobilgear SHC XMP Series.”