tri-generation fuel cell technologies for location-specific … · 2015-06-16 · kersey manliclic....
TRANSCRIPT

Kersey ManliclicBrendan Shaffer
Professor Scott Samuelsen, Principal InvestigatorAdvanced Power and Energy Program
University of California, IrvineJune 9, 2015
Tri-Generation Fuel Cell Technologies for Location-Specific Applications
This presentation does not contain any proprietary, confidential, or otherwise restricted information
Project ID: SA047
2015 U.S. DOE Hydrogen and Fuel Cells
Program and Vehicle Technologies
Office Annual Merit Review and Peer
Evaluation Meeting
2/20Advanced Power and Energy Program 2015
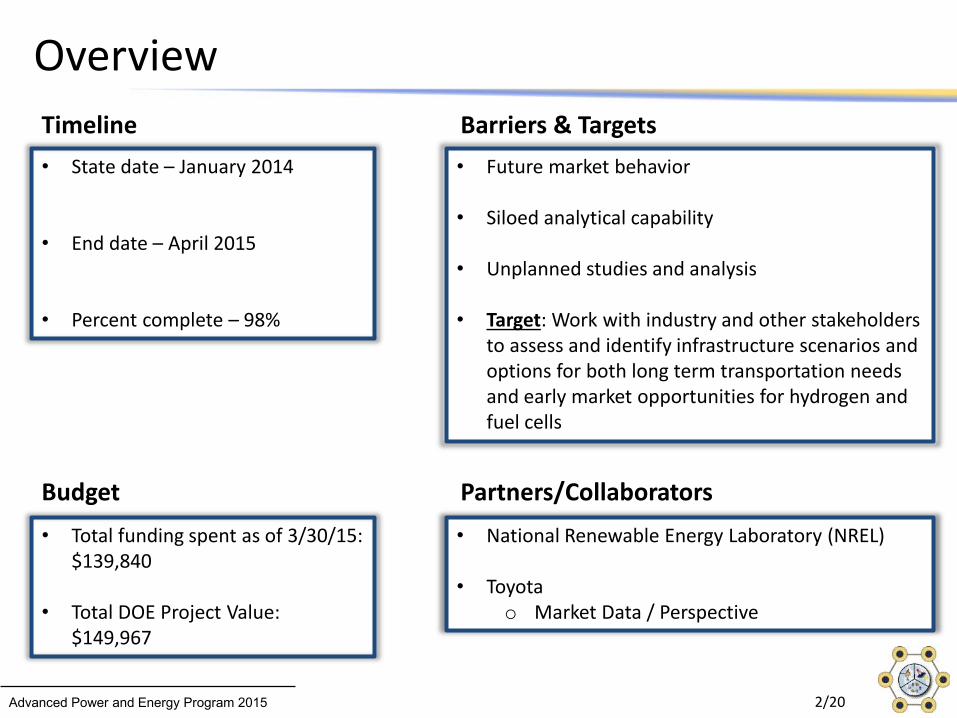
OverviewTimeline• State date – January 2014
• End date – April 2015
• Percent complete – 98%
Budget• Total funding spent as of 3/30/15:
$139,840
• Total DOE Project Value: $149,967
Barriers & Targets
Partners/Collaborators• National Renewable Energy Laboratory (NREL)
• Toyotao Market Data / Perspective
• Future market behavior
• Siloed analytical capability
• Unplanned studies and analysis
• Target: Work with industry and other stakeholders to assess and identify infrastructure scenarios and options for both long term transportation needs and early market opportunities for hydrogen and fuel cells
3/20Advanced Power and Energy Program 2015
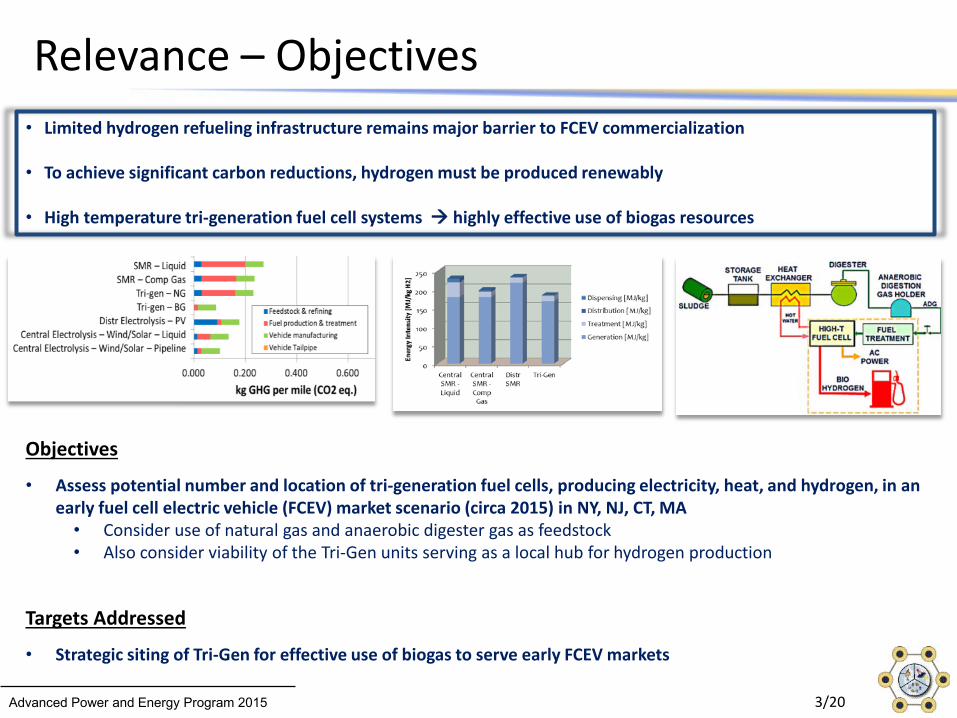
Relevance – Objectives • Limited hydrogen refueling infrastructure remains major barrier to FCEV commercialization
• To achieve significant carbon reductions, hydrogen must be produced renewably
• High temperature tri-generation fuel cell systems highly effective use of biogas resources
Objectives
• Assess potential number and location of tri-generation fuel cells, producing electricity, heat, and hydrogen, in an early fuel cell electric vehicle (FCEV) market scenario (circa 2015) in NY, NJ, CT, MA• Consider use of natural gas and anaerobic digester gas as feedstock• Also consider viability of the Tri-Gen units serving as a local hub for hydrogen production
Targets Addressed
• Strategic siting of Tri-Gen for effective use of biogas to serve early FCEV markets
4/20Advanced Power and Energy Program 2015
Milestones
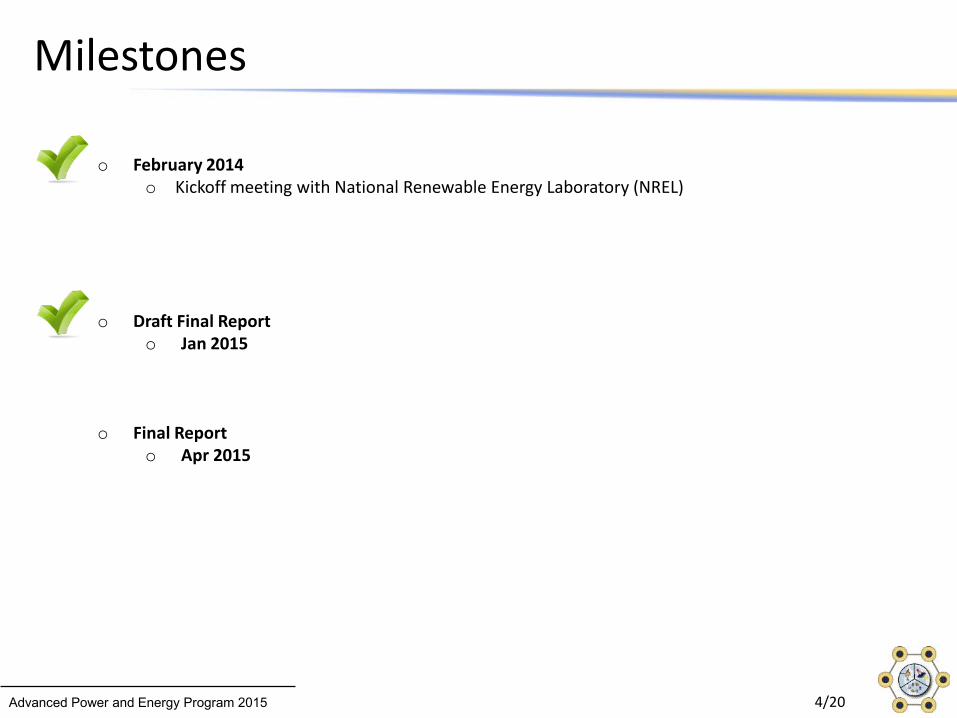
o February 2014o Kickoff meeting with National Renewable Energy Laboratory (NREL)
o Draft Final Reporto Jan 2015
o Final Report o Apr 2015

5/20Advanced Power and Energy Program 2015
Approach
• Project Overview
Analysis Inputs
Alt Vehicles Sales DataPopulation DataLand Use DataDemographic DataSpatial Infrastructure DataData CleanupSelection Criteria
Studies & Analysis
Identify:• key early FCEV markets • potential Tri-Gen sites
(NG, Biogas)• potential Tri-Gen hubsEstimate:• H2, electricity, and heat
production• Cost: H2
Models & Tools
STREET – Spatially and Temporally Resolved Energy and Environment ToolFC PowerH2A
Outputs & Deliverables
Final Report
Assesses and identifies infrastructure scenarios and options for early market opportunities for hydrogen and fuel cells
Feedback from NREL

6/20Advanced Power and Energy Program 2015
• How to site with multiple products (i.e., markets)?
Approach
• Electricity
• Heat
• Hydrogen
High Temperature Fuel CellTri-Generation System
Electric
Industrial – Heating / Cooling
Transportation – Light Duty
Residential/Commercial –Heating / Cooling
Industrial
Transportation – NonLight Duty
Used hydrogen demand to site and size Tri-Gen systems
GHG Emission Inventory by Sector in US
US Energy Information Administration

7/20Advanced Power and Energy Program 2015
Approach
ADG
NG
At WWRF
Central Hub
At HRS
FEEDSTOCKTri-Gen System
Location Sizing Methodology
Central Hub –On NG Pipeline
H2 Demand(6,10,15 min)
H2 Demand(6,10,15 min)H2 Demand
(1,5,10 Hubs)
Biogas available
Delivery
GH2 Truck
LH2 Truck
Pipeline
GH2 Truck
LH2 Truck
Pipeline
Requires determination of hydrogen refueling station
network
Set Covering Analysis for Early Market Clusters
Economics
FC PowerH2A

8/20Advanced Power and Energy Program 2015
Results: Top 25 WWRFs & H2 Production Potential
• Several WWRFs with large potential (>8 MW)
Deer Island WWTP
Passaic Valley
Deer Island
Passaic Valley

9/20Advanced Power and Energy Program 2015
Results: ADG, at WWRF
0
1000
2000
3000
4000
5000
6000
7000
8000
9000
Hydr
ogen
[kg/
day]
Potential Supply
Potential Demand - 6min
0
1000
2000
3000
4000
5000
6000
7000
8000
9000
Hydr
ogen
[kg/
day]
Potential Supply
Potential Demand - 15min
• WWRFs not always near FCEV markets
• Some unserved demand
0
10
20
30
40
50
60
6min 10min 15min
MW
Inst
alle
d
37,000 FCEVs10,000 FCEVs
10/20Advanced Power and Energy Program 2015
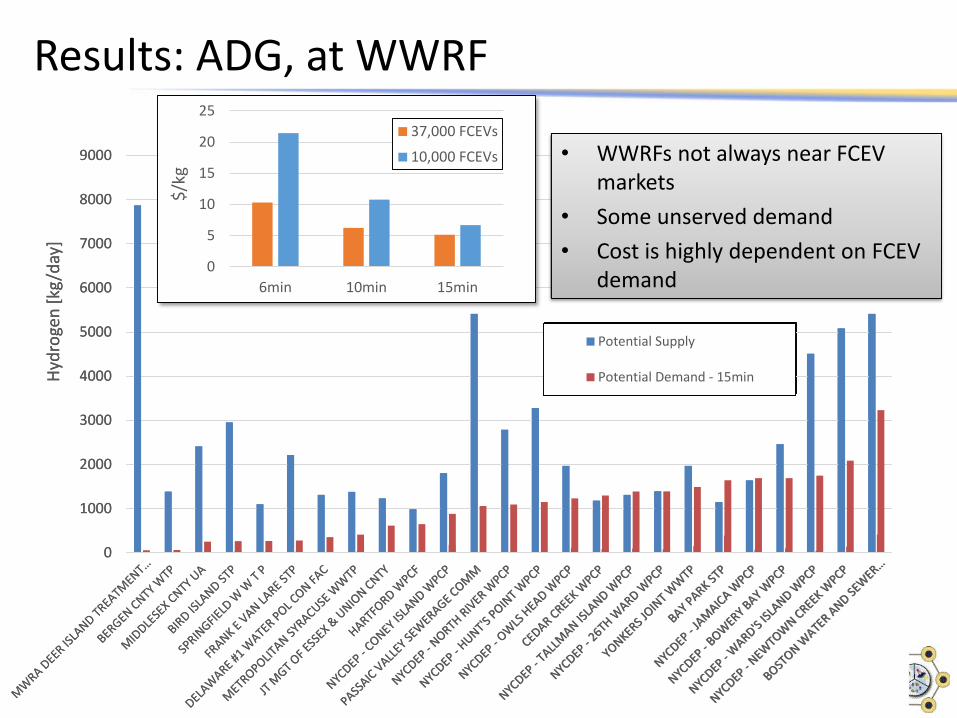
Results: ADG, at WWRF
0
1000
2000
3000
4000
5000
6000
7000
8000
9000
Hydr
ogen
[kg/
day]
Potential Supply
Potential Demand - 6min
0
1000
2000
3000
4000
5000
6000
7000
8000
9000
Hydr
ogen
[kg/
day]
Potential Supply
Potential Demand - 15min
• WWRFs not always near FCEV markets
• Some unserved demand• Cost is highly dependent on FCEV
demand0
5
10
15
20
25
6min 10min 15min
$/kg
37,000 FCEVs
10,000 FCEVs

11/20Advanced Power and Energy Program 2015
Results: Hydrogen Refueling Station Network• FCEV Cluster Identification
– Top 50% of zip codes in alt. vehicle sales (also used 25%, 75% but not presented here)
Top 50% zip codes shown in RED
12/20Advanced Power and Energy Program 2015
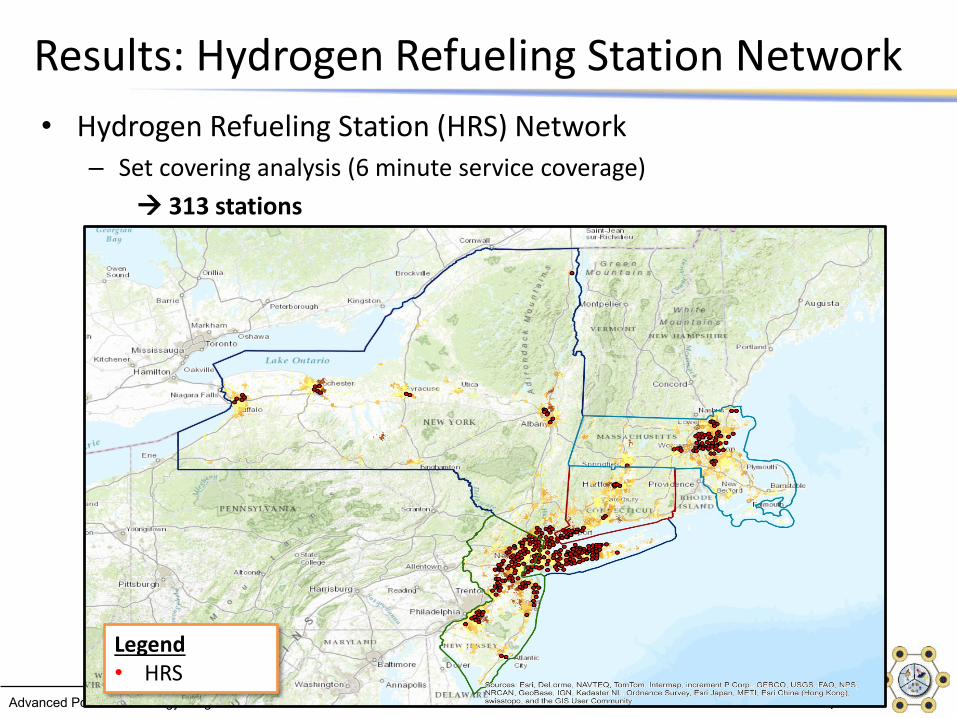
Results: Hydrogen Refueling Station Network• Hydrogen Refueling Station (HRS) Network
– Set covering analysis (6 minute service coverage) 313 stations
Top 50% zip codes shown in RED
Legend• HRS
13/20Advanced Power and Energy Program 2015
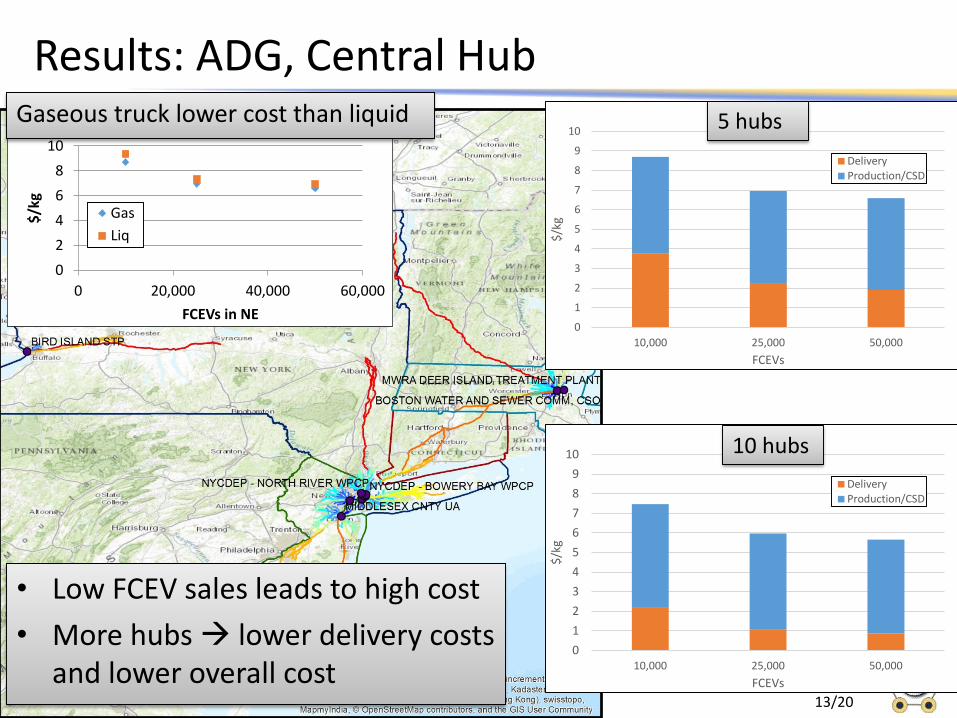
Results: ADG, Central Hub
• Low FCEV sales leads to high cost• More hubs lower delivery costs
and lower overall cost
02468
10
0 20,000 40,000 60,000
$/kg
FCEVs in NE
GasLiq
0123456789
10
10,000 25,000 50,000
$/kg
FCEVs
DeliveryProduction/CSD
0
1
2
3
4
5
6
7
8
9
10
10,000 25,000 50,000
$/kg
FCEVs
DeliveryProduction/CSD
5 hubs
10 hubs
Gaseous truck lower cost than liquid
14/20Advanced Power and Energy Program 2015
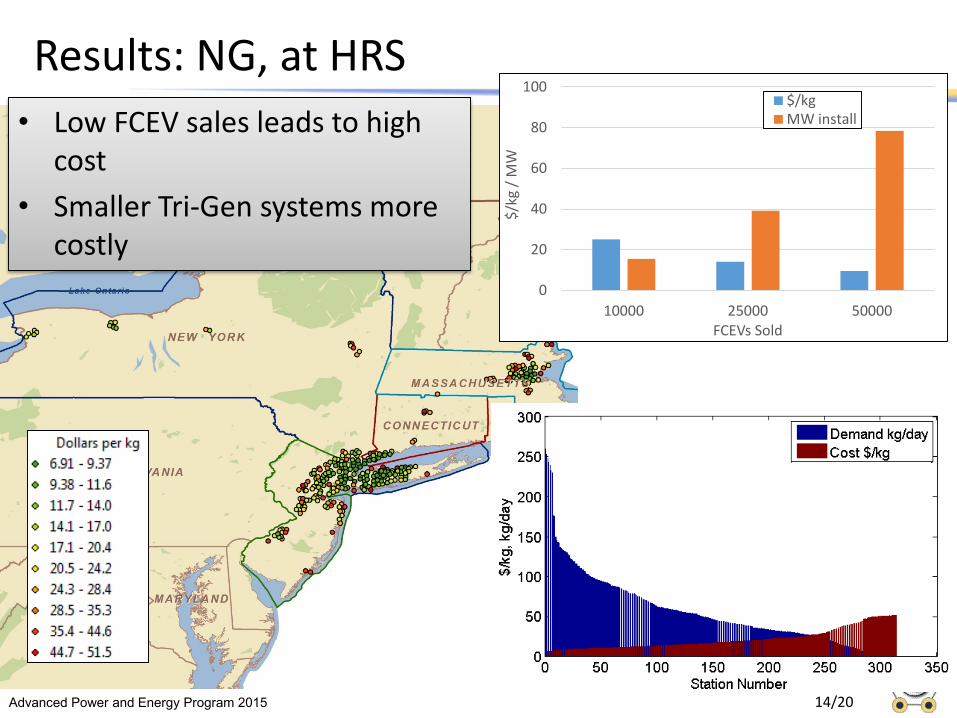
Results: NG, at HRS
0
20
40
60
80
100
10000 25000 50000
$/kg
/ M
W
FCEVs Sold
$/kgMW install• Low FCEV sales leads to high
cost• Smaller Tri-Gen systems more
costly
15/20Advanced Power and Energy Program 2015
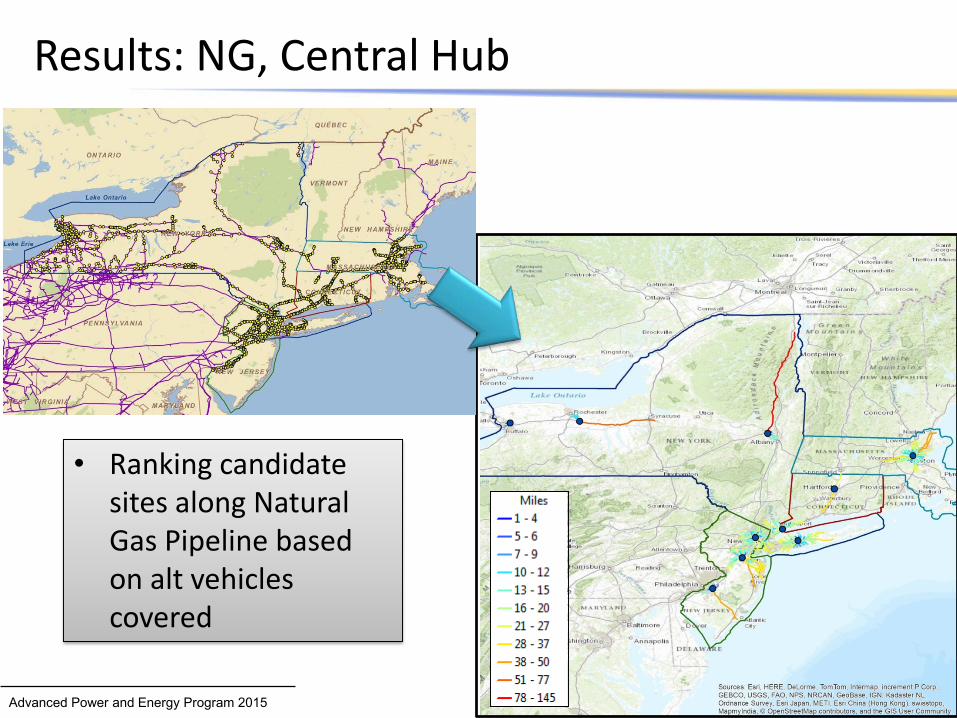
Results: NG, Central Hub
• Ranking candidate sites along Natural Gas Pipeline based on alt vehicles covered

16/20Advanced Power and Energy Program 2015
Results: NG, Central Hub
02468
101214161820
10,000 25,000 50,000
$/kg
FCEVs in NE
Delivery
Production/CSD
02468
101214161820
10,000 25,000 50,000
$/kg
FCEVs in NE
Delivery
Production/CSD
02468
101214161820
10,000 25,000 50,000
$/kg
FCEVs in NE
Delivery
Production/CSD
1 hubs 5 hubs
10 hubs
• Low FCEV sales leads to high cost• More hubs lower delivery costs
and lower overall cost
17/20Advanced Power and Energy Program 2015
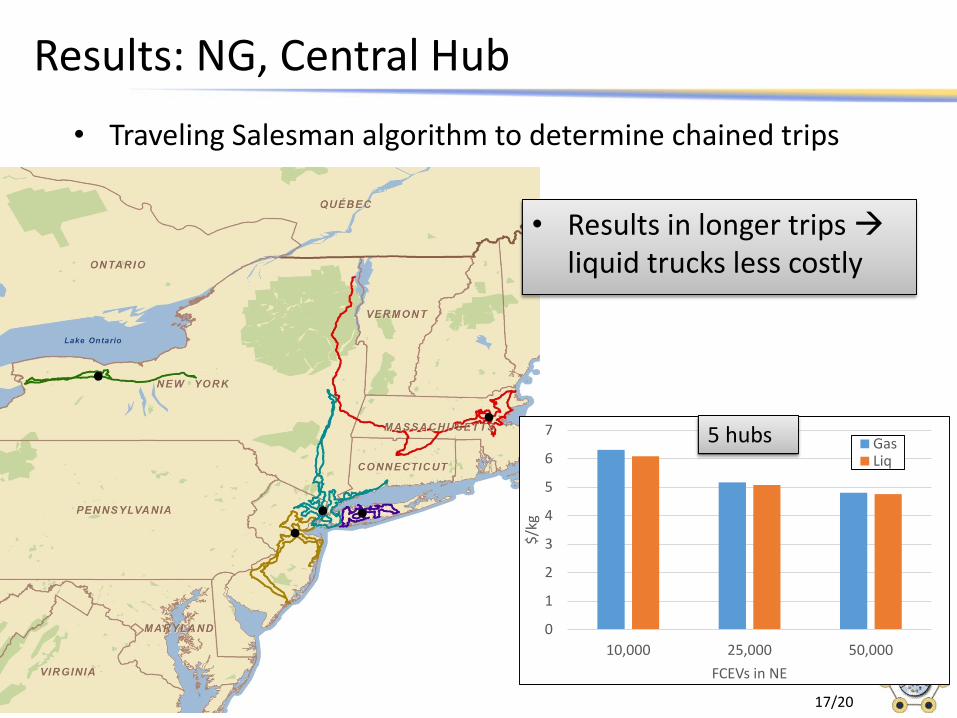
Results: NG, Central Hub• Traveling Salesman algorithm to determine chained trips
0
1
2
3
4
5
6
7
10,000 25,000 50,000
$/kg
FCEVs in NE
GasLiq
5 hubs
• Results in longer trips liquid trucks less costly

18/20Advanced Power and Energy Program 2015
Results: Scenario Comparison • 6 min coverage for station demand estimation• Central Hub cases: 5 hubs
0
2
4
6
8
10
12
ADGCentral
Hub
NGCentral
Hub
NGCentral
HubTraveling
NG Onsite ADG atWWRF
$/kg
010000200003000040000500006000070000
ADGCentral
Hub
NGCentral
Hub
NGCentral
HubTraveling
NGOnsite
ADG atWWRF
Tota
l H2
Dem
and
[kg/
day]
0
100
200
300
400
500
600
700
800
ADG CentralHub
NG CentralHub
NG CentralHub
Traveling
NG Onsite ADG atWWRF
Capi
tal C
ost [
$MM
]• Central hub lower cost• NG Central hub lowest cost

19/20Advanced Power and Energy Program 2015
Collaborations
Primary Collaborator• National Renewable Energy Laboratory
Secondary Collaborator• Toyota (market data and perspective)• Massachusetts Clean Energy Center• New York State: Dept. of Conservation
Leveraging past and current collaborators• DOE Biogas Tri-Gen Demonstration
• National Fuel Cell Research Center• Orange County Sanitation District• FuelCell Energy• Air Products
20/20Advanced Power and Energy Program 2015
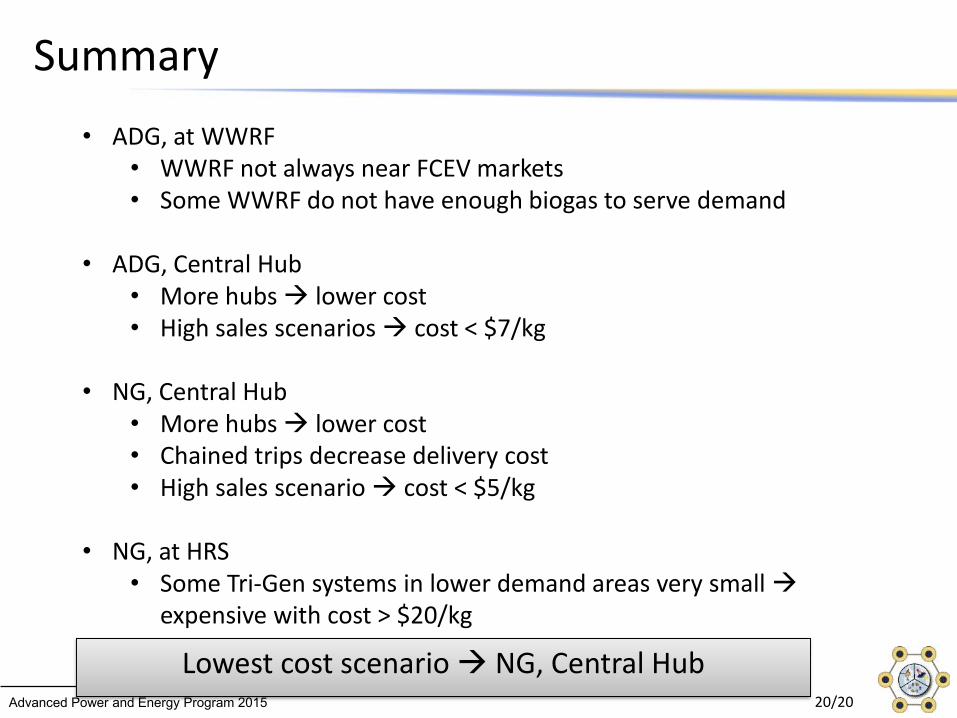
Summary • ADG, at WWRF
• WWRF not always near FCEV markets• Some WWRF do not have enough biogas to serve demand
• ADG, Central Hub• More hubs lower cost• High sales scenarios cost < $7/kg
• NG, Central Hub• More hubs lower cost • Chained trips decrease delivery cost• High sales scenario cost < $5/kg
• NG, at HRS• Some Tri-Gen systems in lower demand areas very small
expensive with cost > $20/kg
Lowest cost scenario NG, Central Hub
25/20Advanced Power and Energy Program 2015
Acronyms
• Dept. of Energy (DOE)• Fuel Cell Electric Vehicle (FCEV)• Wastewater Recovery Facility (WWRF)• Anaerobic Digester Gas (ADG)• Natural Gas (NG)• Northeast (NE)• National Renewable Energy Laboratory (NREL)• Spatially and Temporally Resolved Energy and Environment
Tool (STREET)• United States Geological Survey (USGS)• Wastewater Treatment Plant (WWTP)