trevigen’s cometchip® platform (high through-put dna ... 2017 trevigen’s... · the comet assay...
TRANSCRIPT

Trevigen’s CometChip® Platform (High Through-Put DNA Damage Analysis)
www.trevigen.com | 301-216-2800 | [email protected] Helgerman Court, Gaithersburg MD 20817

Objectives• Review Standard Comet Assay.• Explain CometChip® Platform.• Demonstrate advantages of Trevigen Comet Analysis Software.• Show validation of 4X image analysis.

The Comet Assay• The Single Cell Gel Electrophoresis assay (SCGE, also known as comet assay) is a
sensitive technique for the detection of DNA damage at the level of the individual eukaryotic cell.
• It was first developed by Östling & Johansson in 1984 and later modified by Singh et al. in 1988.
• It a standard technique for evaluation of DNA damage/repair, biomonitoring and genotoxicity testing.
• The term "comet" refers to the pattern of DNA migration through the electrophoresis gel, which often resembles a comet.

Principles of the Comet Assay
Cells placed in LM Agarose
Immobilize cells on CometSlide™
Treat with Lysissolution
Alkali Treatment
Alkaline Electrophoresis and stain
Large Fragments
Small Fragments

Typical Comet Data

The CometChip® Platform
The CometChip® Platform consists of:• CometChip® Well Former• Comet Electrophoresis System• Comet Analysis Software• CometChips®• Reagents
CometChip®
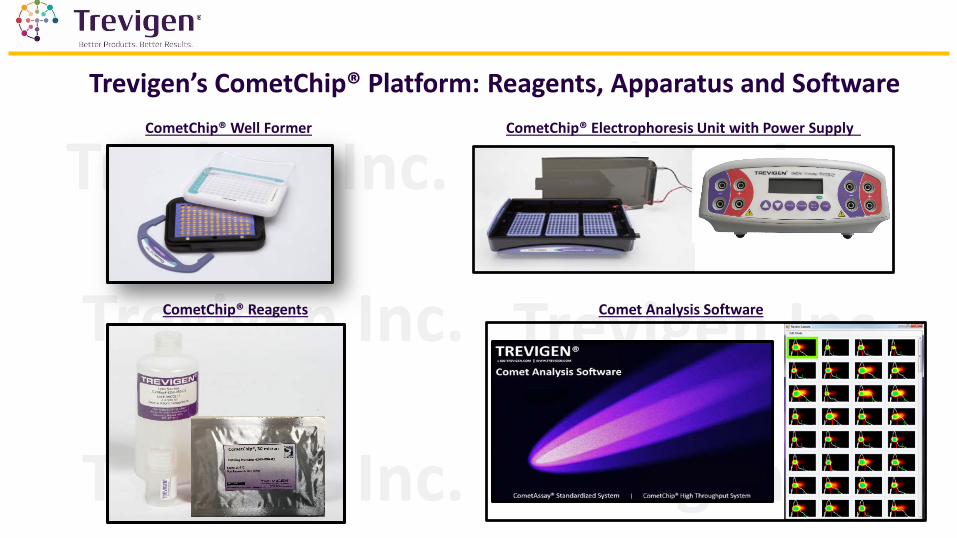
Trevigen’s CometChip® Platform: Reagents, Apparatus and SoftwareCometChip® Well Former CometChip® Electrophoresis Unit with Power Supply
CometChip® Reagents Comet Analysis Software

CometChip® provides high density data with minimal overlaps compared to older comet formats
Older Comet Format CometChip®

Trevigen® Comet Analysis System(Analyze >500,000 comets per week)
SCAN EDITANALYZE
“Wizard Driven Software”

Free Demonstration at Booth 1728
Directions from Wizard
Study Name
Drag and Drop Images
Automatic Comet finding and Scoring
Edit based on profile
Review from Image

Trevigen® Comet Analysis System
• For the analysis of traditional comet data or CometChip®• Uses 4X images - requires fewer images • Automatic Comet finding and scoring.• No need to manually identify each comet.• Easy to use and intuitive software. • Easy data exports.
• Advantages w/ 96 well-CometChip® (maximum 400 comets/well)• ~150 comets per 4X image (camera/scope specific).• Scan and analyze ~14,400 comets in < 10-15 minutes. • Minimal editing due to no over lapping comets.

Validation of 4X Imaging• To date Comet analysis is based on the use of 10X images and frequently requires
a software compatible camera.• Trevigen platform uses a 4X image and is not camera specific.• It was important to demonstrate that data generated from 4X images correlates
with 10X images.

Software Validation Using Simulated Comets
Simulated Comets
• The simulated comet images were designed to represent a range of damage levels and were constructed by using solid circular and elliptical shapes of selected intensity (grey scale) values to mimic the basic shapes and intensities of typical comets.
• These comet images were then convolved with a 15 X 15 smoothing filter to make the appearance of the simulated comets more realistic.
• These simulated comets were then arrayed in a single image in an arrangement that would make their order of processing by the program predictable (for comparison purposes.)

Excellent Correlation Between Expected and Program Generated Analysis of Simulated Comets
R² = 0.9946
0
10
20
30
40
0 10 20 30 40
PRO
GRA
M
EXPECTED
Moment
R² = 0.9904
0
20
40
60
80
0 20 40 60 80
PRO
GRA
M
EXPECTED
% DNA in Tail
R² = 0.9849
0
50
100
150
0 50 100 150
PRO
GRA
M
EXPECTED
Tail Length

Trevigen Analysis System Provide Comparable Results for 4X and 10X Images in Standard Neutral Comet Assays
• Jurkat Cells treated with increasing concentrations of Bleocin• Each treatment was analyzed and averaged over 2 wells.
• Images were acquired with 4X and 10X objectives.• 10X images were analyzed using Loats Automatic Comet Work Station.• 4X images were analyzed using Trevigen Comet Analysis Software.

Trevigen Analysis System Provide Comparable Resultsfor 4X and 10X Images in Standard Neutral Comet Assays
R² = 0.9998
0
20
40
60
0 20 40 60
4X Im
age
10X Image
% DNA in Tail
R² = 0.99130
50
100
150
0 25 50 75 100
4X Im
age
10X Image
Tail Length
R² = 0.9974
0
5
10
15
20
0 5 10 15
4X Im
age
10X Image
Moment

Trevigen Analysis System Provide Comparable Results for 4X and 10X Images in the Standard Alkaline Comet Assay
• Trevigen Alkaline Control Cells were run on a 20 well slide.• Each treatment was analyzed and averaged over 5 wells.
• Images were acquired with 4X and 10X objectives.• 10X images were analyzed using Loats Automatic Comet Work Station and
Trevigen Software.• 4X images were analyzed using Trevigen Comet Analysis Software.

R² = 0.9888
0
10
20
30
40
50
0 10 20 30 40
Trev
igen
soft
war
e (1
0X ti
ff)
Loats automated system (10X)
R² = 0.9841
05
1015202530354045
0 10 20 30 40
Trev
igen
soft
war
e (4
X tif
f)
Loats automated system (10X)
Trevigen Analysis System Provide Comparable Results for 4X and 10X Images in the Standard Alkaline Comet Assay
4X vs 10X tiff images: 1:1 correlation between Trevigen software and Loats automated system
% DNA in Tail Comparisons

Test Inter and Intra run variability with CometChip® Platform
Design Electrophoresis and Analysis
• 30’ Load• 30’ Treatment
– 0, 1.25, 2.5 and 5 µM Etoposide– Duplicates rows (24 wells/treatment)
• Inter run variability– Single CometChip® experiments on 3 different
days
• Intra run variability– Three Comet Chip® experiment on same day

<20% Variability between treated wells
uM Etoposide avg sd cv uM Etoposide avg sd cv uM Etoposide avg sd cv0 4.64 1.59 34.23 0 4.41 1.02 23.18 0 6.05 1.55 25.70
1.25 20.10 3.50 17.40 1.25 21.94 3.46 15.77 1.25 22.38 4.12 18.402.5 34.30 3.80 11.09 2.5 38.70 2.75 7.12 2.5 38.99 2.84 7.295 53.59 4.19 7.82 5 57.57 3.90 6.77 5 61.94 6.49 10.48
~123 cells counted/well ~135 cells counted/well ~139 cells counted/well
% DNA in Tail, n=24 well medians % DNA in Tail, n=24 well medians % DNA in Tail, n=24 well medians
uM Etoposide avg sd cv uM Etoposide avg sd cv uM Etoposide avg sd cv0 4.78 1.02 21.24 0 4.86 0.84 17.33 0 6.64 1.67 25.12
1.25 19.36 2.12 10.95 1.25 18.11 1.51 8.35 1.25 21.87 2.35 10.732.5 32.74 2.32 7.09 2.5 31.00 2.51 8.10 2.5 34.93 2.74 7.845 61.71 6.47 10.48 5 61.94 5.48 8.85 5 55.30 7.49 13.54
~146 cells counted/well ~148 cells counted/well ~119 cells counted/well
% DNA in Tail, n=24 well medians % DNA in Tail, n=24 well medians % DNA in Tail, n=24 well medians
Single CometChip® experiments
Three Comet Chip® experiment on same day
1 2 3

<10% Variability between CometChips® with treated samples
inter run variability (n= 3 CometChips®)uM Etoposide avg sd cv
0 5.03 0.89 17.611.25 21.47 1.21 5.642.5 37.33 2.63 7.045 57.70 4.18 7.24
intra run variability (n=3 CometChips®)uM Etoposide avg sd cv
0 5.43 1.05 19.331.25 19.78 1.91 9.682.5 32.89 1.97 5.995 59.65 3.77 6.32
• Low well to well and slide to slide CVs.– Consistent with United States
Pharmacopeia (USP) guidelines for 96 well assays (ELISA)
– Meets ASCLS specifications• No overlapping comets.
– Minimal or no editing required results in– Unbiased data analysis

CometChip® Platform Provides Reproducible Data with Minimal Well to Well Variation
020406080
100
0 20 40 60 80 100
% D
NA
in T
ail (
n=3)
µg/ml MMS
HepaRG: 4 hr MMS treatment
Trt A Trt B
• HepaRG cells treated with increasing concentration of MMS.• Two separate experiments performed by different operators on the same day.• Each concentration performed in triplicate.

Cost Assumptions
Traditional Comet Assay
• $50/hour fully burdened labor• Full electrophoresis run (10 slides 20 wells)• 200 comets per well
– Analyze 150 or more comets
• Five pictures/ well• 12 hours per 20 wells (4000 comets)• $698/run• $ 34.90 per well• 17 cents per comet
CometChip®
• $50/hour fully burdened labor• Full electrophoresis run 3 chips (288 wells)• 400 comets per well
– Analyze 150 or more comets
• 1 picture / well• 10.5 hours per 288 wells (115,200 comets)• $1500/run• $5.2 per well• 1.3-2.0 cents per comet

Traditional Comet: Cost per Run/Well
$698 $1,396
$2,094 $2,792
$3,490 $4,188
$4,886 $5,584
$6,282 $6,980
$7,678 $8,376
$9,074 $9,772
$10,470
$0
$2,000
$4,000
$6,000
$8,000
$10,000
$12,000
1 2 3 4 5 6 7 8 9 10 11 12 13 14 15
20 40 60 80 100 120 140 160 180 200 220 240 260 280 300
Dolla
rs sp
ent o
n Tr
aditi
onal
Com
et A
ssay
s
Buy the System
Reagents & labor costs same as 3 CometChips®
Runs
Wells
Item Dollars
Software 2995
CometChip® System 3570
Subtotal 6565
- 10% Discount 5905
2 CometChip® Kits 650
Total 6555
1 Complete CometChip Run---------$1500 (288 wells)9 Traditional Comet Assays----------$6282 (180 wells)

CometChip® Platform• Developed and Manufactured under ISO 9001/2008 guidelines• Only Integrated and Standardized System.
– CometChip® Well Former and Electrophoresis Systems– CometChip® and Reagents – Comet Analysis Software– resulting in run to run consistency
• Low well to well and slide to slide CVs.– Consistent with United States Pharmacopeia (USP) guidelines for 96 well assays (ELISA)
• No overlapping comets.– Minimal or no editing required results in– Unbiased data analysis

CometChip® Platform• > 5000% increase throughput.
– Develop and analyze over five hundred thousand comets per week– Software can analyze 4X images requiring fewer fields or pictures to be examined
• Use existing microscope cameras or automated high through put cell analysis systems. (i.e Biotekor Celligo instrument’s).
• Software validated using computer generated comet images with known comet tail parameters.• Final software.
– Compatible JPEG or Tiff images– Alkaline and neutral comet– Compatible with CometChip and Standard Comet

CometChip® for Human Skin Genotoxicity Testing
• Goal: To treat a 3D skin culture using a genotoxic agent and quantify DNA damage in basal keratinocytes.
• Issue: Can we preferentially select basal keratinocytes?– Human epidermis during differentiation lose
their nuclei creating a heterogeneous background of DNA damage in the comet assay
• Method: Can we use extracellular matrix proteins?
Integrin Beta 1 binds to Collagen 1 in Extracellular Matrix
Basal cells in skin stained with Anti-Integrin Beta 1 (green)

DermaChip™ Identifies and Analyzes DNA Damage in Integrin Beta 1 Basal Cells of Skin
EpiDermTM Skin Model
Dissociate skin into single cells
Alkaline Comet Assay
Control (No treatment)
100 nM H2O2
DermaChip™(contains Collagen 1)
Collaborator: Dean Rosenthal, Georgetown UniversitySupported by NIEHS R41ES026908Patent Pending
Basal Cells co-stained withAnti-Integrin Beta 1 (orange)
and Syber Gold (green)
Collaborator: Dean Rosenthal, Georgetown UniversitySupported by NIEHS R41ES026908Patent Pending
Load DermaChip™
Stain cells with Anti-Integrin Beta 1
Integrin Beta 1 mediates binding of Basal Cells to Collagen 1 in micropores

Washing removes cells not binding to Collagen 1
Load
JurkatCollagen 1
Chip
HaCatCollagen 1
Chip
HaCatChip only
Treated HaCatCollagen 1
Chip
Load Wash
Jurkats – suspension line lacking Beta 1 IntegrinHaCat – adherent line with Beta 1 IntegrinTreated HaCat – over trypsinized to remove surface receptors

Poster Sessions1335: The Development and Validation of EpiComet-Chip, a Modified High-Throughput Comet. T. A. Townsend1, M. C. Parrish2, S. D. Shelton1, B. P. Engelward2, M. G. Manjanatha1. 1US FDA/NCTR, Jefferson, AR, United States. 2Massachusetts Institute of Technology, Cambridge, MA,
2267: In Vitro Micronucleus and CometChip® with Metabolically Competent HepaRG™ Cells. C. Swartz1, J. Winters1, K. Owens1, C. Yauk2, J. Buick2, B. Engelward3, L. Ngo3, L. Recio1. 1Integrated Laboratory Systems, Research Triangle Park, NC, United States. 2Health Canada, Ottawa, ON, Canada. 3Massachusetts Institute of Technology, Cambridge, MA, United States.