trends in tropospheric ozone for 1979-2016 inferred from a...
TRANSCRIPT

Trends in Tropospheric Ozone for 1979-2016 Inferred from a Composite Record of
TOMS/OMI/MLS/OMPS Satellite Measurements
Data Product Contributors:J. R. Ziemke1,2, R. D. McPeters1, P. K. Bhartia1, L. Froidevaux3, N. A.
Kramarova4, D. P. Haffner4, J. Joiner1, S. M. Frith4, G. J. Labow4, J. C. Witte4, G. R. Jaross1, C. J. Seftor4, S. L. Taylor4, M. T. Deland4, et al.
1NASA Goddard Space Flight Center, Greenbelt, Maryland, USA2Morgan State University, Baltimore, Maryland, USA
3NASA Jet Propulsion Laboratory, California, USA4SSAI, Lanham, Maryland, USA
OMI Science Team Meeting 12-14 September 2017

Plan Focus mostly on tropics and subtropics where our
measurements are best
Combine N7 and EP TOMS (1979-2005) with OMI/MLS (2005-2016) for a 38-year record of clear-sky tropospheric column ozone (OMPS is still in the works)
Do trend analyses independently for TOMS and OMI/MLS and then add their changes together
Compare with models and other measurements including tropospheric ozone from aircraft and ECC ozonesondes, and OMI NO2 as ozone precursor

OMI/MLS Tropospheric Column Ozone(Goddard public data product since 2006)
Both OMI and MLS are on Aura with measurements about 7 minutes apart
Vertical resolution about the tropopause is ~3 km

Validation: Ozonesonde Comparisonsfor October 2004 – May 2016
(Ozonesondes: Databases by J. Witte and G. Labow, Code 614, GSFC)

Validation: Ozonesondes Show No Significant OMI/MLS drift
Ozonesondes suggest OMI/MLS offset of -2 DU and drift of about +0.3 DU (but not significant)
Solution
Adjust OMI/MLS by +2 DU

Validation: No Drift Detected Between MLS and OMIStratospheric Column Ozone

Apply Regression Trend Model Independently for TOMS (1979-2005) and
OMI/MLS (2005-2016)
A = SeasonalFit (DU)
B = Trend(DU/month)
C = ENSO(DU/Nino3.4)
Error(DU)
Seasonal Fit:5 constants
Trend and ENSO:3 constants

OMI/MLS Tropospheric Ozone Trends (2005-2016)

OMI/MLS Tropospheric Ozone Trends(2005-2016)
THREE BOXES (India, SE Asia, East Asia):
IAGOS aircraftozone profiles(Zhang et al., 2016, Nature Geoscience)
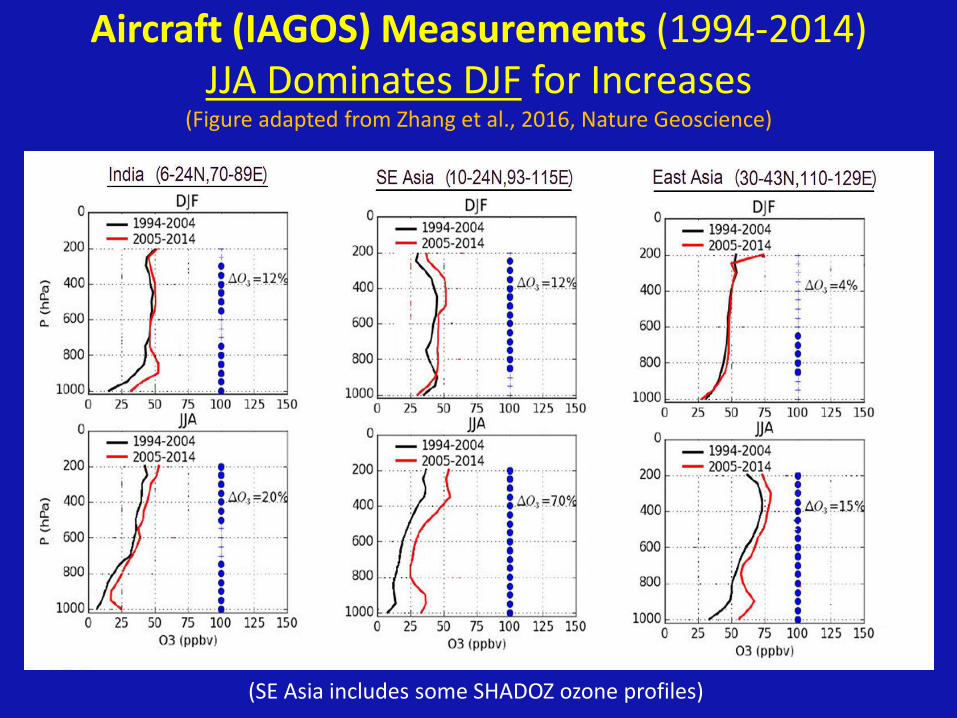
Aircraft (IAGOS) Measurements (1994-2014)JJA Dominates DJF for Increases
(Figure adapted from Zhang et al., 2016, Nature Geoscience)
(SE Asia includes some SHADOZ ozone profiles)

OMI/MLS Trends for India / SE Asia / East Asia:Also Largest During JJA
DJF
JJA

TOMS Tropospheric Ozone Trends (1979-2005)

TOMS Tropospheric Column Ozone(Goddard public data product since 1998)

TOMS Tropospheric Ozone Trends(1979-2005)
(Beig and Singh, 2007, Geophys. Res. Lett.)
(1991-2001)
(1979-2005)
MOZART-2
TOMS CCD
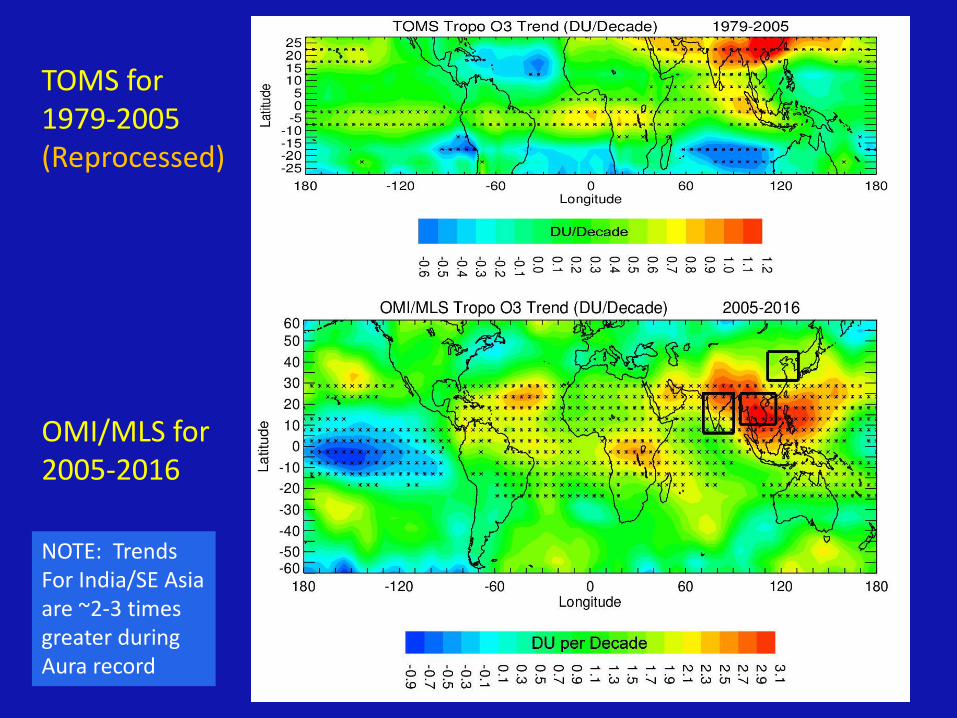
TOMS for 1979-2005 (Reprocessed)
OMI/MLS for 2005-2016
NOTE: TrendsFor India/SE Asiaare ~2-3 times greater during Aura record

Composite Record (TOMS/OMI/MLS/OMPS) for SE Asia and Central Africa
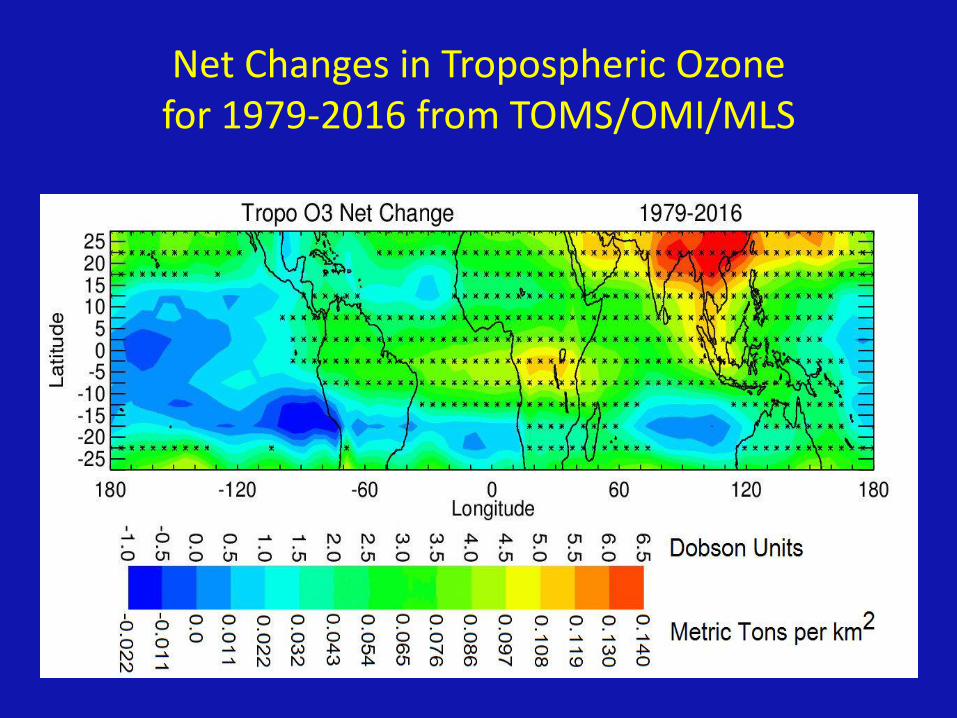
Net Changes in Tropospheric Ozonefor 1979-2016 from TOMS/OMI/MLS

CAM-Chem Simulated Tropospheric Ozone:Mass Change for 1980-2010
(Zhang et al., 2016, Nature Geoscience)
Net increase in ozone everywhereMaxima also centered about India and East Asia

OMI v3 NO2 Trends
(Data source: Goddard AVDC)

Summary
Main Finding: TOMS (1979-2005) and OMI/MLS (2005-2016) independentlydetect largest trends (increases) in tropospheric ozone extending from India toSE Asia
(1) Rate of increase is 2-3 times greater during the recent Aura record
(2) Total increase for 1979-2016 is ~6-7 DU (~0.13-0.15 Metric Tons km-2)
Model Simulations: CAM-chem model for 1980-2010 (Zhang et al., 2016)closely reproduces these trends both spatially and also in magnitude with netincreases > +0.10 metric Tons km-2 for India/SE Asia. A GFDL-AM3 model (Linet al., 2017) prescribes similar anomalous increases in tropospheric ozone overthis region for the 1980-2014 record due to emissions increase
Aircraft: IAGOS aircraft tropospheric ozone measurements also prescribe largeincreases for the India / SE Asia region from 1994 to 2014 (Zhang et al., 2016)

OMI NO2 Trends

OMI v3 NO2 Trends
(Data source: Goddard AVDC)

TOAR – OMI/MLS and IASI-SOFRID Tropospheric Column Ozone Decadal Changes/Trends
(From TOAR report, 2017, in review)

GFDL-AM3 Hindcast Simulation(Lin et al., 2017, Atmos. Chem. Phys.)
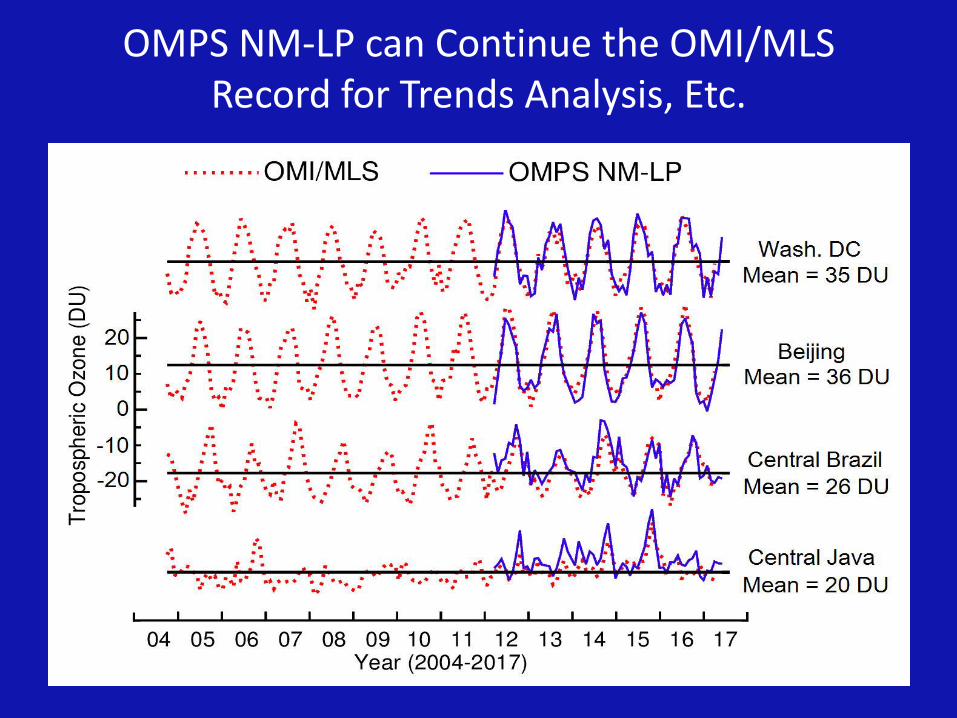
OMPS NM-LP can Continue the OMI/MLS Record for Trends Analysis, Etc.

Sonde versus OMI/MLS

Evidence of Subtle Row-Anomaly Flagging Error in Standard OMI Total Column Ozone Beginning January 2009
Main Result: Evidence of small artificial increase (~+0.5 to +1.0 DU/decade) in OMI/MLStropospheric ozone caused by small row anomaly error in OMI standard-product total ozone
40N-60N 20N-40N
0-20N 0-20S
20S-40S 40S-60S

Validation: However, a small Row Anomaly Error of about +0.5 to +1.0 DU per Decade on Average
Adjustment: Adjust TCO product by -1.0 DU/Decade

GFDL-AM3 Hindcast Simulation(Lin et al., 2017, Atmos. Chem. Phys.)

OZONESONDES OMI/MLS
GOME-OMI
IASI FORLI IASI SOFRID
OMI-RAL
TOAR Report in 2017 (Confidential, Do Not Distribute)

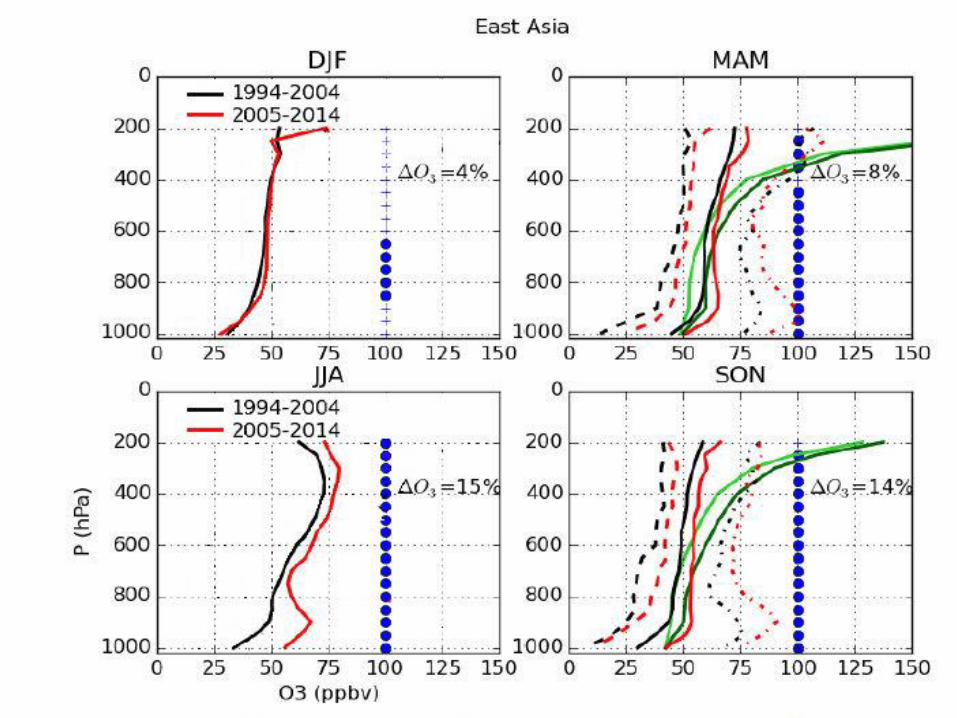
Aircraft (IAGOS) Measurements Prescribe Increases in Tropospheric Ozone over East Asia for 1994-2014
(Adapted from Zhang et al., 2016, Nature Geosci.)

OMPS NM-LP can Continue the OMI/MLS Record for Trends Analysis, Etc.

Net changes in Zonal Mean Tropospheric Ozone for 1979-2016

OMI Row-Anomaly Test: Subtract Filtered (Only OMI Rows 3-18) Total Ozone from the OMI Standard Total Ozone
Main Result: Evidence of small artificial increase (~+0.5 to +1.0 DU/decade) in OMI/MLStropospheric ozone caused by small row anomaly error in OMI standard-product total ozone
40N-60N 20N-40N
0-20N 0-20S
20S-40S 40S-60S
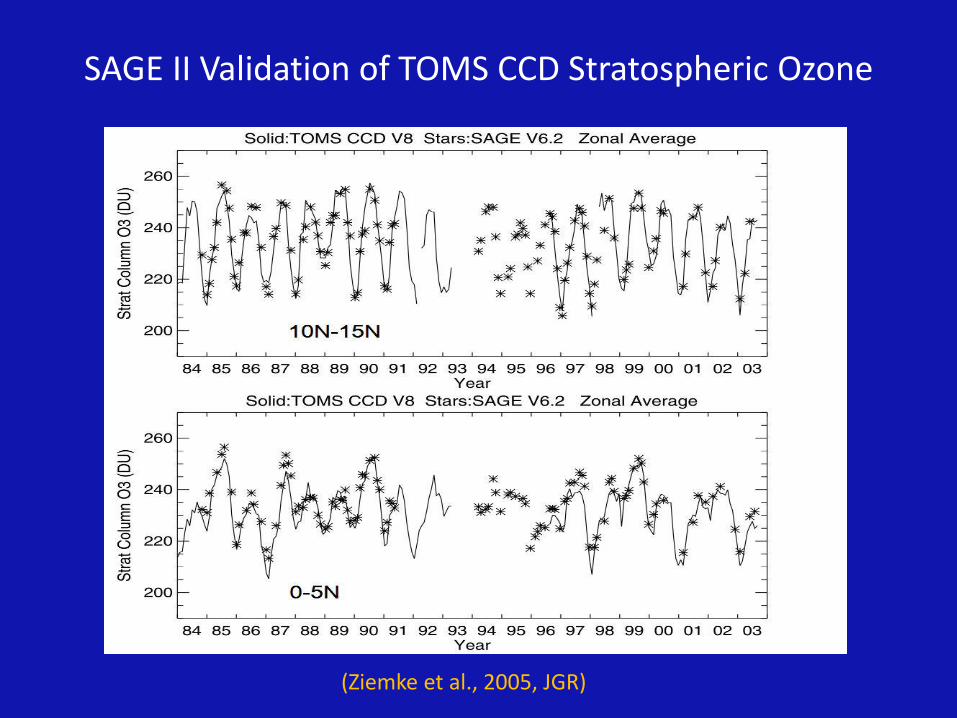
SAGE II Validation of TOMS CCD Stratospheric Ozone
(Ziemke et al., 2005, JGR)

SHADOZ Validation of TOMS CCD Tropospheric Ozone
(Ziemke et al., 2005, JGR)

JUNE-SEPTEMBER MONTHS ONLY
Ozonesonde Analysis: Testing for Drifts and Offsets
Result
Ozonesondes suggest an OMI/MLS drift of about +0.2 DU (not significant) and -2 DU offset

Regional Trends in OMI/MLS Tropospheric Column Ozone Were Published in 2016

OZONESONDES OMI/MLS
GOME-OMI SCIAMACHY

CAM-Chem Tropospheric Ozone Mass Change 1980-2010

CAM-Chem Tropospheric Ozone Mass Change 1980-2010

(Zhang et al., 2016)

Largest OMI/MLS Tropospheric Ozone Trends Over India/East Asia and Further to the East Might be Caused by an Equatorward Shift in Emissions

Evidence of Subtle Row-Anomaly Flagging Error in Standard OMI Total Column Ozone Beginning January 2009
Main Result: Evidence of small artificial increase (~+0.5 DU/decade) in OMI/MLS troposphericozone caused by small row anomaly error in OMI standard-product total ozone
40N-60N 20N-40N
0-20N 0-20S
20S-40S 40S-60S

The GMI Chemical Transport Model Shows Similar Increases in Global Tropospheric Ozone
OMI/MLS GMI CTM
(CTM: 1o × 1.25o)

Publications on Trends in Aura OMI/MLS Tropospheric Ozone
Cooper, O. R., and J. R. Ziemke, Tropospheric ozone, in State of the Climate in 2012, Bull. Amer.Meteorol. Soc., S38-S39, 2013.
Cooper, O. R., D. D. Parrish, J. R. Ziemke, et al., Global distribution and trends of tropospheric ozone: Anobservation-based review, Elementa: Science of the Anthropocne, 2, 000029,doi:10.12952/journal.elementa.000029, 2014.
Cooper, O. R., and J. R. Ziemke, Tropospheric ozone, in State of the Climate in 2013, Bull. Amer.Meteorol. Soc., 95 (7), S42, doi:10.1175/2014BAMSStateoftheLimate.1, 2014.
Cooper, O. R., and J. R. Ziemke, Tropospheric ozone, in State of the Climate in 2014, Bull. Amer.Meteorol. Soc., 96, 7, 548-549, 2015.
Ziemke, J. R., and O. R. Cooper, Tropospheric ozone, in State of the Climate in 2015, Bull. Amer.Meteorol. Soc., 97, 73-75, 2016.
Zhang, Y., O. R. Cooper, A. Gaudel, et al., Tropospheric ozone change from 1980 to 2010 dominated byequatorward redistribution of emissions, Nature Geoscience 9, 875–879 (2016) doi:10.1038/ngeo2827,2016.
Ziemke, J. R., and O. R. Cooper, Tropospheric ozone, in State of the Climate in 2016, Bull. Amer. Meteorol. in press, 2017.


Aircraft (IAGOS) Measurements for India and SE Asia: Huge Increases in Tropospheric Ozone for 1994-2014(Adapted from Zhang et al., 2016, Nature Geosci.)

Aircraft (IAGOS) Measurements for India and SE Asia: Large Increases in Tropospheric Ozone for 1994-2014

Aircraft (IAGOS) Measurements Prescribe Increases in Tropospheric Ozone over India and SE Asia for 1994-2014
(Adapted from Zhang et al., 2016, Nature Geosci.)

Tropospheric Ozone Trends: Apply Two Independent Regression Analyses for TOMS
(1979-2005) and OMI/MLS (2005-2016)
Multivariate Linear Regression Model for Evaluating Ozone Trends:
Where (Similar for Other Regression Coefficients B, C, D, E, F):

July 2015
OMPS NM-LP Tropospheric Ozone
July 2016
October 2015 October 2016
Dobson Units Dobson Units

OZONESONDES OMI/MLS
GOME-OMI
IASI FORLI IASI SOFRID
OMI-RAL
TOAR Report in 2017 (Confidential, Do Not Distribute)

Zhanget al.,2016

Zhanget al.,2016

Zhanget al.,2016

OMI/MLS Trends in Tropospheric Ozone: India / SE Asia / East Asia Trends Largest During JJA
DJF MAM
JJA SON

OMI/MLS Trends for India / SE Asia:Largest During JJA


MLS minus OMI
Validation: No Drift Detected Between MLS and OMI