trends in the supply and demand of coal and · after overcoming the asian currency ... this report...
TRANSCRIPT

The 388th Forum on Research Works June 30, 2004
Coal Supply and Demand Trends and Challenges Facing a Stable Coal Supply in Japan
- Coal Use Considering Global Warming Prevention and the Prospects of Coal Use -
Yoshimitsu MIMUROTO*, Koichi KOIZUMI**
Purpose of the Report Demand for coal, particularly steaming coal for power generation, has increased considerably since the second oil crisis due to its low cost and stable supply compared to other fossil fuels. After overcoming the Asian currency crisis of 1997, Asian countries increased their power demand in order to achieve further economic growth. Behind such factors as the deregulation of electric utilities, demand for steaming coal is expected to increase even further as a low-cost fuel for power generation. The most significant problem posed by coal is the large amount of carbon dioxide (CO2) emitted upon coal firing. Fossil fuels all generate carbon dioxide to some extent when they are burned, but the CO2 intensity of steaming coal is 1.8 times that of natural gas. Therefore, restrained use of coal is promoted in some quarters considering global warming prevention. However, the energy market is seeking an energy mix that not only considers global warming but that also has a secure, stable supply and is economically efficient. This report examines the current situation of steaming coal supply and demand, mainly in Asia, and particularly the price hike of steaming coal observed since the end of 2003 and its future prospects. In addition, it studies ideal future coal use that considers global warming prevention. Major Findings
(1) As history indicates, the basic merit in the use of coal is its price competitiveness. (2) The present high prices can be attributed to the increase in demand, including the special
procurements by China, and a decline in the additional export capacities of countries due to the foreign exchange situation. The market-clearing price for Australian steaming coal is
* Senior Research Fellow, Coal Group, Industrial Research Unit, The Institute of Energy Economics, Japan ** Senior Engineer, Coal Group, Industrial Research Unit, The Institute of Energy Economics, Japan
1

A$40-50/ton (US$ 28-35/ton at the rate of 0.7 US$/A$). About three years will be required to expand the supply capacity to meet the demand expansion.
(3) Coal demand is likely to stay active mainly in Asia, and the supply capacity for Australian coal can be expected to increase. However, there are challenges to be addressed in reinforcing the supply capacity of China and Indonesia.
(4) While the future energy market will choose fuels based on price competitiveness, stable supply, and environmental consideration, coal use will be selected based on the following three aspects as a set: price competitiveness, competitive clean coal technology (CCT), and the Kyoto Mechanisms.
(5) A shift to coal could become a fuel option according to the achievements in these three aspects.
1. Trends in Coal Supply and Demand and Coal Prices The upward trend in the spot prices for steaming coal since the end of 2003 shows no signs of slowing down, and the coal supply on the market continues to be rather scarce. The underlying factors and the future prospect of an increase in the current coal price will be examined below after comparing the changes in coal prices to those in prices of other fossil fuels. 1-1 Price stability and price competitiveness The average price of imported coking coal has shifted between ¥4,000-10,000/ton, while that of imported steaming coal has shifted between ¥3,500-8,000/ton since 1990, as shown in Figure 1-1. These price movements may seem considerably large, but when the price per unit calorific value (1,000 kcal) is compared with that of other imported fossil fuels as indicated in Figures 1-2 and 1-3, the price movements are found to be extremely small. In addition, coal prices are lower than the prices of other imported fossil fuels. The changes in the CIF prices of coking coal, steaming coal, crude oil, and liquid natural gas (LNG) per 1,000 kcal in Japan are shown in yen in Figure 1-2 and in U.S. dollars (US¢) in Figure 1-3. These graphs clearly indicate the price differences between coal and other fossil fuels, and they reveal that coal is the lowest in cost and is only experiencing slight price fluctuations. The coal prices moved as if they were linked with oil prices until the second oil crisis, but this correlation has not been obvious since then. When indicated in yen, the price levels of crude oil and LNG since 2000 are not found to be as high as the price levels observed during and after the second oil crisis. However, this is due to the influence of the exchange rate (appreciation of the yen).
2
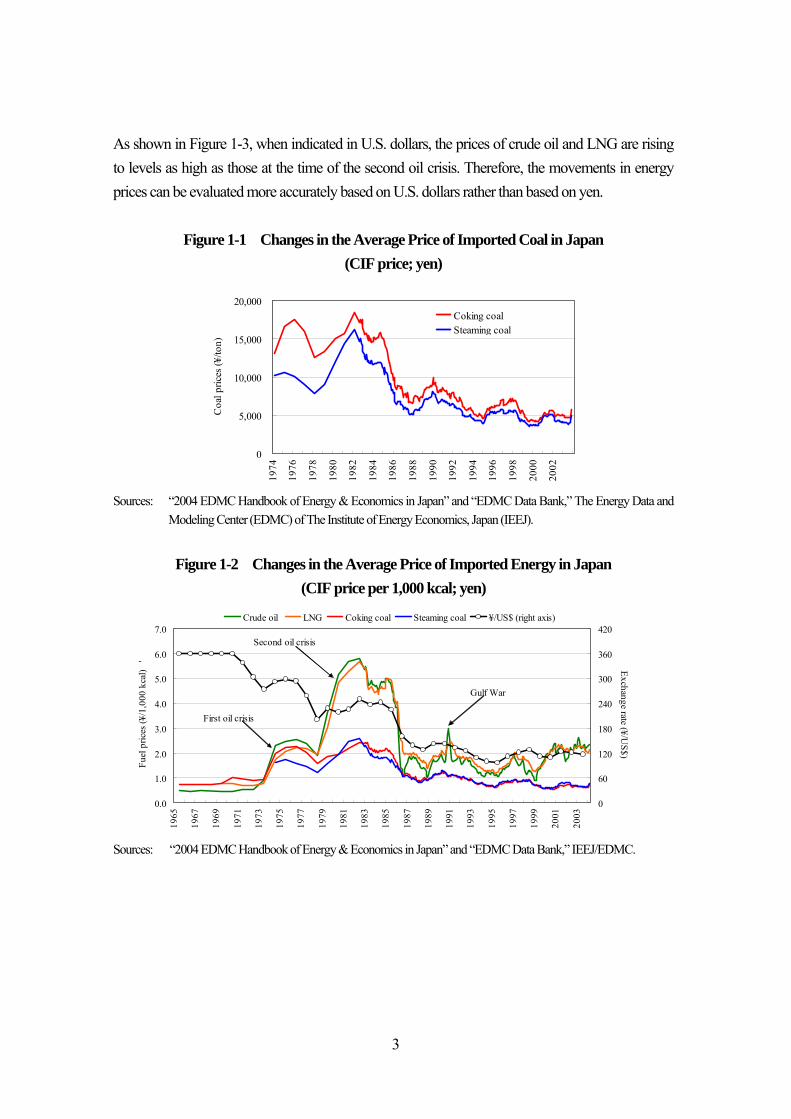
As shown in Figure 1-3, when indicated in U.S. dollars, the prices of crude oil and LNG are rising to levels as high as those at the time of the second oil crisis. Therefore, the movements in energy prices can be evaluated more accurately based on U.S. dollars rather than based on yen.
Figure 1-1 Changes in the Average Price of Imported Coal in Japan (CIF price; yen)
0
5,000
10,000
15,000
20,000
1974
1976
1978
1980
1982
1984
1986
1988
1990
1992
1994
1996
1998
2000
2002
Coa
l pric
es (¥
/ton)
Coking coalSteaming coal
Sources: “2004 EDMC Handbook of Energy & Economics in Japan” and “EDMC Data Bank,” The Energy Data and
Modeling Center (EDMC) of The Institute of Energy Economics, Japan (IEEJ).
Figure 1-2 Changes in the Average Price of Imported Energy in Japan (CIF price per 1,000 kcal; yen)
0.0
1.0
2.0
3.0
4.0
5.0
6.0
7.0
1965
1967
1969
1971
1973
1975
1977
1979
1981
1983
1985
1987
1989
1991
1993
1995
1997
1999
2001
2003
Fuel
pric
es (¥
/1,0
00 k
cal)
'
0
60
120
180
240
300
360
420
Exchange rate (¥/US$) '
Crude oil LNG Coking coal Steaming coal ¥/US$ (right axis)
Second oil crisis
First oil crisis
Gulf War
Sources: “2004 EDMC Handbook of Energy & Economics in Japan” and “EDMC Data Bank,” IEEJ/EDMC.
3

Figure 1-3 Changes in the Average Price of Imported Energy in Japan (CIF price per 1,000 kcal; US¢)
0.0
0.5
1.0
1.5
2.0
2.5
3.019
65
1967
1969
1971
1973
1975
1977
1979
1981
1983
1985
1987
1989
1991
1993
1995
1997
1999
2001
2003
Fuel
pric
es (U
S¢/1
,000
kca
l)
Crude oil LNG Coking coal Steaming coal
Second oil crisis
First oil crisis
Gulf War
Sources: “2004 EDMC Handbook of Energy & Economics in Japan” and “EDMC Data Bank,” IEEJ/EDMC.
1-2 Steep rise in the steaming coal prices Figure 1-4 indicates the changes in the spot FOB prices of steaming coal exported from the Port of Newcastle, Australia (Barrow Jonker Index (BJI) spot prices) and the FOB prices based on long-term contracts for Japan-bound Australian steaming coal in and after 1986.
Figure 1-4 Changes in the Spot FOB Prices of Steaming Coal Shipped from the Port of Newcastle (BJI Spot Prices)
20
25
30
35
40
45
50
55
60
Jan-
1986
Jan-
1987
Jan-
1988
Jan-
1989
Jan-
1990
Jan-
1991
Jan-
1992
Jan-
1993
Jan-
1994
Jan-
1995
Jan-
1996
Jan-
1997
Jan-
1998
Jan-
1999
Jan-
2000
Jan-
2001
Jan-
2002
Jan-
2003
Jan-
2004
(US$/ton)
BJI
Japan Long-term Contracts
Note: “BJI” indicates the spot FOB prices of steaming coal exported from the Port of Newcastle, Australia. “Japan Long-term Contracts” indicates the FOB prices based on long-term contracts for Japan-bound Australian steaming coal.
Sources: “Coal 2003,” Barlow Jonker; and other materials.
4

The Japanese power companies rely on long-term contracts (including fiscal-year contracts) for 70% of the steaming coal they procure, and procurement by spot contracts has remained below 30%. Steaming coal users other than power companies procure coal by yearly contracts or spot contracts rather than long-term contracts. The spot prices of steaming coal are decided by market principles based on the supply and demand situation, and they change earlier than the prices based on long-term contracts. Normally, the spot prices fall below the long-term contract-based prices and become stable after a price boom (when the supply comes to sufficiently meet the demand). The spot prices of steaming coal exceeded the long-term contract-based prices for FY 2003 in September 2003, and have indicated an unprecedented surge since then. In the past, steaming coal prices have repeated a rise and fall in six-year cycles, but this time, they are booming in a shorter cycle of three years and a half. The factors behind the steaming coal price hike will be examined below, separately for those on the demand side and the supply side.
(1) Factors on the demand side “Expansion of steaming coal demand in Asian countries” The firm increase in coal demand, centering on steaming coal for power generation, in Asian countries and region including Japan, South Korea, and Taiwan is at the base of the steaming coal price hike. Figure 1-5 indicates the year-on-year changes in consumption of coal for power generation in Japan, South Korea, and Taiwan in a bar graph and compares them with the steaming coal spot prices. In 1989, steaming coal consumption was restrained in Japan and South Korea due to the price increase as well as the slump in crude oil prices. The share of coal-fired power in the two countries had been smaller than that at the present and had responded sensitively to fuel prices. From the 1990s, many countries and regions came to place more emphasis on coal-fired power as source of base-load power supply. Figure 1-5 indicates that the steaming coal price has risen in the year following a year in which consumption of coal for power generation expanded in the three countries and region from the 1990s. This tendency showed up in the consumption expansion in 1994, the price increase in 1995, the consumption expansion in 2000, and the price increase in 2001. The recent steaming coal price hike also occurred following the significant consumption expansion in 2003.
5

Figure 1-5 Changes in the Consumption of Coal for Power Generation and the BJI Spot Prices
10
15
20
25
30
35
40
45
50
55
60
Jan-
1987
Jan-
1988
Jan-
1989
Jan-
1990
Jan-
1991
Jan-
1992
Jan-
1993
Jan-
1994
Jan-
1995
Jan-
1996
Jan-
1997
Jan-
1998
Jan-
1999
Jan-
2000
Jan-
2001
Jan-
2002
Jan-
2003
Jan-
2004
BJI
Spo
t Pri
ces (
US$
/ton)
-2
0
2
4
6
8
10
12
14
16
18
Year-on-year changes (m
illion tons) '
Japan South Korea Taiwan BJI Spot Prices (US$/ton)
Note: The bar graph indicates the amount of increase/decrease in consumption of coal for power generation in Japan, South Korea, and Taiwan over the previous year.
Sources: “Coal 2003,” Barlow Jonker; “EDMC Data Bank,” IEEJ/EDMC; “Korea Energy Review Monthly, Mach 2004,” Korea Energy Economics Institute (KEEI); “Energy Statistical Data Book 2002,” Energy Commission, Ministry of Economic Affairs, Taiwan; and other materials.
(2) Factors on the supply side “Decline in China’s export capacity” China’s coal exports steadily increased in 2000 and 2001 due to its policy of encouraging coal exports, and Chinese coal came to increase importance in Asia, particularly in East Asian countries, as a nearby source. However, since 2002, export growth has been stagnant compared to the expansion in the production volume due to the rapid increase in the domestic coal demand within China. As shown in Figure 1-6, the proportion of export volume in coal production volume declined in 2002 and 2003.
6

Figure 1-6 Changes in the Coal Production Volume and Coal Export/Import Volumes in China
1.6%1.8% 1.8% 1.7% 2.0% 2.1%2.6% 2.2% 2.6% 3.6%
5.5%
7.8% 6.0%5.6%
0
200
400
600
800
1,000
1,200
1,400
1,600
1,800
2,000
1990 1992 1994 1996 1998 2000 2002
Coa
l pro
duct
ion
volu
me
(mill
ion
tons
)
0
20
40
60
80
100
120
140
160
180
200
Coal export/im
port volumes (m
illion tons)
Export volume (right axis) Import volume (right axis)Production volume (left axis)
Note: The percentage (%) in the graph indicates the proportion of export volume in coal production volume. Sources: “China Statistical Yearbook” (of the respective years), China Statistics Press; and “China Coal Industry
Yearbook” (of the respective years), China Coal Industry Publishing House.
“Appreciation of the Australian dollar” With the U.S. dollar’s depreciation, the exchange rate of the currency of Australia, which is a major coal exporting country, has been on the rise since 2002 (Figure 1-7). The coal traded in U.S. dollars produced enormous profits for Australian coal producers because of the Australian dollar’s depreciation and the coal price increase occurred at the same time from 2001 to 2002. Nevertheless, from the second half of 2002 to the beginning of 2003, coal prices slumped while the Australian dollar became stronger. Therefore, Australian coal producers faced severe conditions, not being able to realize the profits they had before. Because of this, they seem to have not been able to respond actively to the expanding demand, and became incapable of providing timely supply in pace with the demand expansion.
Figure 1-7 Comparison of the BJI Spot Prices by Currency
20
30
40
50
60
70
Jan-
1997
Jan-
1998
Jan-
1999
Jan-
2000
Jan-
2001
Jan-
2002
Jan-
2003
Jan-
2004
BJI
spot
pri
ces (
US$
/ton,
A$/
ton)
'
0.40
0.45
0.50
0.55
0.60
0.65
0.70
0.75
0.80
0.85
0.90
Exchange rate (U
S$/A$) '
BJI spot prices (US$/ton) BJI spot prices (A$/ton) Exchange rate (US$/A$)
Sources: “Coal 2003,” Barlow Jonker; and other materials.
7

As a result, the Australian export steaming coal stocks began to a decline in October 2003 as shown in Figure 1-8, and the rise in steaming coal spot prices increased its pace in line with this.
Figure 1-8 Changes in the Australian export steaming coal stocks and the BJI Spot Prices
20
30
40
50
60
70
Jan-
2000
Jul-2
000
Jan-
2001
Jul-2
001
Jan-
2002
Jul-2
002
Jan-
2003
Jul-2
003
Jan-
2004
BJI
spot
pri
ces (
US$
/ton,
A$/
ton)
'
0
1
2
3
4
5
6
7
8
9
10
Coal inventories (m
illion tons)
BJI spot prices (US$/ton) BJI spot prices (A$/ton)Export steaming coal stocks
Sources: “Coal 2003,” Barlow Jonker; monthly “Australian Coal Report.”
“The United States unable to act as the swing producer” The United States had played a role of the swing producer, which was to increase the coal supply to the market when the coal prices boomed in order to contain the price rise. This time, however, it has not been able to play that role so far. The United States has not managed to demonstrate sufficient exporting capability at this point, because the U.S. dollar retained a strong tone from 1998 to 2002 and the steaming coal prices have slumped since 1998, causing a decline in export capacity.
Figure 1-9 Changes in the BJI Spot Prices and the U.S. Steaming Coal Export Volume
10
15
20
25
30
35
40
45
50
55
60
Jan-
1986
Jan-
1987
Jan-
1988
Jan-
1989
Jan-
1990
Jan-
1991
Jan-
1992
Jan-
1993
Jan-
1994
Jan-
1995
Jan-
1996
Jan-
1997
Jan-
1998
Jan-
1999
Jan-
2000
Jan-
2001
Jan-
2002
Jan-
2003
Jan-
2004
BJI
spot
pri
ces (
US$
/ton)
0
5
10
15
20
25
30
35
40
45
50 U.S. steam
ing coal export volume (m
illion tons) '
U.S. steaming coal export volume BJI spot prices
Sources: “Coal 2003,” Barlow Jonker; “Coal Information 2003,” the International Energy Agency (IEA) of the
Organization for Economic Cooperation and Development (OECD); and other materials.
8

“Frequent occurrence of natural disasters and accidents” In 2003, many unexpected contingencies occurred, including frequent coal mine accidents in China, a decline in production capacity due to heavy rain in Indonesia and Australia (State of Queensland), and reduced export capacity. (3) Other “A surge in freight” In the recent coal price hike, the surge in freight since the latter half of September 2003 also contributed to pushing up the coal import price. The freight has gradually decreased since March 2004 and has almost returned to the level before the hike by June 2004.
Figure 1-10 Changes in Freight Since June 2003
0
5
10
15
20
25
30
1-Ju
n-20
03
1-Ju
l-200
3
1-A
ug-2
003
1-Se
p-20
03
1-O
ct-2
003
1-N
ov-2
003
1-D
ec-2
003
1-Ja
n-20
04
1-Fe
b-20
04
1-M
ar-2
004
1-A
pr-2
004
1-M
ay-2
004
1-Ju
n-20
04
Japa
n-bo
und
frei
ght (
US$
/ton)
Panamax: Australia (QLD) → Japan (Chiba) Panamax: Indonesia (South Kalimantan) → Japan (Chiba)
Panamax: China (Qinhuangdao) → Japan (Chiba) Cape size: Australia (QLD) → Japan (Kagoshima) Sources: Freight Investor Services (FIS) Limited; The TEX Report; and other materials. 1-3 Steaming coal supply and demand trends and challenges for stabilizing supply 1-3-1 Growing coal demand in Asia Coal demand is expected to expand on a premise that coal will continue to be supplied in a stable manner at a lower cost compared to other fossil fuels. Figure 1-11 shows the prospects of coal demand in Asia indicated in “International Energy Outlook 2004” released by the Energy Information Administration (EIA) of the U.S. Department of Energy (DOE). According to this, coal demand is expected to grow in all of the cases (the average annual growth rate from 2001 to 2020 is 3.1% for the high economic growth case, 2.4% for the reference case, and 1.7% for the low economic growth case).
A similar result is indicated in the outlook that was released by the Energy Data and Modeling Center (EDMC) of the Institute of Energy Economics, Japan (IEEJ) in March of this
9

year. Its forecast is close to the EIA’s high economic growth case (an annual average growth rate of 2.9%). The black solid line in Figure 1-11 shows the total of the maximum values of country-specific coal supply and demand prospects made by various organizations of the respective countries. It indicates the presence of a potential coal demand that greatly exceeds the EIA’s high economic growth case.
Figure 1-11 Prospects of Coal Demand in Asia
3,652
2,612
3,092
4,260
3,210
2,8252,478
3,661
3,104
2,346
1,556
2,8252,579
1,9222,041
2,656
3,487
1,000
2,000
3,000
4,000
5,000
1990 1995 2000 2005 2010 2015 2020 2025
(million tons)
EIA’s high economic growth caseEIA’s reference caseEIA’s low economic growth casePotential coal demandIEEJ’s prospects
Note: The weight conversion for the oil/coal equivalent is based on 5,000 kcal/kg for China and India, and 6,200
kcal/kg for other countries/regions. Sources: “International Energy Outlook 2004,” the U.S. DOE/EIA; “Asia/World Energy Outlook (March 2004),” the
IEEJ; and other materials.
1-3-2 Increase in the production capacity of export coal According to “Coal Information 2003” of the OECD/IEA, the world’s coal producers supplied 580 million tons (403 million tons of steaming coal and 176 million tons of coking coal) to the international market (seaborne coal trade) as of 2002 (Table 1-1). However, their production capacity of export coal is 700 million tons (504 million tons of steaming coal and 195 million tons of coking coal), so they have excess supply capacity as a whole. The OECD/IEA analyzes that an additional export production capacity of 306 million tons will be achieved around the world by 2007, which will total more than one billion tons combined with the production capacity of export coal in 2002. Even if the production capacity of export coal in 2002 decreases by 30% due to the termination of mining operations at existing mines, as long as the additional export production capacity is achieved as planned, the total production capacity of export coal will still be 790 million tons, which satisfies the world’s coal trade of 730 million tons in 2010 (reference case) as predicted by the U.S. DOE/EIA. Nevertheless, the cause of
10

concern is that the projects for the 210 million tons, among the additional production capacity of export coal, were still in the planning phase instead of the implementation phase as of 2002.
Table 1-1 Additional Production Capacity of Export Coal Expected to be Achieved by 2007
(million tons/year)
Steamingcoal Coking coal Total
Firmcommitment atexisting mines
Firmcommitmentnew mines
Plannedadditions to
existing mines
Planned newmines Total
Australia 116.2 121.8 238.0 24.1 25.3 26.3 68.0 143.7 381.7China 86.5 6.7 93.2 7.2 1.0 0.0 2.0 10.2 103.4Indonesia 88.1 0.0 88.1 6.4 0.0 25.5 13.5 45.4 133.5South Africa 72.5 4.6 77.1 14.1 0.0 2.8 13.9 30.8 107.9Columbia 50.3 2.1 52.4 3.5 0.0 16.9 11.6 32.0 84.4United States 20.7 19.5 40.2 2.0 4.0 0.0 0.0 6.0 46.2Russia 33.4 6.8 40.2 - - - - - 40.2Canada 7.7 26.0 33.7 3.1 2.0 0.0 9.0 14.1 47.8Poland 14.0 3.0 17.0 - - - - - 17.0Venezuela 6.1 2.3 8.4 0.0 2.5 3.4 10.0 15.9 24.3Vietnam 5.5 0.0 5.5 0.0 0.0 0.0 2.0 2.0 7.5Other 2.8 1.8 4.6 1.8 0.3 0.6 2.7 5.4 10.0
Total 503.8 194.6 698.4 62.2 35.1 75.5 132.7 305.5 1,003.9
Total world export in 2002 402.8 175.9 578.7 794.4
Proportion of export volumeto the production capacity of
export coal in 200280.0% 90.4% 82.9% 730.1 (91.9%)
Totalproductioncapacity ofexport coal
Production capacity of export coal assuming a 30%decrease due to closing of mines
The world’s coal trade volume in 2010 (reference case)predicted by the EIA
Production capacity of export coalin 2002
Additional production capacity of export coalexpected to be achieved by 2007
Note: “Total world export in 2002” indicates the volume of seaborne coal, and the “production capacity for exported
coal” is limited to production capacity for coal subject to seaborne trade. Sources: “Coal Information 2003,” OECD/IEA; “International Energy Outlook 2004,” U.S. DOE/EIA. 1-3-3 Risk factors in supplying steaming coal (1) Diversification of supply sources Figure 1-12 illustrates the coal flow in 2002. The size of the Asian coal market is 340 million tons, steaming coal and coking coal combined. Australia, China, and Indonesia supply 160 million tons (46%), 80 million tons (23%), and 60 million tons (18%) respectively, supporting nearly 90% of the Asian market. Such large coal producing countries as China, the United States, and India mainly produce coal for domestic demand, and their production for export is less than 10% as shown in Figure 1-13. Since 2001, China has developed into the second largest coal exporter following Australia (see Figure 1-17 Changes in Coal Export Volumes of Major Coal Exporting Countries on p.19). The changes in China’s export volumes (domestic coal supply and demand situation) have even come to affect the world’s coal trade. Coal is widely distributed around the world except the Middle East as shown in Figure 1-14. However, not many countries are capable of providing stable supply of coal to the
11

international market. In the case of Japan, almost 90% of the coal supply comes from Australia (over 55%), China (nearly 20%), and Indonesia (nearly 15%).
Figure 1-12 Coal Flow (2002 estimate)
Australia197.9Mt
OECD Europe154.9Mt
Rest of Asia181.5Mt
South America19.9Mt
North America38.8MtJapan
157.8Mt
OECD Europe38.2Mt
18.6Mt
49.5Mt28.8Mt
6.4Mt
7.0Mt
25.3Mt
5.7Mt
9.3Mt
1.2Mt9.6Mt
5.7Mt
1.6Mt
16.8Mt
14.4t
17.4Mt
6.9Mt
8.4Mt
2.3Mt
10.1Mt
Indonesia73.0Mt
South Africa68.7Mt
Poland22.6Mt
China85.7Mt
Canada26.8Mt
USA34.6Mt
Columbia34.4Mt
Former USSR40.8Mt
43.9Mt
66.5Mt
89.8Mt
Africa/Middle East18.4Mt
30.0Mt
2.2Mt
Rest of Europe4.7Mt
10.2Mt
18.9Mt
46.7Mt
4.7Mt
3.2Mt
Source: “Coal Information 2003,” OECD/IEA.
Figure 1-13 Production Volume and Export Volume of Major Coal Producing Countries (2002 estimate)
7345
69198
35
86
0
200
400
600
800
1,000
1,200
1,400
China
USA India
Austral
ia
South
Africa
Russia
Indon
esia
Columbia
Canad
a
Vietna
m
Top: Production volume Middle: Proportion of exported coal in the coal production volume Bottom: Proportion of coal exported to Japan in the total coal export volume
1,3266.5%
33.6%
(million tons)
16427.6%14.3% 13
36.7%30.3%
3090.4%34.6%
4085.2%0.1%
10172.1%25.5%
22330.8%1.3%
27671.7%45.8%
3340.5%0%
9173.8%3.6%
Exportvolume
World’s total coal export: 640 million tons World’s total coal production: 3.84 billion tons
Note: The export volume is indicated in the bar graph as part of the production volume. Source: “Coal Information 2003,” OECD/IEA.
12
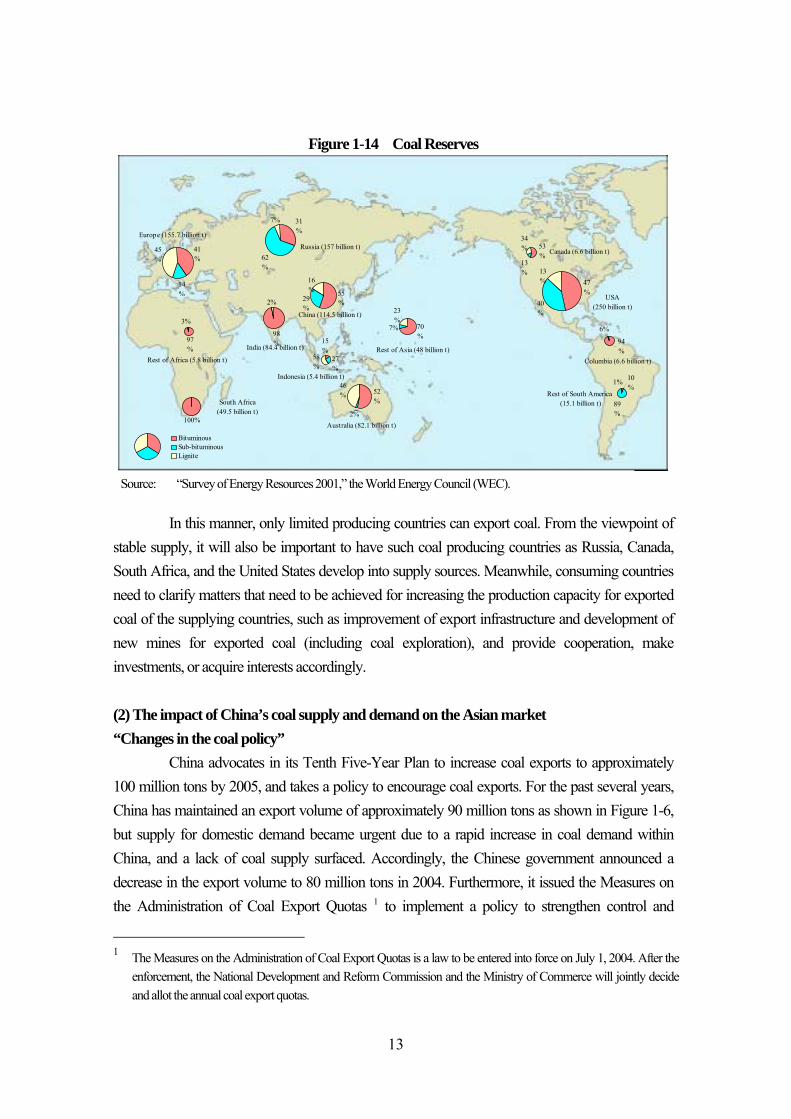
Figure 1-14 Coal Reserves
100%
South Africa(49.5 billion t)
47%
40%
13%
USA(250 billion t)
97%
3%
Rest of Africa (5.8 billion t)
Canada (6.6 billion t)
6%
94%
Columbia (6.6 billion t)
Rest of South America (15.1 billion t)
2%
98%
29%
16% 55
%
China (114.5 billion t)
India (84.4 billion t)
Indonesia (5.4 billion t)
7% 70%
23%
Rest of Asia (48 billion t)
62%
7% 31%
Russia (157 billion t)
14%
45%
41%
Europe (155.7 billion t)
2%
46% 52
%
Australia (82.1 billion t)
27%
58%
15%
89%
10%
1%
13%
53%
34%
BituminousSub-bituminousLignite
Source: “Survey of Energy Resources 2001,” the World Energy Council (WEC). In this manner, only limited producing countries can export coal. From the viewpoint of stable supply, it will also be important to have such coal producing countries as Russia, Canada, South Africa, and the United States develop into supply sources. Meanwhile, consuming countries need to clarify matters that need to be achieved for increasing the production capacity for exported coal of the supplying countries, such as improvement of export infrastructure and development of new mines for exported coal (including coal exploration), and provide cooperation, make investments, or acquire interests accordingly. (2) The impact of China’s coal supply and demand on the Asian market “Changes in the coal policy” China advocates in its Tenth Five-Year Plan to increase coal exports to approximately 100 million tons by 2005, and takes a policy to encourage coal exports. For the past several years, China has maintained an export volume of approximately 90 million tons as shown in Figure 1-6, but supply for domestic demand became urgent due to a rapid increase in coal demand within China, and a lack of coal supply surfaced. Accordingly, the Chinese government announced a decrease in the export volume to 80 million tons in 2004. Furthermore, it issued the Measures on the Administration of Coal Export Quotas 1 to implement a policy to strengthen control and
1 The Measures on the Administration of Coal Export Quotas is a law to be entered into force on July 1, 2004. After the
enforcement, the National Development and Reform Commission and the Ministry of Commerce will jointly decide and allot the annual coal export quotas.
13

adjustment of export volumes. In the beginning of 2004, the Chinese government changed its course to abolish the firmly maintained export encouraging policy in order to prioritize domestic demand. The concrete measures taken are the three measures below. However, these measures are expected to increase the burden on producers of coal for export and raise the prices of the exported coal. For instance, the price is expected to rise by US$3.5-4.0/ton when shipped from a mine in the northern part of Shanxi Province.
(i) Reduction of the refund rate of value-added tax Steaming coal and anthracite: 13% → 11% (January 1, 2004) Coking coal and coke: 13% → 5% (January 1, 2004) → 0% (May 24, 2004)
(ii) Abolition of the system of exempting railway transportation of coal from payment to the railway construction fund (May 1, 2004)
(iii) Abolition of the preferential treatment on port construction fee for use of port facilities for coal
“Coal prices” Unlike in the international market, the prices for coal are set independently in China’s domestic coal market. Figure 1-15 shows the BJI spot prices that have been cited earlier and the FOB prices of steaming coal for the Chinese domestic market that is shipped from Qinhuangdao. In 2002 and 2003, the situation continued to be more advantageous for Chinese coal producers to sell coal domestically than to supply coal to the international market. During this period, the Chinese government could not increase the export volume along with the expansion of the production volume, as pointed out earlier, but it maintained the export volume at the 2001 level by continuing to implement the export encouraging measures, despite the gap between the prices inside and outside. While the Chinese government has announced the coal export volume for 2004 to be 80 million tons, it has already issued export licenses for 60 million tons of coal. Since Chinese coal exports largely depend on the policy indicated by the Chinese government, if a policy to prioritize domestic demand is taken, the volume of supply to the international coal market will not increase and will not contribute to lowering the coal prices in the international market. It will be important to keep a careful eye on the domestic prices of Chinese coal and keep an eye on even the slightest signs indicating Chinese government’s coal policy.
14

Figure 1-15 Changes in the BJI Spot Prices and Prices of Steaming Coal for the Chinese Domestic Market
15
20
25
30
35
40
45
50
55Ja
n-20
00
Jul-2
000
Jan-
2001
Jul-2
001
Jan-
2002
Jul-2
002
Jan-
2003
Jul-2
003
Jan-
2004
Stea
min
g co
al p
rice
s (U
S$/to
n )BJI spot pricesFOB prices for coal for the Chinese domestic market (shipped from Qinhuangdao)
Note: BJI spot prices: 6,700 kcal/kg (AD)
Prices of steaming coal for the Chinese domestic market: 6,000 kcal/kg (AR) Sources: “Coal 2003,” Barlow Jonker; “Japan China Energy Forum - Monthly Report”; and other materials. “Outlook on coal supply and demand” Based on the current coal production capacity of China, the additional production capacity is not likely to catch up with the rapid increase in the domestic coal demand in the short term, so the coal supply and demand situation will remain tight for some time. China is considering a production plan that will meet the future domestic demand in line with the Eleventh Five-Year Plan. Therefore, the coal supply and demand is expected to become balanced in the medium to long term by reviewing the current production capacity expansion plan. However, the problem of limited resources caused by lack of exploration (lack of minable coal reserves due to insufficient close investigation) is drawing attention, so resource exploration should be conducted promptly in order to allow continuous construction of new coal mines.
♦ Short-term outlook (i) Priority on domestic demand → This would also affect exports. It may be difficult to
export coal in the time frame desired by consumers. (ii) There is a risk that the actual exports may not reach the export target of 80 million tons. (iii) Imports may grow in the southeastern coastal areas. (iv) Time lag in the development of new coal mines and limits in the transportation capacity
→ It would be difficult to expand domestic production to catch up with the demand in the short term.
15
♦ Long-term prospects (i) Production expansion by development of new mines and reinforcement of the
transportation infrastructure → The domestic supply and demand situation may improve, allowing stable exports.
(ii) The import increase in the southeastern areas may balance the domestic demand and supply, and the volume of exports from the northeastern areas may increase as a result.
The rapid growth of the Chinese economy lead to a sudden rise in steel demand. In order to support this steel demand, domestic coal demand is likely to continue expanding in the future. In the event that expansion of the production capacity cannot catch up with the expected demand, it could considerably affect the coal supply and demand balance of not only East Asia, but that of the whole world. As discussed earlier, the crucial step for avoiding such an event is that China raises its own coal supply capacity by securing minable coal resources (resource exploration), developing new mines, and improving the transportation infrastructure. In terms of use, it needs to promote energy saving (improvement of the heat efficiency of coal-fired power generation). Japan and other East Asian countries, which are coal importing countries, should actively get involved in resource exploration, coal mine development, and improvement of coal infrastructure in China in order to secure Chinese coal as a nearby source. In the meantime, China formally joined the World Trade Organization (WTO) as the 143rd member on December 12, 2001. Because of this, there is an observation that China will reduce the import tariffs on coal (steaming coal: 6% of the CIF price; coking coal: 3% of the CIF price) to zero by 2005. If this tariff reduction is implemented, the only constraint on China’s coal imports will be the coal import infrastructure (ports for coal import (unloader, coal yards, etc.) and the domestic transportation system). Therefore, coal imports may dramatically increase in the southeastern coastal areas. In this manner, it is necessary to watch the coal import infrastructure along with the status of improvement of the coal export infrastructure. (3) Development of new coal mines in Indonesia The coal production volume in Indonesia has increased from 340,000 tons in 1980 to 41.32 million tons in 1995, and further to 114.28 million tons in 2003. In addition, its coal exports have also grown over the past several years due to the price competitiveness of the exported coal pertaining to being closer to Asia’s coal consumption areas than Australia. The export volume has increased from 31.32 million tons in 1995 to 85.68 million tons in 2003. Among this, the volume exported to Asia was 66.16 million tons, accounting for about 77% of the entire export volume. The expansion of coal production progressed with great speed when the Indonesian government
16
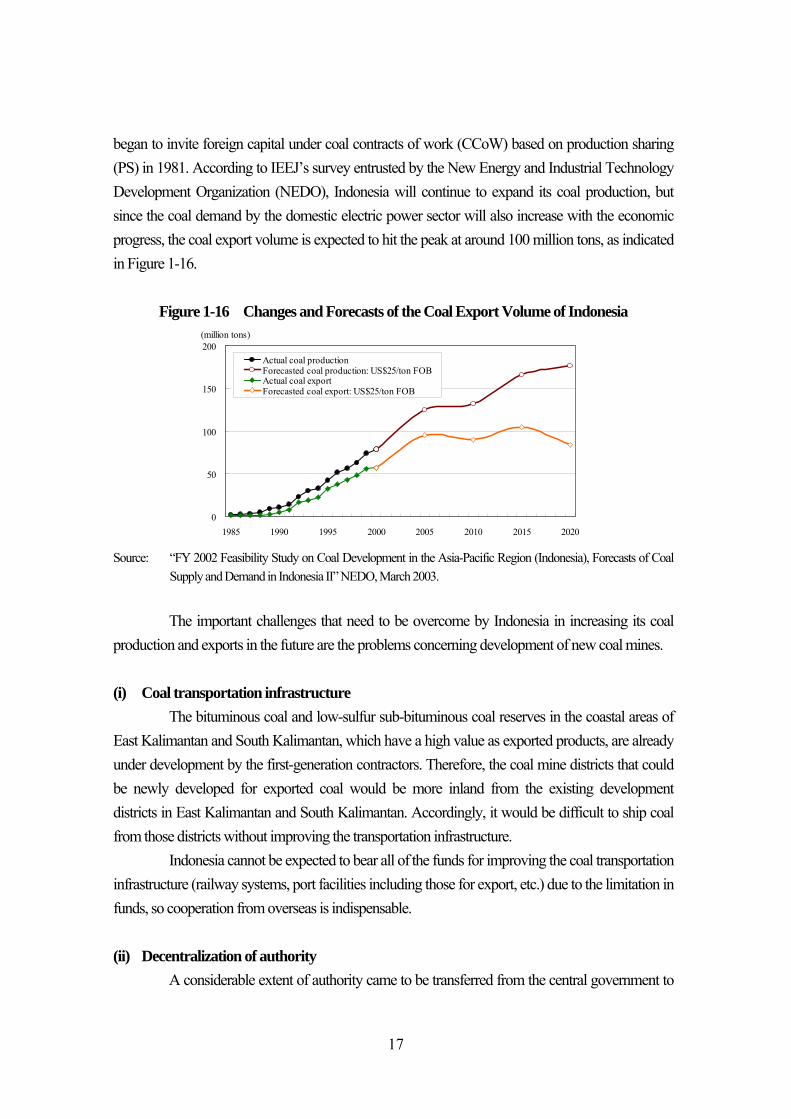
began to invite foreign capital under coal contracts of work (CCoW) based on production sharing (PS) in 1981. According to IEEJ’s survey entrusted by the New Energy and Industrial Technology Development Organization (NEDO), Indonesia will continue to expand its coal production, but since the coal demand by the domestic electric power sector will also increase with the economic progress, the coal export volume is expected to hit the peak at around 100 million tons, as indicated in Figure 1-16.
Figure 1-16 Changes and Forecasts of the Coal Export Volume of Indonesia
0
50
100
150
200
1985 1990 1995 2000 2005 2010 2015 2020
(million tons)
Actual coal productionForecasted coal production: US$25/ton FOBActual coal exportForecasted coal export: US$25/ton FOB
Source: “FY 2002 Feasibility Study on Coal Development in the Asia-Pacific Region (Indonesia), Forecasts of Coal
Supply and Demand in Indonesia II” NEDO, March 2003. The important challenges that need to be overcome by Indonesia in increasing its coal production and exports in the future are the problems concerning development of new coal mines.
(i) Coal transportation infrastructure The bituminous coal and low-sulfur sub-bituminous coal reserves in the coastal areas of East Kalimantan and South Kalimantan, which have a high value as exported products, are already under development by the first-generation contractors. Therefore, the coal mine districts that could be newly developed for exported coal would be more inland from the existing development districts in East Kalimantan and South Kalimantan. Accordingly, it would be difficult to ship coal from those districts without improving the transportation infrastructure. Indonesia cannot be expected to bear all of the funds for improving the coal transportation infrastructure (railway systems, port facilities including those for export, etc.) due to the limitation in funds, so cooperation from overseas is indispensable. (ii) Decentralization of authority A considerable extent of authority came to be transferred from the central government to
17

municipalities with the entry into force of the “Regional Governance Law” and the “Fiscal Decentralization Law” on January 2001. With regard to development of coal resources, the authority on approval and license as well as supervision and management were transferred to the municipality, provincial, and prefectural levels. However, the municipalities, to which the authority has been transferred, are not functioning sufficiently as administrative bodies, so improvements must be made promptly. (iii) Forestry Affairs Law The Forestry Affairs Law, which was enacted in 1999 and entered into force in September 2000, prohibits any resource exploration and open-cut mining in protective forest areas. Although underground mining is possible in those areas, aboveground facilities cannot be constructed, so mining business is practically impossible there. However, the Forestry Affairs Law has provisions that allow these activities under specific conditions set by the government as exceptions to the Forestry Affairs Law. At the time the Forestry Affairs Law entered into force, there were 14 coal mining areas (14 coal producing companies) whose mine sites overlapped with protective forest areas. As a result of deliberations on exempting these coal districts from the law, five mining areas were exempted. When a mining area overlaps with a protective forest area, coal development can no longer be promoted, and the coal producing company’s investment to date will be wasted, while the country’s energy supply plan will also be obstructed. Accordingly, the Ministry of Energy and Mineral Resources is coordinating between coal producing companies and the Ministry of Forestry in order to allow reasonable coal development. (iv) Withdrawal of international resource companies The first-generation contractors operating under PS contracts, which supported the expansion of coal production, must transfer 51% or more of its interests to Indonesian companies (including the central/regional governments) after ten years from starting the commercial production. If this rule is forcibly implemented, it may hinder smooth coal mine management (fund procurement, operation management, etc.) and slow down the pace of coal production and development. BP and Rio Tinto both completely withdrew from KPC, and BHP Billiton withdrew from Arutmin (BHP Billiton merely retains 75% of the distribution rights). Many of the first-generation contractors are international resource companies that have the know-how of coal mine management, so it is not wise to completely exclude these companies from coal mine management. The Indonesian government should take measures to have them participate in the management in some form.
18

(4) Bottleneck in expansion of coal export in Australia As shown in Figure 1-17, Australia has commanded the top share in coal supply in the international coal market since 1986, and provides a stable supply to the expanding Asian coal market. It also greatly contributes to Japan’s coal imports, accounting for almost 60% of the total coal volume imported by Japan. The problem in the case of Australia is in the transportation capacity of coal exporting ports. As indicated in Table 1-12, the two exporting ports in the State of Queensland recorded a handling volume beyond the annual loading capacity in 2002 with the overall handling volume of ports reaching 95% of the capacity as well. The State of New South Wales still has some capacity, but demurrage has been incurred in practice. Since the export volume was increased in 2003, the situation is expected to become even severer.
Figure 1-17 Changes in Coal Export Volumes of Major Coal Exporting Countries
0
50
100
150
200
1980 1982 1984 1986 1988 1990 1992 1994 1996 1998 2000 2002
(million tons) Australia China Indonesia South Africa Canada USA
Note: The values for 2002 are estimates. Those for 2003 are the preliminary figures released by the respective
national governments. Source: “Coal Information 2003,” OECD/IEA; and other materials.
Table 1-2 The Actual Export Volume and Export Capacity of Australian Coal Exporting Ports
Coal exporting portsin NSW
Coal exporting portsin QLD
Newcastle 70,600 89,000 Abbott Point 12,600 12,000
Kooragang 51,100 64,000 Dalrymple Bay 42,300 45,500
Port Waratah 19,500 25,000 Hay Point 29,700 34,000
Port Kembla 8,300 16,000 Gladstone 37,700 35,000
Fisherman Islands 3000 5000
Annual loadingcapacity
(thousand tons)Handling volume
in 2002Annual loading
capacityHandling volume
in 2002
Source: “Australian Black Coal Statistics 2002,” Coal Services Pty Ltd. and QLD Department of Natural Resources &
Mines.
19

The demurrage problem at Port of Newcastle is serious. In the middle of March 2004, demurrage was incurred on more than 50 vessels. Port Waratah Coal Service Ltd. (PWCS) operating Port of Newcastle found a problem in the railway transportation, so it limited the annual handling volume (export volume) to 80 million tons, and launched implementation of the capacity distribution system, a system of allotting export quotas to coal producing companies, from April 2004. The demurrage was reduced to about 10 vessels by early June, but fundamental improvement and expansion of the coal export infrastructure would be required considering the future increase in the coal export volume. If appropriate investments are made, Australia may be able to expand its supply capacity relatively easily compared with the other coal producing countries, as shown in Table 1-1. However, unless the above-mentioned problem of export infrastructure is solved, it would become an obstacle in providing a stable supply to the international market. Meanwhile, Australian coal producing companies have accelerated consolidation through acquisitions and mergers from 1998 to 2000 when steaming coal export prices continued to slump. In particular, the reorganization of the Australian coal industry carried out by the international mineral resource companies referred to as the Big Four, namely, Anglo American, BHP Billiton, Glencore (Xstrata), and Rio Tinto, and the attention drawn to the four companies by this reorganization is worthy of note. This reorganization/consolidation was the corporate efforts to deal with the slump of coal prices, which can be highly evaluated at present for having maintained a stable supply framework amidst the price slump. (5) Other factors
♦
♦
♦
♦
The United States: The United States lacks export competitiveness due to firm domestic demand and the decline in the export capacity pertaining to the price slump since 1998.
Canada: The type of coal that can be supplied to the export market is limited to coking coal.
Russia: More emphasis is placed on the European market. The exporting ports in the Far East region of Russia need to be improved and expanded in order to expand supply to the Asian market. In addition, the branch railway lines connected to the trunk railway lines need to be improved for developing new coal mines.
South Africa: The expansion of export capacity is growing stagnant, so exporting ports need to be improved (Port of Richards Bay is currently being expanded). The distance of transportation is long to export coal to Japan.
20

The South African steaming coal exported to Asia was 16 million tons (35% of the total export volume) in 1990, but the export volume decreased to 4.8 million tons (7%) in 2002. The country has shifted its main export destination to Europe. Since 2000, South Africa’s steaming coal export volume has stayed at around 67 million tons, which is considered to be one of the factors underlying the recent stringency in the global supply and demand of coal.
1-4 Prospects for steaming coal prices While the prime concern is future movements in coal prices and how long the high price tendency will continue, it is difficult to evaluate these elements quantitatively. This section first assumes two cases and studies them, after which it indicates the factors for predicting the price changes. (1) Steaming coal prices With regard to Australian steaming coal in FY 2004, the present spot price, which has reached US$60/ton, is apparently too high in light of the report that the price revision negotiation for long-term contracts with Japanese electric power companies was settled at US$45.00/ton. When these are converted into Australian dollars at the rate of 0.7US$/A$, the price of the long-term contracts is A$64.3/ton, while the spot price is A$85.7/ton. The assumed reason for the continuous increase in the steaming coal spot price is that consumers are competing over limited coal, because coal is not immediately supplied as it used to be during times when consumers needed the coal. This tendency is likely to continue until an ample supply framework is developed, or at least until the inventories of Australian steaming coal for export accumulate to a level exceeding 7 million tons (see Figure 1-8). Considering Australia’s present productivity and the past changes in prices, Australian producers are likely to be able to secure profits within Australia if the steaming coal prices stay at a level above the A$40-50/ton range. Because additional supply capacity is expected to be achieved to meet the demand in the coal market, as shown in Table 1-1, coal prices are likely to become stable at the level when supply and demand balance out. To this end, however, the supply risks indicated in the previous section must be eliminated or reduced. Only then will a sustainable coal supply that meets demand be achieved. Table 1-3 shows the conditions for stopping the hike in steaming coal prices, and comparatively studies the case in which the hike stops in the short term and the case in which it will last in the long term. The results of the comparative study are shown in Figure 1-18.
21

Table 1-3 Conditions for Termination of the Steaming Coal Price Hike and Its Prospects Case 1
(Price hike terminated in a short term) Case 2
(Price hike prolongs) 1. China’s coal demand The overheating growth in coal demand will
subside before the Beijing Olympics due to such measures as reduced issuance of government construction bonds and a cut in the official discount rate for slowing the present economic boom, which is referred to as China’s special procurements.
China’s present economic boom and the pace of economic growth will continue at least until Beijing Olympics, and the speed of growth in coal demand will remain high.
2. China’s coal production Although a large increase in coal production cannot be expected in the short term by construction of new large- and medium-size coal mines, coal exports will increase as expanded coal production of existing coal mines for the domestic market will increase overall production (mainly town and village coal mines) backed by a rise in domestic coal prices.
An increase in production cannot be expected until the completion of new large- and medium-size coal mines. The Chinese government will firmly maintain the coal policy of prioritizing domestic demand and imports of steaming coal will increase.
3. Indonesia’s coal mine development for exported coal
With an increase in production at existing coal mines and deregulation of the Forest Affairs Law, investment in new coal mines will be promoted and development will make progress at an early stage including the transportation infrastructure.
The Forest Affairs Law will not be deregulated, and development of new coal mines will not progress. Therefore, production expansion will have to rely solely on an increase in production at existing coal mines.
4. Increase in Australian production capacity of export coal
Investment will be made in line with demand growth, and an increase in the production capacity of export coal will be achieved earlier than scheduled (Table 1-1). At the same time, improvement of the export infrastructure will also make steady progress.
Even if an increase in the production capacity of export coal is achieved earlier than scheduled, the problem of the export infrastructure will not be solved, and the cost will rise due to demurrage.
5. Increase in U.S. export volume of steaming coal
Exports of steaming coal to Asia from the West Coast will be resumed, and export of steaming coal to Europe from the East Coast will increase.
Steaming coal will only be exported to Canada, as domestic demand will be given priority.
6. Increase in South Africa’s export volume of steaming coal
Exports of steaming coal to Europe will increase, and Australian steaming coal that intended for Europe will be sent to the Asian market.
Exports of steaming coal will not increase, and Australian steaming coal will flow into the European market.
7. Time of termination of the price hike
In about three years In about five years
Comprehensively evaluating these analyses, it is expected to take about three years for the supply capacity to grow to meet the demand growth, though it would depend on the coal mine development in Australia, China, and Indonesia and the status of the improvement in the export infrastructure in these countries. It is also expected that the prices will recover to the A$40-50/ton level (US$28-35/ton at the rate of 0.7US$/A$) when the supply and demand become balanced around that time.
22

Figure 1-18 Forecasts of Spot Prices for Australian Steaming Coal
20
30
40
50
60
70
80
90
100Ja
n-19
86
Jan-
1988
Jan-
1990
Jan-
1992
Jan-
1994
Jan-
1996
Jan-
1998
Jan-
2000
Jan-
2002
Jan-
2004
Jan-
2006
Jan-
2008
Stea
min
g co
al sp
ot p
rice
s (U
S$/to
n, A
$/to
n) Actual: BJI spot prices (US$/ton)
Actual: BJI spot prices (A$/ton)Forecast
Case 2 (A$/ton)
Case 1 (A$/ton)
Case 2 (US$/ton)
Case 1 (US$/ton)
Note: The exchange rate for the forecasted prices is fixed at 0.7 US$/A$.
(2) Factors to be noted in understanding the movements in steaming coal prices
♦ ♦
♦ ♦ ♦ ♦ ♦
China’s coal demand and supply trends, coal export/import trends, and coal policy Changes in the volume of steaming coal for power generation imported by Japan, South Korea, and Taiwan Changes in the Australian export steaming coal stocks Status of production/development of steaming coal for export in Australia and Indonesia Exchange rate of Australian dollar to U.S. dollar The steaming coal export capacity of Russia, the United States, and South Africa Oil/gas prices Although coal prices and oil/gas prices have no clear correlation with each other, a hike in oil/gas prices would increase coal demand due to the price differences, and allow coal prices to rise.
Another important factor for steaming coal is whether or not it can continue to maintain its price competitiveness against rival fossil fuels. As shown in Figures 1-2 and 1-3, the “fluid revolution” made progress until the 1970s due to the fact easy-to-handle oil could be obtained at low prices. As a result, the demand for steaming coal declined in Japan as shown in Figure 1-19. However, during and after the second oil crisis, the price difference between steaming coal and oil widened, and use of steaming coal increased due to its price competitiveness. Since steaming coal produces more carbon dioxide when burned compared to other fossil fuels, it imposes a large burden on the environment. If steaming coal loses its price competitiveness by bearing the cost for reducing the environmental burden, use of steaming coal may considerably
23

decrease.
Figure 1-19 Changes in the Volume of Coal Demand in Japan
0
20
40
60
80
100
120
140
160
18019
65 F
1967
F
1969
F
1971
F
1973
F
1975
F
1977
F
1979
F
1981
F
1983
F
1985
F
1987
F
1989
F
1991
F
1993
F
1995
F
1997
F
1999
F
2001
F
(million tons) Steaming coal Coking coal Anthracite
Second oil crisis
Note: The figures up to FY 2000 only indicate the volume of imported coal based on the “Yearbook of Production, Supply and Demand of Petroleum, Coal and Coke,” Ministry of Economy, Trade and Industry, and those for FY 2001 onward indicate the volume based on the “Japan Trade Table,” Ministry of Finance.
Source: “2004 EDMC Handbook of Energy & Economics in Japan” and “EDMC Data Bank,” IEEJ/EDMC. 2. Global Warming Prevention Measures and Coal Use 2-1 Evaluation of fossil fuels based on 3Es When fossil fuels are evaluated based on the 3Es, economy, energy (stable supply), and environment, coal is superior in the economy and stable supply aspects. However, as shown in Figure 2-2, its evaluation is low in the environmental aspect, since its CO2 intensity is higher than that of liquid natural gas (LNG).
Figure 2-1 Evaluation of Fossil Fuels Based on 3Es
0%
50%
100%
Environment (1/CO2 load)
Economy (1/price)Energy (Stable Supply)
(1/coefficient of variation)
Coal
Oil
LNG
24

Figure 2-2 CO2 Intensity by Fuel Type
105.2883.88
62.66
0
20
40
60
80
100
120
140
Coal Oil LNG
(g-C
/1,0
00 k
cal)
Combustion Production/facilities Transportation
112.90100% 89.92
80% 77.5269%
Note: The percentages shown above the bars indicate the environmental burden of the respective fossil energies
when CO2 intensity of coal is regarded to be 100%. Source: “Life Cycle Inventory Analysis of Fossil Energies in Japan (May 1999)” (material for the Forum on Research
Works), IEEJ. If the market seeks a fuel mix that maximizes the economy, a stable supply and environmental conservation elements, the fuels selected will be those accounting for the minimum value in the following target function.
Target function = f1 (price) + f2 (cost for environmental measures) + f3 (cost for measures against supply risks)
While the supply risks are clearly indicated by the past fluctuations in prices (see Figures 1-3), it is obvious in Figure 2-3 that coal accounts for the smallest price fluctuations. Since coal is deemed to require the lowest cost for measures against supply risks, this report will evaluate coal by focusing on prices and the cost for environmental measures, in order to make the discussions concise.
Figure 2-3 Coefficient of Variation of Fossil Fuel Prices
0
5
10
15
20
25
30
Crude oil LNG Cokingcoal
Steamingcoal
Coefficient of variation(standard deviation/average price; 1983-2003)
25

2-2 Current status of CO2 emissions Japan’s CO2 emissions were 318 million t-C (tons carbon equivalent2) in FY 2002, which is an increase of 31 million t-C (9.7%) over the amount in FY 1990. Of these, CO2 emissions by the power sector (public power supply industry) were 91 million t-C, an increase of 13 million t-C (14.3%) over that in FY 1990. While CO2 emissions from coal account for 32% of Japan’s total emissions, the proportion is as high as 54% for the power sector (Figure 2-4).
Figure 2-4 Actual CO2 Emissions (FY 2002)
78
287 31
318
91
13
0 100 200 300 400 500
For public power supplyindustry (FY 1990)
For public power supplyindustry (FY 2002)
Domestic primary energysupply (FY 1990)
Domestic primary energysupply (FY 2002)
CO2 emissions (million t-C)
Actual Difference (FY2002-FY1990)
Coal54%
Oil15%
LNG31%
For publicpower supply
industry
Coal32%
Oil55%
LNG13%
Domesticprimary energy
supply
2-3 Importance and limits of clean coal technology (CCT) 2-3-1 Increase in coal use by CCT to date Coal is more difficult to handle compared with oil and gas, and it also carries a large environmental load (SOx, NOx, particulate matter, and CO2). However, some of these weak points of coal have been overcome by innovative CCT. Good examples are the progress in desulfurization, denitration, and dust collection technologies. As shown in Figure 2-5, the desulfurization, denitration, and dust collection technologies have achieved remarkable progress compared to 20 years ago, and significantly contribute to the present growth in coal demand.
2 The amount of CO2 emission can be expressed by either tons carbon equivalent (t-C) or tons CO2 equivalent (t-CO2).
The relationship between the two is 1 t-CO2 = 3.67 t-C.
26

Figure 2-5 Progress in the Desulfurization, Denitration, and Dust Collection Technologies
260
300
100
20 20 100
50
100
150
200
250
300
350
SOx (ppm) NOx (ppm) PM (mg/m3N)
Power plant M (operating since 1981)Power plant I (operating since 2002)
Source: The Electric Power Development Co.,Ltd. (now with the trading name J-POWER) 2-3-2 Future of CCT It is evident that CCT will play an important role in coal use in the future. The main CCTs, which are expected to be developed and diffused by 2030, are shown in Figure 2-6. The main CCTs that are to be developed in the power industry include the integrated coal gasification
Figure 2-6 Future of CCT
Future of Energy Society Supported by CCT (2030)
Coordination of energy/materials between industries Fuel-cell vehicles
Biomass Coal gasification Steel industry
Hydrogenation of coal
FFuurrnnaaccee ffoorr aaddvvaanncceedd ggaassiiffiiccaattiioonn
Blast furnace Chemical industry, etc.
Hydrogen stations
SCOPE21
HyPr-RING
Powerplants
Garbage /waste plastic Power industry
Steel plants
IGCC IGFC USC
CO2 recovery
Upgraded coal Coal CO2
sequestration UBC
Source: Clean Coal Cycle (C3) Study Group, Ministry of Economy, Trade and Industry (METI).
27
combined cycle (IGCC), integrated coal gasification fuel cell combined cycle (IGFC), CO2
recovery/sequestration technology (carbon fixation), and technology to improve the quality of low-grade coal (upgraded brown coal (UBC)). In addition, development of coke production with advanced coal conversion process (Super Coke Oven for Productivity and Environmental enhancement toward 21st Century (SCOPE21)) is expected in the steel industry, while development of hydrogen production by recovering CO2 using coal (hydrogen production by reaction integrated novel gasification (HyPr-RING)) is considered as a priority task for a future hydrogen society.
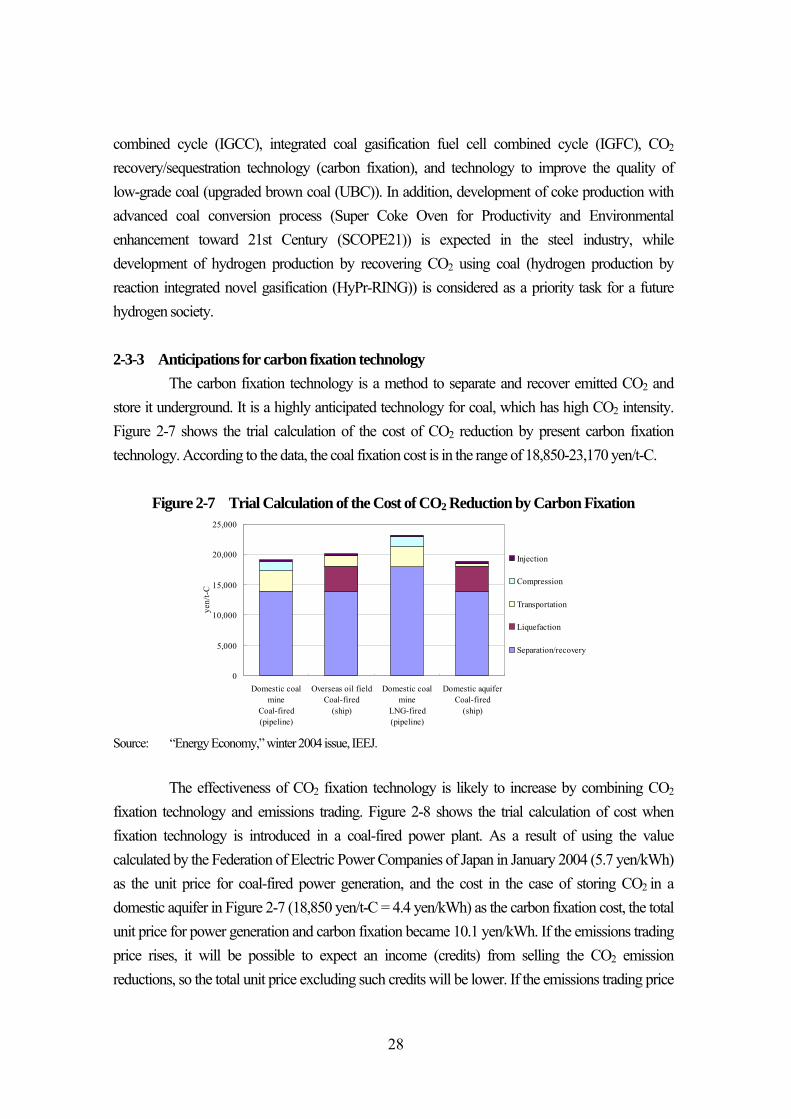
2-3-3 Anticipations for carbon fixation technology The carbon fixation technology is a method to separate and recover emitted CO2 and store it underground. It is a highly anticipated technology for coal, which has high CO2 intensity. Figure 2-7 shows the trial calculation of the cost of CO2 reduction by present carbon fixation technology. According to the data, the coal fixation cost is in the range of 18,850-23,170 yen/t-C.
Figure 2-7 Trial Calculation of the Cost of CO2 Reduction by Carbon Fixation
0
5,000
10,000
15,000
20,000
25,000
Domestic coalmine
Coal-fired(pipeline)
Overseas oil fieldCoal-fired
(ship)
Domestic coalmine
LNG-fired(pipeline)
Domestic aquiferCoal-fired
(ship)
yen/
t-C
Injection
Compression
Transportation
Liquefaction
Separation/recovery
Source: “Energy Economy,” winter 2004 issue, IEEJ. The effectiveness of CO2 fixation technology is likely to increase by combining CO2 fixation technology and emissions trading. Figure 2-8 shows the trial calculation of cost when fixation technology is introduced in a coal-fired power plant. As a result of using the value calculated by the Federation of Electric Power Companies of Japan in January 2004 (5.7 yen/kWh) as the unit price for coal-fired power generation, and the cost in the case of storing CO2 in a domestic aquifer in Figure 2-7 (18,850 yen/t-C = 4.4 yen/kWh) as the carbon fixation cost, the total unit price for power generation and carbon fixation became 10.1 yen/kWh. If the emissions trading price rises, it will be possible to expect an income (credits) from selling the CO2 emission reductions, so the total unit price excluding such credits will be lower. If the emissions trading price
28
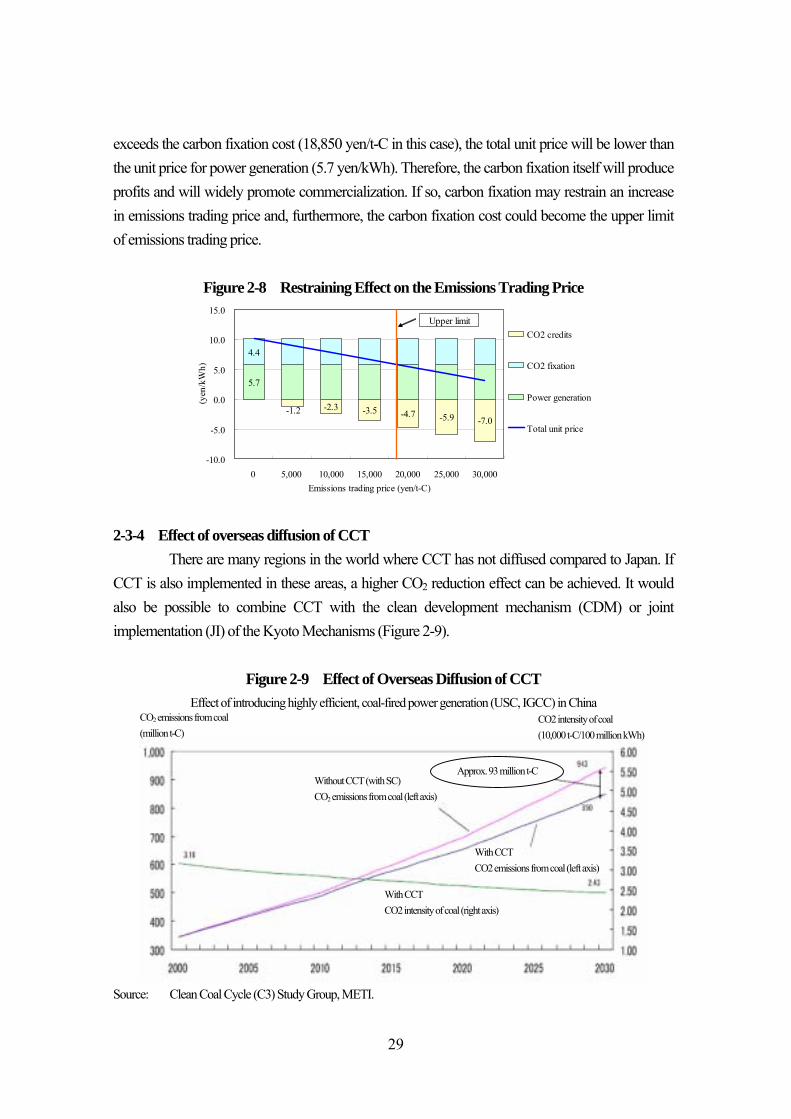
exceeds the carbon fixation cost (18,850 yen/t-C in this case), the total unit price will be lower than the unit price for power generation (5.7 yen/kWh). Therefore, the carbon fixation itself will produce profits and will widely promote commercialization. If so, carbon fixation may restrain an increase in emissions trading price and, furthermore, the carbon fixation cost could become the upper limit of emissions trading price.
Figure 2-8 Restraining Effect on the Emissions Trading Price
-2.3 -3.5 -4.7 -5.9 -7.0
5.7
4.4
-1.2
-10.0
-5.0
0.0
5.0
10.0
15.0
0 5,000 10,000 15,000 20,000 25,000 30,000Emissions trading price (yen/t-C)
(yen
/kW
h)
CO2 credits
CO2 fixation
Power generation
Total unit price
Upper limit
2-3-4 Effect of overseas diffusion of CCT There are many regions in the world where CCT has not diffused compared to Japan. If CCT is also implemented in these areas, a higher CO2 reduction effect can be achieved. It would also be possible to combine CCT with the clean development mechanism (CDM) or joint implementation (JI) of the Kyoto Mechanisms (Figure 2-9).
Figure 2-9 Effect of Overseas Diffusion of CCT Effect of introducing highly efficient, coal-fired power generation (USC, IGCC) in China
CO2 emissions from coal (million t-C)
CO2 intensity of coal (10,000 t-C/100 million kWh)
Without CCT (with SC) CO2 emissions from coal (left axis)
Approx. 93 million t-C
With CCT CO2 emissions from coal (left axis)
With CCT CO2 intensity of coal (right axis)
Source: Clean Coal Cycle (C3) Study Group, METI.
29

2-3-5 Limits of CCT At present, the thermal efficiency of gas-fired power generation has improved at a faster pace than that of coal-fired power generation. As shown in Figure 2-10, the difference between them is apparent in the thermal efficiency competition in combined cycles or fuel cells.
Figure 2-10 Comparison of Heat Efficiency of Thermal Power Generation
65
53
54-60
4642
41
40
38
0 10 20 30 40 50 60 70
Heat efficiency (%)
Gas FC
Gas CC (actual)
IGFC
IGCC(1,500℃)
PFBC
PC(USC)
PC
Average (1997)
As shown in Figure 2-11, “World Energy Outlook 2002” released by IEA also indicates the future superiority of gas-fired power generation in thermal efficiency. Development and diffusion of CCT is also indispensable for not widening the thermal efficiency gap between coal and gas.
Figure 2-11 Prospects of the World’s Average Power Generation Efficiency
Source: “World Energy Outlook 2002,” OECD/IEA. There are limits in finding the solution for CO2 reduction only in CCT for such competitive development environments. Therefore, it is important to promote CO2 reduction
30
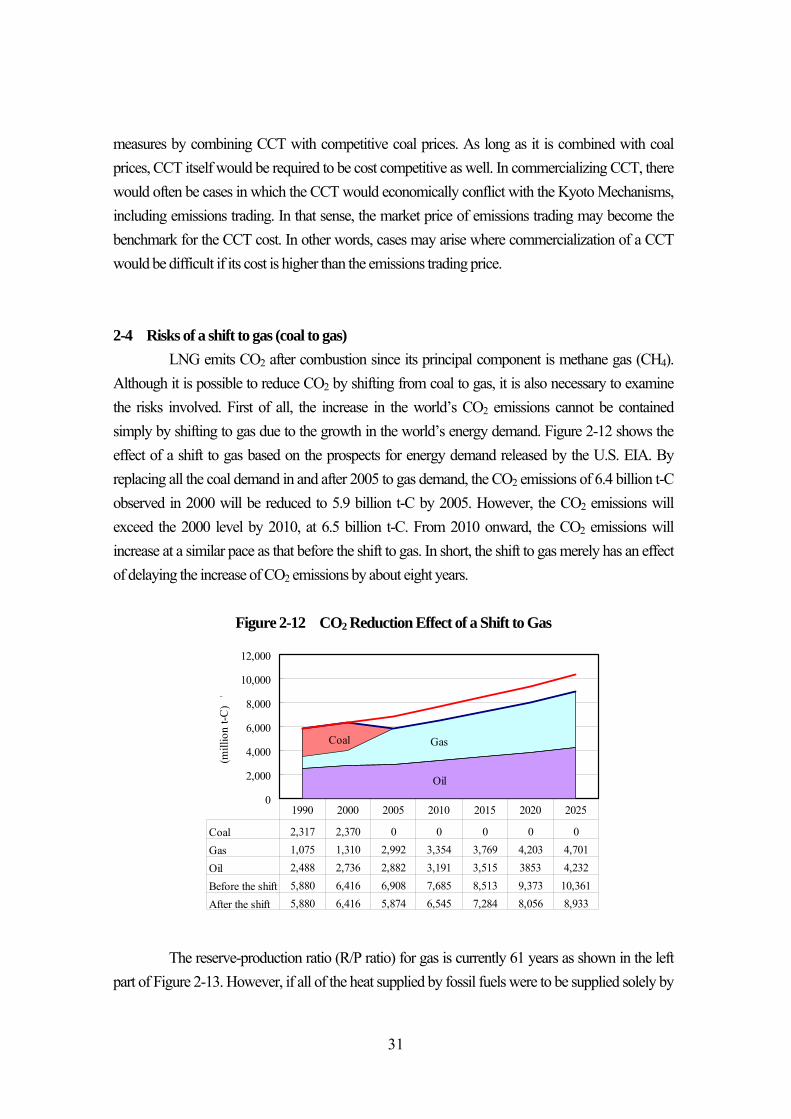
measures by combining CCT with competitive coal prices. As long as it is combined with coal prices, CCT itself would be required to be cost competitive as well. In commercializing CCT, there would often be cases in which the CCT would economically conflict with the Kyoto Mechanisms, including emissions trading. In that sense, the market price of emissions trading may become the benchmark for the CCT cost. In other words, cases may arise where commercialization of a CCT would be difficult if its cost is higher than the emissions trading price. 2-4 Risks of a shift to gas (coal to gas) LNG emits CO2 after combustion since its principal component is methane gas (CH4). Although it is possible to reduce CO2 by shifting from coal to gas, it is also necessary to examine the risks involved. First of all, the increase in the world’s CO2 emissions cannot be contained simply by shifting to gas due to the growth in the world’s energy demand. Figure 2-12 shows the effect of a shift to gas based on the prospects for energy demand released by the U.S. EIA. By replacing all the coal demand in and after 2005 to gas demand, the CO2 emissions of 6.4 billion t-C observed in 2000 will be reduced to 5.9 billion t-C by 2005. However, the CO2 emissions will exceed the 2000 level by 2010, at 6.5 billion t-C. From 2010 onward, the CO2 emissions will increase at a similar pace as that before the shift to gas. In short, the shift to gas merely has an effect of delaying the increase of CO2 emissions by about eight years.
Figure 2-12 CO2 Reduction Effect of a Shift to Gas
Gas
Oil
Coal
0
2,000
4,000
6,000
8,000
10,000
12,000
(mill
ion
t-C)
'
Coal 2,317 2,370 0 0 0 0 0Gas 1,075 1,310 2,992 3,354 3,769 4,203 4,701Oil 2,488 2,736 2,882 3,191 3,515 3853 4,232Before the shift 5,880 6,416 6,908 7,685 8,513 9,373 10,361After the shift 5,880 6,416 5,874 6,545 7,284 8,056 8,933
1990 2000 2005 2010 2015 2020 2025
The reserve-production ratio (R/P ratio) for gas is currently 61 years as shown in the left part of Figure 2-13. However, if all of the heat supplied by fossil fuels were to be supplied solely by
31

gas, the reserve-production ratio would become 17 years, as shown in the right part of Figure 2-13 (R/TFEP ratio; TFEP: total fossil energy production). It cannot be overlooked that a shift to gas would accelerate consumption of precious gas resources, leaving future generations with depleted gas resources. Another concern is that the shift to gas would naturally cause an imbalance in supply and demand, which would invite a price hike and considerably affect the stable supply of gas. Figure 2-13 Reserve-Production Ratio and Reserve-Total Fossil Energy Production Ratio
204
5941 6193 9317 17
0
50
100
150
200
250
R/P R/TFEP
No.
of y
ears
Coal Oil Gas Fossil fuels total
Source: “BP Statistics Review of World Energy 2003,” June 2003, BP Downloads Library. 2-5 Economical efficiency of a shift to gas According to the performance of the public power supply industry in FY 2002, coal-fired power plants generated 209.3 billion kWh of power and their operating rate (percentage of facility use) was 71%. Meanwhile, LNG-fired power plants generated 251.7 billion kWh of power and operating rate was 48%. Table 2-1 assumes a case in which the operating rate of LNG-fired plants is increased to 70% and the power generated to 363.6 billion kWh, while the operating rate of coal-fired plants is decreased to 33% and the power generated to 97.4 billion kWh in order to equalize the overall power generated to that in FY 2002. Based on this assumption, it obtains the fuel consumption, CO2 emissions, and the variable cost. According to the data, the CO2 emissions can be reduced by 13.74 million t-C from 77.28 million t-C to 63.54 million t-C. Nevertheless, the cost increased by 350.1 billion yen (25,500 yen/t-C). The variable cost used for the calculation includes the fuel price, petroleum tax, and utilities among other matters. The cost based on the results of FY 2002 was 2.73 yen/kWh for coal-fired power generation and 5.86 yen/kWh for LNG-fired power generation. Next, a case in which a shift is made from LNG to coal is examined. Table 2-2 shows the results of trial calculation of a case in which the operating rate of coal-fired power plants is increased to 80% (the operating rate of LNG-fired power plants drops to 43%) and CO2 emissions are restrained by carbon fixation technology. While the total variation cost increased to 2,396.5
32

billion yen in the case of a shift to gas, the cost in the case of a shift to coal was 1,960.7 billion yen, 435.8 billion yen lower than the former. However, there is a need to separate and fix CO2 in order to reduce the CO2 emissions, which would be 17.1 million t-C higher than those in a shift to gas. The cost for this separation and fixation was 322.5 billion yen (the unit price for the separation and fixation was 18,850 yen/t-C in this case). Nevertheless, even by including the cost for CO2 separation and fixation, the variable cost in a shift to coal would be 113.3 billion yen (= 435.8 billion yen - 322.5 billion yen) lower compared to a shift to gas.
Table 2-1 Trial Calculation of a Shift of to Gas in Thermal Power Generation
Coal-fired 209.3 33.77 71 67,759 49,120 571.4
LNG-fired 251.7 59.29 48 37,914 28,158 1,475.0
Total 461.0 93.06 77,278 2,046.4
Coal-fired 97.4 33.77 33 31,543 22,866 266.0
LNG-fired 363.6 59.29 70 54,765 40,673 2,130.5
Total 461.0 93.06 63,539 2,396.5
Difference -13,739 350.1
Shift to gas (coal → LNG)
FY 2002 actualCO2 emissions Total variable cost
(billion kWh) (million kW) (%) (thousand tons) (thousand t-C) (billion yen)
Power generated Power generation facilities Operating rate Fuel consumption
Table 2-2 Trial Calculation of a Shift of to Coal in Thermal Power Generation
Coal-fired 97.4 33.77 33 31,543 22,866 266.0
LNG-fired 363.6 59.29 70 54,765 40,673 2,130.5
Total (1) 461.0 93.06 63,539 2,396.5
Coal-fired 236.7 33.77 80 76,617 55,541 646.1
LNG-fired 224.3 59.29 43 33,793 25,097 1,314.6
Total (2) 461.0 93.06 80,638 1,960.7
CO2 separation/fixation (3) -17,099 3,225.0
Total ((2) + (3)) 63,539 5,185.7
Difference ((1) - ((2) + (3))) 0 -2,789.2
Power generated
(billion kWh)
Power generation facilities
(million kW)
Shift to coal (LNG → coal)
Shift to gas (coal → LNG)
CO2 emissions
(thousand t-C)
Total variable cost
(billion yen)
Operating rate
(%)
Fuel consumption
(thousand tons)
2-6 Kyoto Mechanisms (emissions trading, joint implementation [JI], and clean development mechanism [CDM])
The Kyoto Mechanisms are effective tools for reducing CO2, and they are already implemented in some quarters. Table 2-3 shows the CDM and JI projects that are approved by the Japanese government, as examples of the Kyoto mechanisms. The total credits resulting from these projects have reached 1.83 million t-C/year.
33

Table 2-3 Japan’s Government-Approved CDM/JI Projects
Date of approval
CDM/ JI
Investor/ host country Project name Credits
(t-CO2/year) Investment (billion yen)
1 Dec. 12, 2002
JI NEDO Kazakhstan
The Model Project for Increasing the Efficient Use of Energy Using a Gas Turbine Cogeneration System
62,000 2.5
2 Dec. 12, 2002
CDM Toyota Tsusho Corporation Brazil
V&M Tubes do Brazil Fuel Switch Project
1,130,000 5
3 May 22, 2003
CDM Electric Power Development Co., Ltd. Thailand
Rubber Wood Residue Power Plant Project in Yala, Thailand
60,000 4.5
4 Jul. 15, 2003
CDM INEOS Flour Japan Ltd.South Korea
HFC Decomposition Project in Ulsan 1,400,000 0.3-0.5
5 Jul. 29, 2003
CDM Kansai Electric Power Co., Inc. Bhutan
e7 Bhuran Micro Hydro Power CDM Project (applied to represent the E7 Fund)
500 0.3
6 Dec. 3, 2003
CDM Vietnam Petroleum Co Ltd. Vietnam
Rang Dong Oil Field Associated Gas Recovery and Utilization Project
680.000
7 May 19, 2004
CDM Sumitomo Corporation India
Project Greenhouse Gas Emission Reduction by Thermal Oxidation of HFC23 in Gujarat, India
3,380,000 0.3
Total 6,712,500 (1.83 million
t-C/year)
Source: Press release, METI website. Table 2-4 shows the World Bank’s Prototype Carbon Fund projects in which many Japanese companies participate. The table indicates that CO2 emission reductions can be purchased at a relatively low cost of 12.98 US$/t-C.
Table 2-4 World Bank’s Prototype Carbon Fund Projects World Bank’s Prototype Carbon Fund projects
CO2 emission reductions (t) Value ($) $/t-CO2 $/t-C
Signed (13 projects) 12,690,718 47,530,000 3.75 13.73 Under development (10 projects) 21,830,710 74,650,000 3.42 12.54 Total 34,521,428 122,180,000 3.54 12.98
S ource: World Bank website.
Japan Carbon Fund concept
CO2 emission reductions (t) Value ($) $/t-CO2 $/t-C
Asian region 17,000,000 10,000,000,000 588 19.61
Source: Nihon Keizai Shimbun, January 9, 2004. Table 2-5 shows various organizations’ trial calculations of limit cost for CO2 reduction of the United States, Europe, Japan and the emissions trading price. The data suggests that the CO2
emissions trading price will be very low at 6-36 US$/t-CO2 if emissions trading was conducted between the Kyoto Protocol Annex B countries, and even lower at 4-24 US$/t-CO2 if emissions
34

trading was conducted including the whole world, with participation of developing countries.
Table 2-5 Effect of Reducing the Emissions Trading Price (US$/t-CO2)
Source: “International Emission Trading - From Concept to Reality,” OECD/IEA.
The CO2 emissions trading balance in 2010 is indicated by a projection using one of case studying by the CERT model of Grütter Consulting in Figure 2-14. The figure shows that the supply and demand of the world’s emission reductions in 2010 will be balanced at 768 million t-C, and the price at that point will be 20.6 US$/t-C. It also indicates that the demand will dramatically decline if the United States does not participate in the trading, and the value will become infinitely close to zero.
Figure 2-14 CO2 Emissions Trading Balance (2010)
0
50
100
150
200
250
0 200 400 600 800 1,000 1,200 1,400
Carbon Abatement (Mton)
Car
bon
Pric
e (U
S$/
Ton
C),
2000
pric
es Demand Without US
Demand With US
Supply
20.6 US$/t-C768 Mt
Source: CERT model, Grütter Consulting. This section has analyzed the possibility of reducing the CO2 reduction cost by using the Kyoto Mechanisms. The most significant advantage of these mechanisms is considered to be that the mechanisms allow the users to choose the place or project in which they can reduce CO2 the most efficiently from all over the world.
35

2-7 Fuel prices and the Kyoto Mechanisms (CO2 reduction) The CO2 reduction cost can be dramatically reduced by using the Kyoto Mechanisms as discussed earlier, but it would be important for future coal use to increase the competitiveness of coal based on prices + the Kyoto Mechanisms (CO2 reduction). Figure 2-15 compares the total costs of coal, oil and LNG obtained by combining the actual prices of the respective fuels in FY 2002 with an assumed CO2 reduction cost of 20 US$/t-C achieved by the Kyoto Mechanisms. According to the data, coal is found to be highly competitive.
Figure 2-15 Fuel Prices and the Kyoto Mechanisms
6,900
23,000 21,500
2,343
1,5121,353
9,243
24,51222,853
0
5,000
10,000
15,000
20,000
25,000
30,000
35,000
Coal Oil Gas
Fuel
pric
e +
CO
2 re
duct
ion
cost
(yen
/toe)
CO2 reductioncost
Fuel price
Unit price for CO2 reduction = 20 US$/t-C
Figure 2-16 shows the total unit price obtained by combining the unit prices for power generated by newly-established coal-fired and LNG-fired power plants (January 2004; the Federation of Electric Power Companies of Japan) with the CO2 reduction cost. In a scenario in which the CO2 reduction cost was shifted from 0 to 100 US$/t-C, the cost of coal-fired and LNG-fired power generation became equal at the point the CO2 reduction cost was 38 US$/t-C. In addition, the unit price for coal-fired power generation became lower when the CO2 reduction cost was lower than 38 US$/t-C. The unit price for coal-fired power generation becomes as low as 83 US$/t-C, if the operating rate of the LNG-fired power plant is reduced to 60% since it is impracticable to operate both coal-fired and LNG-fired power plants at an operating rate of 80%. In order to purchase CO2 emission reductions of 13.739 million t-C, which is the earlier-mentioned emission reductions achieved by a shift to gas, when the emissions trading price is 20 US$/t-C, the annual cost would be 30.226 billion yen as shown below.
13.739 (million t-C) x 20 (US$/t-C) x 110 (yen/US$) = 30.226 (billion yen/year) Petroleum tax has been imposed on coal as well since October 2003, and the tax rate is
36
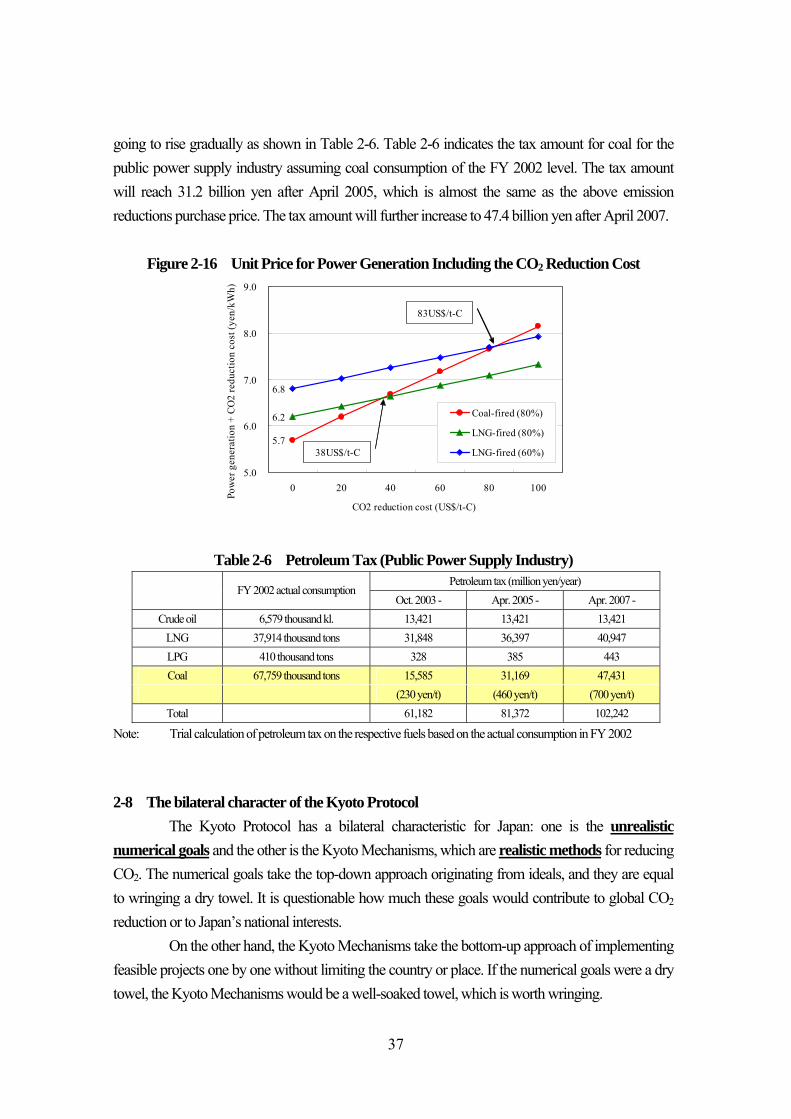
going to rise gradually as shown in Table 2-6. Table 2-6 indicates the tax amount for coal for the public power supply industry assuming coal consumption of the FY 2002 level. The tax amount will reach 31.2 billion yen after April 2005, which is almost the same as the above emission reductions purchase price. The tax amount will further increase to 47.4 billion yen after April 2007.
Figure 2-16 Unit Price for Power Generation Including the CO2 Reduction Cost
5.7
6.2
6.8
5.0
6.0
7.0
8.0
9.0
0 20 40 60 80 100
CO2 reduction cost (US$/t-C)
Coal-fired (80%)
LNG-fired (80%)
LNG-fired (60%)38US$/t-C
83US$/t-C
Pow
er g
ener
atio
n +
CO2
redu
ctio
n co
st (y
en/k
Wh)
Table 2-6 Petroleum Tax (Public Power Supply Industry) Petroleum tax (million yen/year)
FY 2002 actual consumption Oct. 2003 - Apr. 2005 - Apr. 2007 -
Crude oil 6,579 thousand kl. 13,421 13,421 13,421 LNG 37,914 thousand tons 31,848 36,397 40,947 LPG 410 thousand tons 328 385 443 Coal 67,759 thousand tons 15,585 31,169 47,431
(230 yen/t) (460 yen/t) (700 yen/t) Total 61,182 81,372 102,242
Note: Trial calculation of petroleum tax on the respective fuels based on the actual consumption in FY 2002 2-8 The bilateral character of the Kyoto Protocol The Kyoto Protocol has a bilateral characteristic for Japan: one is the unrealistic numerical goals and the other is the Kyoto Mechanisms, which are realistic methods for reducing CO2. The numerical goals take the top-down approach originating from ideals, and they are equal to wringing a dry towel. It is questionable how much these goals would contribute to global CO2
reduction or to Japan’s national interests. On the other hand, the Kyoto Mechanisms take the bottom-up approach of implementing feasible projects one by one without limiting the country or place. If the numerical goals were a dry towel, the Kyoto Mechanisms would be a well-soaked towel, which is worth wringing.
37
38
2-9 Future of coal and its challenges It would become difficult to use coal as in the past since it would increase CO2 emissions. Therefore, it will be necessary to use coal while reducing CO2 emissions in the future. This means using coal based on price competitiveness + competitive CCT + the Kyoto Mechanisms (three aspects as a set) as mentioned earlier. To this end, the following challenges should be addressed with more intensive efforts than ever under the cooperation between the public and private sectors.
(i) Stable supply of coal should be reinforced. (ii) Competitive CCT should be studied, developed, and diffused. (iii) Japan should take global measures as an insider toward achieving implementation of the
Kyoto Mechanisms.
3. Summary of the Report
(1) As history indicates, the basic merit in the use of coal is its price competitiveness. (2) The present high prices can be attributed to the increase in demand, including the special
procurements by China, and a decline in the additional export capacities of countries due to the foreign exchange situation. The market-clearing price for Australian steaming coal is A$40-50/ton (US$ 28-35/ton at the rate of 0.7 US$/A$). About three years will be required to expand the supply capacity to meet the demand expansion.
(3) Coal demand is likely to stay active mainly in Asia, and the supply capacity for Australian coal can be expected to increase. However, there are challenges to be addressed in reinforcing the supply capacity of China and Indonesia.
(4) While the future energy market will choose fuels based on price competitiveness, stable supply, and environmental consideration, coal use will be selected based on the following three aspects as a set: price competitiveness, competitive clean coal technology (CCT), and the Kyoto Mechanisms.
(5) A shift to coal could become a fuel option according to the achievements in these three aspects.
Contact: [email protected]