trends in reported foodborne illness in the united states ... · necessarily reflect the official...
TRANSCRIPT

Trends in Reported Foodborne Illness in the United States: 1996-2013
Mark Powell U.S. Department of Agriculture, Office of Risk
Assessment and Cost-Benefit Analysis Washington, DC
International Association for Food Protection
28 July, 2015
Portland, OR

INTRODUCTION
• Current statistical methods for analyzing FoodNet data make pair-wise comparisons between most recent surveillance year and one or more baseline periods.
• Advantage: avoids specifying model form for trend • Disadvantage: can’t distinguish trends from year to
year variability • Objective: Analyze trends in reported U.S. foodborne
illness with/without specifying model form for trend
2 Powell - Foodborne Illness Trends

DATA • FoodNet (Foodborne
Diseases Active Surveillance Network) data: 1996-2013 – Reported illness counts
by site (State_EntYr) and year
– Population size by site and year (increased over time)
– FoodNet composition stable since 2004
• Campylobacter • Listeria • Salmonella • Shigella • STEC O157 • Vibrio • Yersinia
Powell - Foodborne Illness Trends 3

METHODS • Poisson Log-Linear Model with Site (1996-2013)
– Log(countij) (yij) = log(populationij)+b0+b1(Yeari)+bj(Sitej)+εij
– E[yi] = µi (point on predictive curve) – Poisson (count) model is heteroscedastic
• Generalized Poisson dispersion: Var[yi]=ϕµi
• Negative Binomial dispersion: Var[yi]=µi+δµi2
– Differs from CDC method in that time is treated as a continuous covariate, considers generalized Poisson as well as negative binomial dispersion
• A conventional approach, but assumes log-linear trend Powell - Foodborne Illness Trends 4

METHODS
• Penalized B-spline Regression – Semi-parametric method – no assumed trend
model form – B-spline basis functions provide local control,
local fit is insensitive to points far removed – Penalized form of B-spline regression is
insensitive to number, placement of join-points (“knots”)
Powell - Foodborne Illness Trends 5
METHODS
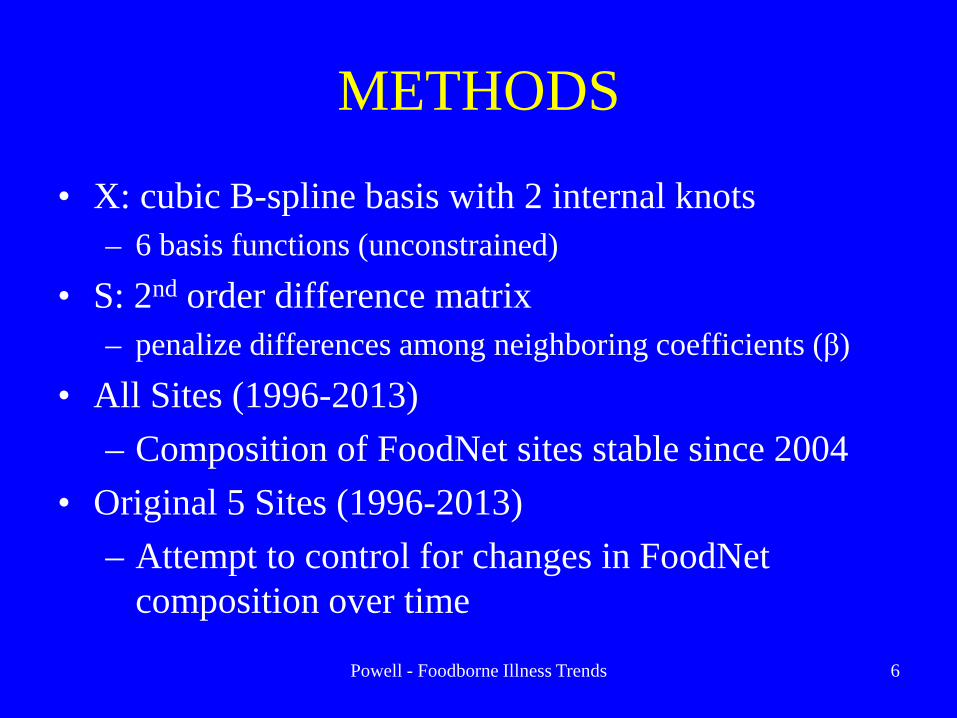
• X: cubic B-spline basis with 2 internal knots – 6 basis functions (unconstrained)
• S: 2nd order difference matrix – penalize differences among neighboring coefficients (β)
• All Sites (1996-2013) – Composition of FoodNet sites stable since 2004
• Original 5 Sites (1996-2013) – Attempt to control for changes in FoodNet
composition over time
Powell - Foodborne Illness Trends 6

Preliminary Results: Poisson Log Linear Model
• Significant Negative Trend Term – Campylobacter, Listeria, Shigella, STEC O157,
and Yersinia • Significant Positive Trend Term
– Vibrio • Significant Site-Level Effects
– All pathogens
Powell - Foodborne Illness Trends 7

Preliminary Results: Poisson Log Linear Model
• Salmonella – Significant Positive Trend Term for Generalized
Poisson – No Significant Trend Term for Negative Binomial
• Generalized Poisson better fit than Negative Binomial – All pathogens (incl. Salmonella)
• Log linear model not a good overall fit
Powell - Foodborne Illness Trends 8
Preliminary Results: Penalized B-Spline Regression
• Campylobacter, Listeria, STEC O157, Yersinia
• Early declines followed by a period of no significant trend
• Results consistent for All Sites, Original Sites, Generalized Poisson, Negative Binomial
Powell - Foodborne Illness Trends 9
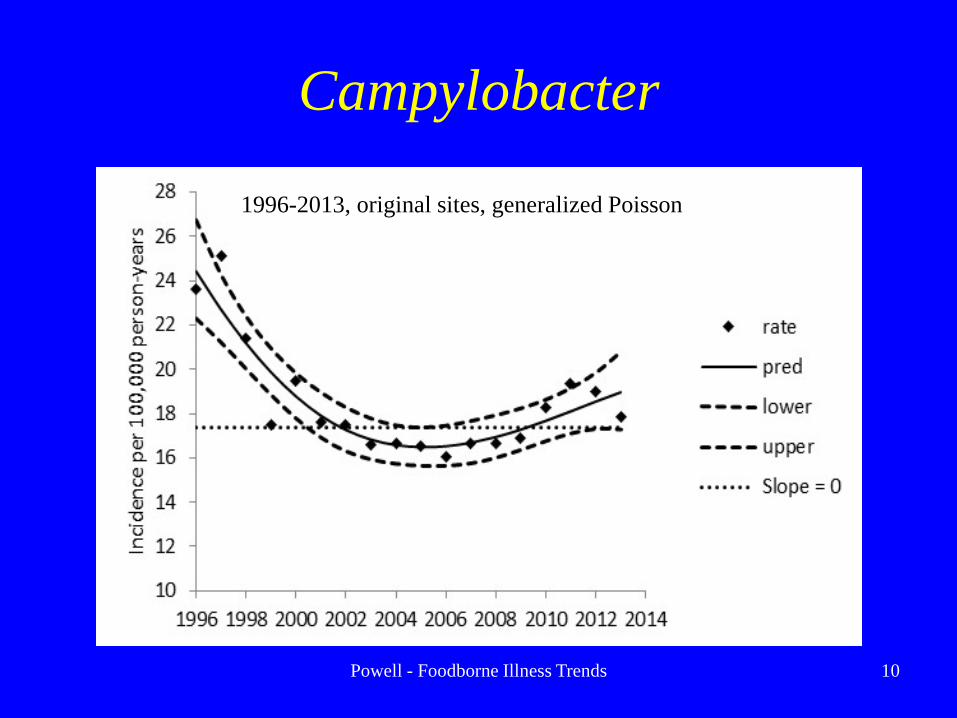
Campylobacter
Powell - Foodborne Illness Trends 10
1996-2013, original sites, generalized Poisson

Listeria
Powell - Foodborne Illness Trends 11
1996-2013, original sites, generalized Poisson

STEC O157
Powell - Foodborne Illness Trends 12
1996-2013, original sites, generalized Poisson

Yersinia
Powell - Foodborne Illness Trends 13
1996-2013, original states, generalized Poisson

Preliminary Results: Penalized B-Spline Regression
• Shigella and Vibrio • Continuous trends without an apparent plateau • Shigella decreasing • Vibrio increasing • Results consistent for All Sites, Original Sites,
Generalized Poisson, Negative Binomial
Powell - Foodborne Illness Trends 14

Shigella
Powell - Foodborne Illness Trends 15
1996-2013, original sites, generalized Poisson

Vibrio
Powell - Foodborne Illness Trends 16
1996-2013, original sites, generalized Poisson

Preliminary Results Penalized B-Spline Regression
• Salmonella • Inconclusive whether there is no trend or an
increasing trend – Significant Trend in All Sites, 1996-2013
• Inf. Smooth → Log-linear model (p<0.01) – No Trend in Original 5 Sites, 1996-2013
Powell - Foodborne Illness Trends 17

Salmonella
All Sites, 1996-2013 Original Sites, 1996-2013
Powell - Foodborne Illness Trends 18

SUMMARY
• Early decline followed by year-to-year variability about lower level – Campylobacter, Listeria, STEC O157, Yersinia
• Continuous decline – Shigella
• Continuous increase – Vibrio
• Inconclusive whether increase or no trend – Salmonella
Powell - Foodborne Illness Trends 19

Limitations
• Results are preliminary • Reported illness is a proxy, not true incidence • Not all FoodNet reported illness is foodborne • Assumes data missing at random • Descriptive model, not infer causes • Uncertainty about generalizing from FoodNet
population to national level not quantified
Powell - Foodborne Illness Trends 20

Acknowledgements
• Data Provided by Foodborne Diseases Active Surveillance Network, CDC – Olga Henao, Elaine Scallan et al. – Stacy Crim, CDC – Mike Hoekstra, CDC – Mike Williams, FSIS
21 Powell - Foodborne Illness Trends

Disclaimers • Results are preliminary and have not been subject to a formal peer
review process. • The opinions expressed herein are the views of the author and do not
necessarily reflect the official policy or position of the United States Department of Agriculture. Reference herein to any specific commercial products, process, or service by trade name, trademark, manufacturer, or otherwise, does not necessarily constitute or imply its endorsement, recommendation, or favoring by the United States Government.
• The findings and conclusions are those of the author and do not necessarily represent the official position of the Centers for Disease Control and Prevention.
22 Powell - Foodborne Illness Trends

Thank you
Powell - Foodborne Illness Trends 23