trends in fish and invertebrate populations of suisun
TRANSCRIPT
Trends in Fish and Invertebrate Populations of Suisun Marsh
January 2017 - December 2017
Annual Report for the
California Department of Water Resources
Sacramento, California
Teejay A. O'Rear, Peter B. Moyle, and John R. Durand
Department of Fish, Wildlife, and Conservation Biology
Center for Watershed Sciences
University of California, Davis
January 2019
2
SUMMARY
Suisun Marsh, at the geographic center of the northern San Francisco Estuary, is important habitat for native and non-native fishes. The University of California, Davis, Suisun Marsh Fish Study, in partnership with the California Department of Water Resources (DWR), has systematically monitored the marsh's fish populations since January 1980. The study’s main purpose has been to determine environmental and anthropogenic factors affecting fish distribution and abundance.
Calendar year 2017 was wet and warm. Very high Delta outflows resulted in nearly freshwater conditions throughout Suisun Marsh from January to July, with lower-than-average salinities persisting until November. Matching the local climate, water temperatures were generally warmer than usual. Unlike most of the last 10 years when water transparencies greatly increased relative to the average in summer and autumn, water transparencies stayed near or below average for the latter half of 2017. Dissolved oxygen (DO) concentrations were sufficient for marsh fishes except in March in upper Goodyear Slough, when DO concentrations dipped below 3 milligrams per liter (mg/L).
The aquatic community of Suisun Marsh responded to the wet, warm conditions. Non-native overbite clams (Potamocorbula amurensis), which require a salinity of at least 2 parts per thousand (ppt) for successful reproduction, were never abundant in 2017. The native California bay shrimp (Crangon franciscorum), which is generally most abundant in moderately saline waters, likewise was caught in low numbers. Conversely, Siberian prawn (Palaemon modestus) and Black Sea jellyfish (Maeotias marginata), two large, non-native invertebrates that flourish in freshwater and warm conditions, respectively, attained record-high abundances in 2017. Many native and non-native fishes, mainly those benefitting from high Delta outflows and from warm water, also prospered in 2017. Non-native species of the Pelagic Organism Decline (POD) – striped bass (Morone saxatilis), threadfin shad (Dorosoma petenense), and American shad (Alosa
sapidissima) – were very abundant, with the two shad species reaching record numbers. Fishes requiring wet conditions for either reproduction or recruitment into Suisun Marsh, such as the native Sacramento splittail (Pogonichthys macrolepidotus), the non-native common carp (Cyprinus carpio), and the non-native white catfish (Ameiurus catus), contributed substantial numbers of age-0 fish to the catches in 2017. Notably, native estuarine fishes associated with cooler water [delta smelt (Hypomesus transpacificus), longfin smelt (Spirinchus thaleichthys), and tule perch (Hysterocarpus traski)] were either non-existent or captured in below-average numbers. While low catches of these native cool-water fishes were also observed in mainstem surveys, abundances of the non-native POD fishes as well as Sacramento splittail relative to long-term averages appeared much higher in Suisun Marsh than in the estuary’s main axis, once again highlighting the importance of Suisun Marsh for imperiled fishes.
3
TABLE OF CONTENTS Introduction…………………………………………….…………………………………..…...…4 Methods………………………………………………….……………………………….……...…5 Results and Discussion……………………………………………………………………...........10 Abiotic Conditions.............................................................................................................10 Trends in Invertebrate Distribution and Abundance....................................................16 Trends in Fish Distribution and Abundance..................................................................19 Conclusion..…………………………………………………………………………………..…...32 Acknowledgements.........................................................................................................................32 References…………………………………………………………………………………….…..33 Appendices………………………………………………………………………………………..36

4
INTRODUCTION Suisun Marsh is a brackish-water marsh bordering the northern edges of Suisun, Grizzly, and Honker bays in the San Francisco Estuary (Figure 1); it is the largest uninterrupted estuarine marsh remaining on the western coast of the contiguous United States (Moyle et al. 1986, Moyle et al. 2014). Much of the marsh area is diked wetlands managed for waterfowl, with the rest of the acreage consisting of tidal sloughs, marsh plains, and grasslands (DWR 2001). The marsh's central location in the northern San Francisco Estuary makes it an important nursery for euryhaline-freshwater, estuarine, and marine fishes; the marsh is also a migratory corridor for anadromous fishes such as Chinook salmon (Oncorhynchus tshawytscha; Vincik 2002). In January 1980, DWR contracted with UC Davis to monitor fishes in Suisun Marsh. Since then, monitoring has remained continuous and in compliance with regulatory requirements of (1) the San Francisco Bay Conservation and Development Commission 4-84 (M) Special Condition B, (2) the US Army Corps of Engineers 16223E58B Special Condition 1, and (3) the Suisun Marsh Preservation Agreement 2015 (Agreement Number 4600000633), formerly the Revised Suisun Marsh Monitoring Agreement. The study has consistently used two methods for sampling fishes: beach seines and otter trawls. Juveniles and adults of all species have been surveyed systematically since 1980; between 1994 and 1999, larval fishes were also surveyed (Meng and Matern 2001). Other objectives have included (1) evaluating the effects of the Suisun Marsh Salinity Control Gates on fishes (Matern et al. 2002), which began operating in 1988 (DWR 2001); (2) examining long-term changes in the Suisun Marsh ecosystem in relation to other changes in the San Francisco Estuary (e.g., Rosenfield and Baxter 2007, Moyle et al.
2014); and (3) enhancing understanding of the life history and ecology of key species in the marsh (e.g., Brown and Hieb 2014). Secondary objectives have included supporting research by other investigators through special collections (e.g., Liu et al. 2012); providing background information for in-depth studies of other aspects of the Suisun Marsh aquatic ecosystem (e.g., studies of jellyfish biology; Wintzer et al. 2011a, b, c; Meek et al. 2012); serving as a baseline for upcoming restoration and for ancillary studies of off-channel habitats (e.g., Williamson et al. 2015); contributing to the general understanding of estuarine systems through publication of peer-reviewed papers (e.g., Schroeter et al. 2015); training undergraduate and graduate students in estuarine studies and fish sampling; and providing a venue for managers, biologists, and others interested in the marsh to experience it firsthand. Moyle et al. (1986) evaluated the first five years of data collected by the study and found three groups of fishes that exhibited seasonal trends in abundance, primarily due to differences in recruitment timing. The structure of the fish assemblage was relatively constant through time; however, total fish abundance declined over the five years. The decline was partly due to strong year classes early in the study period followed by both extremely high river flows and drought that resulted in poor recruitment. The authors also found that native fishes were generally more prevalent in small, shallow sloughs, while non-native species were more prominent in large sloughs. Meng et al. (1994) incorporated eight more years into their study, which revealed that the fish assemblage structure was less constant over the longer period than the earlier study indicated. Additionally, non-native fishes had become more common in small, shallow sloughs. Like Moyle et al. (1986), Meng et al. (1994) found a general decline in total fish abundance through time, partly because of the drought and high salinity harming native fishes. Matern et al.
(2002) found results similar to Meng et al. (1994): fish diversity was highest in small sloughs, and native fish abundances continued to fall.
5
Recent studies have enhanced understanding of Suisun Marsh’s aquatic ecosystem. Isotope studies by Schroeter et al. (2015) found that many consumers in the marsh are generalists and that submerged aquatic vegetation may be a significant carbon source for upper trophic levels. Surveys in and around a restored tidal marsh (Blacklock Island) and a managed wetland (Luco Pond) utilizing identical gear to the Suisun Marsh Fish Study found higher fish abundances, higher fish diversity, and a higher proportion of native fishes in the managed wetland relative to the restored marsh, suggesting managed wetlands can provide benefits to desirable fishes while still supporting waterfowl (Williamson et al. 2015). Recent work by Baumsteiger et al. (2017, 2018) showed increased annual Black Sea jellyfish and overbite clam numbers associated with warmer, saltier water in Suisun Marsh. Finally, data accumulating from an ongoing companion study, (the "Arc Project") utilizing in part the same sampling methods as the Suisun Marsh Fish Study, are revealing that the marsh still provides vital habitat for at-risk native species, especially Sacramento splittail. Consequently, the Suisun Marsh Fish Study remains instrumental in documenting and understanding changes in the biology of the estuary, especially within the context of climate change and future restoration (Moyle et al. 2014). This report's purpose was to (1) compare water-quality conditions in 2017 with average conditions in Suisun Marsh; (2) compare abundances of important invertebrates and important fishes in 2017 to annual averages, noting abundance changes between 2016 and 2017; (3) describe the pattern in monthly abundance of notable fishes and invertebrates in 2017, pointing out unusual occurrences; and (4) describe the geographic distribution of fishes and invertebrates.
METHODS Study Area
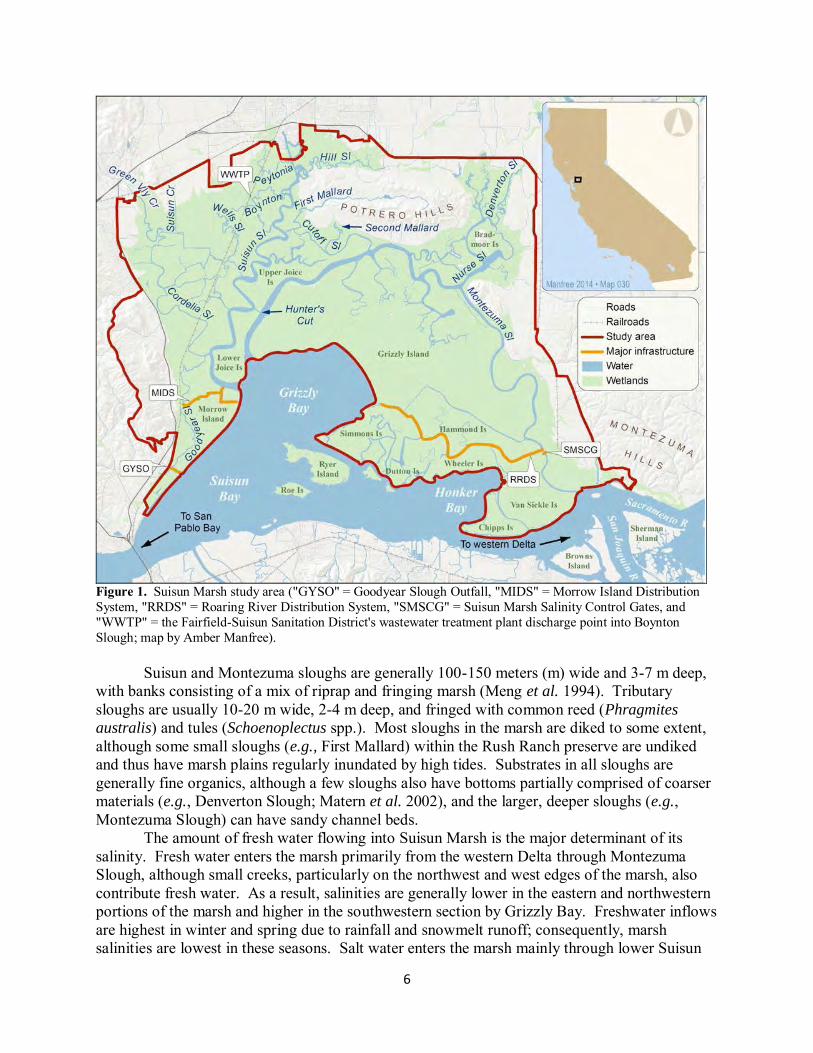
Suisun Marsh is a mosaic of landscape types totaling about 38,000 hectares, with about 9% of the acreage comprised of tidal sloughs (DWR 2001, O'Rear and Moyle 2015). The marsh is contiguous with the northern boundary of Suisun, Grizzly, and Honker bays and is central to the northern San Francisco Estuary (Figure 1), with San Pablo Bay to the west and the Sacramento-San Joaquin Delta ("Delta") to the east. The two major subtidal channels (referred to as “large sloughs” in this report) in the marsh are Montezuma and Suisun sloughs (Figure 1). Major tributary sloughs (referred to as “small sloughs” in this report) to Montezuma are Denverton and Nurse; Cutoff Slough and Hunter’s Cut connect Suisun and Montezuma sloughs (Figure 1). Tributaries to Suisun Slough, from north to south, are Peytonia, Hill, Boynton, Sheldrake, Cutoff, Wells, Cordelia, and Goodyear sloughs (Figure 1). First and Second Mallard sloughs are tributary to Cutoff Slough and are part of Solano Land Trust's Rush Ranch Open Space preserve; Rush Ranch is part of the San Francisco Bay National Estuarine Research Reserve (http://www.sfbaynerr.org).
6
Figure 1. Suisun Marsh study area ("GYSO" = Goodyear Slough Outfall, "MIDS" = Morrow Island Distribution System, "RRDS" = Roaring River Distribution System, "SMSCG" = Suisun Marsh Salinity Control Gates, and "WWTP" = the Fairfield-Suisun Sanitation District's wastewater treatment plant discharge point into Boynton Slough; map by Amber Manfree).
Suisun and Montezuma sloughs are generally 100-150 meters (m) wide and 3-7 m deep, with banks consisting of a mix of riprap and fringing marsh (Meng et al. 1994). Tributary sloughs are usually 10-20 m wide, 2-4 m deep, and fringed with common reed (Phragmites australis) and tules (Schoenoplectus spp.). Most sloughs in the marsh are diked to some extent, although some small sloughs (e.g., First Mallard) within the Rush Ranch preserve are undiked and thus have marsh plains regularly inundated by high tides. Substrates in all sloughs are generally fine organics, although a few sloughs also have bottoms partially comprised of coarser materials (e.g., Denverton Slough; Matern et al. 2002), and the larger, deeper sloughs (e.g., Montezuma Slough) can have sandy channel beds. The amount of fresh water flowing into Suisun Marsh is the major determinant of its salinity. Fresh water enters the marsh primarily from the western Delta through Montezuma Slough, although small creeks, particularly on the northwest and west edges of the marsh, also contribute fresh water. As a result, salinities are generally lower in the eastern and northwestern portions of the marsh and higher in the southwestern section by Grizzly Bay. Freshwater inflows are highest in winter and spring due to rainfall and snowmelt runoff; consequently, marsh salinities are lowest in these seasons. Salt water enters the marsh mainly through lower Suisun
7
and western Montezuma sloughs from Grizzly Bay via tides, although the effect of the tides is more pronounced on water-surface elevation than on salinity throughout much of the year (Matern et al. 2002). During extreme tides, water depths can change as much as 2 m over a tidal cycle, often dewatering much of the smaller sloughs at low tide and overtopping dikes at high tide. Several water management facilities alter the hydrology and water quality of the marsh. State Water Project and Central Valley Project water-pumping facilities in the southern Delta affect the timing and magnitude of freshwater flow into Suisun Marsh (DWR 1984). The Suisun Marsh Salinity Control Gates, located in Montezuma Slough just downstream of the confluence of the Sacramento and San Joaquin rivers, inhibit saltwater intrusion into the marsh during flood tides, providing fresher water for diked wetlands (DWR 2001; Figure 1). Numerous water control structures, most of which are unscreened for fish, are located throughout the marsh; they are opened in early autumn for flooding wetlands to attract wintering waterfowl, with water diverted from adjacent subtidal sloughs. Most water control structures remain open to some extent (or are reopened) during winter and spring, mainly to maintain water elevations in the wetlands, to leach salts from wetland soils, and to promote growth of desired waterfowl plants (DWR 1984). Diversions are restricted in some sloughs of the marsh during winter and spring to reduce entrainment of salmonids and smelts. Most wetlands are drained in late spring, with drainage water being discharged directly into sloughs within the marsh, and remain dry throughout summer. Several canal systems - the Roaring River Distribution System, the Morrow Island Distribution System, and the Goodyear Slough Outfall - redirect water in the marsh, with the goal of providing lower-salinity water for managed wetlands (Figure 1; DWR 2001). The Fairfield-Suisun Sewer District discharges tertiary-treated wastewater into Boynton Slough (Figure 1); the wastewater's salinity is low, and dissolved-oxygen (DO) concentration is high (e.g., 6 - 7 mg/L; Siegel et al. 2011).
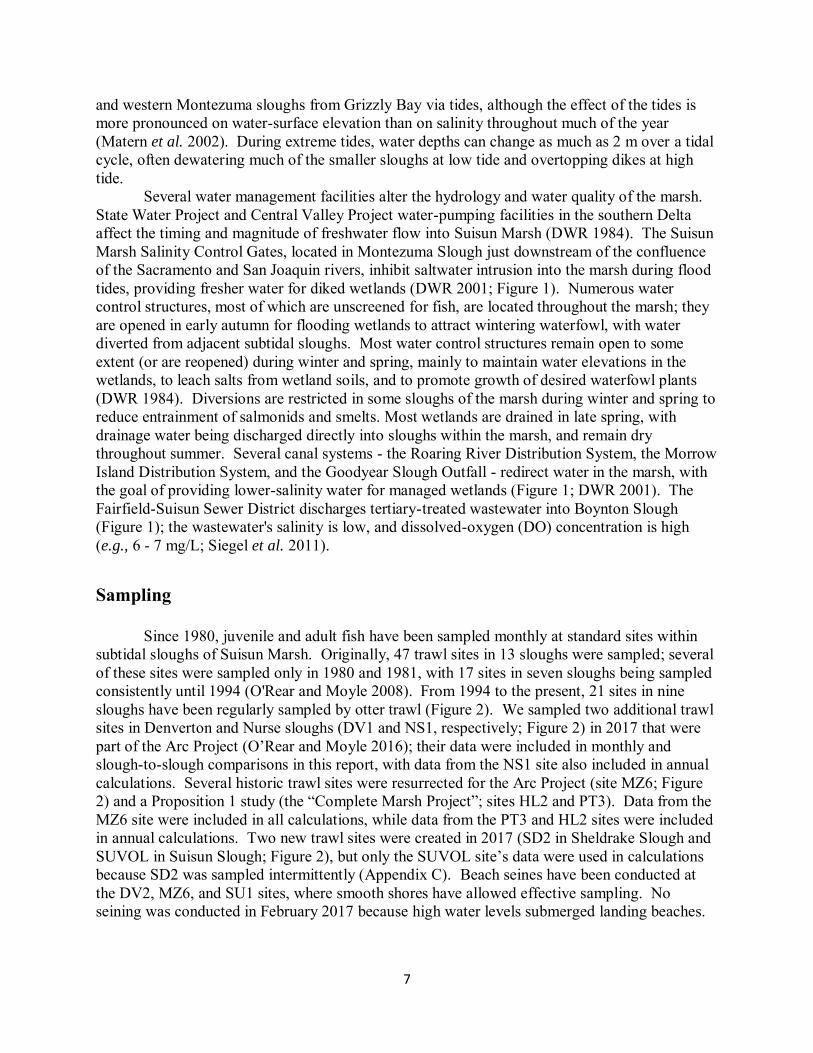
Sampling Since 1980, juvenile and adult fish have been sampled monthly at standard sites within subtidal sloughs of Suisun Marsh. Originally, 47 trawl sites in 13 sloughs were sampled; several of these sites were sampled only in 1980 and 1981, with 17 sites in seven sloughs being sampled consistently until 1994 (O'Rear and Moyle 2008). From 1994 to the present, 21 sites in nine sloughs have been regularly sampled by otter trawl (Figure 2). We sampled two additional trawl sites in Denverton and Nurse sloughs (DV1 and NS1, respectively; Figure 2) in 2017 that were part of the Arc Project (O’Rear and Moyle 2016); their data were included in monthly and slough-to-slough comparisons in this report, with data from the NS1 site also included in annual calculations. Several historic trawl sites were resurrected for the Arc Project (site MZ6; Figure 2) and a Proposition 1 study (the “Complete Marsh Project”; sites HL2 and PT3). Data from the MZ6 site were included in all calculations, while data from the PT3 and HL2 sites were included in annual calculations. Two new trawl sites were created in 2017 (SD2 in Sheldrake Slough and SUVOL in Suisun Slough; Figure 2), but only the SUVOL site’s data were used in calculations because SD2 was sampled intermittently (Appendix C). Beach seines have been conducted at the DV2, MZ6, and SU1 sites, where smooth shores have allowed effective sampling. No seining was conducted in February 2017 because high water levels submerged landing beaches.
8
Figure 2. Current Suisun Marsh Fish Study sampling sites and DWR water-quality monitoring stations used in this report. Trawling was conducted using a four-seam otter trawl with a 1.5-m X 4.3-m opening, a length of 5.3 m, and mesh sizes of 35-millimeter (mm) stretch in the body and 6-mm stretch in the cod end. The otter trawl was towed at 4 km/hr for 5 minutes in small sloughs and at the same speed for 10 minutes in large sloughs. Inshore fishes were sampled with a 10-m beach seine having a stretched mesh size of 6 mm. For each site, temperature (degrees Celsius, °C), salinity (parts per thousand, ppt), and specific conductance (microSiemens, μS) were recorded with a Yellow Springs Instruments PRO2030 meter. Dissolved oxygen (DO) parameters (milligrams per liter, mg/l, and % saturation), first sampled in 2000, were also measured with the PRO2030. Water transparency (Secchi depth, cm), tidal stage (ebb, flood, high, low), and water depths (m) were also recorded. Contents of each trawl or seine were placed into large containers of water. Fishes were identified and measured to the nearest mm standard length (mm SL), and then returned to the water. Sensitive native species were processed first and immediately released. Numbers of Black Sea jellyfish, Siberian prawn, oriental shrimp (Palaemon macrodactylus), California bay shrimp, Harris mud crab (Rhithropanopeus harrisii), overbite clam, Asian clam (Corbicula
fluminea), and other macroinvertebrate species were also recorded. Siberian prawn were first positively identified in February 2002, although they likely comprised a large percentage of the
9
2001 and early 2002 shrimp catch that was recorded as oriental shrimp. Abundances of Siberian prawn for this report are only considered from 2002 onward. Crustaceans from the order Mysida were pooled into one category, “mysids," and given an abundance ranking: 1 = 1-3 mysids, 2 = 4-50 mysids, 3 = 51-100 mysids, 4 = 101-500 mysids, and 5 = >500 mysids. Data analysis For this report, catch-per-unit-effort (CPUE) values were calculated differently depending on the type of comparison. For comparisons made among calendar years, CPUE for beach seines and otter trawls was calculated as
𝐶𝑃𝑈𝐸 = 𝑎𝑛𝑛𝑢𝑎𝑙 𝑛𝑢𝑚𝑏𝑒𝑟 𝑜𝑓 𝑓𝑖𝑠ℎ 𝑐𝑎𝑢𝑔ℎ𝑡 𝑖𝑛 𝑡𝑟𝑎𝑤𝑙𝑠/𝑠𝑒𝑖𝑛𝑒𝑠
𝑎𝑛𝑛𝑢𝑎𝑙 𝑛𝑢𝑚𝑏𝑒𝑟 𝑜𝑓 𝑡𝑟𝑎𝑤𝑙𝑠/𝑠𝑒𝑖𝑛𝑒𝑠
to remain consistent with previous reports (e.g., Schroeter et al. 2006); CPUE values for invertebrates were also calculated likewise, with the annual number of individuals for the invertebrate of interest substituting for "annual number of fish." Slough-to-slough CPUE values for select species were calculated similarly except that, to account for unequal effort, minutes rather than number of trawls were used in the denominator. For monthly comparisons, to account for unequal effort among sloughs, CPUE values for otter trawls were calculated as
𝐶𝑃𝑈𝐸ij = ∑
𝑛𝑢𝑚𝑏𝑒𝑟 𝑜𝑓 𝑓𝑖𝑠ℎ𝑖𝑗
𝑛𝑢𝑚𝑏𝑒𝑟 𝑜𝑓 𝑡𝑟𝑎𝑤𝑙𝑠𝑖𝑗
𝑛𝑖=1
𝑛
where i = slough, j =month, and n is the number of sloughs; once again, CPUE values for beach seines and for invertebrates were calculated likewise. Age classes of fishes except Sacramento splittail and striped bass were determined from peaks and valleys in length-frequency graphs. Sacramento splittail age classes were determined following length-frequency-age analyses by Matern and Sommer (unpublished). Age-0 striped bass were classified as those fish belonging to the length-frequency-graph peak corresponding to the smallest size classes after April, adults were considered fish larger than 423 mm SL, and all others were classified as "juveniles." To describe geographic distribution, the proportion of the 2017 otter trawl catch from the sampled sloughs was computed for dominant species, and annual CPUE with minutes as the denominator was calculated for each slough for age classes of striped bass and Sacramento splittail. Monthly water-quality averages for 2017 were calculated as for CPUE values, with the sum of the measurements of the water-quality parameter of interest (e.g., Secchi depth, water temperature) substituting for "number of fish." The Net Delta Outflow Index ("Delta outflow"), a proxy for water leaving the Delta, was calculated by summing river flows entering the Delta, channel depletions, in-Delta diversions, and State Water Project, Central Valley Project, and Contra Costa Water District exports. Delta outflow was obtained from the DWR’s Dayflow website (DWR 2018).
Monthly water-quality results of 2017 were graphed and compared to averages for all years of the study. Fifteen-minute salinity and water temperature data from DWR fixed stations, GYS and MSL (Figure 2), were graphed with the water-quality data collected during fish
10
sampling to provide additional context. These two stations were chosen because they were the DWR stations closest to the fish-sampling sites, and they were in sloughs that exhibited opposing extremes of habitat conditions (e.g., slough cross-sectional area, geographical position). Annual CPUE values for otter trawls and beach seines were graphed, as were monthly CPUE values for dominant invertebrate and fish species. Catch of all fishes and by each method from 1979 to 2017 are found in Appendix A; annual catch of each slough and number of trawls/seines in each slough in 2017 are found in Appendix B and C.
RESULTS AND DISCUSSION Abiotic Conditions
Delta Outflow
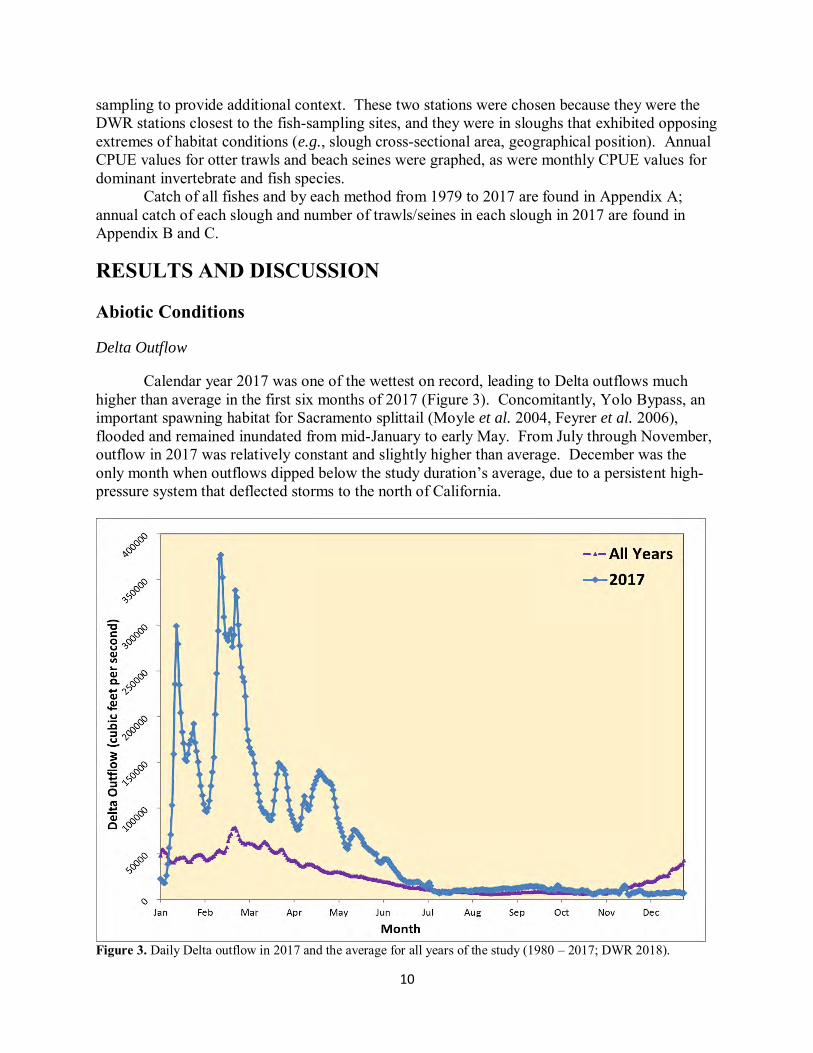
Calendar year 2017 was one of the wettest on record, leading to Delta outflows much higher than average in the first six months of 2017 (Figure 3). Concomitantly, Yolo Bypass, an important spawning habitat for Sacramento splittail (Moyle et al. 2004, Feyrer et al. 2006), flooded and remained inundated from mid-January to early May. From July through November, outflow in 2017 was relatively constant and slightly higher than average. December was the only month when outflows dipped below the study duration’s average, due to a persistent high-pressure system that deflected storms to the north of California.
Figure 3. Daily Delta outflow in 2017 and the average for all years of the study (1980 – 2017; DWR 2018).
11
Salinity
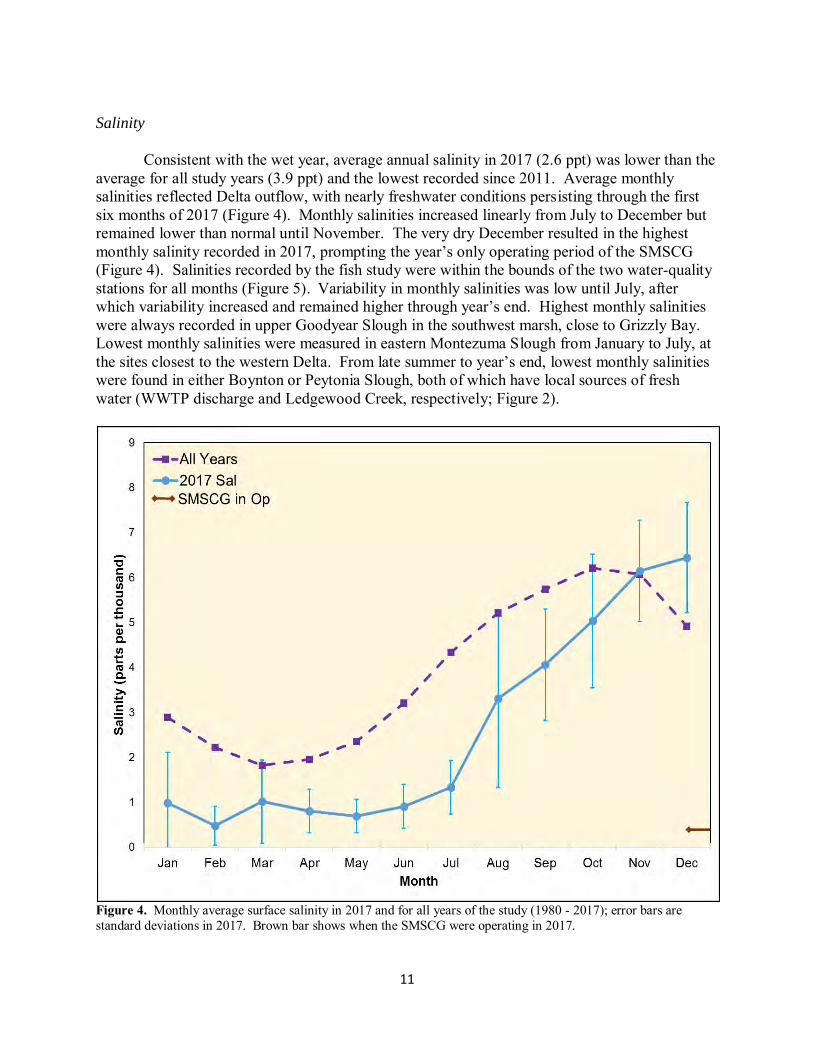
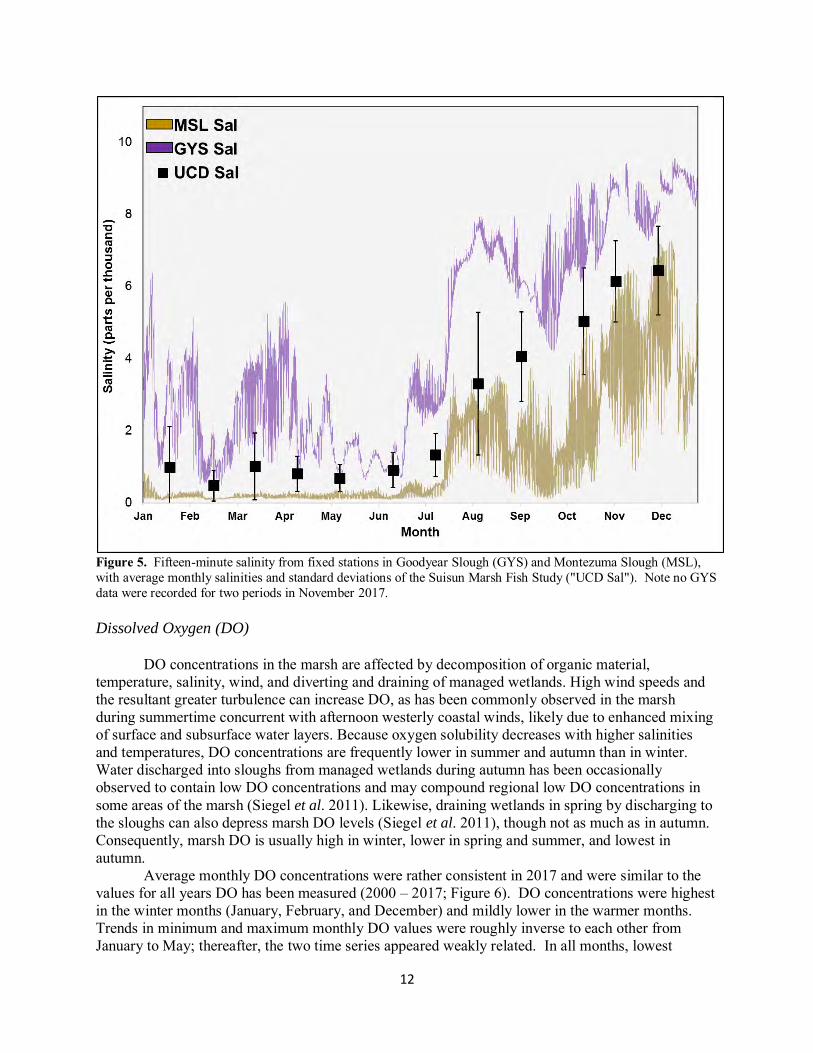
Consistent with the wet year, average annual salinity in 2017 (2.6 ppt) was lower than the average for all study years (3.9 ppt) and the lowest recorded since 2011. Average monthly salinities reflected Delta outflow, with nearly freshwater conditions persisting through the first six months of 2017 (Figure 4). Monthly salinities increased linearly from July to December but remained lower than normal until November. The very dry December resulted in the highest monthly salinity recorded in 2017, prompting the year’s only operating period of the SMSCG (Figure 4). Salinities recorded by the fish study were within the bounds of the two water-quality stations for all months (Figure 5). Variability in monthly salinities was low until July, after which variability increased and remained higher through year’s end. Highest monthly salinities were always recorded in upper Goodyear Slough in the southwest marsh, close to Grizzly Bay. Lowest monthly salinities were measured in eastern Montezuma Slough from January to July, at the sites closest to the western Delta. From late summer to year’s end, lowest monthly salinities were found in either Boynton or Peytonia Slough, both of which have local sources of fresh water (WWTP discharge and Ledgewood Creek, respectively; Figure 2).
Figure 4. Monthly average surface salinity in 2017 and for all years of the study (1980 - 2017); error bars are standard deviations in 2017. Brown bar shows when the SMSCG were operating in 2017.
12
Figure 5. Fifteen-minute salinity from fixed stations in Goodyear Slough (GYS) and Montezuma Slough (MSL), with average monthly salinities and standard deviations of the Suisun Marsh Fish Study ("UCD Sal"). Note no GYS data were recorded for two periods in November 2017. Dissolved Oxygen (DO)
DO concentrations in the marsh are affected by decomposition of organic material,
temperature, salinity, wind, and diverting and draining of managed wetlands. High wind speeds and the resultant greater turbulence can increase DO, as has been commonly observed in the marsh during summertime concurrent with afternoon westerly coastal winds, likely due to enhanced mixing of surface and subsurface water layers. Because oxygen solubility decreases with higher salinities and temperatures, DO concentrations are frequently lower in summer and autumn than in winter. Water discharged into sloughs from managed wetlands during autumn has been occasionally observed to contain low DO concentrations and may compound regional low DO concentrations in some areas of the marsh (Siegel et al. 2011). Likewise, draining wetlands in spring by discharging to the sloughs can also depress marsh DO levels (Siegel et al. 2011), though not as much as in autumn. Consequently, marsh DO is usually high in winter, lower in spring and summer, and lowest in autumn.
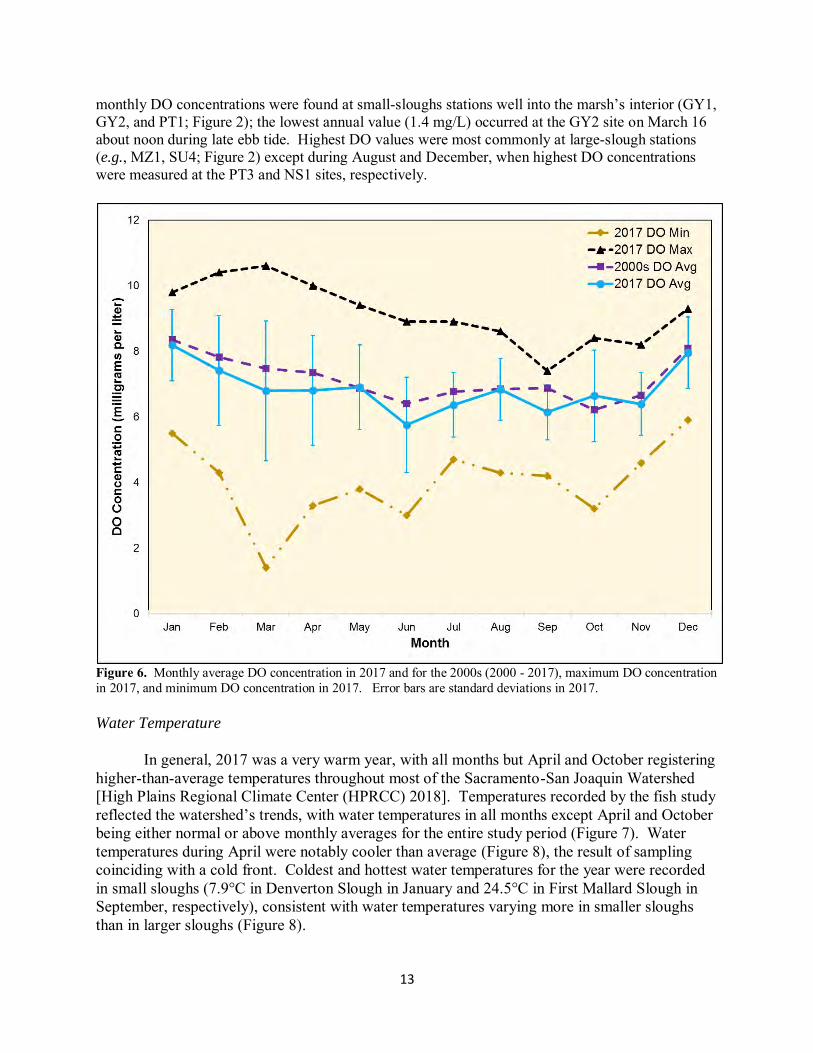
Average monthly DO concentrations were rather consistent in 2017 and were similar to the values for all years DO has been measured (2000 – 2017; Figure 6). DO concentrations were highest in the winter months (January, February, and December) and mildly lower in the warmer months. Trends in minimum and maximum monthly DO values were roughly inverse to each other from January to May; thereafter, the two time series appeared weakly related. In all months, lowest
13
monthly DO concentrations were found at small-sloughs stations well into the marsh’s interior (GY1, GY2, and PT1; Figure 2); the lowest annual value (1.4 mg/L) occurred at the GY2 site on March 16 about noon during late ebb tide. Highest DO values were most commonly at large-slough stations (e.g., MZ1, SU4; Figure 2) except during August and December, when highest DO concentrations were measured at the PT3 and NS1 sites, respectively.
Figure 6. Monthly average DO concentration in 2017 and for the 2000s (2000 - 2017), maximum DO concentration in 2017, and minimum DO concentration in 2017. Error bars are standard deviations in 2017.
Water Temperature
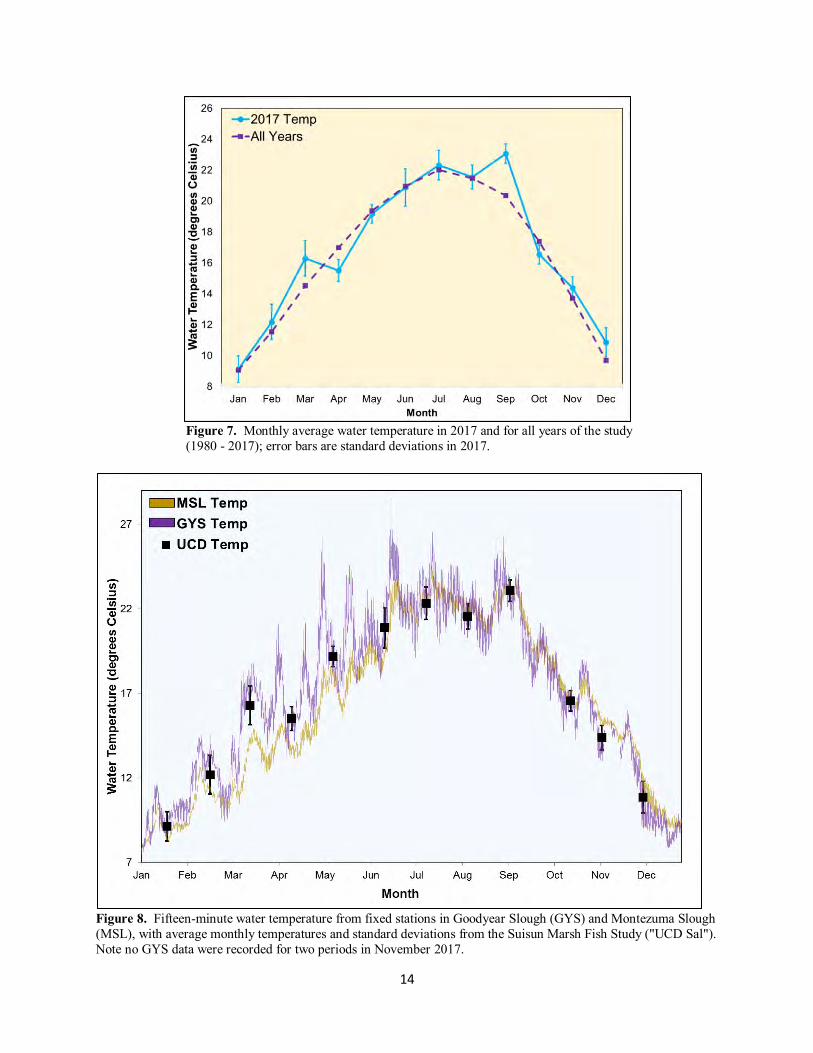
In general, 2017 was a very warm year, with all months but April and October registering higher-than-average temperatures throughout most of the Sacramento-San Joaquin Watershed [High Plains Regional Climate Center (HPRCC) 2018]. Temperatures recorded by the fish study reflected the watershed’s trends, with water temperatures in all months except April and October being either normal or above monthly averages for the entire study period (Figure 7). Water temperatures during April were notably cooler than average (Figure 8), the result of sampling coinciding with a cold front. Coldest and hottest water temperatures for the year were recorded in small sloughs (7.9°C in Denverton Slough in January and 24.5°C in First Mallard Slough in September, respectively), consistent with water temperatures varying more in smaller sloughs than in larger sloughs (Figure 8).
14
Figure 7. Monthly average water temperature in 2017 and for all years of the study (1980 - 2017); error bars are standard deviations in 2017.
Figure 8. Fifteen-minute water temperature from fixed stations in Goodyear Slough (GYS) and Montezuma Slough (MSL), with average monthly temperatures and standard deviations from the Suisun Marsh Fish Study ("UCD Sal"). Note no GYS data were recorded for two periods in November 2017.
15
Water Transparency
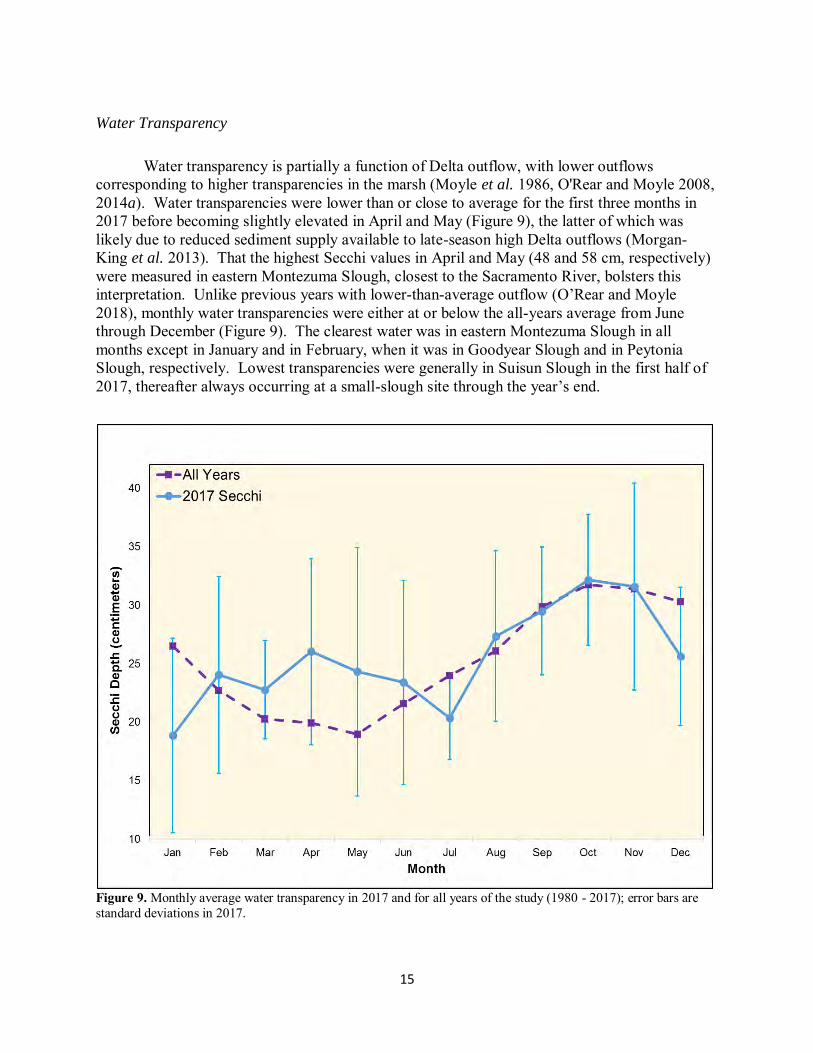
Water transparency is partially a function of Delta outflow, with lower outflows
corresponding to higher transparencies in the marsh (Moyle et al. 1986, O'Rear and Moyle 2008, 2014a). Water transparencies were lower than or close to average for the first three months in 2017 before becoming slightly elevated in April and May (Figure 9), the latter of which was likely due to reduced sediment supply available to late-season high Delta outflows (Morgan-King et al. 2013). That the highest Secchi values in April and May (48 and 58 cm, respectively) were measured in eastern Montezuma Slough, closest to the Sacramento River, bolsters this interpretation. Unlike previous years with lower-than-average outflow (O’Rear and Moyle 2018), monthly water transparencies were either at or below the all-years average from June through December (Figure 9). The clearest water was in eastern Montezuma Slough in all months except in January and in February, when it was in Goodyear Slough and in Peytonia Slough, respectively. Lowest transparencies were generally in Suisun Slough in the first half of 2017, thereafter always occurring at a small-slough site through the year’s end.
Figure 9. Monthly average water transparency in 2017 and for all years of the study (1980 - 2017); error bars are standard deviations in 2017.
16
Trends in Invertebrate Distribution and Abundance
Four plankton-feeding macroinvertebrates are commonly captured in high abundance in Suisun Marsh: California bay shrimp, Siberian prawn, Black Sea jellyfish, and overbite clam, of which only the bay shrimp is native. These invertebrates are important food-web components, either as competitors [e.g., Black Sea jellyfish (Wintzer et al. 2011), overbite clam (Feyrer et al. 2003)] or as fish food [e.g., California bay shrimp and Siberian prawn (Nobriga and Feyrer 2008)].
Black Sea Jellyfish
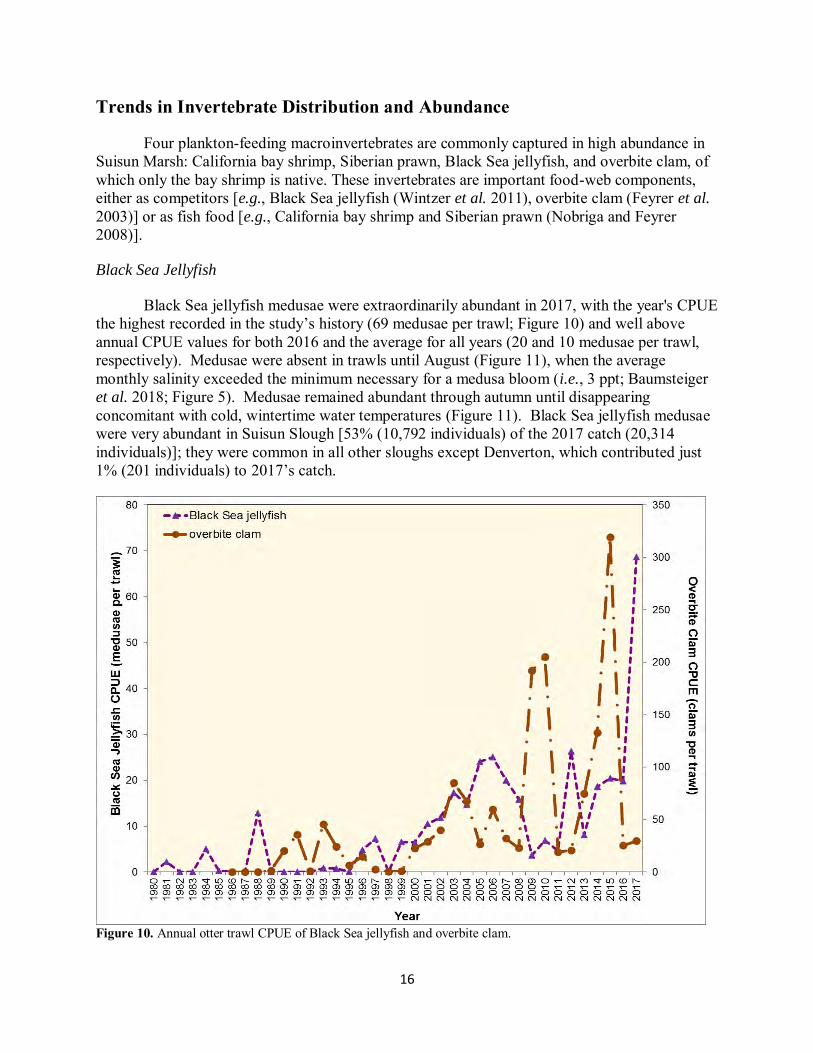
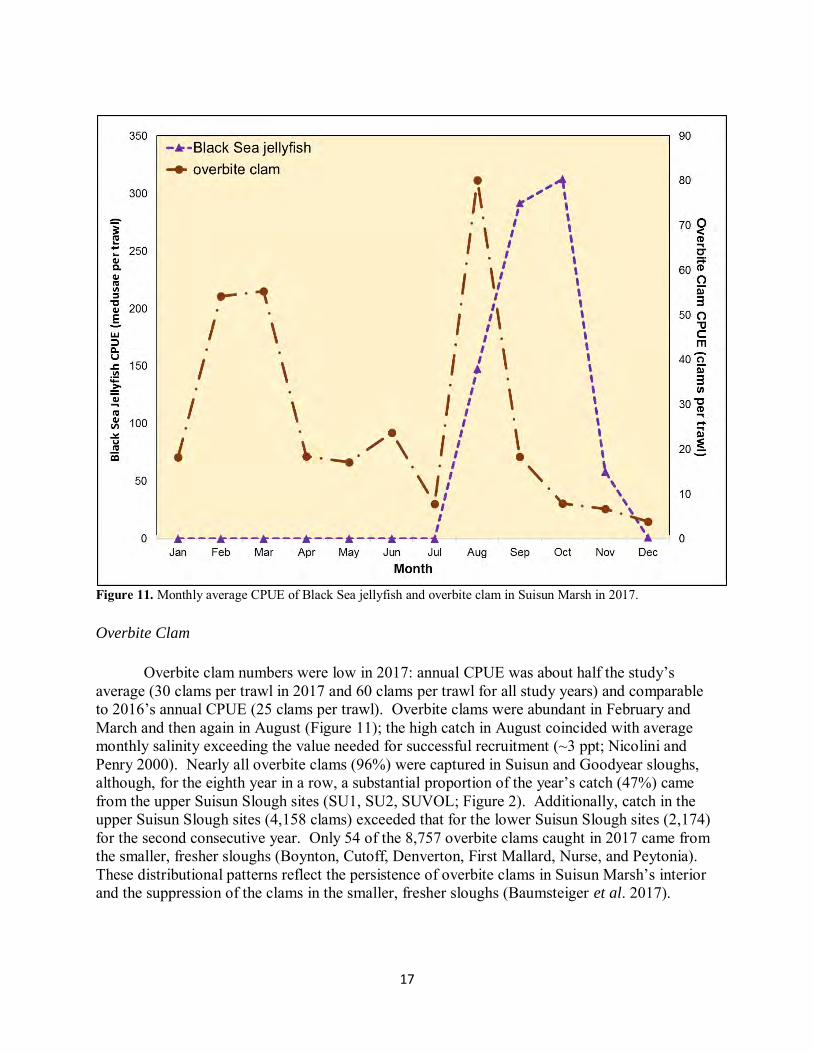
Black Sea jellyfish medusae were extraordinarily abundant in 2017, with the year's CPUE the highest recorded in the study’s history (69 medusae per trawl; Figure 10) and well above annual CPUE values for both 2016 and the average for all years (20 and 10 medusae per trawl, respectively). Medusae were absent in trawls until August (Figure 11), when the average monthly salinity exceeded the minimum necessary for a medusa bloom (i.e., 3 ppt; Baumsteiger et al. 2018; Figure 5). Medusae remained abundant through autumn until disappearing concomitant with cold, wintertime water temperatures (Figure 11). Black Sea jellyfish medusae were very abundant in Suisun Slough [53% (10,792 individuals) of the 2017 catch (20,314 individuals)]; they were common in all other sloughs except Denverton, which contributed just 1% (201 individuals) to 2017’s catch.
Figure 10. Annual otter trawl CPUE of Black Sea jellyfish and overbite clam.
17
Figure 11. Monthly average CPUE of Black Sea jellyfish and overbite clam in Suisun Marsh in 2017. Overbite Clam
Overbite clam numbers were low in 2017: annual CPUE was about half the study’s average (30 clams per trawl in 2017 and 60 clams per trawl for all study years) and comparable to 2016’s annual CPUE (25 clams per trawl). Overbite clams were abundant in February and March and then again in August (Figure 11); the high catch in August coincided with average monthly salinity exceeding the value needed for successful recruitment (~3 ppt; Nicolini and Penry 2000). Nearly all overbite clams (96%) were captured in Suisun and Goodyear sloughs, although, for the eighth year in a row, a substantial proportion of the year’s catch (47%) came from the upper Suisun Slough sites (SU1, SU2, SUVOL; Figure 2). Additionally, catch in the upper Suisun Slough sites (4,158 clams) exceeded that for the lower Suisun Slough sites (2,174) for the second consecutive year. Only 54 of the 8,757 overbite clams caught in 2017 came from the smaller, fresher sloughs (Boynton, Cutoff, Denverton, First Mallard, Nurse, and Peytonia). These distributional patterns reflect the persistence of overbite clams in Suisun Marsh’s interior and the suppression of the clams in the smaller, fresher sloughs (Baumsteiger et al. 2017).
18
California Bay Shrimp
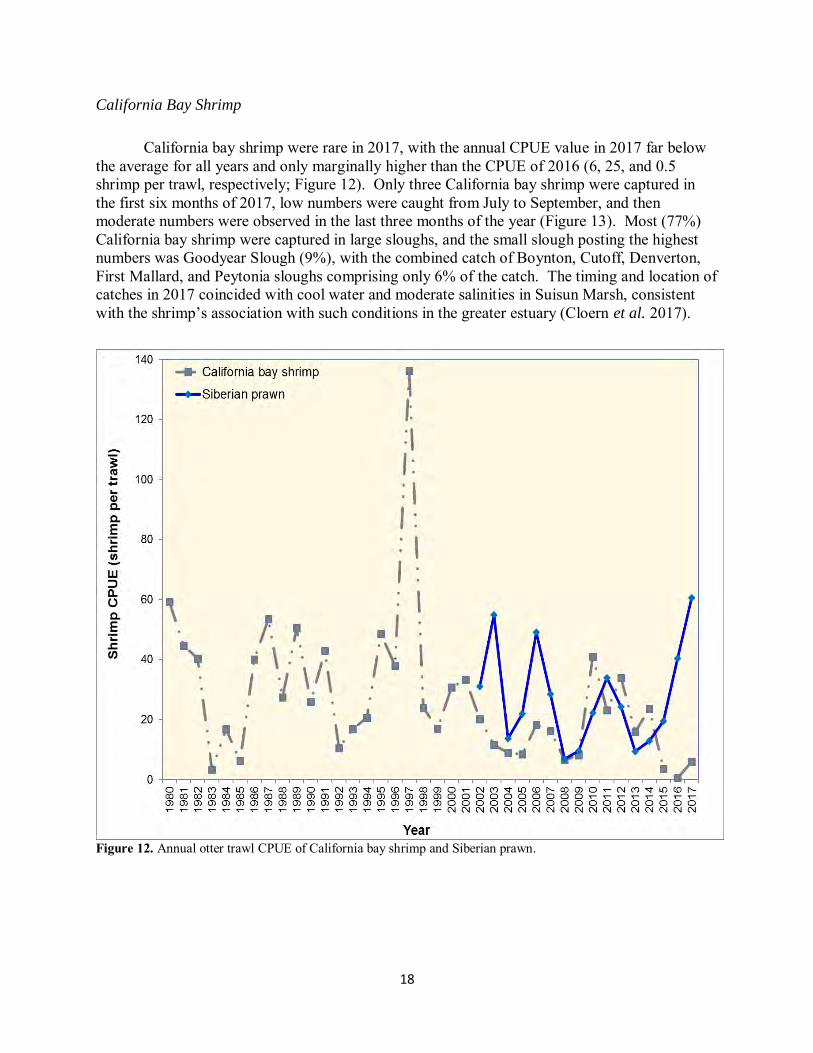
California bay shrimp were rare in 2017, with the annual CPUE value in 2017 far below the average for all years and only marginally higher than the CPUE of 2016 (6, 25, and 0.5 shrimp per trawl, respectively; Figure 12). Only three California bay shrimp were captured in the first six months of 2017, low numbers were caught from July to September, and then moderate numbers were observed in the last three months of the year (Figure 13). Most (77%) California bay shrimp were captured in large sloughs, and the small slough posting the highest numbers was Goodyear Slough (9%), with the combined catch of Boynton, Cutoff, Denverton, First Mallard, and Peytonia sloughs comprising only 6% of the catch. The timing and location of catches in 2017 coincided with cool water and moderate salinities in Suisun Marsh, consistent with the shrimp’s association with such conditions in the greater estuary (Cloern et al. 2017).
Figure 12. Annual otter trawl CPUE of California bay shrimp and Siberian prawn.
19
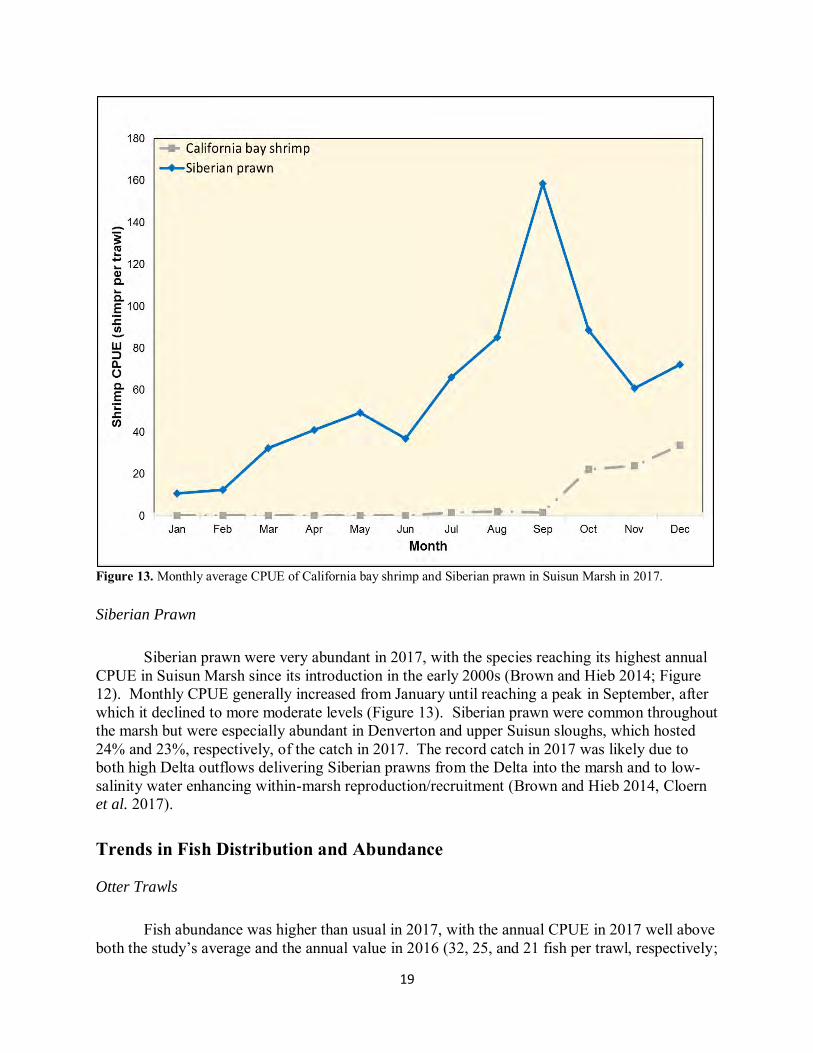
Figure 13. Monthly average CPUE of California bay shrimp and Siberian prawn in Suisun Marsh in 2017. Siberian Prawn
Siberian prawn were very abundant in 2017, with the species reaching its highest annual CPUE in Suisun Marsh since its introduction in the early 2000s (Brown and Hieb 2014; Figure 12). Monthly CPUE generally increased from January until reaching a peak in September, after which it declined to more moderate levels (Figure 13). Siberian prawn were common throughout the marsh but were especially abundant in Denverton and upper Suisun sloughs, which hosted 24% and 23%, respectively, of the catch in 2017. The record catch in 2017 was likely due to both high Delta outflows delivering Siberian prawns from the Delta into the marsh and to low-salinity water enhancing within-marsh reproduction/recruitment (Brown and Hieb 2014, Cloern et al. 2017). Trends in Fish Distribution and Abundance
Otter Trawls
Fish abundance was higher than usual in 2017, with the annual CPUE in 2017 well above both the study’s average and the annual value in 2016 (32, 25, and 21 fish per trawl, respectively;
20
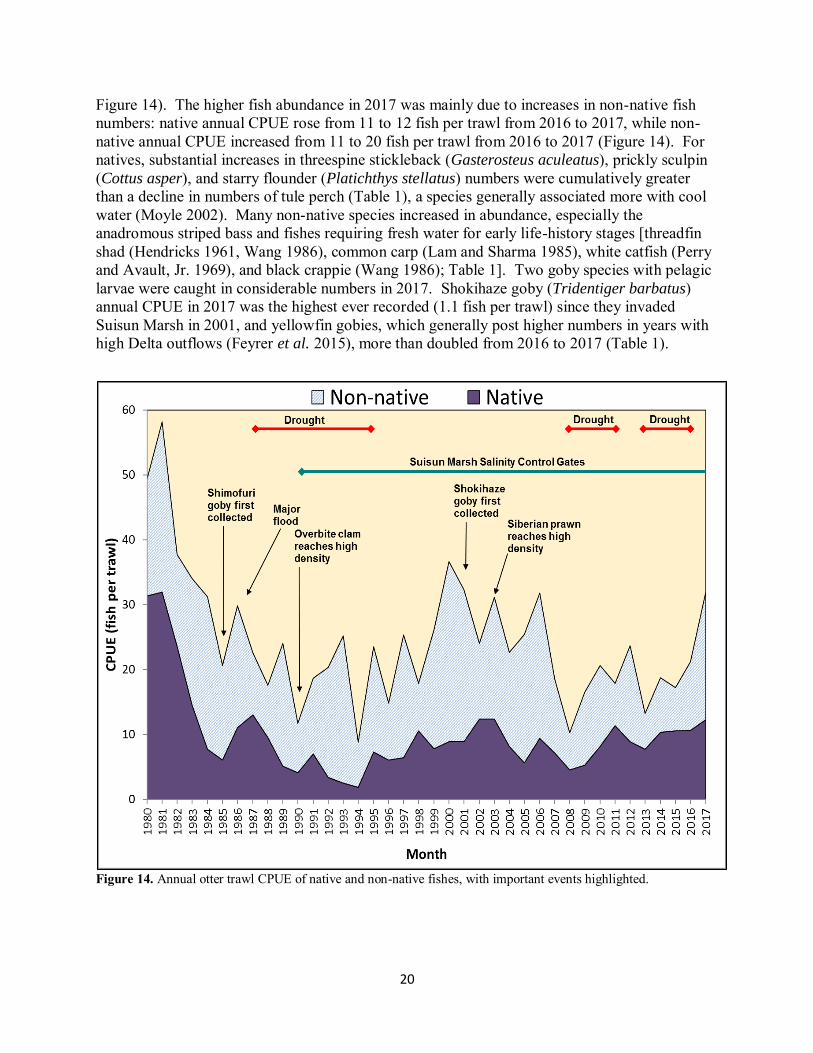
Figure 14). The higher fish abundance in 2017 was mainly due to increases in non-native fish numbers: native annual CPUE rose from 11 to 12 fish per trawl from 2016 to 2017, while non-native annual CPUE increased from 11 to 20 fish per trawl from 2016 to 2017 (Figure 14). For natives, substantial increases in threespine stickleback (Gasterosteus aculeatus), prickly sculpin (Cottus asper), and starry flounder (Platichthys stellatus) numbers were cumulatively greater than a decline in numbers of tule perch (Table 1), a species generally associated more with cool water (Moyle 2002). Many non-native species increased in abundance, especially the anadromous striped bass and fishes requiring fresh water for early life-history stages [threadfin shad (Hendricks 1961, Wang 1986), common carp (Lam and Sharma 1985), white catfish (Perry and Avault, Jr. 1969), and black crappie (Wang 1986); Table 1]. Two goby species with pelagic larvae were caught in considerable numbers in 2017. Shokihaze goby (Tridentiger barbatus) annual CPUE in 2017 was the highest ever recorded (1.1 fish per trawl) since they invaded Suisun Marsh in 2001, and yellowfin gobies, which generally post higher numbers in years with high Delta outflows (Feyrer et al. 2015), more than doubled from 2016 to 2017 (Table 1).
Figure 14. Annual otter trawl CPUE of native and non-native fishes, with important events highlighted.
21
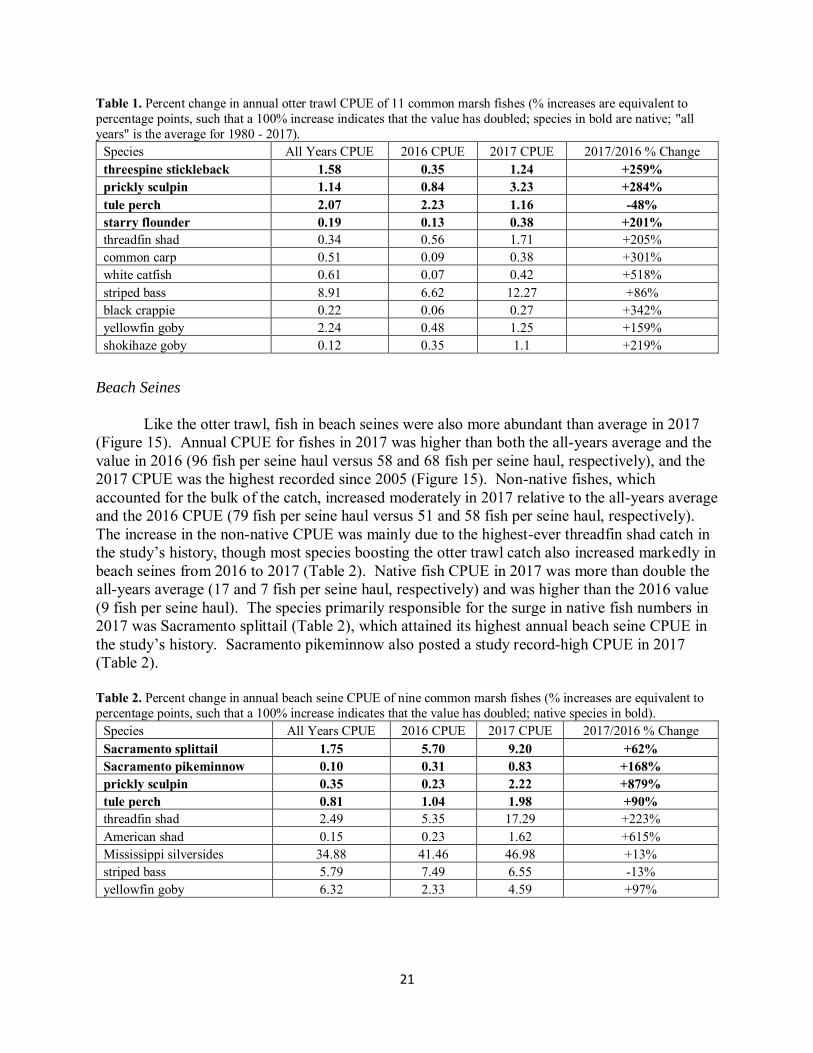
Table 1. Percent change in annual otter trawl CPUE of 11 common marsh fishes (% increases are equivalent to percentage points, such that a 100% increase indicates that the value has doubled; species in bold are native; "all years" is the average for 1980 - 2017).
Species All Years CPUE 2016 CPUE 2017 CPUE 2017/2016 % Change threespine stickleback 1.58 0.35 1.24 +259% prickly sculpin 1.14 0.84 3.23 +284% tule perch 2.07 2.23 1.16 -48% starry flounder 0.19 0.13 0.38 +201% threadfin shad 0.34 0.56 1.71 +205% common carp 0.51 0.09 0.38 +301% white catfish 0.61 0.07 0.42 +518% striped bass 8.91 6.62 12.27 +86% black crappie 0.22 0.06 0.27 +342% yellowfin goby 2.24 0.48 1.25 +159% shokihaze goby 0.12 0.35 1.1 +219%
Beach Seines
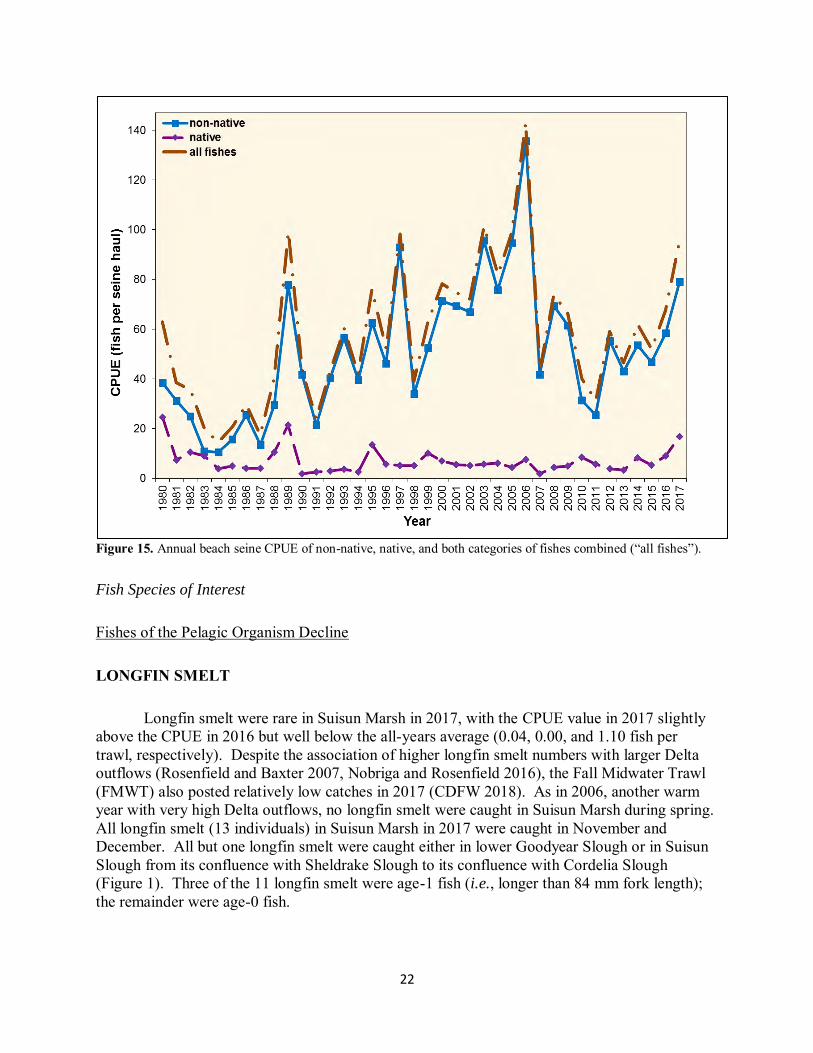
Like the otter trawl, fish in beach seines were also more abundant than average in 2017 (Figure 15). Annual CPUE for fishes in 2017 was higher than both the all-years average and the value in 2016 (96 fish per seine haul versus 58 and 68 fish per seine haul, respectively), and the 2017 CPUE was the highest recorded since 2005 (Figure 15). Non-native fishes, which accounted for the bulk of the catch, increased moderately in 2017 relative to the all-years average and the 2016 CPUE (79 fish per seine haul versus 51 and 58 fish per seine haul, respectively). The increase in the non-native CPUE was mainly due to the highest-ever threadfin shad catch in the study’s history, though most species boosting the otter trawl catch also increased markedly in beach seines from 2016 to 2017 (Table 2). Native fish CPUE in 2017 was more than double the all-years average (17 and 7 fish per seine haul, respectively) and was higher than the 2016 value (9 fish per seine haul). The species primarily responsible for the surge in native fish numbers in 2017 was Sacramento splittail (Table 2), which attained its highest annual beach seine CPUE in the study’s history. Sacramento pikeminnow also posted a study record-high CPUE in 2017 (Table 2). Table 2. Percent change in annual beach seine CPUE of nine common marsh fishes (% increases are equivalent to percentage points, such that a 100% increase indicates that the value has doubled; native species in bold).
Species All Years CPUE 2016 CPUE 2017 CPUE 2017/2016 % Change Sacramento splittail 1.75 5.70 9.20 +62% Sacramento pikeminnow 0.10 0.31 0.83 +168% prickly sculpin 0.35 0.23 2.22 +879% tule perch 0.81 1.04 1.98 +90% threadfin shad 2.49 5.35 17.29 +223% American shad 0.15 0.23 1.62 +615% Mississippi silversides 34.88 41.46 46.98 +13% striped bass 5.79 7.49 6.55 -13% yellowfin goby 6.32 2.33 4.59 +97%
22
Figure 15. Annual beach seine CPUE of non-native, native, and both categories of fishes combined (“all fishes”).
Fish Species of Interest
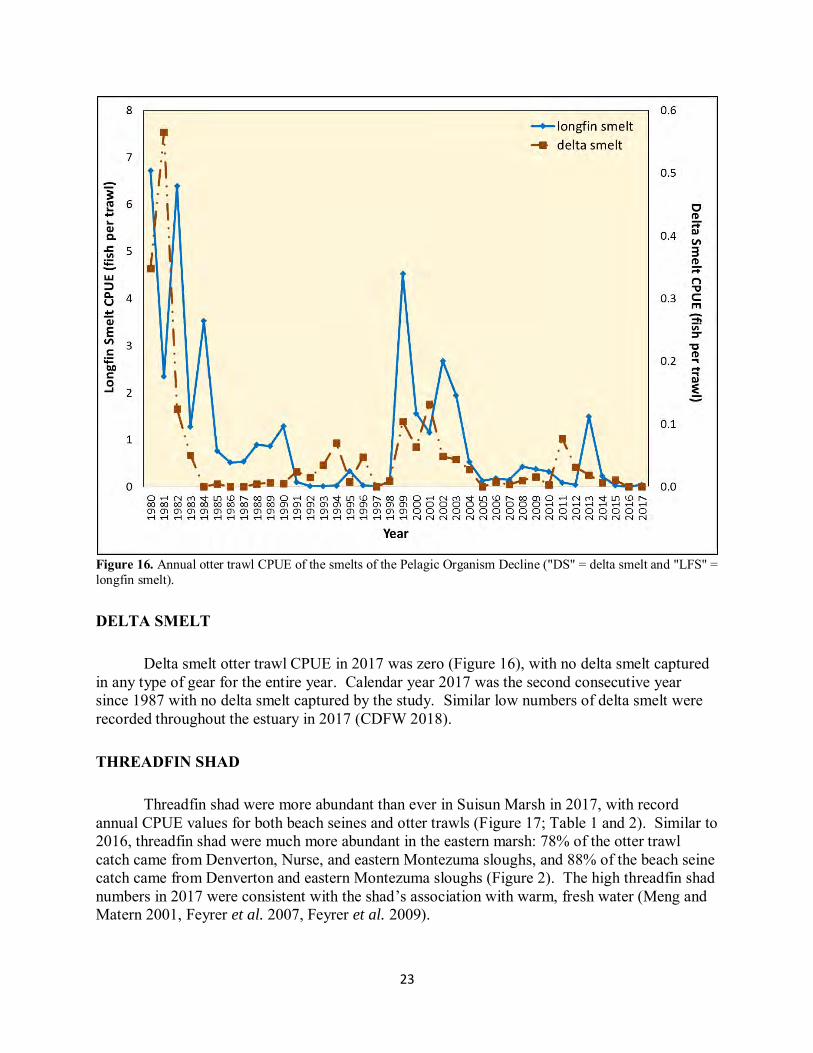
Fishes of the Pelagic Organism Decline LONGFIN SMELT Longfin smelt were rare in Suisun Marsh in 2017, with the CPUE value in 2017 slightly above the CPUE in 2016 but well below the all-years average (0.04, 0.00, and 1.10 fish per trawl, respectively). Despite the association of higher longfin smelt numbers with larger Delta outflows (Rosenfield and Baxter 2007, Nobriga and Rosenfield 2016), the Fall Midwater Trawl (FMWT) also posted relatively low catches in 2017 (CDFW 2018). As in 2006, another warm year with very high Delta outflows, no longfin smelt were caught in Suisun Marsh during spring. All longfin smelt (13 individuals) in Suisun Marsh in 2017 were caught in November and December. All but one longfin smelt were caught either in lower Goodyear Slough or in Suisun Slough from its confluence with Sheldrake Slough to its confluence with Cordelia Slough (Figure 1). Three of the 11 longfin smelt were age-1 fish (i.e., longer than 84 mm fork length); the remainder were age-0 fish.
23
Figure 16. Annual otter trawl CPUE of the smelts of the Pelagic Organism Decline ("DS" = delta smelt and "LFS" = longfin smelt).
DELTA SMELT
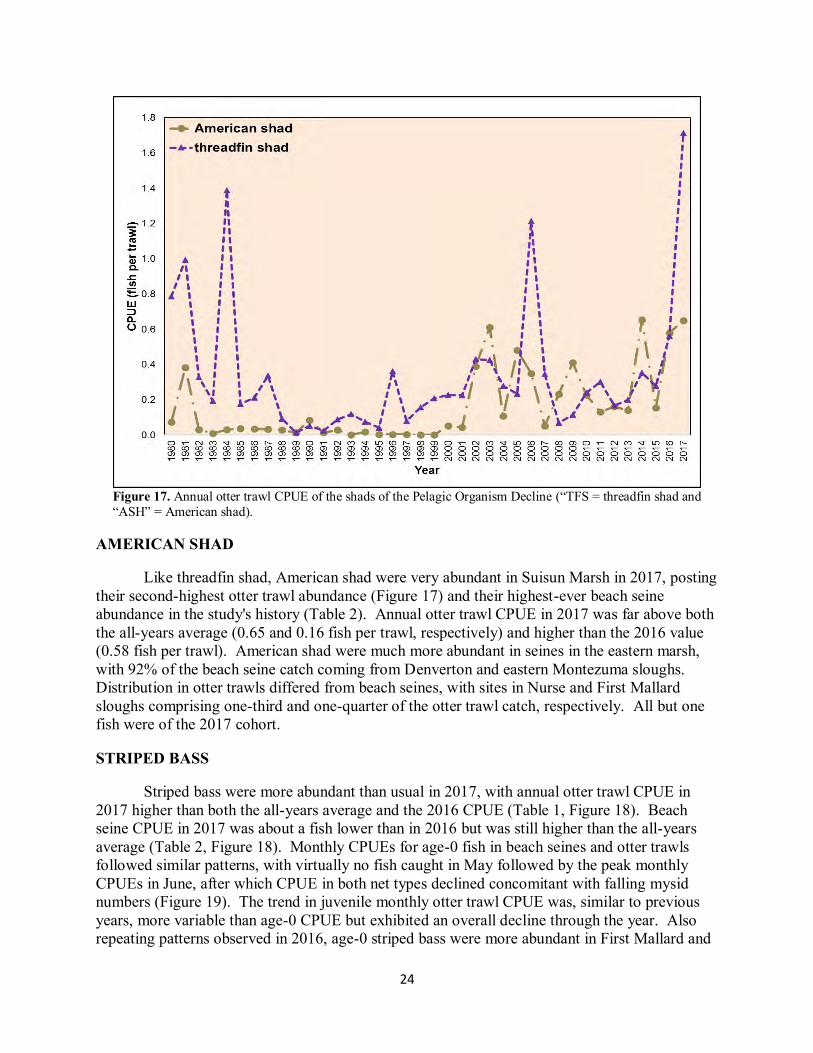
Delta smelt otter trawl CPUE in 2017 was zero (Figure 16), with no delta smelt captured in any type of gear for the entire year. Calendar year 2017 was the second consecutive year since 1987 with no delta smelt captured by the study. Similar low numbers of delta smelt were recorded throughout the estuary in 2017 (CDFW 2018). THREADFIN SHAD Threadfin shad were more abundant than ever in Suisun Marsh in 2017, with record annual CPUE values for both beach seines and otter trawls (Figure 17; Table 1 and 2). Similar to 2016, threadfin shad were much more abundant in the eastern marsh: 78% of the otter trawl catch came from Denverton, Nurse, and eastern Montezuma sloughs, and 88% of the beach seine catch came from Denverton and eastern Montezuma sloughs (Figure 2). The high threadfin shad numbers in 2017 were consistent with the shad’s association with warm, fresh water (Meng and Matern 2001, Feyrer et al. 2007, Feyrer et al. 2009).
24
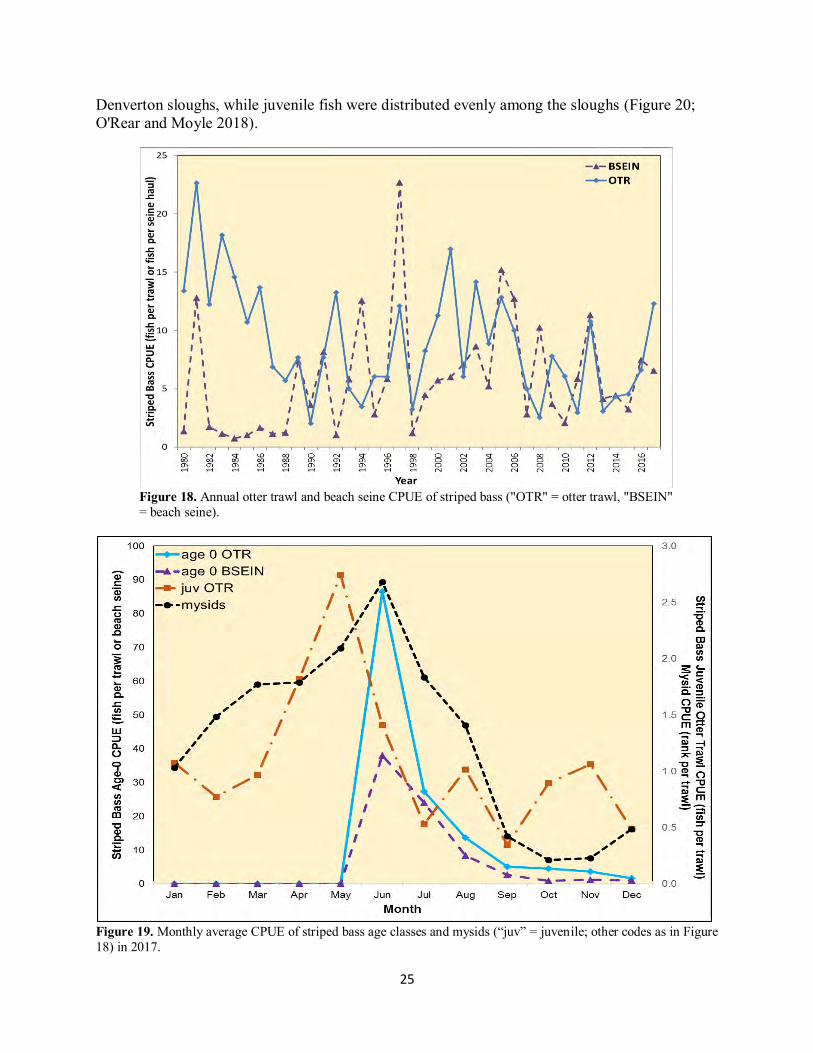
Figure 17. Annual otter trawl CPUE of the shads of the Pelagic Organism Decline (“TFS = threadfin shad and “ASH” = American shad). AMERICAN SHAD Like threadfin shad, American shad were very abundant in Suisun Marsh in 2017, posting their second-highest otter trawl abundance (Figure 17) and their highest-ever beach seine abundance in the study's history (Table 2). Annual otter trawl CPUE in 2017 was far above both the all-years average (0.65 and 0.16 fish per trawl, respectively) and higher than the 2016 value (0.58 fish per trawl). American shad were much more abundant in seines in the eastern marsh, with 92% of the beach seine catch coming from Denverton and eastern Montezuma sloughs. Distribution in otter trawls differed from beach seines, with sites in Nurse and First Mallard sloughs comprising one-third and one-quarter of the otter trawl catch, respectively. All but one fish were of the 2017 cohort. STRIPED BASS Striped bass were more abundant than usual in 2017, with annual otter trawl CPUE in 2017 higher than both the all-years average and the 2016 CPUE (Table 1, Figure 18). Beach seine CPUE in 2017 was about a fish lower than in 2016 but was still higher than the all-years average (Table 2, Figure 18). Monthly CPUEs for age-0 fish in beach seines and otter trawls followed similar patterns, with virtually no fish caught in May followed by the peak monthly CPUEs in June, after which CPUE in both net types declined concomitant with falling mysid numbers (Figure 19). The trend in juvenile monthly otter trawl CPUE was, similar to previous years, more variable than age-0 CPUE but exhibited an overall decline through the year. Also repeating patterns observed in 2016, age-0 striped bass were more abundant in First Mallard and
25
Denverton sloughs, while juvenile fish were distributed evenly among the sloughs (Figure 20; O'Rear and Moyle 2018).
Figure 18. Annual otter trawl and beach seine CPUE of striped bass ("OTR" = otter trawl, "BSEIN" = beach seine).
Figure 19. Monthly average CPUE of striped bass age classes and mysids (“juv” = juvenile; other codes as in Figure 18) in 2017.
26
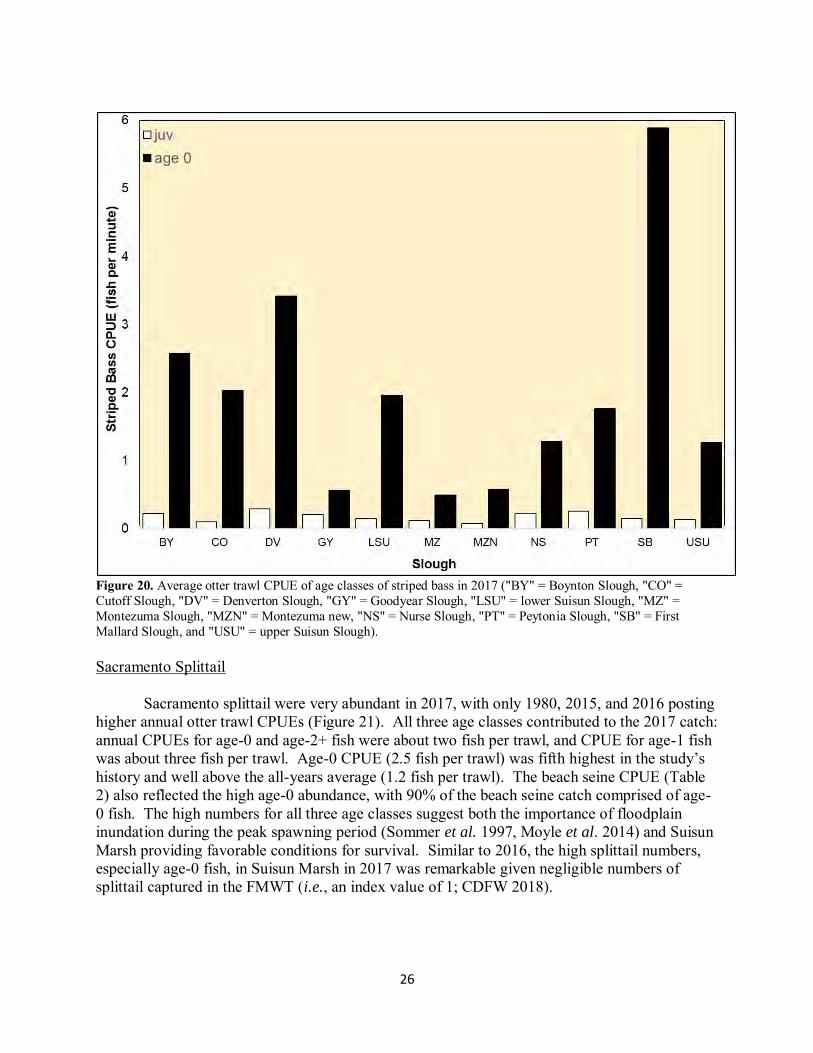
Figure 20. Average otter trawl CPUE of age classes of striped bass in 2017 ("BY" = Boynton Slough, "CO" = Cutoff Slough, "DV" = Denverton Slough, "GY" = Goodyear Slough, "LSU" = lower Suisun Slough, "MZ" = Montezuma Slough, "MZN" = Montezuma new, "NS" = Nurse Slough, "PT" = Peytonia Slough, "SB" = First Mallard Slough, and "USU" = upper Suisun Slough). Sacramento Splittail
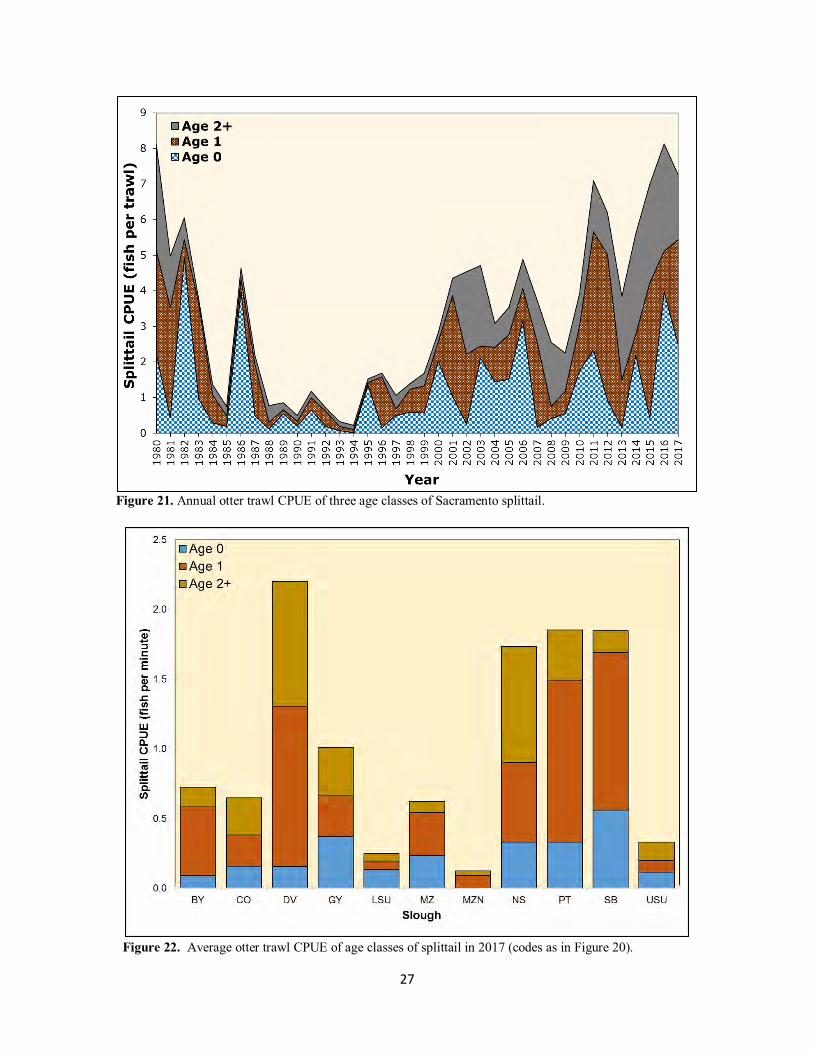
Sacramento splittail were very abundant in 2017, with only 1980, 2015, and 2016 posting higher annual otter trawl CPUEs (Figure 21). All three age classes contributed to the 2017 catch: annual CPUEs for age-0 and age-2+ fish were about two fish per trawl, and CPUE for age-1 fish was about three fish per trawl. Age-0 CPUE (2.5 fish per trawl) was fifth highest in the study’s history and well above the all-years average (1.2 fish per trawl). The beach seine CPUE (Table 2) also reflected the high age-0 abundance, with 90% of the beach seine catch comprised of age-0 fish. The high numbers for all three age classes suggest both the importance of floodplain inundation during the peak spawning period (Sommer et al. 1997, Moyle et al. 2014) and Suisun Marsh providing favorable conditions for survival. Similar to 2016, the high splittail numbers, especially age-0 fish, in Suisun Marsh in 2017 was remarkable given negligible numbers of splittail captured in the FMWT (i.e., an index value of 1; CDFW 2018).
27
Figure 21. Annual otter trawl CPUE of three age classes of Sacramento splittail.
Figure 22. Average otter trawl CPUE of age classes of splittail in 2017 (codes as in Figure 20).
28
Similar to 2016, splittail were most abundant in the smaller sloughs of Denverton, First
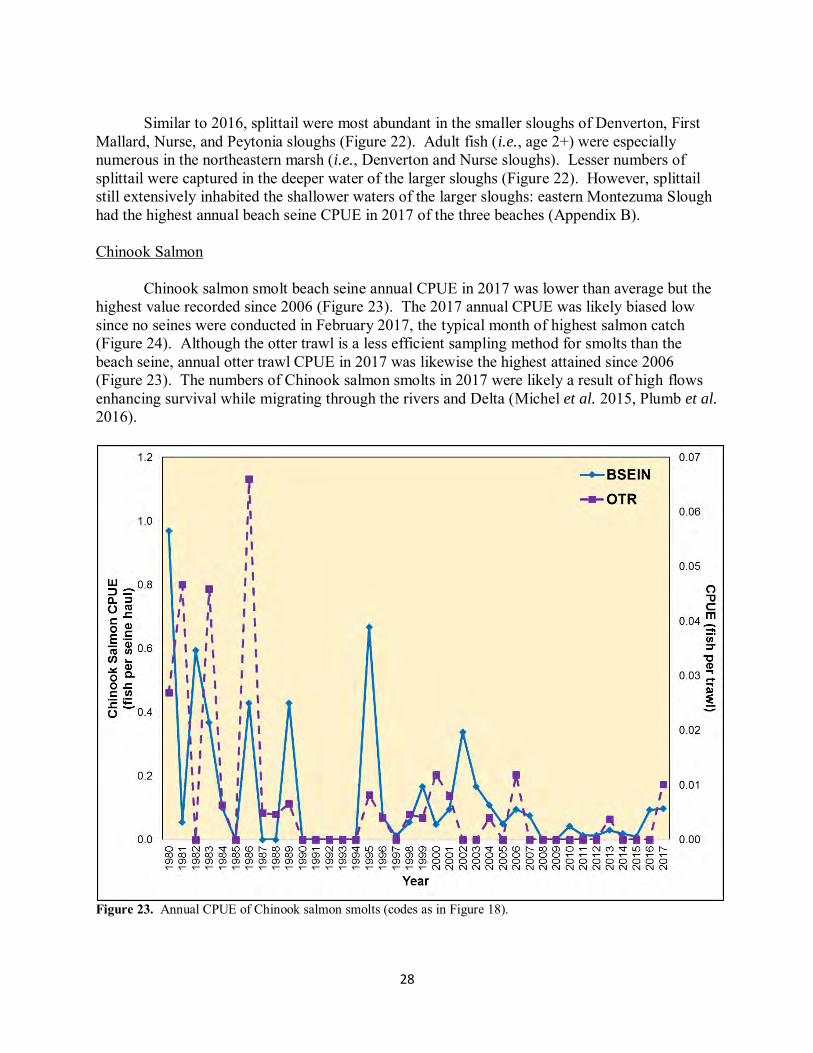
Mallard, Nurse, and Peytonia sloughs (Figure 22). Adult fish (i.e., age 2+) were especially numerous in the northeastern marsh (i.e., Denverton and Nurse sloughs). Lesser numbers of splittail were captured in the deeper water of the larger sloughs (Figure 22). However, splittail still extensively inhabited the shallower waters of the larger sloughs: eastern Montezuma Slough had the highest annual beach seine CPUE in 2017 of the three beaches (Appendix B). Chinook Salmon Chinook salmon smolt beach seine annual CPUE in 2017 was lower than average but the highest value recorded since 2006 (Figure 23). The 2017 annual CPUE was likely biased low since no seines were conducted in February 2017, the typical month of highest salmon catch (Figure 24). Although the otter trawl is a less efficient sampling method for smolts than the beach seine, annual otter trawl CPUE in 2017 was likewise the highest attained since 2006 (Figure 23). The numbers of Chinook salmon smolts in 2017 were likely a result of high flows enhancing survival while migrating through the rivers and Delta (Michel et al. 2015, Plumb et al.
2016).
Figure 23. Annual CPUE of Chinook salmon smolts (codes as in Figure 18).
29
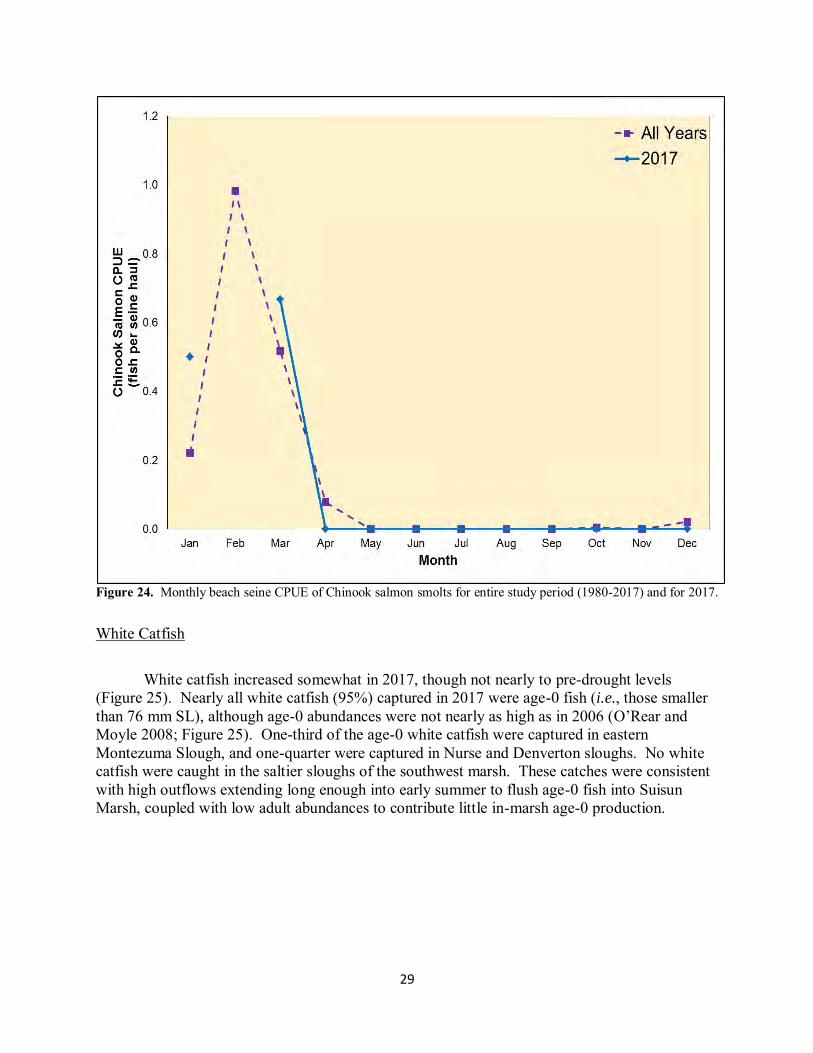
Figure 24. Monthly beach seine CPUE of Chinook salmon smolts for entire study period (1980-2017) and for 2017.
White Catfish White catfish increased somewhat in 2017, though not nearly to pre-drought levels (Figure 25). Nearly all white catfish (95%) captured in 2017 were age-0 fish (i.e., those smaller than 76 mm SL), although age-0 abundances were not nearly as high as in 2006 (O’Rear and Moyle 2008; Figure 25). One-third of the age-0 white catfish were captured in eastern Montezuma Slough, and one-quarter were captured in Nurse and Denverton sloughs. No white catfish were caught in the saltier sloughs of the southwest marsh. These catches were consistent with high outflows extending long enough into early summer to flush age-0 fish into Suisun Marsh, coupled with low adult abundances to contribute little in-marsh age-0 production.
30
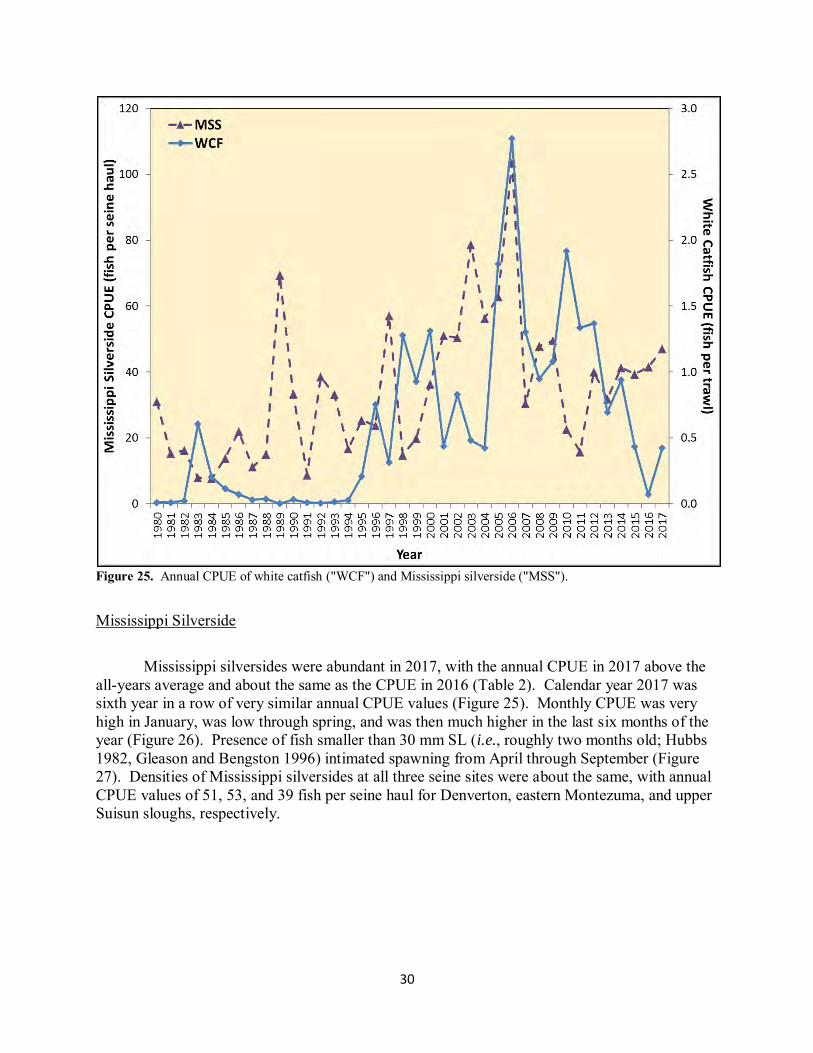
Figure 25. Annual CPUE of white catfish ("WCF") and Mississippi silverside ("MSS").
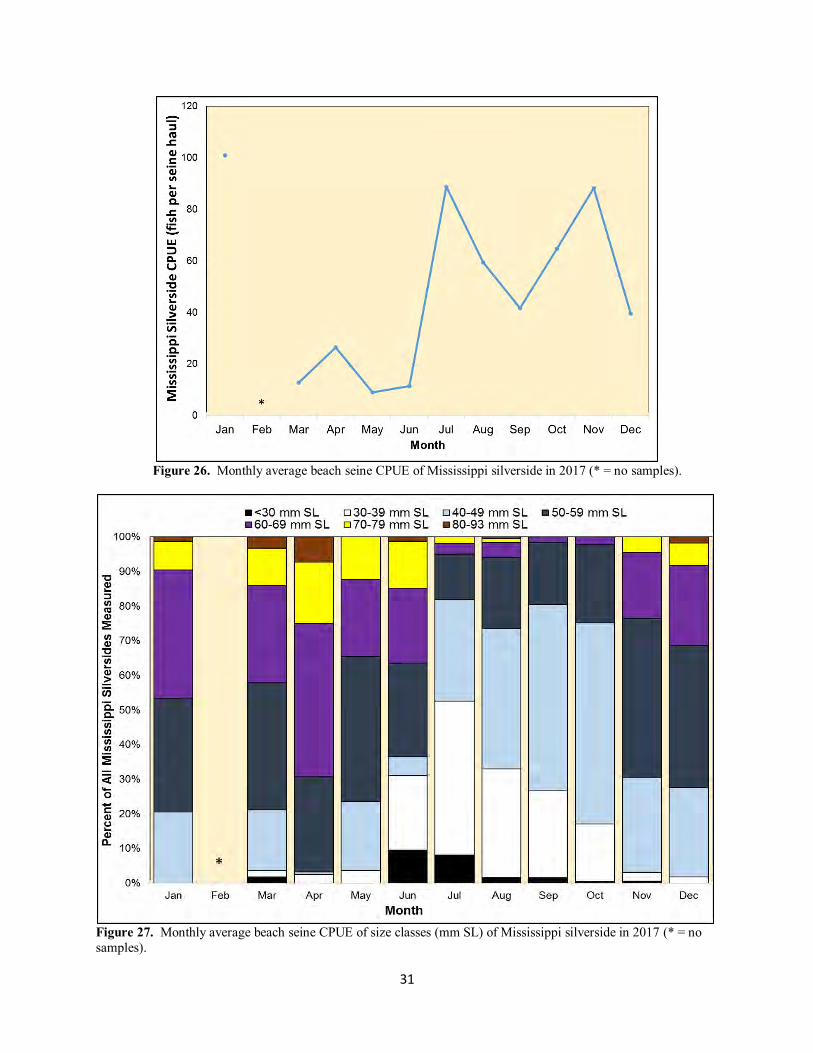
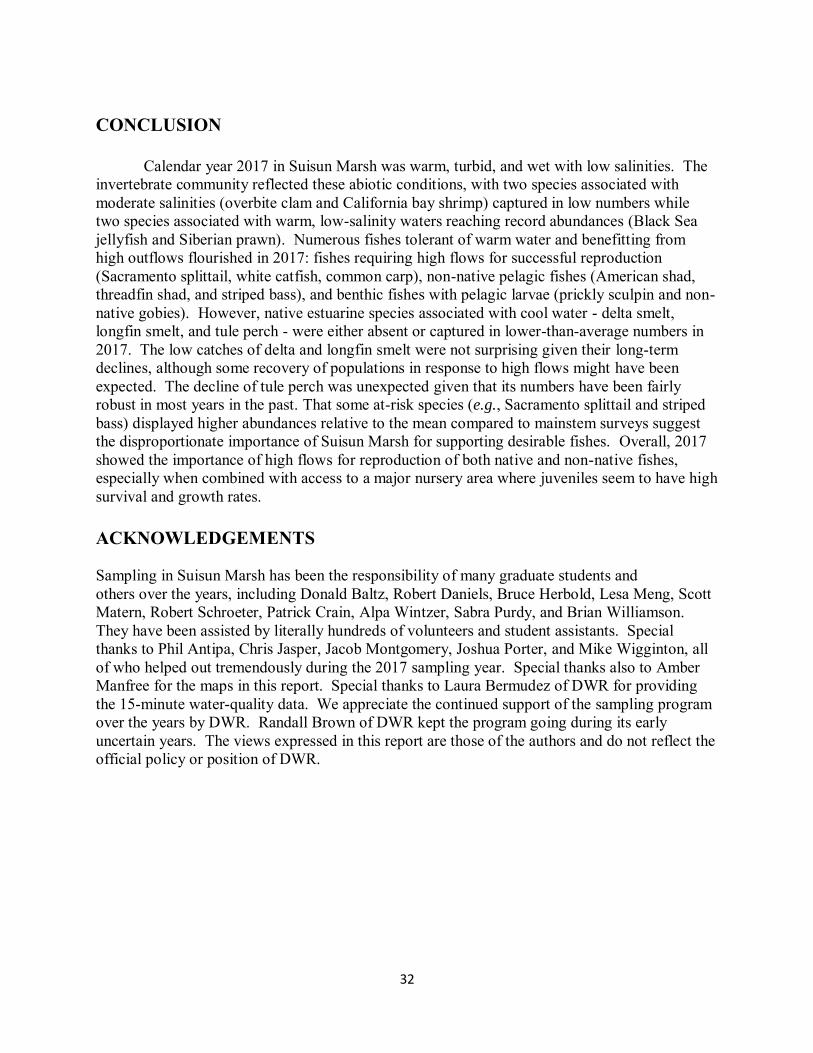
Mississippi Silverside Mississippi silversides were abundant in 2017, with the annual CPUE in 2017 above the all-years average and about the same as the CPUE in 2016 (Table 2). Calendar year 2017 was sixth year in a row of very similar annual CPUE values (Figure 25). Monthly CPUE was very high in January, was low through spring, and was then much higher in the last six months of the year (Figure 26). Presence of fish smaller than 30 mm SL (i.e., roughly two months old; Hubbs 1982, Gleason and Bengston 1996) intimated spawning from April through September (Figure 27). Densities of Mississippi silversides at all three seine sites were about the same, with annual CPUE values of 51, 53, and 39 fish per seine haul for Denverton, eastern Montezuma, and upper Suisun sloughs, respectively.
31
Figure 26. Monthly average beach seine CPUE of Mississippi silverside in 2017 (* = no samples).
Figure 27. Monthly average beach seine CPUE of size classes (mm SL) of Mississippi silverside in 2017 (* = no samples).
32
CONCLUSION Calendar year 2017 in Suisun Marsh was warm, turbid, and wet with low salinities. The invertebrate community reflected these abiotic conditions, with two species associated with moderate salinities (overbite clam and California bay shrimp) captured in low numbers while two species associated with warm, low-salinity waters reaching record abundances (Black Sea jellyfish and Siberian prawn). Numerous fishes tolerant of warm water and benefitting from high outflows flourished in 2017: fishes requiring high flows for successful reproduction (Sacramento splittail, white catfish, common carp), non-native pelagic fishes (American shad, threadfin shad, and striped bass), and benthic fishes with pelagic larvae (prickly sculpin and non-native gobies). However, native estuarine species associated with cool water - delta smelt, longfin smelt, and tule perch - were either absent or captured in lower-than-average numbers in 2017. The low catches of delta and longfin smelt were not surprising given their long-term declines, although some recovery of populations in response to high flows might have been expected. The decline of tule perch was unexpected given that its numbers have been fairly robust in most years in the past. That some at-risk species (e.g., Sacramento splittail and striped bass) displayed higher abundances relative to the mean compared to mainstem surveys suggest the disproportionate importance of Suisun Marsh for supporting desirable fishes. Overall, 2017 showed the importance of high flows for reproduction of both native and non-native fishes, especially when combined with access to a major nursery area where juveniles seem to have high survival and growth rates. ACKNOWLEDGEMENTS Sampling in Suisun Marsh has been the responsibility of many graduate students and others over the years, including Donald Baltz, Robert Daniels, Bruce Herbold, Lesa Meng, Scott Matern, Robert Schroeter, Patrick Crain, Alpa Wintzer, Sabra Purdy, and Brian Williamson. They have been assisted by literally hundreds of volunteers and student assistants. Special thanks to Phil Antipa, Chris Jasper, Jacob Montgomery, Joshua Porter, and Mike Wigginton, all of who helped out tremendously during the 2017 sampling year. Special thanks also to Amber Manfree for the maps in this report. Special thanks to Laura Bermudez of DWR for providing the 15-minute water-quality data. We appreciate the continued support of the sampling program over the years by DWR. Randall Brown of DWR kept the program going during its early uncertain years. The views expressed in this report are those of the authors and do not reflect the official policy or position of DWR.
33
REFERENCES Baumsteiger, J., T. A. O’Rear, J. D. Cook, A. D. Manfree, and P. B. Moyle. 2018. Factors
affecting distribution and abundance of jellyfish medusae in a temperate estuary: a multi-decadal study. Biological Invasions 20:105-119.
Baumsteiger, J., R. Schroeter, T. O'Rear, J. Cook, and P. Moyle. 2017. Long-term surveys show invasive overbite clams (Potamocorbula amurensis) are spatially limited in Suisun Marsh, California. San Francisco Estuary and Watershed Science 15(2).
Brown, T,., and K. A. Hieb. 2014. Status of the Siberian prawn, Exopalaemon modestus, in the San Francisco Estuary. San Francisco Estuary and Watershed Science 12(1).
CDFW. 2018. Trends in abundance of selected species. Available: http://www.dfg.ca.gov/delta/data/fmwt/Indices/index.asp (March 2018).
Cloern, J. E., A. D. Jassby, T. S. Schraga, E. Nejad, and C. Martin. 2017. Ecosystem variability along the estuarine salinity gradient: examples from long-term study of San Francisco Bay. Limnology and Oceanography 62: 272-291.
DWR. 2018. Interagency ecological program. Available: www.iep.water.ca.gov (March 2018). DWR. 2001. Comprehensive Review Suisun Marsh Monitoring Data 1985-1995. California,
California Department of Water Resources. DWR. 1984. Plan of Protection for the Suisun Marsh. California, California Department of
Water Resources. Feyrer, F., J. E. Cloern, L. R. Brown, M. A. Fish, K. A. Hieb, and R. Baxter. 2015. Estuarine
fish communities respond to climate variability over both river and ocean basins. Global Change Biology 21: 3608-3619.
Feyrer, F., B. Herbold, S. A. Matern, and P. B. Moyle. 2003. Dietary shifts in a stressed fish assemblage: consequences of a bivalve invasion in the San Francisco Estuary. Environmental Biology of Fishes 67: 277-288.
Feyrer, F., M. L. Nobriga, and T. R. Sommer. 2007. Multi-decadal trends for three declining fish species: habitat patterns and mechanisms in the San Francisco Estuary, California, USA. Canadian Journal of Fisheries and Aquatic Sciences 64:723-734.
Feyrer, F., T. Sommer, and B. Harrell. 2006. Managing floodplain inundation for native fish: production dynamics of age-0 splittail (Pogonichthys macrolepidotus) in California’s Yolo Bypass. Hydrobiologia 573: 213-226.
Feyrer, F. T. Sommer, and S. B. Slater. 2009. Old school vs. new school: status of threadfin shad (Dorosoma petenense) five decades after its introduction to the Sacramento-San Joaquin Delta. San Francisco Estuary and Watershed Science 7(1).
Gleason, T. R., and D. A. Bengston. 1996. Size-selective mortality in inland silversides: evidence from otolith microstructure. Transactions of the American Fisheries Society 125: 860-873.
Hendricks, L. J. 1961. The threadfin shad, Dorosoma petenense (Gunther); the striped mullet, Mugil cephalus Linneaus. Pages 95-103 in B. D. Walker, ed. The ecology of the Salton Sea, California, in relation to the sport fishery. California Fish and Game Fish Bulletin 113.
HPRCC. 2018. ACIS climate maps. Available: https://hprcc.unl.edu/maps.php?map=ACISClimateMaps (March 2018).
Hubbs, C. 1982. Life history dynamics of Menidia beryllina from Lake Texoma. American Midland Naturalist 107(1): 1-12.
34
Lam, T. J., and R. Sharma. 1985. Effects of salinity and thyroxine on larval survival, growth, and development in the carp, Cyprinus carpio. Aquaculture 44: 201-212.
Liu, J., A. Tatarenkov, T. A. O'Rear, P. B. Moyle, and J. C. Avise. 2013. Multiple paternity in broods of pregnant tule perch Hysterocarpus traski suggests that mate encounter rate is an important factor affecting female multiple mating. Journal of Heredity 104: 217-222.
Manfree, A. D. 2018. Suisun Marsh Fish Study sampling sites 2017 [map]. (ca. 1:88990). Davis, CA.
Matern, S. A., P. B. Moyle, and L. C. Pierce. 2002. Native and alien fishes in a California estuarine marsh: twenty-one years of changing assemblages. Transactions of the American Fisheries Society 131: 797-816.
Meek, M., A. Wintzer, N. Sheperd, and B. May. 2012. Genetic diversity and reproductive mode in two non-native hydromedusae, Maeotias marginata and Moerisia sp., in the Upper San Francisco Estuary, California. Biological Invasions. 15(1): 199-212.
Meng, L., and S. A. Matern. 2001. Native and alien larval fishes of Suisun Marsh, California: the effects of freshwater flow. Transactions of the American Fisheries Society 130: 750-765.
Meng, L., P. B. Moyle, and B. Herbold. 1994. Changes in abundance and distribution of native and alien fishes of Suisun Marsh. Transactions of the American Fisheries Society 123: 498-507.
Michel, C. J., A. J. Ammann, S. T. Lindley, P. T. Sandstrom, E. D. Chapman, M. J. Thomas, G. P. Singer, A. P. Klimley, and R. B. MacFarlane. 2015. Chinook salmon outmigration survival in wet and dry years in California's Sacramento River. Canadian Journal of Fisheries and Aquatic Sciences 72: 1749-1759.
Morgan-King, T., and D. H. Schoelhamer. 2013. Suspended-sediment flux and retention in a backwater tidal slough complex near the landward boundary of an estuary. Estuaries and Coasts 36: 300-318.
Moyle, P. B. 2002. Inland fishes of California. California, University of California Press. Moyle, P. B., R. D. Baxter, T. Sommer, T. C. Foin, and S. A. Matern. 2004. Biology and
population dynamics of Sacramento splittail (Pogonichthys macrolepidotus) in the San Francisco Estuary: a review. San Francisco Estuary and Watershed Science 2(2): Article 3.
Moyle, P. B., R. A. Daniels, B. Herbold, and D. M. Baltz. 1986. Patterns in distribution and abundance of a noncoevolved assemblage of estuarine fishes in California. U. S. National Marine Fisheries Service Fishery Bulletin 84(1): 105-117.
Moyle, P. B., A. D. Manfree, and P. L. Fielder. 2014. Suisun Marsh: ecological history and possible futures. United States, University of California Press.
Nicolini, M. H., and D. L. Penry. 2000. Spawning, fertilization, and larval development of Potamocorbula amurensis (Mollusca: Bivalvia) from San Francisco Bay, California. Pacific Science 54: 377-388.
Nobriga, M. L., and F. V. Feyrer. 2008. Diet composition in San Francisco Estuary striped bass: does trophic adaptability have its limits? Environmental Biology of Fishes 83: 495-503.
Nobriga, M. L., and J. A. Rosenfield. 2016. Population dynamics of an estuarine forage fish: disaggregating forces driving long-term decline of longfin smelt in California’s San Francisco Estuary. Transactions of the American Fisheries Society 145: 44-58.
35
O'Rear, T. A., and P. B. Moyle. 2018. Suisun Marsh Fish Study: trends in fish and invertebrate populations of Suisun Marsh January 2016 - December 2016. California, California Department of Water Resources.
O'Rear, T. A., and P. B. Moyle. 2016. Suisun Marsh Fish Study: trends in fish and invertebrate populations of Suisun Marsh January 2014 - December 2014. California, California Department of Water Resources.
O'Rear, T. A., and P. B. Moyle. 2015. Suisun Marsh Fish Study: trends in fish and invertebrate populations of Suisun Marsh January 2013 - December 2013. California, California Department of Water Resources.
O'Rear, T. A., and P. B. Moyle. 2014a. Suisun Marsh Fish Study: trends in fish and invertebrate populations of Suisun Marsh January 2012 - December 2012. California, California Department of Water Resources.
O'Rear, T. A., and P. B. Moyle. 2014b. Suisun Marsh Fish Study: trends in fish and invertebrate populations of Suisun Marsh January 2011 - December 2011. California, California Department of Water Resources.
Perry, W. G., and J. W. Avault, Jr. 1969. Culture of blue, channel and white catfish in brackish water ponds. Proceedings of the Annual Conference Southeastern Association of Game and Fish Commissioners 23: 592-605.
Plumb, J. M., N. S. Adams, R. W. Perry, C. M. Holbrook, J. G. Romine, A. R. Blake, and J. R. Burau. 2016. Diel activity patterns of juvenile late fall-run Chinook salmon with implications for operation of a gated water diversion in the Sacramento-San Joaquin River Delta. River Research and Applications 32: 711-720.
Rosenfield, J. A., and R. D. Baxter. 2007. Population dynamics and distribution patterns of longfin smelt in the San Francisco Estuary. Transactions of the American Fisheries Society 136: 1577-1592.
Schroeter, R. E., T. A. O'Rear, M. J. Young, and P. B. Moyle. 2015. The aquatic trophic ecology of Suisun Marsh, San Francisco Estuary, California, during autumn in a wet year. San Francisco Estuary and Watershed Science 13(3).
Schroeter, R., A. Stover, and P. B. Moyle. 2006. Trends in Fish Populations of Suisun Marsh January 2005 - December 2005. California, California Department of Water Resources.
Siegel, S., P. Bachand, D. Gillenwater, S. Chappel, B. Wickland, O. Rocha, M. Stephenson, W. Heim, C. Enright, P. Moyle, P. Crain, B. Downing, and B. Bergamaschi. 2011. Final evaluation memorandum, strategies for reducing low dissolved oxygen and methylmercury events in northern Suisun Marsh. Prepared for the State Water Resources Control Board, Sacramento, California. SWRCB Project Number 06-283-552-0.
Sommer, T., R. Baxter, and B. Herbold. 1997. Resilience of splittail in the Sacramento-San Joaquin Estuary. Transactions of the American Fisheries Society 126: 961-976.
Vincik, R. F. 2002. Adult Chinook salmon migration monitoring at the Suisun Marsh Salinity Control Gates, Sept. - Nov. 2001. Interagency Ecological Program Newsletter 15(2): 45-48.
Wang, J. C. S. 1986. Fishes of the Sacramento-San Joaquin Estuary and adjacent waters, California: a guide to early life histories. Interagency Ecological Program Technical Report No. 9.
Williamson, B. O., T. A. O'Rear, D. De Carion, J. Durand, and P. Moyle. 2015. Fishes of the Nurse-Denverton complex: managed wetlands and tidal waterways in Suisun Marsh. Interagency Ecological Program Newsletter 28(3):29-35.
36
Wintzer, A.P., M. H. Meek, and P. B. Moyle. 2011a. Life history and population dynamics of Moerisia sp., a non-native hydrozoan, in the upper San Francisco Estuary (U.S.A.). Estuarine and Coastal Shelf Science 94: 48-55. Wintzer, A.P., M.H. Meek, and P. B. Moyle. 2011b. Trophic ecology of two non-native
hydrozoan medusae in the upper San Francisco Estuary. Marine and Freshwater Research 62: 952–961.
Wintzer, A., M. Meek, P. Moyle, and B. May. 2011c. Ecological insights into the polyp stage of non-native hydrozoans in the San Francisco Estuary. Aquatic Ecology 5(2): 151-161.