trends in employee recognition
TRANSCRIPT

A Report by WorldatWork and Underwritten by ITA Group June 2013
Trends in Employee Recognition
rese
arch

©2013 WorldatWork Any laws, regulations or other legal requirements noted in this publication are, to the best of the publisher’s knowledge, accurate and current
as of this report’s publishing date. WorldatWork is providing this information with the understanding that WorldatWork is not engaged, directly or by implication, in
rendering legal, accounting or other related professional services. You are urged to consult with an attorney, accountant or other qualified professional concerning
your own specific situation and any questions that you may have related to that.
No portion of this publication may be reproduced in any form without express written permission from WorldatWork.
Contact:
WorldatWork Customer Relations
14040 N. Northsight Blvd.
Scottsdale, Arizona USA
85260-3601
Toll free: 877-951-9191
Fax: 480-483-8352
ITA Group creates and manages events, incentives and recognition programs that align and motivate your people. In 2013, ITA Group celebrates 50 years of driving passion and performance in organizations.
ITA Group is located in West Des Moines, Iowa, and also has operations in Atlanta, Boca Raton, Chicago, Dallas, Des Moines, Detroit, Indianapolis, Los Angeles, Minneapolis, Philadelphia, San Francisco and the greater New York City area.
Visit us at www.itagroup.com to learn more.

WorldatWork Trends in Employee Recognition 2013
1
Introduction & Methodology This report summarizes the results of a February 2013 survey of WorldatWork members to gather information about trends in recognition programs. Specifically, the research is designed to measure specific types of recognition programs and the impact on the workforce. On Feb. 20, 2013, survey invitations were sent electronically to 5,520 WorldatWork members. Members selected for participation were: Randomly selected members who had designated responsibilities at the executive, top
or senior level. Members that specified total rewards as their specific function area.
The survey was open to all members meeting specific criteria, domestic, Canadian and foreign. The survey closed on March 14, 2013, with 499 responses, a 9% response rate. The data set was cleaned, resulting in a final data set of 471 responses. In order to provide the most accurate data possible, data was cleaned and analyzed using statistical software. Any duplicate records were removed. Data comparisons with any relevant, statistically significant differences are noted in this report. The demographics of the survey sample and the respondents are similar to the WorldatWork membership as a whole. The typical WorldatWork member works at the managerial level or higher in the headquarters of a large company in North America. The frequencies or response distributions listed in the report show the number of times or percentage of times a value appears in a data set. Due to rounding, frequencies of data responses provided in this survey may not total exactly 100%.

WorldatWork Trends in Employee Recognition 2013
2
Table of Figures Results and Analysis .................................................................................................................................................................... 6 Figure 1: Prevalence of Recognition ............................................................................................................................................ 6 Figure 2: Elimination of Recognition Programs in the Past 12 Months ......................................................................................... 6 Figure 3: New Recognition Programs ........................................................................................................................................... 6 Figure 4: Prevalence of Recognition Programs Timeline ............................................................................................................. 7 Figure 5: Number of Recognition Programs Offered ................................................................................................................... 7 Figure 6: Recognition Programs Prevalence and Percent Recognized ........................................................................................ 8 Figure 6a: Recognition Programs Top 5 Timeline ........................................................................................................................ 8 Figure 7: Recognition Program Trends ....................................................................................................................................... 9 Figure 7a: Recognition Program Changes ................................................................................................................................ 10 Figure 8: Change in Recognition ................................................................................................................................................ 10 Figure 9: Companywide vs. Department-Specific Recognition ................................................................................................... 11 Figure 10: Formality of Recognition............................................................................................................................................ 11 Figure 11: International/Global Employees ................................................................................................................................ 12 Figure 12: Recognition for International/Global Employees ....................................................................................................... 12 Figure 13: Recognition Strategy ................................................................................................................................................. 12 Figure 14: Recognition and Organizational Strategy .................................................................................................................. 13 Figure 15: Recognition Objectives ............................................................................................................................................. 13 Figure 16: Success of Recognition Program .............................................................................................................................. 14 Figure 17: Measuring Success of Recognition ........................................................................................................................... 14 Figure 18: Department Administration of Recognition Programs ............................................................................................... 15 Figure 19: Position Administration of Recognition Programs ..................................................................................................... 15 Figure 20: Budgeting for Recognition Programs ........................................................................................................................ 16 Figure 21: Percentage of Payroll Budget for Recognition Programs .......................................................................................... 16 Figure 22: Budget for Recognition Programs (Centralized or Departmental) ............................................................................. 17 Figure 23: Media Communication of Recognition Programs ...................................................................................................... 17 Figure 24: Training for Managers About Recognition Programs ................................................................................................ 18 Figure 25: Training Methods Used for Managers About Recognition Programs ........................................................................ 18 Figure 26: Senior-Management Support for Recognition Programs ........................................................................................... 19 Figure 27: Senior-Management View of Employee Recognition Programs ................................................................................ 19 Figure 28: Presentation of Recognition Awards ......................................................................................................................... 20 Figure 29: Types of Recognition Awards (Items) ....................................................................................................................... 21 Figure 30: Electronic Communication of Recognition Awards .................................................................................................... 22 Figure 31: Perceived Workforce Effect of Recognition Awards .................................................................................................. 22 Figure 32: Attraction and Recognition Awards ........................................................................................................................... 23 Recognition Programs by Organization Size and Type .............................................................................................................. 23 Figure 33: Recognition Programs by Organization Size ............................................................................................................. 23 Figure 34: Recognition Programs by Organization Type ............................................................................................................ 24 Recognition Programs and Total Rewards ................................................................................................................................. 25 Figure 35: Level of Support from Senior Management and Engagement................................................................................... 25 Figure 36: Level of Support from Senior Management and Satisfaction .................................................................................... 25 Figure 37: Level of Support from Senior Management and Motivation....................................................................................... 25 Figure 38: Offer Recognition Programs and Voluntary Turnover Rates ..................................................................................... 26 Figure 39: Recognition Program by Type and Voluntary Turnover Rates .................................................................................. 26 Demographics ............................................................................................................................................................................ 27 Figure D1: Number of Employees .............................................................................................................................................. 27 Figure D2: Organization Type .................................................................................................................................................... 27 Figure D3: Voluntary Turnover ................................................................................................................................................... 28 Figure D4: Industry ..................................................................................................................................................................... 28 Participating Organizations ........................................................................................................................................................ 29

WorldatWork Trends in Employee Recognition 2013
3
Executive Summary Recognition: A Total Rewards Staple Overall prevalence: In the past decade, WorldatWork has found that recognition programs continue to hold their place in the total rewards tool kit. 88% of organizations (86% in 2011) have recognition programs in place (Figure 1). This appears to be trending back up as the economy recovers. And while 70% offer between three and six different programs, the average number of programs offered has declined from 4.5 to 3.9 (Figure 5). Specific applications may change as the environment, economy and labor markets shift, but new data suggest that even with a recession and some visible blips in the data during the past few years, recognition programs remain an important variable in the total rewards equation. Prevalence of programs: Although more organizations are using recognition in 2013 than 2011, we may be seeing a shift in which recognition programs are being used more. Of the top five recognition programs in 2013, the top three remained the same: length of service, above-and-beyond performance and peer-to-peer. However, for the first time, programs to motivate specific behavior jumped to the fourth-most prevalent recognition program with a 7% increase over 2011 to 41% (a statistically significant difference since 2008). In addition, retirement recognition programs, which have been in the top five most prevalent programs since 2005, has dropped to No. 5 with an 8% decrease since 2011 to 34%. (See Figure 7a.) What we may be seeing are organizations moving away from legacy recognition programs and toward those programs that can drive results. What is also noteworthy is that sales performance recognition, which has also been in the top five most prevalent since 2003, dropped out of the top five with the biggest percentage decrease of 15% to 25% prevalence (a statistically significant difference). One potential reason for this significant decrease may be attributed to a divergence between sales goals and sales performance during 2012 when the economy was thought to be in recovery mode and in fact was not. It is also interesting to note that in both 2011 and 2013 surveys, when asked to write in other programs that are offered in organizations, participants wrote in wellness program awards. With the increase in wellness programs and the continuing increase in programs to motivate specific behavior, we speculate whether wellness programs and programs to motivate specific behavior awards are intermingled. Length of time in use: Retirement and length-of-service recognition programs have been in use for a long time — at least five years and probably many more for most. (See Figure 6.) But organizations continue to leverage newer programs that can have a more direct impact on business results such as above-and-beyond performance, peer-to-peer and programs to motivate specific behaviors. In fact, many of these programs in use today were first implemented within the past five years. Programs to motivate specific behaviors, in particular, continue to grow every year, having climbed in usage by 16 percentage points since first appearing in this survey in 2008. (See Figure 7.)
0%
20%
40%
60%
80%
100%
2002
2003
2005
2008
2011 2013
Percentage of Organizations with Recognition Programs

WorldatWork Trends in Employee Recognition 2013
4
Most Recognition Practices Have Not Changed Much Since 2008 Formality and strategy: Nearly 70% have both formal and informal recognition programs in place, but formal is still the most common approach, as 24% have formal programs only. (See Figure 10.) Regarding strategy, even though formal recognition programs have structure to them, 49% of respondents indicated there is not a written strategy behind their organization’s recognition program. (See Figure 13.) Furthermore 97% of those that have a strategy align recognition programs with their organizational strategies. Companywide versus department-specific recognition: Companywide recognition programs are widespread, offered by 9 in every 10 organizations. (See Figure 9.) Also common are department/unit-specific programs (61%), and nearly half offer both types of recognition: companywide and department-specific. Goals and award types: Within the top five objectives of recognition in 2013 (see box at right), we continue to see the same leaders from the past with the exception of the addition of reinforcing desired behaviors, which moved in as one of the top five goals, edging out increase morale by a few percentage points. Reinforcing desired results may go hand in hand with the significant increase in the programs to motivate specific behaviors that we saw earlier in the survey. The most common types of recognition awards (see box below) remain the same from 2011, with only slight changes to percentages this year. Also, 74% say the programs are meeting their objectives.
Amount budgeted: Organizations are budgeting an average of 2% of the payroll budget to be used for recognition programs (which is the same as 2011). The mode — or most common response — was 1%, the same as the median. See Figure 22 for a breakdown between budgets being centralized (39%) or in each department (17%). 44% split the budget between the two areas. Recognition delivery settings: When recognition is delivered, a one-on-one setting with the manager is most common at 71%, with special events and staff meetings also regular settings at more than half of organizations. (See Figure 28.)
Global recognition: 46% of participating organizations with employees outside of North America indicated that international/global employees participate in all or most of the same recognition programs as North American employees. 19% said that non-North American employees have their own programs. (See Figure 12.) Administration: Human resources is responsible for administering recognition programs at a little more than half of participating organizations (55%). The responsibility varies at remaining organizations. (See Figure 18.)

WorldatWork Trends in Employee Recognition 2013
5
Training for managers: Organizations typically are not training managers about their recognition programs. Only 12% of organizations provide some training on recognition to managers (Figure 24), and when they do, it is usually through online and in-person training sessions. (See Figure 25.) Senior management buy-in: Only a small percentage of respondents stated that senior management’s support for recognition is low or lacking in their organization. In 2013 we see yet another increase in high levels of support for recognition by senior management since 2008 when the economic crisis began. (See Figure 26.) Interestingly, nearly half of respondents believe senior management views recognition as an investment rather than an expense. (See Figure 27.) Recognition Perceived to have Primarily Positive Effects Effects on engagement and retention: Most respondents believe their workforces would say that the effect of recognition programs on employee engagement, motivation and satisfaction are positive or extremely positive, but they are less confident when it comes to the perceived impact on retention. Only 34% said they believe the programs have a positive impact on retention. (See Figure 31.) Additionally, correlations demonstrated a positive relationship between senior management support for recognition programs and the perceived effect on employee engagement, satisfaction and motivation. Recruiting leverage: Organizations do not typically feature recognition (62%) when trying to attract new employees. About half never do and about half do at least some of the time. 11% indicated that their organization features these programs regularly when recruiting. (See Figure 32).
WorldatWork Trends in Employee Recognition 2013
6
Results and Analysis
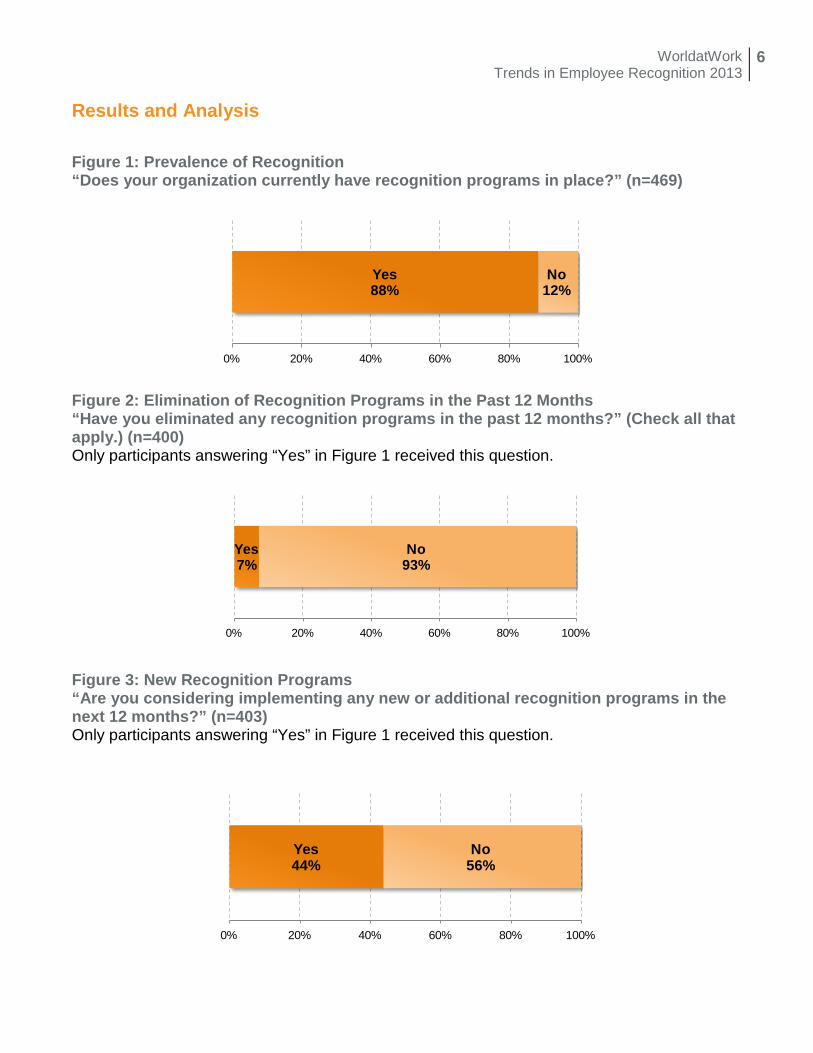
Figure 1: Prevalence of Recognition “Does your organization currently have recognition programs in place?” (n=469)
Yes88%
No12%
0% 20% 40% 60% 80% 100%
Figure 2: Elimination of Recognition Programs in the Past 12 Months “Have you eliminated any recognition programs in the past 12 months?” (Check all that apply.) (n=400) Only participants answering “Yes” in Figure 1 received this question.
Yes7%
No93%
0% 20% 40% 60% 80% 100%
Figure 3: New Recognition Programs “Are you considering implementing any new or additional recognition programs in the next 12 months?” (n=403) Only participants answering “Yes” in Figure 1 received this question.
Yes44%
No56%
0% 20% 40% 60% 80% 100%

WorldatWork Trends in Employee Recognition 2013
7
Figure 4: Prevalence of Recognition Programs Timeline
Figure 5: Number of Recognition Programs Offered (n=526)
Average number of programs offered: 3.9 Median number of programs offered: 4 Mode number of programs offered: 3
0%
20%
40%
60%
80%
100%
2002(n=391)
2003(n=413)
2005(n=614)
2008(n=552)
2011(n=549)
2013(n=469)
84% 87% 89% 89% 86% 88%
0%
5%
10%
15%
20%
25%
1 2 3 4 5 6 7 8 9 10 11
7%
15%
20% 20%17%
13%
4%2% 1% 0% 0%
Total Number of Programs Offered

WorldatWork Trends in Employee Recognition 2013
8
Figure 6: Recognition Programs Prevalence and Percent Recognized Only participants answering “Yes” in Figure 1 received this question.
Program Prevalence
Length of Time in Place Average Percent of Employees Recognized
(Past 12 months)
Less than 12 months
1 to 5 years
More than 5 years
Length of service (n=348) 84% 1% 11% 88% 19% Above-and-beyond performance (n=309) 75% 7% 36% 58% 20%
Peer-to-peer (n=172) 42% 13% 48% 39% 25% Programs to motivate specific behaviors (n=170) 41% 6% 42% 52% 20%
Retirement (n=142) 34% 4% 4% 92% 5% Sales performance (n=103) 25% 4% 26% 70% 21% Employee of the year, month, etc. (n=98) 24% 4% 24% 71% 6%
Suggestions/ideas (n=82) 20% 16% 37% 47% 7% Safety performance (n=80) 19% 1% 31% 68% 30% Major family event (e.g., birth, wedding, etc.) (n=73) 18% 2% 22% 76% 34%
Attendance (n=39) 9% 9% 14% 77% 23% Other 14% n/a n/a n/a n/a Other programs offered as noted by participants:
• Wellness program awards • Quality • Employee referral bonus • Cost savings.
Figure 6a: Recognition Programs Top 5 Timeline
2005 2008 2010 2013
Length of service Length of service Length of service Length of service Above-and-beyond performance
Above-and-beyond performance
Above-and-beyond performance
Above-and-beyond performance
Retirement Peer-to-peer Peer-to-peer Peer-to-peer
Sales performance Retirement Retirement Programs to motivate specific behaviors
Suggestions/ideas Sales performance Sales performance Retirement

WorldatWork Trends in Employee Recognition 2013
9
Figure 7: Recognition Program Trends
Option
2003 (n=413)
2005 (n=614)
2008 (n=552)
2011 (n=549)
2013 (n=414)
Length of service 87% 89% 86% 90% 84% Above-and-beyond performance 85% 87% 79% 79% 75% Peer-to-peer n/a n/a 42% 43% 42% Programs to motivate specific behaviors n/a n/a 25% 34% 41% Retirement n/a 51% 41% 42% 34% Sales performance 43% 51% 38% 40% 25% Employee of the year, month, etc. 29% 36% 32% 29% 24% Suggestions/ideas 36% 41% 24% 27% 20% Safety performance 28% 33% 25% 22% 19% Major family event (e.g., birth, wedding, etc.) n/a n/a 19% 25% 18% Attendance 20% 22% 16% 12% 9% Other n/a n/a n/a 27% 14%
n/a – Not an answer option in this year.
WorldatWork Trends in Employee Recognition 2013
10
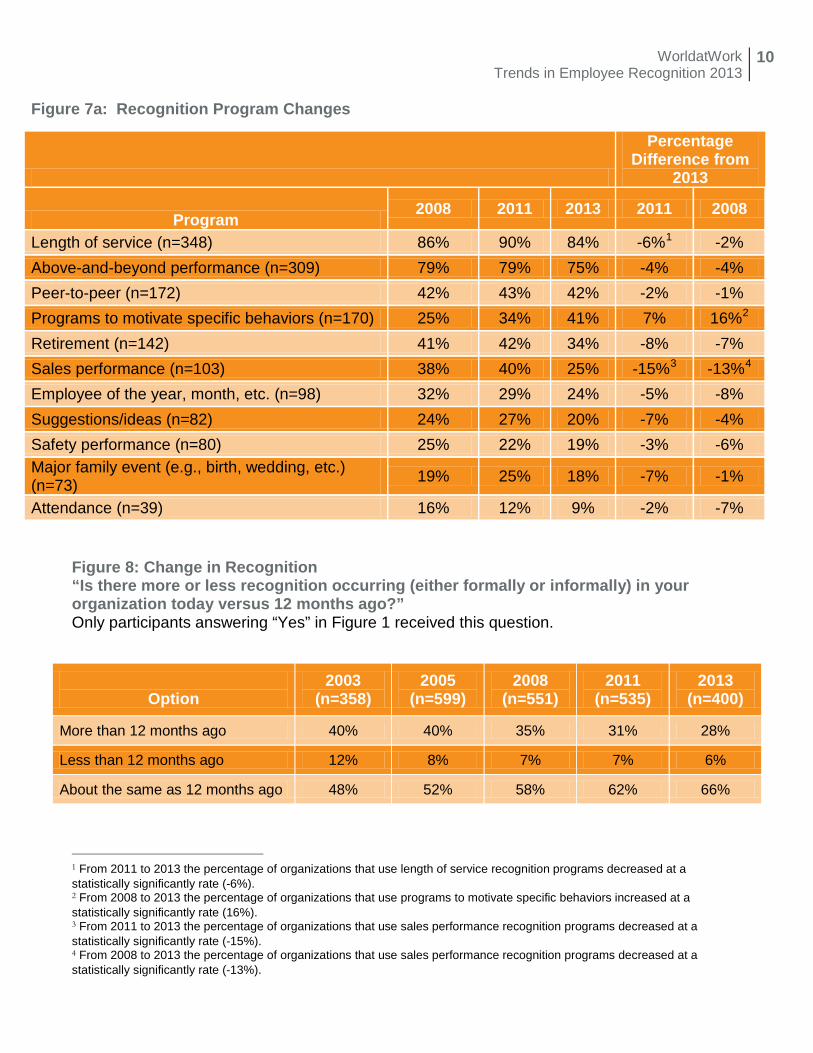
Figure 7a: Recognition Program Changes
Percentage Difference from
2013
Program 2008 2011 2013 2011 2008
Length of service (n=348) 86% 90% 84% -6%1 -2% Above-and-beyond performance (n=309) 79% 79% 75% -4% -4% Peer-to-peer (n=172) 42% 43% 42% -2% -1% Programs to motivate specific behaviors (n=170) 25% 34% 41% 7% 16%2
Retirement (n=142)
41% 42% 34% -8% -7% Sales performance (n=103) 38% 40% 25% -15%3 -13% 4
Employee of the year, month, etc. (n=98)
32% 29% 24% -5% -8% Suggestions/ideas (n=82) 24% 27% 20% -7% -4% Safety performance (n=80) 25% 22% 19% -3% -6% Major family event (e.g., birth, wedding, etc.) (n=73) 19% 25% 18% -7% -1%
Attendance (n=39) 16% 12% 9% -2% -7% Figure 8: Change in Recognition “Is there more or less recognition occurring (either formally or informally) in your organization today versus 12 months ago?” Only participants answering “Yes” in Figure 1 received this question.
Option 2003
(n=358) 2005
(n=599) 2008
(n=551) 2011
(n=535) 2013
(n=400)
More than 12 months ago 40% 40% 35% 31% 28%
Less than 12 months ago 12% 8% 7% 7% 6%
About the same as 12 months ago 48% 52% 58% 62% 66%
1 From 2011 to 2013 the percentage of organizations that use length of service recognition programs decreased at a statistically significantly rate (-6%). 2 From 2008 to 2013 the percentage of organizations that use programs to motivate specific behaviors increased at a statistically significantly rate (16%). 3 From 2011 to 2013 the percentage of organizations that use sales performance recognition programs decreased at a statistically significantly rate (-15%). 4 From 2008 to 2013 the percentage of organizations that use sales performance recognition programs decreased at a statistically significantly rate (-13%).

WorldatWork Trends in Employee Recognition 2013
11
Figure 9: Companywide vs. Department-Specific Recognition “What type(s) of recognition programs are in place in your company?” (Check all that apply.) Only participants answering “Yes” in Figure 1 received this question.
Option
20035 2005 (n=358)
6 2008 (n=501)
(n=537)
2011 (n=529)
2013 (n=398)
Companywide 92% 90% 91% 88% 90% Department/division/unit/region/team-specific 54% 59% 54% 66% 61%
Other7 3% 3% 4% 8% 10% Nearly half (46%) of organizations offer companywide and department-specific recognition. Figure 10: Formality of Recognition “What style(s) of recognition programs are in place at your company?” Only participants answering “Yes” in Figure 1 received this question.
Option
2002 (n=327)
2003 (n=358)
2005 (n=535)
2008 (n=505)
2011 (n=530)
2013 (n=399)
Formal — a structured or planned recognition program (e.g., attendance, performance, safety, years of service, etc.)
17% 16% 19% 21% 23% 24%
Informal — a spontaneous gesture of appreciation 10% 9% 9% 9% 6% 7%
Both 70% 72% 71% 69% 72% 69%
Other 3% 3% 1% 0% n/a n/a
5 The 2003 survey required respondents to select one option: “companywide” “department/unit-specific,” “both” or “other.” The question was changed in 2008 to allow respondents to select all options that apply, without a “both” option. In order to provide a fair comparison to 2008 and 2011 findings, the percentage of respondents who selected “both” were added to “companywide” and “department/unit-specific” options. 6 The 2005 survey required respondents to select one option: “companywide,” “department/unit-specific,” “both” or “other.” The question was changed in 2008 to allow respondents to select all responses that apply, without a “both” option. In order to provide a fair comparison to 2008 and 2011 findings, the percentage of respondents who selected “both” were added to “companywide” and “department/unit-specific” options. 7 The change in question format in 2008 to allow respondents to select all options that apply could account, at least in part, for the increase in “other” responses in 2008 and 2011.

WorldatWork Trends in Employee Recognition 2013
12
Figure 11: International/Global Employees “Does your organization have employees outside of North America?” (n=380) Only participants answering “Yes” in Figure 1 received this question.
Yes43%
No57%
0% 20% 40% 60% 80% 100%
Figure 12: Recognition for International/Global Employees “Which of the following best describes the recognition programs for these employees?” (n=224) Only participants answering “Yes” in Figure 11 received this question.
Option Percent
International/global employees participate in all or most of the same recognition programs as North American employees 46%
International/global employees participate in some of their own programs and some of the same programs as North American employees 21%
International/global employees have their own recognition programs 19% International/global employees participate in a few of the same recognition programs as North American employees 8%
International/global employees do not currently participate in any recognition programs 6%
Figure 13: Recognition Strategy “Is there a written strategy behind your organization’s recognition programs (e.g., why they were created, goals, etc.)?” (n=374)
Only participants answering “Yes” in Figure 1 received this question.
Yes51%
No49%
0% 20% 40% 60% 80% 100%

WorldatWork Trends in Employee Recognition 2013
13
Figure 14: Recognition and Organizational Strategy “Does your recognition strategy align with your organization’s strategy?” (n=187)
Only participants answering “Yes” in Figure 13 received this question.
Yes97%
No3%
Figure 15: Recognition Objectives “What are the objectives/goals of your organization’s recognition programs?” (Check all that apply.) (n=374)
Only participants answering “Yes” in Figure 1 received this question.
0% 20% 40% 60% 80%
Other
Support a culture change
Provide line of sight to company goals
Support becoming/remaining an employer of choice
Increase retention or decrease turnover
Encourage loyalty
Support organizational mission/values
Increase morale
Reinforce desired behaviors
Motivate high performance
Create a culture of recognition
Create a positive work environment
Recognize years of service
5%
18%
24%
37%
41%
43%
56%
60%
66%
72%
73%
74%
77%

WorldatWork Trends in Employee Recognition 2013
14
Figure 16: Success of Recognition Program “Do you feel your programs are meeting the objectives/goals?” (n=366)
Only participants answering “Yes” in Figure 1 received this question.
Yes74%
No26%
0% 20% 40% 60% 80% 100%
Figure 17: Measuring Success of Recognition “What types of measurements for success do you use in your recognition programs?” (Check all that apply.) (n=303)
Only participants answering “Yes” in Figure 1 received this question.
0% 20% 40% 60%
Return on investment (ROI)
Customer surveys
Productivity
Turnover
Number of nominations
Usage rates and/or participation rates
Employee satisfaction surveys
10%
18%
21%
30%
42%
53%
57%
WorldatWork Trends in Employee Recognition 2013
15
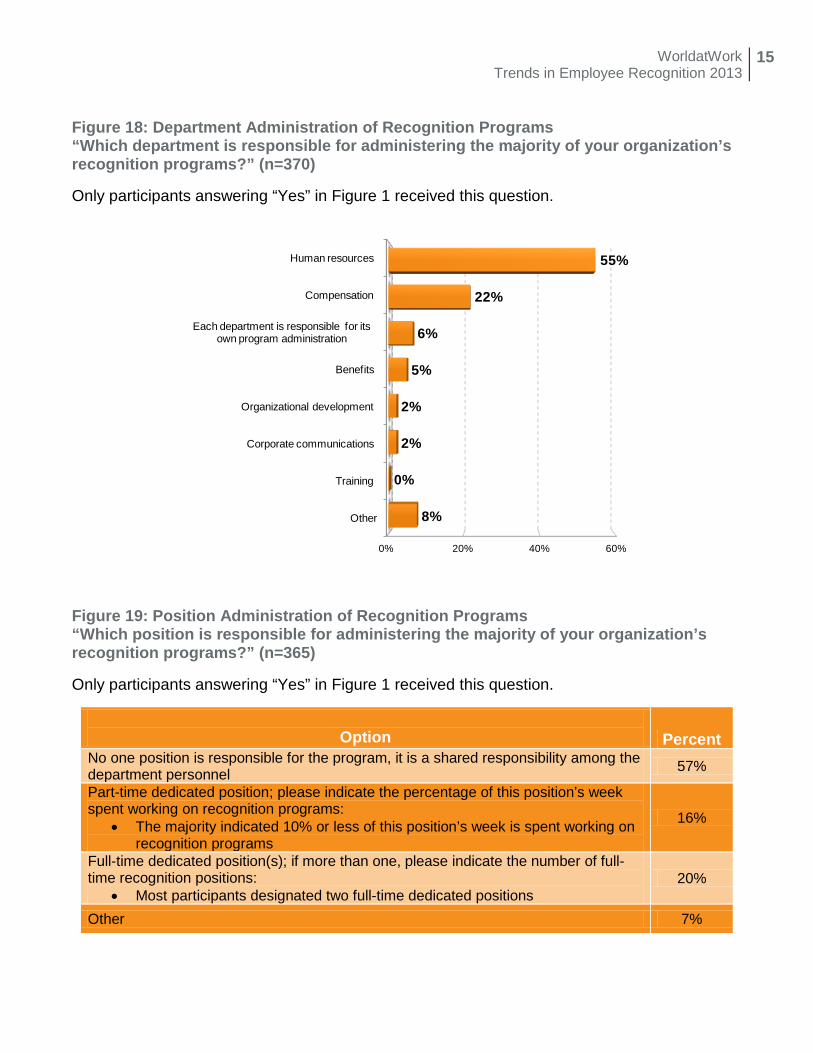
Figure 18: Department Administration of Recognition Programs “Which department is responsible for administering the majority of your organization’s recognition programs?” (n=370)
Only participants answering “Yes” in Figure 1 received this question.
0% 20% 40% 60%
Other
Training
Corporate communications
Organizational development
Benefits
Each department is responsible for its own program administration
Compensation
Human resources
8%
0%
2%
2%
5%
6%
22%
55%
Figure 19: Position Administration of Recognition Programs “Which position is responsible for administering the majority of your organization’s recognition programs?” (n=365)
Only participants answering “Yes” in Figure 1 received this question.
Option Percent
No one position is responsible for the program, it is a shared responsibility among the department personnel 57%
Part-time dedicated position; please indicate the percentage of this position’s week spent working on recognition programs:
• The majority indicated 10% or less of this position’s week is spent working on recognition programs
16%
Full-time dedicated position(s); if more than one, please indicate the number of full-time recognition positions:
• Most participants designated two full-time dedicated positions 20%
Other 7%

WorldatWork Trends in Employee Recognition 2013
16
Figure 20: Budgeting for Recognition Programs “Is there a budget for your recognition programs?” (n=369)
Only participants answering “Yes” in Figure 1 received this question.
Yes79%
No21%
0% 20% 40% 60% 80% 100%
Figure 21: Percentage of Payroll Budget for Recognition Programs “What percentage of your payroll budget is used for recognition programs?” (n=178)
Only participants answering “Yes” in Figure 20 received this question.
Mean Median Mode
2% 1% 1%
Distribution of Responses
0% 0.1%-1.0% 1.1%-2.9% 3.0%-5.9% 6.0%-10.0% >10.0%
5% 68% 10% 11% 3% 4%
28% of participating organizations budget exactly 1% of their payroll budget for recognition programs, which was the most common response.

WorldatWork Trends in Employee Recognition 2013
17
Figure 22: Budget for Recognition Programs (Centralized or Departmental) “Is the recognition budget:” (n=280)
Only participants answering “Yes” in Figure 21 received this question.
0% 20% 40% 60%
Held in each department-specific budget
Centralized for the entire organization
Some centralized and some department-specific
17%
39%
44%
Figure 23: Media Communication of Recognition Programs “Which media channels do you use to communicate your recognition programs?” (Check all that apply.) (n=345)
Only participants answering “Yes” in Figure 1 received this question.
0% 20% 40% 60% 80%
Other
Social media
We do not have a communications plan for our recognition programs.
Employee handbook
Posters, flyers and/or table tents
Employee orientation
Company newsletter
Internet/intranet
6%
5%
11%
18%
19%
29%
30%
61%
65%
WorldatWork Trends in Employee Recognition 2013
18
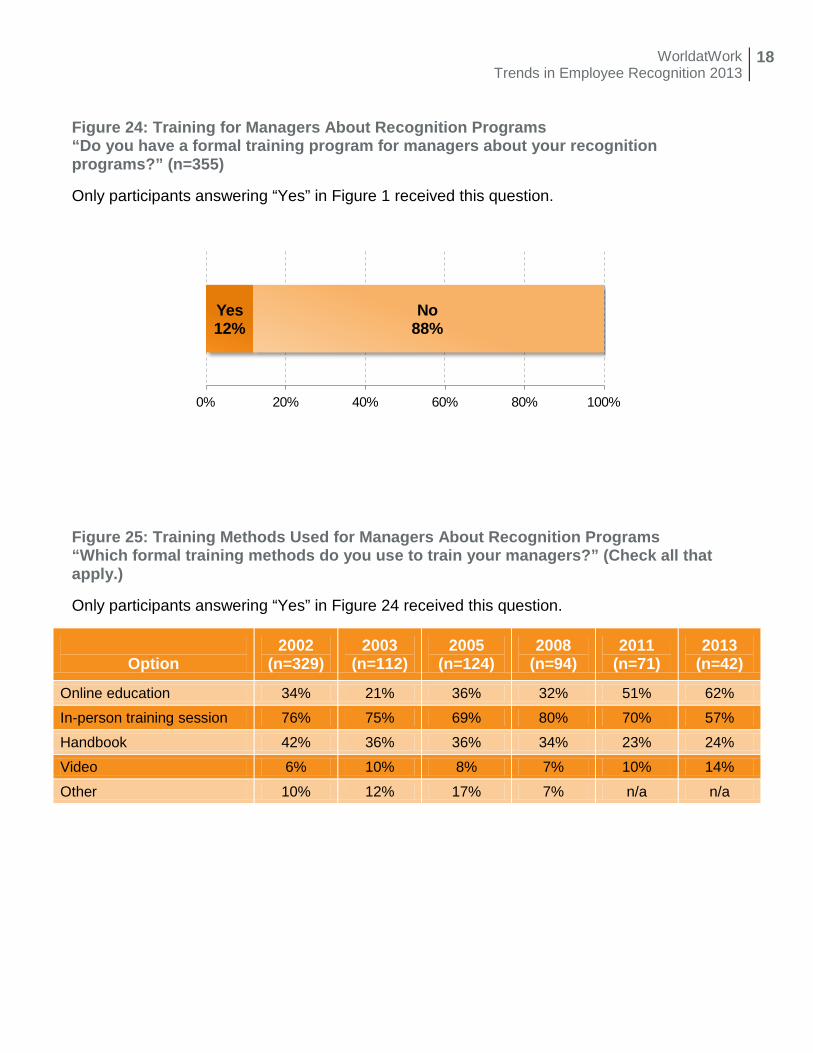
Figure 24: Training for Managers About Recognition Programs “Do you have a formal training program for managers about your recognition programs?” (n=355)
Only participants answering “Yes” in Figure 1 received this question.
Yes12%
No88%
0% 20% 40% 60% 80% 100%
Figure 25: Training Methods Used for Managers About Recognition Programs “Which formal training methods do you use to train your managers?” (Check all that apply.)
Only participants answering “Yes” in Figure 24 received this question.
Option
2002 (n=329)
2003 (n=112)
2005 (n=124)
2008 (n=94)
2011 (n=71)
2013 (n=42)
Online education 34% 21% 36% 32% 51% 62%
In-person training session 76% 75% 69% 80% 70% 57%
Handbook 42% 36% 36% 34% 23% 24%
Video 6% 10% 8% 7% 10% 14%
Other 10% 12% 17% 7% n/a n/a

WorldatWork Trends in Employee Recognition 2013
19
Figure 26: Senior-Management Support for Recognition Programs “What level of support do you feel your organization’s senior-management team shows for your recognition programs?”
Only participants answering “Yes” in Figure 1 received this question.
49%
49%
36%
37%
41%
46%
46%
57%
57%
54%
5%
6%
7%
7%
6%
2003
2005
2008
2010
2013
0% 20% 40% 60% 80% 100%
High level of Support Mid level of Support Low/No Support
n=353
n=487
n=486
n=357
n=534
Figure 27: Senior-Management View of Employee Recognition Programs “Which of the following best describes how senior management in your organization views employee recognition programs?”
Only participants answering “Yes” in Figure 1 received this question.
Option
2005 (n=534)
2008 (n=492)
2011 (n=489)
2013 (n=354)
As an investment 55% 46% 52% 46%
As an expense 13% 13% 14% 12%
Unsure 32% 41% 34% 42%

WorldatWork Trends in Employee Recognition 2013
20
Figure 28: Presentation of Recognition Awards “How are recognition awards presented?” (Check all that apply.)
Only participants answering “Yes” in Figure 1 received this question.
Option
2002 (n=289)
2003 (n=355)
2005 (n=528)
2008 (n=494)
2011 (n=488)
2013 (n=348)
One-on-one with manager 63% 69% 67% 63% 68% 71%
Special event (e.g., banquet, luncheon, etc.) 65% 63% 70% 57% 57% 61%
Staff meeting 59% 59% 60% 53% 53% 55%
Companywide meeting 33% 37% 36% 38% 40% 41%
Email announcements/notifications n/a n/a n/a n/a 39% 36%
Intranet announcement n/a n/a n/a 28% 33% 29%
Company newsletter n/a n/a n/a n/a 29% 28% Not presented (e.g., mailed to recipient at work or home) n/a 7% 10% 8% 10% 10%
Social media n/a n/a n/a n/a n/a 5%
Other 11% 10% 3% 11% 6% 5%

WorldatWork Trends in Employee Recognition 2013
21
Figure 29: Types of Recognition Awards (Items) “What types of items are presented as recognition awards?” (Check all that apply.) Only participants answering “Yes” in Figure 1 received this question.
Option 2002 (n=328)
2003 (n=358)
2005 (n=535)
2008 (n=494)
2011 (n=488)
2013 (n=348)
Certificates and/or plaques n/a 75% 81% 78% 77% 77%
Cash (not pay-for-performance or compensation) 58% 63% 58% 60% 62% 61%
Gift certificates for product purchases 63% 57% 57% 51% 47% 50%
Company logo merchandise n/a 51% 57% 46% 43% 47%
Food (breakfast, lunch, pizza party, etc.) n/a n/a n/a 42% 36% 36%
Timepieces (e.g., watches, clocks, etc.) 28% 33% 21% 30% 32% 32%
Jewelry (e.g., necklaces, lapel pins, bracelets, etc.) 40% 43% 44% 28% 31% 31%
Household items (e.g., crystal, vases, china, etc.) 35% 34% 38% 26% 27% 28% Office accessories (e.g., desk sets, portfolios, pen/pencil sets, etc.) 41% 41% 38% 25% 26% 26%
Electronics (e.g., cameras, TVs, stereos, etc.) 24% 24% 28% 21% 25% 28%
Recreational items/sporting goods n/a n/a 29% 19% 20% 23% Gift certificates for personal services (e.g., spa treatments, maid service, etc.) n/a 26% 25% 17% 18% 24%
Travel 14% 17% 21% 15% 15% 14%
Redeemable points n/a n/a n/a n/a 14% 14%
Other 31% 23% 8% 11% n/a n/a

WorldatWork Trends in Employee Recognition 2013
22
Figure 30: Electronic Communication of Recognition Awards “What electronic media or technology are used for the following program activities?” (Check all that apply.)
Only participants answering “Yes” in Figure 1 received this question.
Option Intranet Email Internal Social
Network
Recognition Program Software
Internet External Social
Network Program communication (n=250) 73% 73% 10% 8% 6% 0%
Recognition nomination (n=241) 56% 59% 3% 22% 7% 0%
Award/item ordering (n=227) 23% 30% 1% 21% 50% 0%
Program administration (n=207) 43% 50% 3% 30% 17% 1%
Recognition presentation (n=167) 56% 59% 13% 12% 8% 5%
Peer acknowledgement/celebration (n=145) 43% 58% 15% 18% 5% 2% Program financials, reporting and/or tracking (n=138) 33% 39% 3% 41% 9% 0%
Program training (n=124) 71% 57% 6% 19% 4% 0%
Figure 31: Perceived Workforce Effect of Recognition Awards “What would your workforce say is the effect of your organization’s recognition programs on:”
Only participants answering “Yes” in Figure 1 received this question.
1%
2%
2%
1%
65%
34%
40%
35%
34%
64%
58%
64%
Employee Retention (n=346)
Employee Satisfaction (n=352)
Employee Motivation (n=349)
Employee Engagement (n=351)
0% 20% 40% 60% 80% 100%
Extremely negative/negative No effect or neutral Extremely positive/positive

WorldatWork Trends in Employee Recognition 2013
23
Figure 32: Attraction and Recognition Awards “Does your organization feature or market some or all types of recognition programs as a key employee benefit when attempting to attract new employees?” (n=351)
Only participants answering “Yes” in Figure 1 received this question.
Yes11%
Sometimesbut not always
27%
No62%
0% 20% 40% 60% 80% 100%
Recognition Programs by Organization Size and Type Figure 33: Recognition Programs by Organization Size8
Option
Prevalence Less Than
100 Employees
(n=17)9
100 to 499
(n=45)
500 to 999
(n=26)9
1,000 to
2,499 (n=63)
2,500 to
4,999 (n=48)
5,000 to
9,999 (n=56)
10,000 to
19,999 (n=39)
20,000 and Over
(n=61)
Length of service 84% 77% 87% 89% 91% 90% 84% 90% 80% Above-and-beyond performance 75% 71% 76% 73% 73% 77% 75% 74% 90%
Peer-to-peer 42% 41% 31% 46% 29% 42% 46% 44% 51% Programs to motivate specific behaviors 41% 24% 36% 31% 35% 42% 50% 46% 54%
Retirement 34% 6% 38% 39% 54% 44% 30% 44% 16%
Sales performance 25% 18% 27% 31% 24% 17% 25% 41% 26% Employee of the year, month, etc. 24% 12% 13% 31% 29% 31% 27% 36% 13%
Suggestions/ideas 20% 29% 13% 27% 22% 19% 20% 15% 23%
Safety performance 19% 18% 22% 15% 18% 15% 21% 36% 18% Major family event (e.g., birth, wedding, etc.)
18% 41% 33% 35% 13% 21% 4% 10% 16%
Attendance 9% 0% 9% 15% 8% 15% 13% 10% 5%
8 Due to program combinations and distribution, tests of statistically significant differences were not performed. 9 The count for this group is less than 30; data corresponding to larger sample sizes will have stronger statistical power and validity. This group was not included in testing for statistically significant differences.

WorldatWork Trends in Employee Recognition 2013
24
Figure 34: Recognition Programs by Organization Type10
Option
Prevalence Public Sector (n=52)
Nonprofit/Not-for-
Profit (n=67)
Private Sector — Publicly Traded (n=126)
Private Sector — Privately
Held (n=109)
Average number of programs offered 3.9 4.1 3.7 4.0 4.0
Length of service 84% 87% 97% 81% 86%
Above-and-beyond performance 75% 73% 73% 83% 76%
Peer-to-peer 42% 29% 39% 48% 39%
Programs to motivate specific behaviors 41% 48% 48% 26% 34%
Retirement 34% 21% 9% 28% 37%
Sales performance 25% 40% 37% 48% 39%
Employee of the year, month, etc. 24% 39% 28% 20% 20%
Suggestions/ideas 20% 25% 9% 24% 20%
Safety performance 19% 10% 15% 15% 28%
Major family event (e.g., birth, wedding, etc.) 18% 21% 9% 22% 24%
Attendance 9% 14% 8% 10% 8%
10 Due to program combinations and distribution, tests of statistically significant differences were not performed.
WorldatWork Trends in Employee Recognition 2013
25
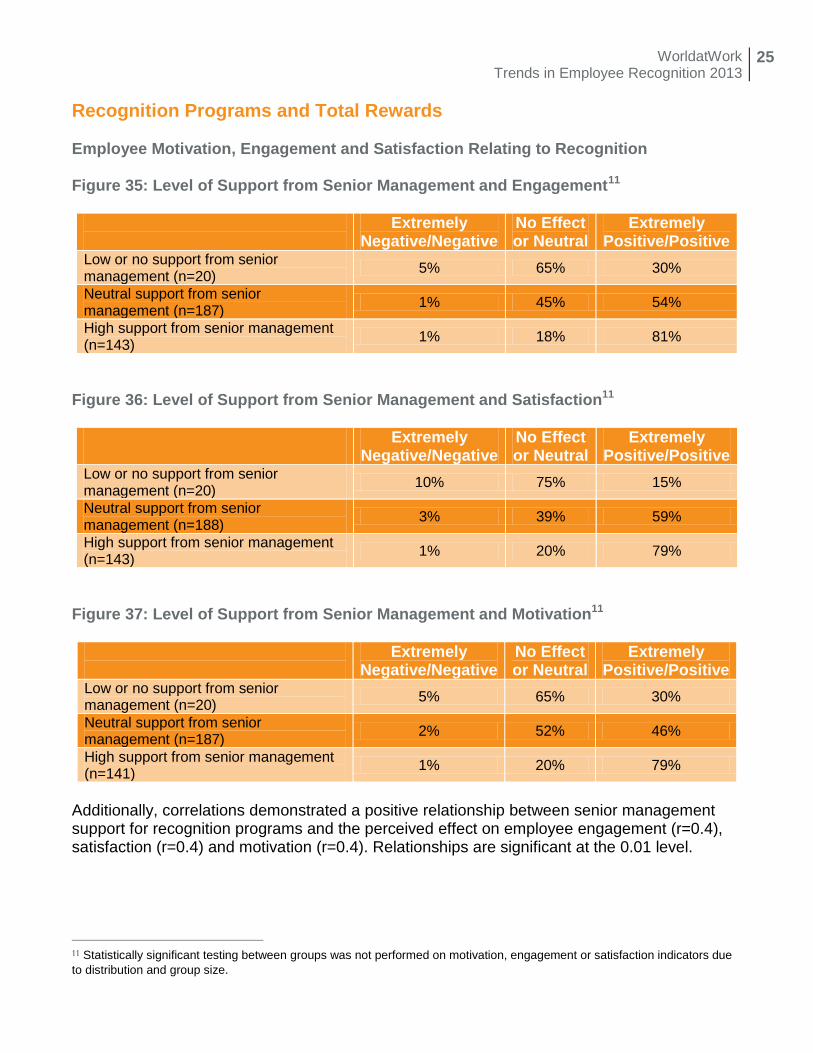
Recognition Programs and Total Rewards Employee Motivation, Engagement and Satisfaction Relating to Recognition Figure 35: Level of Support from Senior Management and Engagement11
Extremely Negative/Negative
No Effect or Neutral
Extremely Positive/Positive
Low or no support from senior management (n=20) 5% 65% 30%
Neutral support from senior management (n=187) 1% 45% 54%
High support from senior management (n=143) 1% 18% 81%
Figure 36: Level of Support from Senior Management and Satisfaction
11
Extremely Negative/Negative
No Effect or Neutral
Extremely Positive/Positive
Low or no support from senior management (n=20) 10% 75% 15%
Neutral support from senior management (n=188) 3% 39% 59%
High support from senior management (n=143) 1% 20% 79%
Figure 37: Level of Support from Senior Management and Motivation
11
Extremely Negative/Negative
No Effect or Neutral
Extremely Positive/Positive
Low or no support from senior management (n=20) 5% 65% 30%
Neutral support from senior management (n=187) 2% 52% 46%
High support from senior management (n=141) 1% 20% 79%
Additionally, correlations demonstrated a positive relationship between senior management support for recognition programs and the perceived effect on employee engagement (r=0.4), satisfaction (r=0.4) and motivation (r=0.4). Relationships are significant at the 0.01 level. 11 Statistically significant testing between groups was not performed on motivation, engagement or satisfaction indicators due to distribution and group size.

WorldatWork Trends in Employee Recognition 2013
26
Employee Retention and Recognition Figure 38: Offer Recognition Programs and Voluntary Turnover Rates
Option
0% to 5% (Low) (n=115)
6% to 10% (Medium)
(n=145)
11% to 15% (High) (n=116)
Average number of programs offered 4.1 4.0 3.7
Have at least one recognition program 89% 90% 83%
Do not offer any recognition programs 11% 10% 17% Figure 39: Recognition Program by Type and Voluntary Turnover Rates12
Option
All Respondents
0% to 5% (Low) (n=102)
6% to 10% (Medium)
(n=132)
11% to 15% (High) (n=96)
Length of service 84% 86% 85% 89%
Above-and-beyond performance 75% 79% 80% 71%
Peer-to-peer 42% 36% 48% 34%
Programs to motivate specific behaviors 41% 42% 45% 36%
Retirement 34% 44% 35% 27%
Sales performance 25% 23% 24% 29%
Employee of the year, month, etc. 24% 17% 25% 31%
Suggestions/ideas 20% 26% 19% 17%
Safety performance 19% 28% 17% 15%
Major family event (e.g., birth, wedding, etc.) 18% 26% 13% 17%
Attendance 9% 10% 12% 7%
12 Due to program combinations and distribution, tests of statistically significant differences were not performed.

WorldatWork Trends in Employee Recognition 2013
27
Demographics Figure D1: Number of Employees “Please choose the total number of employees your organization employs worldwide:” (n=410)
Option Percent
Less than 100 employees 7%
100 to 499 13%
500 to 999 7%
1,000 to 2,499 17%
2,500 to 4,999 13%
5,000 to 9,999 15%
10,000 to 19,999 11%
20,000 to 39,999 5%
40,000 to 99,999 7%
100,000 or more 3% Figure D2: Organization Type “Your organization is:” (n=409)
0% 20% 40%
Public sector (local, state, federal government)
Non-profit/Not-for-profit (educational organizations,
charitable organizations, etc.)
Private sector—publicly traded
Private sector—privately held
15%
34%
33%
18%

WorldatWork Trends in Employee Recognition 2013
28
Figure D3: Voluntary Turnover “What is the approximate annual voluntary turnover for employees?” (n=378)
Option Percent
0%-5% 31%
6%-10% 39%
11%-15% 17%
16%-20% 6%
21%-26% 4%
27%-40% 2%
41% or more 2% Figure D4: Industry “Please choose one category that best describes the industry in which your organization operates:” (n=410)
Option Percent
Finance & Insurance 15%
All Other Manufacturing 14%
Consulting, Professional, Scientific & Technical Services 12%
Healthcare & Social Assistance 8%
Utilities, Oil & Gas 7%
Information (includes Publishing, IT Technologies, etc.) 5%
Educational Services 4%
Computer and Electronic Manufacturing 4%
Public Administration 3%
Pharmaceuticals 3%
Transportation 3%
Retail Trade 2%
Wholesale Trade 2%
Arts, Entertainment & Recreation 1%
Other Services (except Public Administration) 1%
Warehousing and Storage 1%
Real Estate & Rental & Leasing 1%
Agriculture, Forestry, Fishing & Hunting 1%
Construction 1%
Accommodations & Food Services 1%

WorldatWork Trends in Employee Recognition 2013
29
Participating Organizations 3Rivers Federal Credit Union AAM Actelion Pharmaceuticals US
Inc. Acument Global
Technologies Afni Inc. AJB Software Design Inc. Alberta Health Services Alliance Data — Retail
Services Allianz of America Corp. AlloSource Amcal Family Services American National Insurance American Red Cross Ameritas Life Insurance
Corp. ANSYS Inc. Ariens Co. ARINC Inc. Army Welfare Project Associated Bank AstraZeneca Astron Solutions Autodesk Avanade Aviva Avon Bacardi Baptist Health BASF Baylor Health Care System Bentley University Black Hills Corp. Blue Cross and Blue Shield
of Kansas Blue Cross Blue Shield of MI BlueCross BlueShield of
South Carolina BP Business Development Bank
of Canada (BDC) Canadian Medical Protective
Association Canadian Science Publishing Canadian Western Bank Carhartt Inc. Celanese
Central Georgia Health System
Ceridian Canada Ltd. CFA Institute Chubb & Son Cisco CitiFinancial City & County of Denver City of Columbus City of Seattle City of Virginia Beach Coldwater Creek Community Social Services
Employers Association Compassion International Corning Inc. Country Casual County of Allegany, Maryland Covidien CTS Corp. Daiichi Sankyo Inc. Dakota County Dave & Buster’s Del Monte Corp. Deltek Inc. Denso Manufacturing
Tennessee Doosan Infracore Edifecs Eli Lilly and Co. EMC Corp. Emergency Medical Care Encana Corp. Erie Insurance Everbank Evolution1 Experian Farm Credit Services of
America Federal Reserve Bank of
Atlanta FedEx SupplyChain Ferguson Enterprises Inc. FINCA International FINRA Fiserv Flextronics Forest Oil Corp. Fossil
FP International Franklin Templeton Freddie Mac General Dynamics Advanced
Information Systems General Dynamics-AIS Girl Scouts of the USA Google Grande Cheese Great River Energy GW Medical Faculty
Associates Halifax Regional Municipality Harborstone Credit Union Harman International Harris Corp. Hawaii Employers Council Hilltop National Bank Hines Holland America Line Home Capital Group IDEX Corp. IEEE Indiana State University Integreon Managed Solutions Inter-Coastal Electronics Inteva Products LLC ITOCHU International Inc. Ixia J.J. Keller & Associates Inc. Jackson Family
Wines/Enterprises JDSU Jet Propulsion Laboratory JetBlue Airways Lenovo Level 3 Communications Liberty Mutual Insurance
Group Linden Lab Mathworks McCormick Canada Medibank Metal-Era Inc. MidMichigan Health Musco Sports Lighting LLC Musculoskeletal Transplant
Foundation National Fuel

WorldatWork Trends in Employee Recognition 2013
30
National Geographic National Grid National Pen Co. Nautilus Inc. Navigant Credit Union NCR NEC Corporation of America Neighborhood Health Plan of
Rhode Island New England Natural Bakers
Inc. New York Life Insurance NorthShore University
Healthsystem Northwest Community
Healthcare NOVA Chemicals NOVEC NVIDIA Corp. NW Natural NXP Semiconductors O’Brien & Gere Ocean Spray Cranberries
Inc. Ohio University Ohio Wesleyan University On Assignment Inc. OSI Industries LLC Oxfam America Palomar Health Panduit Corp. Parmalat Canada PCAOB Penn National Insurance PeopleMatters PetSmart Piedmont Natural Gas Port of Seattle PPL Corp. Premier Farnell PLC Prime Therapeutics ProBuild Holdings Inc. Pueblo County Government Purolator Inc. QLogic Corp. Quality Bicycle Products Quantum Corp. RAE Engineering and
Inspection Ltd. Random House Red Bull North America Inc. Regions Hospital
Remy Ridgewood Savings Bank Robert W. Baird Roundy’s Supermarkets Inc. Rush University Medical
Center Saint Mary’s Hospital Salient Federal Solutions Savannah River Remediation SCANA Services Schneider National Inc. Scholastic Corp. Selective Insurance Group Sensus ServiceMaster Siemens Corp. Sky Deutschland Smith Seckman Reid Inc. Smiths Medical Southwest Gas Corp. Spectrum Brands Sports Authority SSAB Americas St. Lawrence Seaway
Management Corp St. Louis County
Government Starkey Hearing
Technologies State of Wyoming STMicroelectronics Inc. Subaru of America Inc. Symantec TD Ameritrade TD Ameritrade (Retail
Distribution) Technology Credit Union Tectura TelePacific Communications Texas Mutual Insurance Co. TG Thales The Archdiocese of San
Francisco The Attachmate Group The Capital Group Cos. The Croner Co. The Finish Line The Ken Blanchard Cos. The Methodist Hospitals Inc. The National Academies Toyota de PR Corp.
Transportation Technology Center Inc.
UHC Uni-Select Inc. University of Iowa
Foundation University of St. Thomas University of Toronto University of Utah Hospitals
and Clinics USG Corp. Vantiv Vistaprint Volvo Group US Waters Corp. WellPoint WellStar Health System Western Compensation &
Benefits Consultants Western Nevada College Wilson Group Wilson Sporting Goods Co. Windstream Wipro Ltd. Woodmen of the World Life
Insurance Society Workforce Experts World Wildlife Fund Zygo Corp.