trends and periodicities in the canadian drought code and ...flanniga/publications/2004 giardin et...
TRANSCRIPT

Trends and periodicities in the Canadian DroughtCode and their relationships with atmosphericcirculation for the southern Canadian borealforest
Martin-Philippe Girardin, Jacques Tardif, Mike D. Flannigan, B. Mike Wotton, andYves Bergeron
Abstract: Trends and periodicities in summer drought severity are investigated on a network of Canadian DroughtCode (CDC) monthly average indices extending from central Quebec to western Manitoba and covering the instrumen-tal period 1913–1998. The relationship and coherency between CDC indices and ocean–atmosphere circulation patternsare also examined. Trend analyses indicate that drought severity is unchanged in eastern and central Canada. Compos-ite analyses indicate that for most of the corridor, severe drought seasons occur with a combination of positive 500-hPageopotential height anomalies centered over the Gulf of Alaska and over the Baffin Bay. Additional severe drought sea-sons develop across the corridor in the presence of positive height anomalies located over or upstream of the affectedregions. According to spectral analyses, the North Atlantic and the North Pacific circulation patterns modulate thedrought variability at the decadal scale. Our results lead us to conclude that climate warming and the increases in theamount and frequency of precipitation in eastern Canada during the last century had no significant impact on summerdrought severity. It is unlikely that linear climate change contributed to the change in the boreal forest dynamics ob-served over the past 150 years.
Résumé : Les tendances et périodicités dans la sévérité des sécheresses estivales sont analysées sur un réseau d’indicesde sécheresse (CDC) moyens mensuels couvrant le corridor Québec–Manitoba et la période déterminante 1913–1998.Les relations et les cohérences entre les indices CDC et les principaux patrons de circulation atmosphérique sont égale-ment examinées. Les résultats obtenus n’indiquent aucun changement linéaire des conditions de sécheresse estivale, nidans l’Est ni au centre du Canada. Des analyses composites indiquent qu’à travers le corridor, des saisons de séche-resse sévère ont lieu en combinaison avec des anomalies positives de la hauteur géopotentielle à 500 hPa centrées au-dessus du Golfe de l’Alaska et au-dessus de la Baie de Baffin. Des saisons de sécheresse additionnelles ont lieu àtravers le corridor avec le développement d’anomalies positives au-dessus des régions affectées. D’après nos analysesspectrales, les patrons de circulations de l’Atlantique Nord et du Pacifique Nord agissent sur la variabilité des sécheres-ses dans l’échelle décennale. Nos résultats nous amènent à conclure que le réchauffement climatique et les augmenta-tions de la quantité et de la fréquence des précipitations dans l’est du Canada au cours du dernier siècle n’ont euaucun effet important sur la sévérité des sécheresses estivales. Il est donc peu probable que le changement climatiquelinéaire ait contribué au changement dans la dynamique de la forêt boréale enregistré au cours des 150 dernières an-nées.
Girardin et al. 119
Introduction
Fire frequency and area burned in the southeastern Cana-dian boreal forest have significantly diminished since theend of the “Little Ice Age” (~1850) (Bergeron et al. 2001).
Consequently, even-aged stands composed of postfire spe-cies are decreasing in proportion and this to the benefit ofuneven-aged and older stands composed of shade-tolerantspecies (Bergeron and Dubuc 1989). Secondary disturbances(insect outbreaks and windthrows) are also playing a greater
Can. J. For. Res. 34: 103–119 (2004) doi: 10.1139/X03-195 © 2004 NRC Canada
103
Received 17 March 2003. Accepted 11 August 2003. Published on the NRC Research Press Web site at http://cjfr.nrc.ca on16 January 2004.
M.-P. Girardin1,2 and J. Tardif. Centre for Forest Interdisciplinary Research (C-FIR), University of Winnipeg, 515 AvenuePortage, Winnipeg, MB R3B 2E9, Canada.M.D. Flannigan and B.M. Wotton. Canadian Forest Service, 1219 Queen Street East, Sault Ste Marie, ON P6A 2E5, Canada.Y. Bergeron. Groupe de recherche en écologie forestière inter-universitaire (GREFI), Université du Québec à Montréal, C.P. 8888,Succursale. Centre-Ville, Montréal, QC H3C 3P8, Canada.
1Corresponding author (e-mail: [email protected]).2Present address: Department of Botany, University of Manitoba, 505 Buller Building, Winnipeg, MB R3T 2N2, Canada.
I:\cjfr\cjfr3401\X03-195.vpJanuary 12, 2004 11:50:21 AM
Color profile: Generic CMYK printer profileComposite Default screen

role in the establishment of the forest mosaic at the land-scape level. While the forest successional pathway itself isfairly well understood (Bergeron 2000), the processes regu-lating succession are not well elucidated. However, paleo-ecological evidence suggests that climate, by affecting thefire regime, determines the boreal forest species’ composi-tion (Carcaillet et al. 2001; Bergeron et al. 2002).
Bergeron and Archambault (1993) and Bergeron et al.(2001) suggested that the reduction of area burnt in easternCanada since the 1850s reflects a change from extreme firecondition to a moister climate (i.e., fewer extreme seasons ofdrought). Recent analyses of instrumental meteorological re-cords across Canada suggested significant trends in climate(both precipitation and temperature) over the 20th centuryfor several regions of Canada (Houghton et al. 2001). From1950 to 1998, temperature in the northeastern Canada de-creased while it increased in the south and the west (Zhanget al. 2000). As well, summer precipitation increased signifi-cantly in the northeast (Mekis and Hogg 1999). Most of thisincrease is attributed to an increase in the frequency of smallprecipitation events (Zhang et al. 2001). General circulationmodels’ outputs (Flannigan et al. 2001) also suggested thatthe increase in precipitation observed in the eastern borealforest is sufficient to overcome the effect of climate warm-ing with respect to fire weather severity. Contrasting resultswere found for central Canada, suggesting an increase in dryconditions as a response to climate change (Flannigan et al.2001).
Ocean circulation patterns can alter regional climate anddisturbance regimes over North America. Nigam et al.(1999) and Barlow et al. (2001) demonstrated that North Pa-cific sea surface temperature (SST) variability was stronglylinked to large-scale patterns of drought and stream flow inthe U.S.A. Bonsal et al. (1993) and Bonsal and Lawford(1999) also reported similar findings after analysing the tele-connections between Tropical and North Pacific SSTs andsummer-extended dry spells in the Canadian Prairies. Whilethe modulation between these patterns and regional climateis not well understood, there is great interest directed to-wards the use of circulation patterns’ information for fire–climate modelling (Flannigan and Wotton 2001).
Understanding temporal changes in fire regimes cannot beentirely based on temperature and precipitation parameters.Fire is a conjunction of various weather parameters and of-ten the result of interactions among precipitation, tempera-ture, humidity, solar radiation, ignition agents, and wind(Van Wagner 1987; Flannigan and Harrington 1988). Thedaily drought indicators accounting for precipitation, evapo-transpiration, and soil moisture capacity developed as com-ponents of the Canadian Fire Weather Index system (FWI;Van Wagner 1987) offer an alternative in fire–climate analy-ses. These indicators, which are the Fine Fuel MoistureCode, the Duff Moisture Code, and the Drought Code (Ca-nadian Drought Code; CDC), differ in their water-holdingcapacity and their drying rate.
The CDC has been used infrequently for climatic studies.In Quebec, CDC indices were used as estimates of soilmoisture content to explain yearly variations within tree-ringwidth (Archambault and Bergeron 1992; Bergeron andArchambault 1993; Tardif and Bergeron 1997; Girardin et al.2001). Multicentury CDC reconstructions derived from tree-
ring chronologies have also been successfully used to ex-plain multicentury shifts in atmospheric circulation (Girardinet al. 2002; Girardin et al. In press). The CDC has five as-pects that are important for this study: (i) the effect ofsnowmelt is accounted for in its calculation, (ii) it is an ade-quate indicator of moisture conditions of deep organic layersin boreal conifer stands (Van Wagner 1974), (iii) it repre-sents conditions conducive to hydric stress in boreal treespecies (Bergeron and Archambault 1993; Tardif andBergeron 1997; Girardin et al. 2001), (iv) it is an indicatorof water table depth, and (v) it represents conditions condu-cive to fire involving deep soil layers (Turner 1972).
In this study, we construct a network of mean monthly av-erage instrumental CDC indices distributed along the south-ern Canadian boreal forest. The spatiotemporal variabilitywithin the network is analysed and linked with atmosphericcirculation using 500-hPa geopotential height compositeanalyses. Periodicities within the network are also investi-gated and compared with those characterizing NorthernHemisphere ocean–atmosphere circulation indices. Finally,correlation structures between CDC indices and fire fre-quency and area burned are analysed to assess the potentialuse of the CDC indices as estimates of past fire seasons. Asfire history data sets are limited in time and accuracy(Murphy et al. 2000), the development of other records thatreflect past fire seasons could greatly benefit the understand-ing of temporal changes in the boreal forest dynamics.
Materials and methods
Study areaThe corridor is located on the Boreal Shield and Boreal
Plains ecozones that cover most of the boreal forest fromeastern Quebec to northwestern Manitoba (Fig. 1). The cor-ridor was divided into six climatic regions (A–F; Fig. 1),with boundaries approximating actual ecoregions defined bythe Ecological Stratification Working Group (1996). Theseclimatic regions are (A) the Southern Laurentian, (B) and(C) the Abitibi Plains east and west, respectively, (D) theLake Nipigon, (E) the Lac Seul Upland and Lake of theWoods, and (F) the Boreal Plains (Fig. 1). Merging of eco-regions in climatic regions E and F was necessary becauseof the lack of meteorological data required for homogeniza-tion of the CDC indices. In the Ecological StratificationWorking Group’s (1996) classification, the Lac Seul Upland(north) and the Lake of the Woods (south) occurs as twoseparate ecoregions (refer to Fig. 1). The Boreal Plains eco-zone encompasses 10 separate, mostly upland ecoregionssouth of the Canadian Shield, stretching from north-centralAlberta to southwestern Manitoba. Eastern ecoregions of theBoreal Plains ecozone were merged for the buildup of theclimatic region data set: the Mid-Boreal Lowland, theInterlake Plains, the Boreal Transition, and the Mid-BorealUplands (Manitoba area). In contrast, the Abitibi Plainsecoregion was divided into two climatic regions (regions Band C) because of its extensive area and availability of mete-orological data.
All ecoregions under study have a humid to subhumidmidboreal ecoclimate (east to west corridor) marked bywarm summers and cold, snowy winters according to theEcological Stratification Working Group’s (1996) regional
© 2004 NRC Canada
104 Can. J. For. Res. Vol. 34, 2004
I:\cjfr\cjfr3401\X03-195.vpJanuary 12, 2004 11:50:21 AM
Color profile: Generic CMYK printer profileComposite Default screen

classification. In eastern climatic regions (A–D), average an-nual temperature ranges between 1.0 and 1.5 °C, whereas itranges between –1.0 and 1.0 °C in regions E–F. The averagesummer temperature is constant across the corridor, approxi-mately 14.0 °C. The average winter temperatures are morevariable, ranging from –11.0 °C in region A to –16.0 °C inregion F. The average annual precipitation ranges from1600 mm in the east to 450 mm in the west. In this corridor,most of the annual precipitation falls between June and Oc-tober (Environment Canada 2002).
Canadian Drought Code calculationThe meteorological data used in this study were daily in-
strumental data of Environment Canada (2000). Meteorolog-ical stations showing the longest records (over 60 year) inthe six climatic regions were selected as main stations. Otherstations in a 200-km radius and with relatively long recordswere also selected for the calculation of homogenizedmonthly regional CDC indices. In some climatic regions, thenumber of meteorological stations and extent of the datawere insufficient for the construction of homogenized datasets. In this situation, stations outside the radius were usedfor estimation of remaining missing values. A total of 62meteorological stations were gathered to construct regionalmonthly average CDC indices. These stations are summa-rized in Table 1 and plotted per climatic region in Fig. 1.
Maximum daily temperature data sets were screened forthe presence of missing daily values. Months (April–October) with more than 3 days of missing values wereeliminated from the CDC calculation. For the remainingmonths, missing daily values were estimated by calculatingthe average of the previous and following days. For the pre-cipitation data sets, months with at least one missing dailyvalue were automatically eliminated from the calculation.
The CDC is sensitive to daily precipitation, such that onerainfall can significantly affect the value of the index formany days after precipitation. In contrast, a temperature esti-mation error of a few degrees has little impact on the calcu-lation for the days following. Note that because the CDCcalculation is on a day-to-day cumulative basis, the occur-rence of a missing daily value at a station in a given yeardisables the CDC calculation for the rest of the year at thatstation.
The CDC is a slow-drying index with a time lag estimatedat 52 days (Turner 1972). Its calculation was processed asproposed by Turner (1972) and Van Wagner (1987). The cal-culation begins with a rainfall phase (RP) value of 771 onApril 1 (771 being the value normally set by fire agencieswhen organic layer is fully recharged). The RP, which repre-sents the moisture equivalent after rain (expressed in per-centage of dry soil), is otherwise calculated from
[1] RP = [800/exp(CDCd–1/400)] + 3.937ER
where CDCd–1 represents the drought value of the previousday. RP can range from 0 to 800, with 800 being saturationin water and 0 being the driest condition normally encoun-tered. RP never exceeds 800. ER (effective rainfall) is equiv-alent to the amount of rainfall available for storage afterinterception by the canopy (the constant 3.937 was intro-duced by Van Wagner 1987 to adapt ER to the metricsystem). The constant 400 represents the maximum water-holding capacity of the soil, which amounts to approxi-mately 400% of water per units of mass. The water-holdingcapacity of the CDC layer is 100 mm (or 4.0 in.) for a layerwith a bulk density of about 25 kg/m2. Excess water is con-sidered as residual rainfall and is not accounted for by theCDC (see Appendix A).
© 2004 NRC Canada
Girardin et al. 105
Fig. 1. Geographical locations of the 62 meteorological stations per climatic regions: A, Southern Laurentians; B, Abitibi Plains east;C, Abitibi Plains west; D, Lake Nipigon; E, Lac Seul Upland and Lake of the Woods; and F, Boreal Plains. Symbols identify the sta-tions used in each of the climatic regions. Ecoregions, as defined by the Ecological Stratification Working Group (1996), are alsodrawn.
I:\cjfr\cjfr3401\X03-195.vpJanuary 12, 2004 11:50:23 AM
Color profile: Generic CMYK printer profileComposite Default screen

© 2004 NRC Canada
106 Can. J. For. Res. Vol. 34, 2004
Station Code Longitude Latitude Elevation Period
A. Southern LaurentianNormandin 7065640 72°32′W 48°51′N 137 1937–1992Roberval airport 7066685 72°16′W 48°31′N 179 1958–1998Roberval 7066688 72°14′W 48°32′N 102 1888–1966Mistassini 7064998 72°12′W 48°51′N 122 1964–1994Albanel 7060080 72°27′W 48°53′N 152 1923–1990Bagotville 7060400 71°00′W 48°20′N 159 1943–1998Lac Bouchette 7063560 72°10′W 48°13′N 358 1951–1998Chicoutimi 7061441 71°50′W 48°25′N 175 1881–1979Hemon 7063090 72°36′W 49°40′N 183 1966–1998Kenogamie 7063400 71°15′W 48°25′N 116 1924–1964Barrage à Lac Kempt 7070448 74°11′W 47°33′N 421 1913–1963Barrage Gouin 7070454 74°60′W 48°21′N 404 1914–1979La Tuque 7074240 72°47′W 47°24′N 152 1915–1998Manouan Sanmaur 7074600 73°48′W 47°54′N 357 1919–1972Mistassini Post 7095000 73°53′W 50°25′N 380 1899–1980
B. Abitibi Plains eastAbitibi Post 7090050 79°22′W 48°43′N 259 1898–1935Amos 7090120 78°07′W 48°34′N 259 1915–1997Duparquet 709BBDH 79°16′W 48°31′N 290 1983–1993La Sarre 7094120 79°12′W 48°48′N 244 1952–1998Val Saint-Gilles 70986RN 79°07′W 48°59′N 290 1973–1998Cochrane 6071712 81°02′W 49°04′N 275 1912–1991Iroquois Falls 6073810 80°40′W 48°45′N 259 1913–1997Kirkland Lake 6074209 80°00′W 48°90′N 324 1951–1996Haileysbury 6073138 79°38′W 47°27′N 189 1895–1922
C. Abitibi Plains westFranz 6052563 84°25′W 48°28′N 373 1918–1949Hornepayne 6053570 84°46′W 49°12′N 329 1920–1989Steep Hill Falls 6058010 84°48′W 48°40′N 335 1920–1938White River 6059475 85°17′W 48°36′N 379 1889–1975Kapuskasing A 6073960 82°28′W 49°25′N 227 1919–1998Kapuskasing 6073975 82°26′W 49°27′N 218 1937–1998Smokey Falls 6077845 82°10′W 50°40′N 183 1934–1996
D. Lake NipigonCameron Falls 6041109 88°21′W 49°90′N 229 1925–1997Geraldton A 6042716 86°56′W 49°47′N 349 1981–1998Kakabeka Falls 6043930 89°37′W 48°24′N 278 1910–1976Port Arthur 6046588 89°13′W 48°26′N 195 1878–1941Schreiber 6047624 87°16′W 48°49′N 302 1910–1975Thunder Bay A 6048261 89°20′W 48°22′N 199 1942–1993Manitouwadge 6044903 85°48′W 49°90′N 332 1956–1994Savanne 6047615 90°12′W 48°58′N 459 1892–1946
E. Lac Seul Upland and Lake of the WoodsDryden 6032117 92°50′W 49°47′N 372 1914–1997Ignace 6033690 91°39′W 49°25′N 447 1914–1970Kenora 6034070 94°32′W 49°48′N 336 1900–1938Kenora A 6034075 94°22′W 49°47′N 410 1939–1998Sioux Lookout 6037775 91°54′W 50°70′N 390 1939–1998Fort France 6022475 93°25′W 48°37′N 343 1892–1995Earl Falls 6012198 93°13′W 50°38′N 361 1930–1996Red Lake A 6016975 93°48′W 51°40′N 386 1939–1998Channel Island 5030556 97°23′W 52°18′N 216 1890–1904Great Falls 5031200 96°00′W 50°28′N 249 1923–1996Indian Bay 5031320 95°12′W 49°37′N 327 1915–1998
Table 1. Meteorological stations used in the calculation of the mean monthly average CanadianDrought Code (CDC) indices.
I:\cjfr\cjfr3401\X03-195.vpJanuary 12, 2004 11:50:23 AM
Color profile: Generic CMYK printer profileComposite Default screen

ER is calculated from
[2] ER = 0.83P – 1.27
where P represents the daily value of precipitation over2.80 mm (intercepted rainfall). ER is not calculated unlessprecipitation exceeds 2.80 mm. The values of 0.83 and1.27 mm are empirical constants representing canopy inter-ception.
Current drought (D) is calculated using the RP value ofeq. 1 and the following equation:
[3] D = 400 ln(800/RP)
The calculation of the potential evapotranspiration (PET)(the daily dry-weather additive) is given by
[4] PET = 0.36T + L
T represents the maximum daily temperature value (°C), andL represents a seasonal day length adjustment. From April toOctober, the values of L are 0.9, 3.8, 5.8, 6.4, 5.0, 2.4, and0.4, respectively (Van Wagner 1987). The PET calculationfollows Thornthwaite and Mather (1955). The maximumdaily temperature was not adjusted to the noon local stan-dard time, as it is normally done in the FWI system (Turner1972; Van Wagner 1987). The value of 0.36 is the averagerelationship between maximum temperature and PET(Turner 1972).
The CDC is calculated from
[5] CDC = D + 0.5PET
Because the scale length of the CDC is one-half that of theoriginal scale used by Turner (1972), the value of PET ishalved (see Van Wagner 1987). A CDC rating of 200 is high,and 300 or more is extreme, indicating that fire will involvedeep subsurface and heavy fuels (Van Wagner 1987).
Calculation of the RP (eq. 1) for April 2 is realised usingthe CDC value (eq. 5) and the ER (eq. 2) of April 1. Usingthe RP result from April 2, eqs. 3 and 4 are processed forcalculation of the April 2 CDC value. This procedure is re-peated until October 31. Calculation of next year’s CDC isstarted at April 1 with an RP value of 771. In our corridor,the probability that a current drought persists the following
year as a result of insufficient winter precipitation isminimal (overwintering effect, Van Wagner 1987). Thus, noadjustment was made to the CDC calculation.
The effect of snowmelt on the starting value of the CDCwas simulated accordingly with Turner’s (1972) criteria. Thesnowmelt date is assumed to be the time at which the forestfloor is saturated with water (usually occurs in May) andclosely corresponds with a decreasing RP of five units a dayfor 3 days. The procedure that accounts for snowmelt wasmade as follows. For a given year, the CDC was calculatedusing eqs. 1–5 with an RP starting value of 771 set atApril 1 (refer to eq. 1). Then, the output of the RP calcula-tion was monitored, beginning in April. The initial value of771 set at April 1 was delayed to the third consecutive dayof decreasing RP of five units. The CDC was recalculatedfor the whole year based on that new starting date.
Regional monthly average indicesMonthly average CDC data files were created for each
station. Because of changes in measuring instruments and ofstation relocations through time, nonhomogeneity in themonthly indices may be observed among nearby meteoro-logical stations (Mekis and Hogg 1999; Vincent and Gullet1999). A test of homogeneity for identification of nonhomo-geneous stations was performed between each pair of cli-mate data sets according to the Holmes’ (1999) procedure.The Mann–Kendall statistical test for randomness was per-formed on each paired data set. A pass–fail test was made atthe 95% critical limit. All stations failing the test were re-jected, unless the anomalies could be corrected. The regionalmonthly averages of CDC indices were calculated using pro-gram MET (Holmes 1999). In this procedure, the averageand standard deviation were calculated for each month ateach station. The departure for each month and year wasthen calculated and averaged across stations to producemean regional average departures for each month and year.Files of regional mean monthly average CDC indices per cli-matic region were then produced and used in further analy-ses.
Gaps in CDC indices within single meteorological sta-tions (Table 1) were also filled using Holmes’ (1999) proce-
© 2004 NRC Canada
Girardin et al. 107
Station Code Longitude Latitude Elevation Period
F. Boreal Plains*Dauphin 5040675 100°20′W 51°90′N 292 1890–1941Swan River 5042800 101°13′W 52°30′N 347 1910–1998Dauphin A 5040680 100°30′W 51°60′N 305 1943–1998Gilbert Plains 5040985 100°28′W 51°60′N 404 1959–1998Moosehorn 5041800 98°37′W 51°18′N 250 1910–1963Russell Barnardo 5042522 101°20′W 50°59′N 558 1896–1906Ashern 5040120 98°22′W 52°08′N 263 1967–1989Russell 5012520 101°17′W 50°46′N 567 1884–1990Cumberland House 4071960 102°18′W 53°58′N 271 1937–1964Minnedosa 5011760 99°50′W 50°16′N 521 1881–1998Fort Ellice 5010977 101°14′W 50°25′N NA 1890–1894Birtle 5010240 101°30′W 50°26′N 522 1917–1995
Note: Elevation (m) is above sea level. NA, not available.*The Boreal Plains regional data set was created using the first nine weather stations listed. Remaining miss-
ing values within the regional data set were estimated using three other stations (i.e., Minnedosa, Fort Ellice,and Birtle) located southward.
Table 1 (concluded).
I:\cjfr\cjfr3401\X03-195.vpJanuary 12, 2004 11:50:23 AM
Color profile: Generic CMYK printer profileComposite Default screen

dure. Missing monthly values were estimated by calculatingthe value with a departure from the mean for the month atthat station equal to the average departure of the other sta-tions for that month and year. The standard deviation for themonth at that station was multiplied by the regional averagedeparture for the month and year, and the mean value for themonth at the station was added. New files with estimateddata were produced.3 These data sets were developed fordistribution in the scientific community and are not usedthroughout this paper.
Trends, periodicities, and spatial correlationThe presence of a linear trend in the regional mean
monthly average CDC was determined using linear regres-sion analyses for the period 1913–1998. This period waschosen so that all analyses could be performed on the samesample size. Autocorrelation analyses, monthly lagged cor-relation analyses, and Durbin–Watson tests were also per-formed on the indices. The presence of autocorrelation wastested, as autocorrelation reduces the effective number ofindependent observations and thus reduces the degrees offreedom used to determine the confidence in estimates ofcorrelation coefficients (Legendre and Legendre 1998).
Continuous wavelet transform (CWT) spectrums were cre-ated for identification of nonstationary periodicities withinCDC indices (Lau and Weng 1995). CWTs were processedfrom a nonorthogonal Morlet 6 wavelet basis, a Gaussian-windowed complex sinusoid (Torrence and Compo 1998;Program AutoSignal (version 1.5), AISN Software 1999).The wavelet basis was selected so that the time–space do-main is maximized in length over the spectral–space domain(Torrence and Compo 1998). All time series were normal-ized before processing the CWT spectrums. Zero paddingwas used to eliminate the wraparound effect (see Torrenceand Compo 1998).
Spatial patterns among the monthly average CDC indiceswere examined using S-mode principal component (PC)analyses performed on correlation matrices (Yarnal 1993;Legendre and Legendre 1998; ter Braak and Smilauer 1998;Barry and Carleton 2001). In this procedure, the monthlyCDC data sets were transformed into new sets of monthlycomposite variables. The amount of variability is describedusing the same number of variables, but with the first princi-pal component (PCI) accounting for the maximum possibleproportion of the variance. Succeeding PCs, in turn, accountfor as much of the residual variance as possible. Eigen-vectors, or the loading of each CDC indices on each compo-nent, gives the spatial representation of the PCs.
Ocean–atmosphere circulationsComposite maps performed on 500-hPa geopotential
heights, which approximate the actual height above sea levelof the 500-hPa pressure surface, were created with the aid ofthe National Oceanic and Atmospheric Administration –Cooperative Institute for Research in Environmental Sci-ences (NOAA–CIRES) Climate Diagnostics Center, Boulder,Colo. (Kalnay et al. 1996; www.cdc.noaa.gov). The 500-hPagrid has a global spatial coverage of 2.5° latitude × 2.5° lon-
gitude with 144 × 73 points and a temporal coverage of1948 to present, with output every 6 h. Daily 500-hPa heightswere averaged by months for each grid point. 500-hPaanomalies (expressed in m) were calculated for each calen-dar month and at each grid point based on the period 1968–1996. Composites were created for seasons of 10 severe (10highest CDC values) and 10 low (10 lowest CDC values)drought conditions. These seasons represent the upper andlower 20% of the sample population.
Coherency between CDC indices and atmospheric circula-tion indices at various time and period scales were identifiedusing the cross product of the CWTs (Torrence and Compo1998; Torrence and Webster 1998). For comparison, perio-dicities showing coherency were reconstructed with the useof spectral components isolated in the time–frequency do-main. The atmospheric circulation patterns under study arethe North Atlantic Oscillation (NAO; Hurrell 1995), the Pa-cific Decadal Oscillation (PDO; Mantua et al. 1997), and theSouthern Oscillation (SO; Ropelewski and Jones 1987).
The NAO is defined as the north–south sea level pressuredipolar pattern, with one of the centres located over PontaDelgada, Azores, and the other one approximately over Ice-land. A positive NAO value indicates strong midlatitudewesterlies and is characterized by an intense Iceland Lowwith a strong Azores Ridge to its south. A negative NAOvalue indicates that the signs of these anomaly cells are re-versed. Over the subtropical Pacific, the SO reflects a differ-ence in sea level pressures between Tahiti and Darwin. Apositive SO is an indication that sea level pressure is higherthan normal in the Southeast Pacific. Finally, the PDO con-sists of the leading PC of the North Pacific monthly SSTpoleward of 20°N. A negative PDO value is an indicationthat SSTs are anomalously warm in the interior North Pa-cific and cool along the Pacific Coast.
Drought and fire historyThe CDC indices were correlated with forest area burned
(surface burned per year per climatic region) and forest firefrequency (number of fires per year per climatic region) us-ing PC analyses. Fire statistics were introduced as supple-mentary variables and do not affect the formation of thePCs; the PCs are the linear combinations of the meanmonthly average CDC indices. Forest fire statistics werecompiled for each climatic region using the forest fire dataset of Stocks et al. (2003; period 1959–1998). The forest firedata set only includes fires greater than 200 ha in final size.This represents only a few percent of all fires, but accountsfor most of the area burned (more than 97%, Stocks et al.2003). The forest fire – CDC comparison is made withoutconsideration for the time (i.e., month) and cause of fire ig-nition. According to Skinner et al. (1999), 84% of all totalarea burned in Canada occurs during June, July, and August.
Results
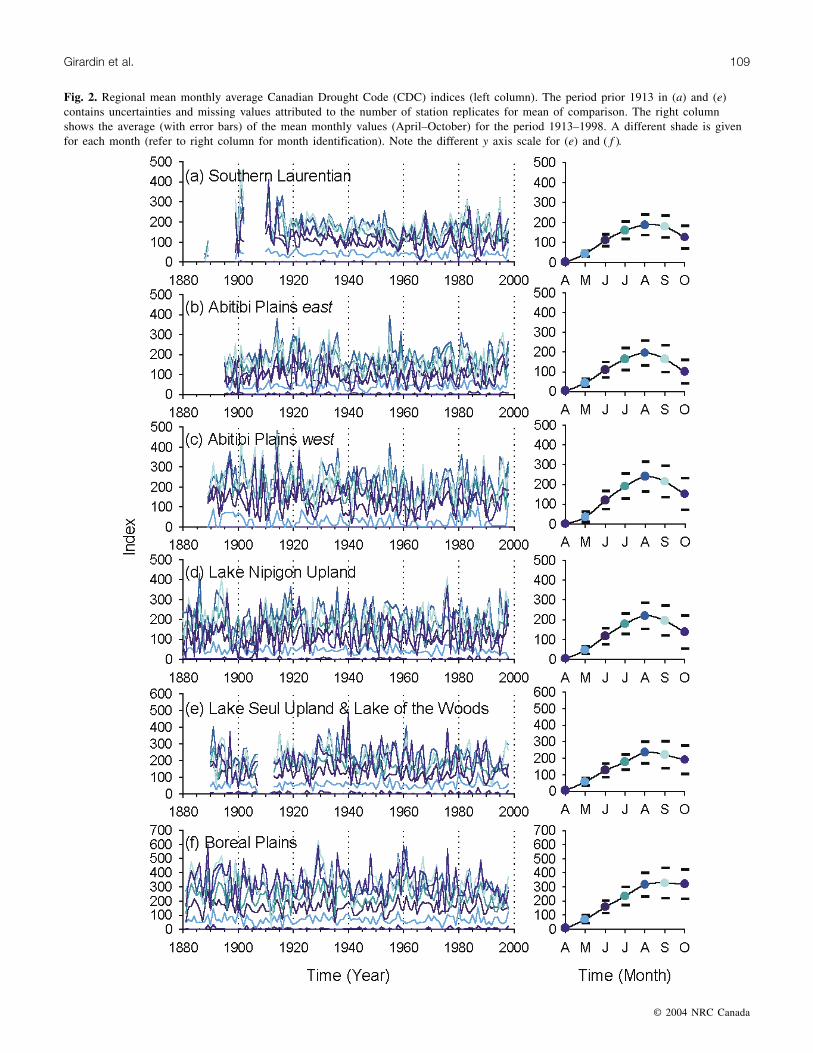
Monthly trendsAcross the corridor under study, the month during which
maximum drought severity is attained is August (Fig. 2).
© 2004 NRC Canada
108 Can. J. For. Res. Vol. 34, 2004
3 Supplementary data for this article are available on the Web site or may be purchased from the Depository of Unpublished Data, DocumentDelivery, CISTI, National Research Council Canada, Ottawa, ON K1A 0S2, Canada. DUD 3541. For more information on obtaining mate-rial refer to http://www.nrc.ca/cisti/irm/unpub_e.shtml.
I:\cjfr\cjfr3401\X03-195.vpJanuary 12, 2004 11:50:23 AM
Color profile: Generic CMYK printer profileComposite Default screen
© 2004 NRC Canada
Girardin et al. 109
Fig. 2. Regional mean monthly average Canadian Drought Code (CDC) indices (left column). The period prior 1913 in (a) and (e)contains uncertainties and missing values attributed to the number of station replicates for mean of comparison. The right columnshows the average (with error bars) of the mean monthly values (April–October) for the period 1913–1998. A different shade is givenfor each month (refer to right column for month identification). Note the different y axis scale for (e) and ( )f .
I:\cjfr\cjfr3401\X03-195.vpJanuary 12, 2004 11:50:28 AM
Color profile: Generic CMYK printer profileComposite Default screen

Drought severity decreases in September in climatic regionsA, B, C, D, and E. In region F, it remains stable from Au-gust to October. Monthly lagged correlation analyses(Fig. 3) further suggest significant persistence in themonthly CDC indices (e.g., droughts that occur in June alsooccur in July (p < 0.001), August (p < 0.05), and September(p < 0.05)).
The CDC indices shown in Fig. 2 indicate that episodes ofextreme drought conditions (values greater than 300) con-stantly occur within region F. This contrasts with the easternregions, which experienced a marked decrease in the fre-quency of extreme drought conditions in the early 1900s.Linear regression analyses performed on the monthly aver-age CDC indices (Table 2), however, indicate no generaltrend toward a decrease or increase in drought severityacross the corridor (only 1 significant result out of 42 tests).None of the CDC indices contain autocorrelation (Table 2).
Analyses of periodicitiesFor simplification, nonstationary periodic signals were ex-
amined within the July mean monthly average CDC indicesonly. The high monthly autocorrelation (see Fig. 3) justifiedthe assumption that the variance within the month of July isalso representative of June and August. Figure 4 indicatesthat all climatic regions display high power in the frequencyband 0.20–0.50 cycles/year (2–5 years/cycle). Power is
© 2004 NRC Canada
110 Can. J. For. Res. Vol. 34, 2004
Fig. 3. Monthly lagged Pearson’s correlation coefficients. Analy-ses were conducted for the period 1913–1998. The thick lineshows the correlation coefficient between a month and the fol-lowing one (e.g., April vs. May). The thin line shows the corre-lation coefficient with the second following month (e.g., Aprilvs. June). The dashed line shows the correlation coefficient withthe third following month. The significance level at p < 0.05 isgiven by the dotted line.
Month R Slope p D–W Auto-R
A. Southern LaurentianApril 0.07 0.01 0.51 1.88 0.02May 0.01 0.00 0.95 2.17 –0.10June 0.06 –0.07 0.58 2.06 –0.03July 0.16 –0.28 0.13 2.00 –0.02August 0.18 –0.37 0.09 1.83 0.07September 0.12 –0.25 0.29 1.79 0.10October 0.00 –0.23 0.35 1.91 0.04
B. Abitibi Plains eastApril 0.15 0.03 0.17 1.86 0.07May 0.05 0.04 0.62 2.33 –0.21June 0.05 –0.08 0.64 1.90 0.03July 0.10 –0.22 0.37 2.17 –0.10August 0.09 –0.22 0.43 1.77 0.10September 0.07 –0.18 0.54 1.79 0.10October 0.00 –0.25 0.34 1.93 0.03
C. Abitibi Plains westApril 0.03 0.00 0.78 1.84 –0.01May 0.07 0.07 0.51 2.06 –0.08June 0.02 0.03 0.87 1.67 0.16July 0.12 –0.31 0.26 2.08 –0.06August 0.19 –0.59 0.07 2.02 –0.02September 0.17 –0.55 0.12 2.00 0.01October 0.21 –0.67 0.05* 2.14 –0.07
D. Lake Nipigon UplandApril 0.04 0.01 0.71 2.24 –0.12May 0.16 –0.12 0.15 2.20 –0.05June 0.02 0.03 0.86 1.93 –0.01July 0.09 –0.17 0.44 2.06 –0.07August 0.12 –0.32 0.27 2.09 –0.05September 0.01 –0.04 0.91 2.11 –0.07October 0.08 –0.28 0.44 2.15 –0.09
E. Lac Seul Upland and Lake of the WoodsApril 0.02 0.01 0.83 2.13 –0.10May 0.01 0.01 0.92 2.13 –0.07June 0.05 –0.09 0.63 1.83 0.08July 0.19 –0.36 0.08 1.80 0.09August 0.01 –0.37 0.20 1.90 0.04September 0.12 –0.38 0.29 2.09 –0.05October 0.13 –0.44 0.24 2.05 –0.03
F. Boreal PlainsApril 0.07 0.02 0.52 2.05 –0.08May 0.03 –0.03 0.80 2.30 –0.18June 0.00 –0.01 0.98 2.18 –0.09July 0.08 –0.21 0.46 1.97 –0.01August 0.10 –0.33 0.38 1.85 0.06September 0.15 –0.66 0.16 1.81 0.09October 0.15 –0.62 0.17 2.15 –0.08
Note: R, multiple correlation of the linear trend model; p, analyses ofvariance significance level (hypothesis that the slope of the regression lineis zero is rejected when p < 0.05); D–W, Dublin–Watson statistic (signifi-cant at p < 0.05 if 1.67 > d > 2.33); Auto-R, first-order autocorrelation(significant at p < 0.05 if –0.22 > r > 0.22).
*Significant at p < 0.05.
Table 2. Analyses of Canadian Drought Code (CDC) monthlytrends, period 1913–1998.
I:\cjfr\cjfr3401\X03-195.vpJanuary 12, 2004 11:50:29 AM
Color profile: Generic CMYK printer profileComposite Default screen

higher in climatic regions D, E, and F around 1915, 1935,1945, and 1955. A periodicity of 0.10–0.20 cycles/year (5–10 years/cycle) is observed in climatic regions D and E.Maximum magnitude was attained during 1915–1940 and1945–1965 in region D and during 1975–1990 in region E.The strongest periodicity, in the range of 0.05–0.10 cycles/year (10–20 years/cycle), is observed in climatic regions Band C. The lowest periodicity, in the frequency band 0.02–0.05 cycles/year (20–50 years/cycle), is observed in regionF. Caution should be taken in the interpretation of this sig-nal, as it is located within the cone of influence.
Spatial distribution of the varianceThe identification of basic climatological patterns within
the corridor was performed by decomposing the indices intosix uncorrelated PCs. Scree plots (Yarnal 1993; results notshown) indicated that PCs I, II, and III were to be used inthe interpretation. An exception is found for April, as onlytwo PCs were necessary to describe most of the variation.
Correlation structures (eigenvectors) are shown as correla-tion maps in Fig. 5. There is a distinctive reduction in the
amount of explained variance by the first eigenvector fromApril to July (first column). The percentage of explainedvariance notably decreases by 24.1% to the benefit of eigen-vector II, for which the explained variance increases bymore than 10% (second column). The correlation maps sug-gest that prior to July, only one pattern (PCI) dominates thecorridor. By July, the partitioning of the variance alonghigher eigenvectors (Figs. 5j and 5k) is suggestive of addi-tional patterns. One pattern (explained variance by eigen-vector II) appears over the western climatic regions (Fig. 5,second column), with a variance uncorrelated with the east-ern sector. This pattern slowly retreats from the western sec-tor around August. Another pattern, for which the varianceis explained by eigenvector III, is seen in central Quebec(Fig. 5, third column). This pattern remains present for mostof the drought season, with some monthly variations(Figs. 5k and 5n).
500 geopotential height anomaliesUpper atmospheric circulation anomalies associated with
low and severe drought seasons for the July PCI, PCII, and
© 2004 NRC Canada
Girardin et al. 111
Fig. 4. Continuous wavelet transform (CWT) spectrums of Canadian Drought Code (CDC) indices for July per climatic region. Analy-ses were conducted for the period 1913–1998. The period (years/cycle) of each peak is given by the conversion 1/frequency. The vari-ance (in normalized units) is scaled from 0 to 10, where black area indicates large power. The thick contour line delineates the 5%significance level for white noise. The crosshatched region delineates the cone of influence (area of decreased variance resulting froma discontinuity introduced at the end of the data stream; Torrence and Compo 1998).
I:\cjfr\cjfr3401\X03-195.vpJanuary 12, 2004 11:50:32 AM
Color profile: Generic CMYK printer profileComposite Default screen

© 2004 NRC Canada
112 Can. J. For. Res. Vol. 34, 2004
Fig. 5. First, second, and third eigenvectors of the regional monthly average Canadian Drought Code (CDC) indices for April–October.The shadings indicate the correlation coefficients between the regional indices and the corresponding principal component. Correlationare significant at p < 0.01 when –0.28 > r > 0.28. For each map, the percentage of explained variance is indicated.
I:\cjfr\cjfr3401\X03-195.vpJanuary 12, 2004 11:50:38 AM
Color profile: Generic CMYK printer profileComposite Default screen

PCIII were investigated using composite analyses (refers toFig. 5 for partitioning of the variance). Figure 6a indicatesthat on average, severe drought seasons in Ontario occurredwith the development of positive geopotential height anoma-lies (ridges), with centres over the Baffin Bay (24 m) andthe Gulf of Alaska (20 m). Negative height anomalies(troughs) accompany this over the east and west coasts ofthe U.S.A. During low severity drought seasons, the positiveheight anomaly over Baffin Bay is split and displaced overGreenland, allowing a strong zonal flow (–24 m) to pene-trate from northern Manitoba toward central Quebec(Fig. 6b). This flow further penetrates into the North Atlan-tic basin between 30°N and 50°N (–16 m). The positive
height anomaly over the Gulf of Alaska is displaced abovethe Bering Sea.
Drought seasons in southwestern Manitoba can also de-velop with the occurrence of positive height anomalies, withcentres over the northwestern U.S.A. (10 m), the NorwegianSea (16 m), and the Arctic (16 m) (Fig. 6c). The flow is dis-placed northward over northern Manitoba and Ontario(−10 m), well penetrating in Quebec. During low droughtseasons (Fig. 6d), the northwestern U.S.A. positive heightanomaly is replaced by a negative anomaly (–12 m), whichpenetrates inward Manitoba, while a positive anomaly(14 m) develops in the eastern U.S.A. In addition, the Nor-wegian Sea positive height anomaly is displaced over the
© 2004 NRC Canada
Girardin et al. 113
Fig. 6. The 500-hPa geopotential height anomaly composites (in metres) for 10 seasons of severe and 10 seasons of low drought con-ditions for July: (a, b) principal component (PC) I, (c, d) PCII, and (e, f ) PCIII (period 1948–1998). The May–July season was usedin the calculation of the height data. Years used in the composites are listed above each map (in order of increasing drought severity).
I:\cjfr\cjfr3401\X03-195.vpJanuary 12, 2004 11:50:40 AM
Color profile: Generic CMYK printer profileComposite Default screen

Baffin Bay, while the positive anomaly over the Arcticweakens. This configuration of positive and negative heightanomalies that reverses from severe drought to low droughtseasons would explain much of the negative correlation ob-served in PCII between eastern and central Canada (refer toFig. 5j).
Drought seasons in central Quebec can also coincide withthe occurrence of a positive height anomaly (10 m) centredover the Great Lakes (Fig. 6e). This anomaly displaces theflow over northeastern Quebec. This is also accompanied bypositive height anomalies over the northeast of Gulf ofAlaska (20 m), the Arctic (25 m), and Iceland (20 m). Dur-ing low drought seasons (Fig. 6f), a negative height anomalyreplaces the positive anomaly located over the Great Lakes.This negative height anomaly is surrounded by a positiveanomaly with split centres over the Baffin Bay and over thewestern coast.
Atmosphere–ocean circulation indicesThe origin of the variance within the July PCI, PCII, and
PCIII was also examined using atmospheric circulation indi-ces (NAO, PDO, and SO). First, the Mann–Whitney statisti-cal test was performed to test for differences in mean amongsamples of NAO, PDO, and SO indices at the time of the 10highest (severe droughts) and the 10 lowest CDC values (pe-riod 1913–1998). For the analyses of PCI, the test indicatedstatistically significant differences at p < 0.01 between themeans of NAO during severe and low drought seasons. Onaverage, severe drought seasons correspond with positiveNAO values (mean of 0.67), while low drought seasons cor-respond with negative NAO values (mean of –0.75). A simi-lar relationship at p < 0.05 was seen in PCIII. Severedrought seasons occur in conjunction with decreased NAOvalues (mean of –1.12 for severe vs. 0.03 for low). Tests per-formed on PCII and on SO and PDO indices werenonsignificant.
Coherencies between CDC indices and atmospheric circu-lation pattern indices in time and period scales were investi-gated by crossing CWTs of July PCI, PCII, and PCIII withCWTs of the atmospheric circulation indices (May–July sea-sonal average). The NAO demonstrates the strongest coher-ency with PCI (with peaks similar to Figs. 4b, 4c) and tosome extent with PCII and PCIII (Figs. 7a–7c). The coher-ency shifts from one band to another, being at 0.05–0.20cycles/year in the first half of the century and around 0.50–0.10 cycles/year in the middle (Fig. 7a). Reconstruction ofthe 0.05–0.20 cycles/year (5–20 years/cycle) waveform(Fig. 8a) shows that this NAO modulation would explainmuch of the variance within PCI from 1913 to 1962 (R2 of17.3%, p < 0.01). The relationship is no longer significantfor the period post-1962 (decoupling between the NAOwaveform and PCI beginning in the 1970s).
The PDO is demonstrating coherency with the PCs,mainly in the low frequency band (0.02–0.05 cycles/year)(Figs. 7d–7 f ). Reconstruction of the 20–25 years/cyclewaveforms, however, demonstrates that this coherency con-trasts among climatic regions. In PCII, this coherency is inphase and positive (Fig. 8b). In PCIII, the coherency is inphase, but negative (Fig. 8c). The PDO modulation wouldexplain much of the low frequencies seen in Figs. 4e and 4f.As for the SO, peaks unique to the pattern are present ca.
1910–1920 (Fig. 7i) and ca. 1970–1990 (Fig. 7h) in the band0.13–0.30 cycles/year. Other peaks in the band 0.20–0.50cycles/year are seen in the 1910s, the 1940s–1950s, and the1990s.
Drought severity and fire historyCorrelation maps presented in Fig. 9 indicate good agree-
ment between area burned and drought severity. The droughtseverity variance associated with the first eigenvector(Fig. 9a) is significantly correlated with the seasonal areaburned in climatic region D. The drought severity varianceassociated with the second eigenvector (Fig. 9b) is signifi-cantly correlated with area burned in climatic region F. Thedrought severity variance associated with the third eigen-vector (Fig. 9c) correlates significantly with area burned inregions A and B (both correlations are of 0.31). The analysisperformed on fire frequency indicates very similar tenden-cies (except for the second eigenvector for which resultswere nonsignificant). July CDC indices are representative ofthe overall variance in seasonal area burned and fire fre-quency (based on analyses of fires with final area greaterthan 200 ha; period 1959–1998).
Discussion
Trends, periodicities, and varianceLinear regressions analyses performed on CDC indices in-
dicate that 20th century linear increases in summer tempera-ture and in the amount and frequency of precipitation (Mekisand Hogg 1999; Zhang et al. 2000, 2001) have no significantimpact on the moisture balance of the deep organic layer.However, other components of the boreal forest’s water bal-ance may be affected by climate change (e.g., more or lessrainfall could be intercepted by the canopy, the fine fuels,and the duff layer). Critical investigation of the FWI andeach of its compartments should thus be performed. Studiesshould focus on average, minimum, and maximum monthlyand seasonal values and on length of the seasons.
The absence of trends within the CDC indices suggeststhat factors other than a linear change in climate contributedto the shift in the eastern Canada’s boreal forest dynamicsover the past 150 years (Bergeron 2000; Bergeron et al.2001). This interpretation assumes that the processes regu-lating the fire regime are stationary in time (i.e., they remainunchanged from one period to another). Our results thus givecredence to Bergeron and Archambault (1993) and Lefort etal. (2003), who suggested that an increase in the fire cyclelength (i.e., length of time required to burn an area equal insize to a specified area) since the 1850s in the eastern Cana-dian boreal forest is a response to a decrease in the fre-quency of events conducive to extreme fire conditions.These extreme drought events would be similar to those ex-perienced during the 1910s and 1920s (Figs. 2a–2c), the pe-riod of largest area burned over the past 150 years in theAbitibi Plains (Bergeron et al. 2001). The 1850s phenomenacould be attributed to a shift in atmospheric circulation andits drivers (PDO and NAO variability; Girardin et al. 2002;Girardin et al. In press), possibly a decrease in the frequencyof occurrence of the 500-hPa geopotential height configura-tion seen in Fig. 6a.
© 2004 NRC Canada
114 Can. J. For. Res. Vol. 34, 2004
I:\cjfr\cjfr3401\X03-195.vpJanuary 12, 2004 11:50:41 AM
Color profile: Generic CMYK printer profileComposite Default screen

© 2004 NRC Canada
Girardin et al. 115
Fig
.7.
Cro
ss-c
onti
nuou
sw
avel
ettr
ansf
orm
(CW
T)
pow
ersp
ectr
ums
ofpr
inci
pal
com
pone
nt(P
C)
I,P
CII
,an
dP
CII
Iag
ains
tth
eN
orth
Atl
anti
cO
scil
lati
on(N
AO
),th
ePa
cifi
cD
ecad
alO
scil
lati
on(P
DO
),an
dth
eS
outh
ern
Osc
illa
tion
(SO
).T
heva
rian
ce(i
nno
rmal
ized
unit
s)is
scal
edfr
om0
to20
,w
here
abl
ack
area
indi
cate
sco
here
ncy
betw
een
two
tim
ese
ries
inti
me
and
peri
odsc
ales
.T
heth
ick
cont
our
line
deli
neat
esth
e5%
sign
ific
ance
leve
l.
I:\cjfr\cjfr3401\X03-195.vpJanuary 12, 2004 11:50:42 AM
Color profile: Generic CMYK printer profileComposite Default screen

Synoptic climatologyOur eigenvectors analysis suggests that the dominant
mode of atmospheric circulation over the corridor resemblesa strong zonal flow (latitudinal winds) accompanied by aweak meridional component that develops in July (longitudi-nal winds). The persistence of the high-pressure anomalieseither over or upstream of the affected sector contributes tothe development of the meridional flow. Bonsal et al. (1999)and Skinner et al. (1999) suggest that under these condi-tions, a northward and southward deflection of the moisture-carrying systems occurs. The subsistence of air (warmingand drying) associated with the positive anomalies contrib-utes to the development of a water deficit, given the absenceof precipitation and increase in surface evaporation (Skinneret al. 1999). This mechanism is conducive to the occurrenceof severe drought seasons and large seasonal area burned(Skinner et al. 1999).
Causes for interannual and interdecadal variations indrought severity have been briefly investigated, with thecomposites and the coherency analyses conducted on domi-nant atmospheric circulation patterns. Although it is recog-nised that these are mostly winter circulation patterns,several investigations have concluded that they are strongenough during summer to affect regional climate (Bonsal etal. 1993; Bonsal and Lawford 1999; Skinner et al. 1999).Based on the cross-CWT analyses, the NAO has been active
in the summer period, particularly in the centre of the corri-dor. The coherency was stronger in the frequency band of 5–20 years/cycle, with a shift around the mid-century towardan increase in interannual forcing. The relationship appearsto be decoupled since the 1970s. A response in lower fre-quencies (20–25 years/cycle) also appears to be emergingfrom the North Pacific. However, given the length of thedata array and the limited number of wavelengths in the lowfrequency band, it is difficult to fully quantify the PDO re-sponse.
As pointed out by Yarnal et al. (2001), several studieshave documented the instability of the atmosphere–surfacerelationships and further raised serious questions about thelong-term reliability of climate prediction models (such asgeneral circulation models). Circulation patterns are dy-namic, and wide variations in their amplitude and periodici-ties occurred over the last 3 centuries (Stahle et al. 1998;Luterbacher et al. 2002; D’Arrigo et al. 2001; Girardin et al.2002). Trying to determine the true relationships betweenthe oceans and the atmosphere is also a great challenge,given the numerous inconsistencies among authors who at-tempted the task (Mehta et al. 2000; Robertson et al. 2000;Seager et al. 2000). This may be complicated by the non-stationarity and nonlinearity of the ocean atmosphere cou-plings, but also by the length of the instrumental time series,which seriously limits the interpretation of the low fre-quency signals. A comprehensive study of the multicenturyclimate change based on proxy data may be a prerequisitefor the understanding of the present and prediction of the fu-ture climates.
Limitation of the CDCThe CDC is a meteorological estimate, not an absolute
drought index (Turner 1972). By using the Thornthwaite andMather (1955) potential evapotranspiration models, the CDCcalculation makes no allowance for seasonal changes in veg-etation but only in daylight length (see Turner 1972). Tem-poral vegetation changes affect the water balance, as thedevelopment of herbs and shrubs tends to preserve groundmoisture (Hély et al. 2000). This effect may, however, becounteracted by the development of the foliage, which con-tributes to increasing plant transpiration. In addition, theamount of precipitation (eq. 2) allocated for canopy inter-ception in the CDC calculation procedure is arbitrary andmay vary from one stand type to another, reflecting changesin vegetation. Other potential evapotranspiration estimationproblems may be encountered because soil type, drainage,slope, watershed, atmospheric turbidity, cloudiness, changesin atmospheric CO2, as well as many other meteorological,geological, and ecological parameters that can affect soilmoisture content are not accounted for.
Other uncertainties within the CDC indices arise from ex-ceptionally dry springs caused by an insufficient amount ofsnow. It is recognised that weather stations in Canada gener-ally receive enough winter precipitation to saturate the CDClayer at spring (Turner and Lawson 1978; Alexander 1982).Exceptional years may, however, occur in regions west ofLake Nipigon and in the Great Plains. As the monthlylagged correlation between CDC indices decreases impor-tantly from May to July (drought variability in May non-correlated with that of July), this limitation may be of minor
© 2004 NRC Canada
116 Can. J. For. Res. Vol. 34, 2004
Fig. 8. Examples of coherencies among principal component(PC) analysis loadings (thin lines) and atmospheric circulationpattern indices. In (a) are shown 5- to 20-year waveforms. In (b)and (c) are shown 20- to 25-year waveforms. Waveforms associ-ated with the PCs are shown as thick, black, smoothed lines.Waveforms associated with the circulation indices appear asthick, grey lines. The Kendall’s rank correlation coefficient (withp value) is given for each pair of waveforms. NAO, North Atlan-tic Oscillation; PDO, Pacific Decadal Oscillation.
I:\cjfr\cjfr3401\X03-195.vpJanuary 12, 2004 11:50:44 AM
Color profile: Generic CMYK printer profileComposite Default screen

importance in the investigation of summer drought variabil-ity within our corridor. Studies to be conducted elsewherecould necessitate adaptations to the CDC calculation.
Summary
This paper summarizes the construction of a network ofmonthly average CDC indices using 62 meteorological sta-tions distributed across the corridor extending from centralQuebec to western Manitoba, in the range of the southernCanadian boreal forest. These records were used for the con-struction of regional CDC indices in six climatic regions.Linear trends fitted on the regional mean monthly averagesrevealed no major changes in summer drought severity from1913 to 1998.
This paper also demonstrates the potential use of CDC in-dices in synoptic climatology. Composites and coherencyanalyses indicated that the North Atlantic and the North Pa-cific circulation patterns demonstrate the strongest relation-ship with the drought variance. The coherencies, however,occur in a decadal scale, and the CDC data length seriouslylimits our interpretation of the responses. Validation of theserelationships may require the use of long paleoclimatic re-cords. Combined with regional fire history studies developedfrom forest stand age distributions, paleoclimatic analysesmay provide useful insights on the causes of the changes ineastern Canada’s forest fire regime. Such understandingwould benefit the prediction of the response of the borealforest to the anticipated climate change.
Acknowledgements
We acknowledge the Sustainable Forest Management Net-work (SFM) for funding this research and supportingM.P. Girardin. This author was also supported by the FondsQuébécois de la Recherche sur la Nature et les Technologiesand by Groupe de recherche en écologie forestière inter-universitaire (GREFI), Université du Québec à Montréal. Wethank Dr. Christopher Torrence, Dr. Richard Holmes, theNational Oceanic and Atmospheric Administration (NOAA),the Cooperative Institute for Research in Environmental Sci-ences (CIRES), the Climate Diagnostics Center (CDC), theNational Centers for Environmental Prediction (NCEP), theNational Center for Atmospheric Research, and the Meteo-rological Service of Canada for their aid and contribution ofdata and (or) software. This manuscript was improvedthrough the comments of Héloïse Le Goff, Dr. D. Maynard,and two anonymous reviewers.
References
AISN Software. 1999. AutoSignal, version 1.5 for Windows. SPSSInc., Chicago, Ill.
Alexander, M.E. 1982. Calculating spring Drought Code startingvalues in the Prairie Provinces and Northwest Territories. Envi-ronment Canada. Canadian Forest Service, Northern ForestryCentre, Edmonton, Alta. For. Manage. Note 12.
Archambault, S., and Bergeron, Y. 1992. An 802-year tree-ringchronology from the Quebec boreal forest. Can. J. For. Res. 22:674–682.
© 2004 NRC Canada
Girardin et al. 117
Fig. 9. Correlations maps demonstrating the relationship between drought severity and area burned (a, b, c) and fire frequency (d, e, f)(period 1959–1998). The eigenvectors I, II, and III denote the correlation between the principal components (computed from the Julymean monthly average Canadian Drought Code (CDC) indices) and the fire statistics. Correlations are significant at p < 0.05 when−0.31 > r > 0.31 (significant correlation coefficients are shown on maps). For each map, the percentage of explained variance is indi-cated.
I:\cjfr\cjfr3401\X03-195.vpJanuary 12, 2004 11:50:47 AM
Color profile: Generic CMYK printer profileComposite Default screen

Barlow, M., Nigam, S., and Berbery, E.H. 2001. ENSO, Pacific de-cadal variability, and U.S. summertime precipitation, drought,and stream flow. J. Clim. 14: 2105–2128.
Barry, R.G., and Carleton, A.M. 2001. Synoptic and dynamic cli-matology. Routledge, New York.
Bergeron, Y. 2000. Species and stand dynamics in the mixedwoods of Quebec’s boreal forest. Ecology, 81: 1500–1516.
Bergeron, Y., and Archambault, S. 1993. Decreasing frequency offorest fires in the southern boreal zone of Quebec and its rela-tion to global warming since the end of the ‘Little Ice Age’. Ho-locene, 3: 255–259.
Bergeron, Y., and Dubuc, M. 1989. Succession in the southern partof the Canadian boreal forest. Vegetatio, 79: 51–63.
Bergeron, Y., Gauthier, S., Kafka, V., Lefort, P., and Lesieur, D.2001. Natural fire frequency for the eastern Canadian boreal for-est: consequences for sustainable forestry. Can. J. For. Res. 31:384–391.
Bergeron, Y., Denneler, B., Charron, D., and Girardin, M.P. 2002.Using dendrochronology to reconstruct disturbance and forestdynamics around Lake Duparquet, northwestern Quebec. Den-drochronologia, 20: 175–189.
Bonsal, B.R., and Lawford, R.G. 1999. Teleconnections betweenEl Niño and La Niña events and summer extended dry spells onthe Canadian Prairies. International Journal of Climatology, 19:1445–1458.
Bonsal, B.R., Chakravarti, A.K., and Lawford, R.G. 1993. Tele-connections between North Pacific SST anomalies and growingseason extended dry spells on the Canadian Prairies. Interna-tional Journal of Climatology, 13: 865–878.
Bonsal, B.R., Zhang, X., and Hogg, W.D. 1999. Canadian Prairiesgrowing season precipitation variability and associated atmo-spheric circulation. Clim. Res. 11: 191–208.
Carcaillet, C., Bergeron, Y., Richard, P., Fréchette, B., Gauthier, S.,and Prairie, Y. 2001. Change of fire frequency in the eastern Ca-nadian boreal forests: Does vegetation composition or climatetrigger the fire regime? J. Ecol. 89: 930–946.
D’Arrigo, R., Villalba, R., and Wiles, G. 2001. Tree-ring estimatesof Pacific decadal climate variability. Climate Dynamics, 18:219–224.
Ecological Stratification Working Group. 1996. A national ecologi-cal framework for Canada. Agriculture and Agri-Food Canadaand Environment Canada, Ottawa, Ont.
Environment Canada. 2000. Canadian daily climate data: tempera-ture and precipitation. Meteorological Service of Canada, Cli-mate Monitoring and Data Interpretation Division of the ClimateResearch Branch, Downsview, Ont.
Environment Canada 2002. Canadian Climate Normals 1971–2000.Canadian Climate Program, Environnement Canada, Atmo-spheric Environnement Service, Downsview, Ont.
Flannigan, M., and Harrington, J.B. 1988. A study of the relationof meteorology variables to monthly provincial area burned bywildfire in Canada 1953–1980. J. Appl. Meteorol. 27: 441–452.
Flannigan, M.D., and Wotton, B.M. 2001. Climate, weather, andarea burned. In Forest fires. Edited by E.A. Johnson and K.Miyanishi. Academic Press Inc., New York. pp. 351–373.
Flannigan, M.D., Cambell, I., Wotton, M., Carcaillet, C., Richard,P., and Bergeron, Y. 2001. Future fire in Canada’s boreal forest:paleoecology results and general circulation model – regionalclimate model simulations. Can. J. For. Res. 31: 854–864.
Girardin, M.P., Tardif, J., and Bergeron, Y. 2001. Radial growthanalysis of Larix laricina from the Lake Duparquet area, Que-bec, in relation to climate and larch sawfly outbreaks.Ecoscience, 8: 127–138.
Girardin, M.P., Tardif, J., Flannigan, M.D., and Bergeron, Y. 2002.Multicentury reconstruction of the Canadian Drought Code,eastern Canada, and its relationships with atmospheric circula-tion. In Abstracts for the 6th International Conference on Den-drochronology — Dendrochronology, Environmental Changeand Human History, Université Laval, Québec, Que., 22–27 Au-gust 2002. Edited by M. Lindholm et al. Université Laval, Qué-bec. pp. 119–121.
Girardin, M.P., Tardif, J., Flannigan, M.D., and Bergeron, Y. Inpress. Multicentury reconstruction of the Canadian DroughtCode from eastern Canada and its relationships with paleo-climatic indices of atmospheric circulation. Climate Dynamics.
Hély, C., Bergeron, Y., and Flannigan, M.D. 2000. Effects of standcomposition on fire hazard in the mixedwood Canadian borealforest. J. Veg. Sci. 11: 813–824.
Holmes, R.L. 1999. Dendrochronology program library and thedendroecology program library. Laboratory of Tree-Ring Re-search, University of Arizona, Tucson, Ariz.
Houghton, J.T., Ding, Y., Griggs, D.J., Noguer, M., Van der Lin-den, P.J., Xiaosu, D., Maskell, K., and Johnson, C.A. 2001. Cli-mate change 2001: the scientific basis. Contribution of WorkingGroup I to the third assessment report of the IntergovernmentalPanel on Climate Change (IPCC). Cambridge University Press,Cambridge, U.K.
Hurrell, J.W. 1995. Decadal trends in the North Atlantic Oscilla-tion regional temperatures and precipitation. Science (Washing-ton, D.C.), 269: 676–679.
Kalnay, E., Kanamitsu, M., Kistler, R., Collins, W., Deaven, D.,Gandin, L., Iredell, M., Saha, S., White, G., Woollen, J., Zhu,Y., Chelliah, M., Ebisuzaki, W., Higgins, W., Janowiak, J., Mo,K.C., Ropelewski, C., Wang, J., Leetmaa, A., Reynolds, R.,Jenne, R., and Joseph, D. 1996. The NCEP/NCAR reanalysis40-year project. Bull. Am. Meteorol. Soc. 77: 437–471.
Lau, K.M., and Weng, H.Y. 1995. Climate signal detection usingwavelet transform: how to make a time series sing. Bull. Am.Meteorol. Soc. 76: 2391–2402.
Lefort, P., Gauthier, S., and Bergeron, Y. 2003. The influence offire weather and land use on the fire regime of the Lake Abitibiarea, eastern Canada. For. Sci. 49: 509–521.
Legendre, P., and Legendre, L. 1998. Numerical ecology. ElsevierScience Inc., New York.
Luterbacher, J., Xoplaki, E., Dietrich, D., Rickli, R., Jacobeit, J.,Beck, C., Gyalistras, D., Schmutz, C., and Wanner, H. 2002. Re-construction of sea level pressure fields over the Eastern NorthAtlantic and Europe back to 1500. Climate Dynamics, 18: 545–561.
Mantua, N.J., Hare, S.R., Zhang, Y., Wallace, J.M., and Francis,R.C. 1997. A Pacific decadal climate oscillation with impacts onsalmon. Bull. Am. Meteorol. Soc. 78: 1069–1079.
Mehta, V.M., Suarez, M.J., Mangenello, J., and Delwoth, T.L.2000. Oceanic influence on the North Atlantic Oscillation andassociated Northern Hemisphere climate variations. Geophys.Res. Lett. 27: 121–124.
Mekis, E., and Hogg, W.D. 1999. Rehabilitated and analysis of Ca-nadian daily precipitation time series. Atmos.–Ocean, 37: 53–85.
Murphy, P.J., Mudd, J.P., Stocks, B.J., Kasischke, E.S., Barry, D.,Alexander, M.E., and French, N.H.F. 2000. Historical fire re-cords in the North American boreal forest. In Fire, climatechange, and carbon cycling in the boreal forest. Edited byE.S. Kasischke and B.J. Stocks. Springer Publishing Company,New York. pp. 274–288.
Nigam, S., Barlow, M., and Berbery, E.H. 1999. Analysis links Pa-cific decadal variability to drought and streamflow in the UnitedStates. EOS, 80: 621–625.
© 2004 NRC Canada
118 Can. J. For. Res. Vol. 34, 2004
I:\cjfr\cjfr3401\X03-195.vpJanuary 12, 2004 11:50:48 AM
Color profile: Generic CMYK printer profileComposite Default screen
Robertson, B.W., Mechoso, C.R., and Kim, Y.-J. 2000. The influ-ence of Atlantic sea surface temperature anomalies on the NorthAtlantic Oscillation. J. Clim. 13: 122–138.
Ropelewski, C.F., and Jones, P.D. 1987. An extension of the Tahiti-Darwin Southern Oscillation Index. Mon. Weather Rev. 115:2161–2165.
Seager, R., Kushnir, Y., Visbeck, M., Naik, N., Miller, J.A.,Krahmann, G., and Cullen, H.M. 2000. Causes of AtlanticOcean climate variability between 1958 and 1998. J. Clim. 13:2845–2862.
Skinner, W.R., Stocks, B.J., Martell, D.L., Bonsal, B., and Shabbar,A. 1999. The association between circulation anomalies in themid-troposphere and the area burned by wildland fire in Canada.Theor. Appl. Clim. 63: 89–105.
Stahle, D.W., D’Arrigo, R., Krusic, P.J., Cleaveland, M.K., Cook,E.R., Allan, R.J., Cole, J.E., Dunbar, R.B., Therrell, M.D., Gay,D.A., Moore, M.D., Stokes, M.A., Burns, B.T., Villanueva-Diaz,J., and Thompson, L.G. 1998. Experimental dendroclimatic re-construction of the Southern Oscillation. Bull. Am. Meteorol.Soc. 79: 2137–2152.
Stocks, B.J., Mason, J.A., Todd, J.B., Bosch, E.M., Wotton, B.M.,Amiro, B.D., Flannigan, M.D., Hirsch, K.G., Logan, K.A.,Martell, D.L., and Skinner, W.R. 2003. Large forest fires in Can-ada, 1959–1997. J. Geophys. Res. (D Atmos.) 108: no. D1, Jan.2003.
Tardif, J., and Bergeron, Y. 1997. Comparative dendroclima-tological analysis of two black ash and two white cedar popula-tions from contrasting sites in the Lake Duparquet region,northwestern Quebec. Can. J. For. Res. 27: 108–116.
ter Braak, C.J.F., and Smilauer, P. 1998. Canoco reference manualand user’s guide to Canoco for windows: software for canonicalcommunity ordination (version 4). Microcomputer Power,Ithaca, N.Y.
Thornthwaite, C.W., and Mather, J.R. 1955. The water balance.Publications in Climatology, 8: 1–86.
Torrence, C., and Compo, G.P. 1998. A practical guide to waveletanalysis. Bull. Am. Meteorol. Soc. 79: 61–78.
Torrence, T., and Webster, P.J. 1998. Interdecadal changes in theENSO-Monsoon System. J. Clim. 12: 2679–2690.
Turner, J.A. 1972. The drought code component of the CanadianForest Fire Behaviour System. Can. For. Serv. Publ. 1316.
Turner, J.A., and Lawson, B.D. 1978. Weather in the CanadianForest Fire Danger Rating system: a user guide to national stan-dards and practices. Can. For. Serv. Publ. 1316.
Van Wagner, C.E. 1974. Effect of duff weight on drying rate. CanFor. Serv. Bi-Mon. Res. Notes, 30: 11–12.
Van Wagner, C.E. 1987. Development and structure of the Cana-dian Forest Fire Weather Index System. Can. For. Serv. For.Tech. Rep. 35.
Vincent, L.A., and Gullett, D.W. 1999. Canadian historical and ho-mogeneous temperature datasets for climate change analyses.International Journal of Climatology, 19: 1375–1388.
Yarnal, B. 1993. Synoptic climatology in environmental analysis: aprimer. Belhaven Press, London, U.K.
Yarnal, B., Comrie, A.C., Frakes, B., and Brown, D.P. 2001. Devel-opment and prospects in synoptic climatology. InternationalJournal of Climatology, 21: 1923–1950.
Zhang, X., Vincent, L., Hogg, W.D., and Niitsoo, A. 2000. Tem-perature and precipitation trends in Canada during the 20th cen-tury. Atmos.–Ocean, 38: 395–429.
Zhang, X., Hogg, W.D., and Mekis, É. 2001. Spatial and temporalcharacteristics of heavy precipitation events over Canada. J.Clim. 14: 1923–1936.
Appendix A
Calculation of the CDC residual rainfallThe amount of moisture from any specific rainfall that is
absorbed in the CDC layer is given by the difference inmoisture equivalent (RP) after (d; current day) and before(d – 1; previous day) rain.
[A1] ∆RP = RPd – RPd–1 = [400 exp(–CDCd/400)]
– [400 exp(–CDCd–1/400)]
where the constant 400 represents the maximum theoreticalmoisture content of the soil. Once the effect of the rainfallphase is known, water absorbed (Wa; in mm) equals
[A2] Wa = (∆RP25)/1000
where 25 and 1000 (both in kg/m3) represents the standardload and the weight of water per volume. The amount of re-sidual rainfall (Drought Code Residual, DCR) is calculatedfrom the total amount of rainfall (in mm, Ra) minus the in-tercepted rainfall (Ri = 0.17P + 1.27) and the absorbed water(Wa). Thus
[A3] DCR = Ra – Ri – Wa
© 2004 NRC Canada
Girardin et al. 119
I:\cjfr\cjfr3401\X03-195.vpJanuary 12, 2004 11:50:48 AM
Color profile: Generic CMYK printer profileComposite Default screen