trends and drivers of land use/cover change in...
TRANSCRIPT

Trends and Drivers of Land Use/Cover Change in India
Atul JainDepartment of Atmospheric Sciences
University of Illinois, USA

Background• Three principal objectives
– To understand the major LCLUC transition activities in the study region.
– To advance our understanding of the causes of LCLUC.
– To improve our understanding of the historical effects of LCLUC dynamics on the quantities and pathways of terrestrial carbon and nitrogen fluxes.

SSEA Region
Covers about 16% of earth’s land surface Characterized by a long history of LCLUC activities the home for over 50% of the world’s population Study LCLUC dynamics country-by-country basis
LCLUC distribution in the study region

Carbon Budget for SSEA countries(2000s)
Cervarich et al. 2016
‐ve is C Source+ve is C SinkNBP = NEP – FIRE – LUC

Quantification of LCLUC in India –Reviewed Literature
• We reviewed literature for LCLUC studies covering India published between 1980 and May 2015.
• Overall, the literature review resulted in more than 630 articles that we studied in detail.– About 72% of all articles focused on LCLUC
processes and rest on causes of LCLUC

Quantification of LCLUC Dynamics & Causes – Reviewed LitratureDynamics• Studies are carried out small regions• Studies are carried out using coarse resolution
remote-sensing products– tend to mask highly fragmented land
• Data is not available at regular time interval
Causes of LCLUC• No geospatial socioeconomic data available at
national scale• Data collection efforts (e.g., social surveys) are
focused on small regions• Biophysical variables are compiled based on
courser resolution global scale data sets

Quantification of LCLUC Dynamics & Causes – Synthesis
Dynamics• Studies are carried out small regions• Studies are carried out using coarse resolution
remote-sensing products– tend to mask highly fragmented land
• Data is not available at regular time interval
Causes of LCLUC• No geospatial socioeconomic data available at
national scale• Data collection efforts (e.g., social surveys) are
focused on small regions• Biophysical variables are compiled based on
courser resolution global scale data sets
All these constraints are hindering effective national level planning and policy‐making.

Dynamics & Causes of LCLUC in India –Our Approach
• Quantified land-cover conversion (~30m resolution) at national scales using Landsat-MSS/TM imageries (30m) at decadal time interval (1985, 1995, and 2005)
• Quantified the causes by estimating spatial logistic regressions between land-cover conversion estimates and socioeconomic and biophysical factors– used village level (>630,000 administrative units)
socioeconomic data (>200 variables) at national scale– evaluated our regression results through collective
evidence from synthesis of 102 case studies
Studied Causes for Three LCLUC Types
• We studied the causes (spatial determinants as opposed to aggregate) of three broad LCLUC that are central to land use planning in India – Underutilization of land area (non-
productive land specifically fallow land and wasteland)
– Deforestation and forest degradation, and – Increase in forest area.

Decadal national Land use and Land Cover changefor Land dynamics and Climate Change studies
(1975-1985-1995-2005-2015)
Approach for LULUC change mapping

Roy et al. (Remote Sensing, 2015)
Wall-to-wall Landsat Analysis (30m)• Covers Longer Time Period: Decadal (1985-1995-2005)
• Uniform Classification Scheme: IGBP
• Patch to Patch Land Dynamics
• Ground Validation (>12000 points)

LCLUC Dynamics at National Scale
Meiyappan et al. (2016)

LCLUC Dynamics at National Scale
Meiyappan et al. (2016)

LCLUC Dynamics at National Scale
Meiyappan et al. (2016)

LCLUC Dynamics at National Scale
Meiyappan et al. (2016)

Regional LCLUC Dynamics
Meiyappan et al. (2016)

Socioeconomic Causes of LCLUC
• A key aspect of our study is the compilation and usage of the most detailed, national level spatial database – over 80 socioeconomic factors at
village/town level (~630,000 administrative units) for two consecutive census years (1991 and 2001).

Data – Administrative HierarchyVillage (~630,000 units)
Captures the high granularity in socioeconomics
Used village specific qualitative variables that reflects the base of the socio-economic culture prevalent in rural parts of India
Zoomed‐in View
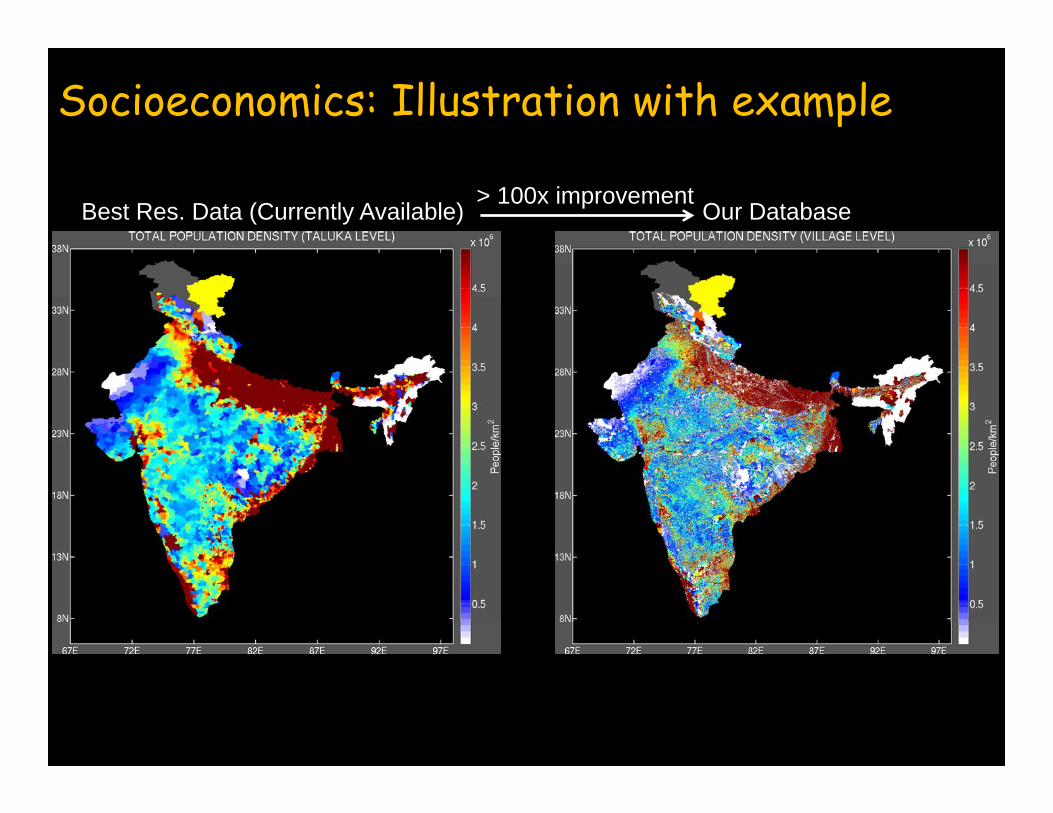
Socioeconomics: Illustration with example
Our DatabaseBest Res. Data (Currently Available)> 100x improvement

Broder Cluster and Explanatory Factors –Examples

Underlying Causes: Examples of Biophysical Data
Soil data (NBSS – ~30 variables) Terrain (SRTM)

Statistical Estimation: Causes of LCLUCExample: Forest loss
• Model Technique: Fractional Binomial Logit Model
• Modeling Resolution: 1km x 1km lat/long
• Spatial Domain: National & by regional hotspots
• Temporal Domain: Separate estimation by decade(1985-95, 1995-05)
• Scaling of predictors: Z-score standardization
• Multicollinearity: Elastic-net regularization
• Parameter selection: k-fold cross validation
• Confidence Intervals & Spatial autocorrelation: Bootstrap with500 replicates
Key Points

Causes of Forest loss: National Scale
1985-1995 1995-2005Occupation
(Dairy/Cattel/Leather)
Occupation Wooden/Agricultural implements)
Occupation (Building/mining Material
Availability of Power Supply
Annual Mean Temperature
Protected Area
Cation Exchange Capacity
Step Slop (>50%) Slop
Occupation (Wooden Furniture/timber)
Proportion of Cropland irrigation
Availability of Power Supply
Indus. & Construction worker density
Precip. For the Wettest Month
Occupation (Building/mining Material
Occupation (Dairy/Cattel/Leather)
Severe Soil Erosion
Protected Area
Occupation (Wooden/Agricultural implements)
Steep Slope (>50%)
Proportion of Cropland irrigation

Summary of model findings (regional hotspots)

Evaluation: Meta-synthesis of 102 case studies

Evaluation: Case-study results (national aggregates)

1961 1971
2001
Extended efforts: 1km reconstruction (1950-2011)

1961 1971
2001
Validation: How good are the reconstructed maps?
Ground truthing at over 12000 locationsfor year 1950
High resolution military toposheets (circa 1950)
Pattern validation: an example
1961 1971
2001
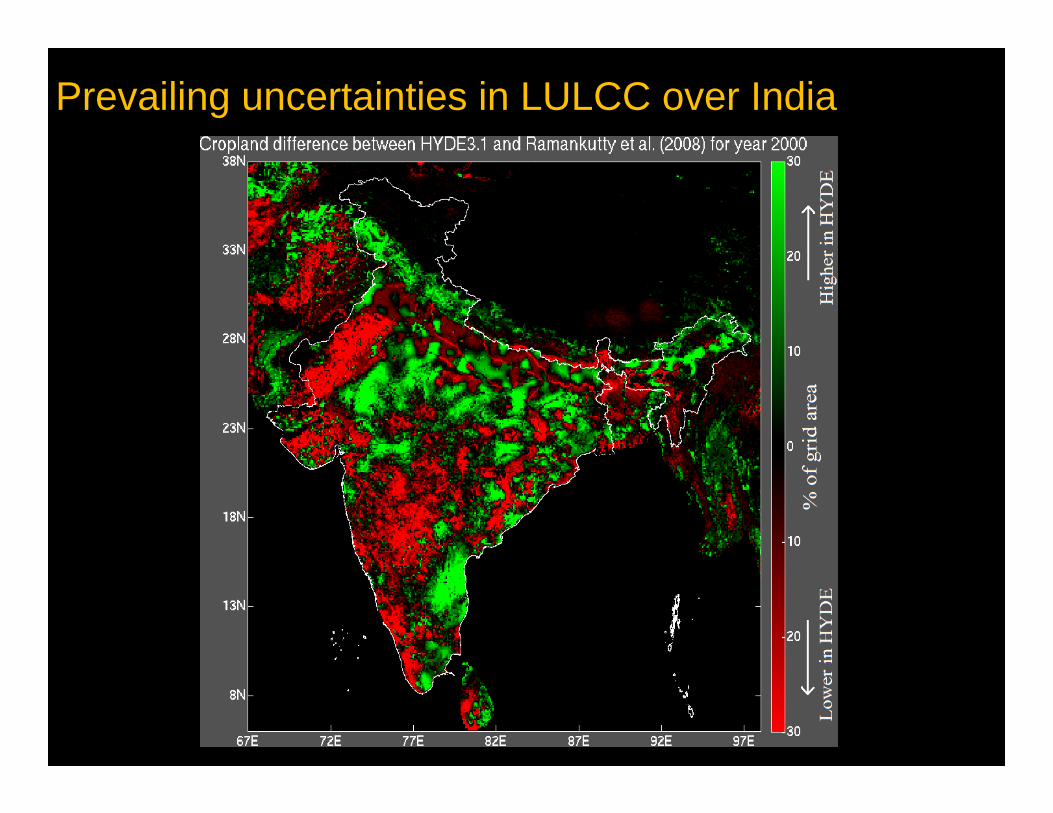
Prevailing uncertainties in LULCC over India

References

References

Data Product: Historical LULCC Reconstruction

Data Product: Village level socioeconomic database for India

Acknowledgement: NASA LCLUC Program
Key collaborators
Yeshu Sharma
Jing Gao
Parth Roy
Pawan Joshi
Prasanth Meiyappan

Thank You

LCLUC Dynamics and Causes –Overall Challenges
• Spatiotemporal dynamics and causes of LCLUC over larger regions of India are limited
• It is hard to generalize and quantify the causes of LCLUC by studying small regions (e.g., few villages)– Note that India has 630,000 villages with
diverse agro-ecological and socio-cultural environment.
All these constraints are hindering effective national level planning and policy‐making.