trends and determinants of catastrophic health expenditure
TRANSCRIPT

RESEARCH ARTICLE Open Access
Trends and determinants of catastrophichealth expenditure in China 2010–2018:a national panel data analysisCai Liu1, Zhao-min Liu2, Stephen Nicholas3,4,5,6 and Jian Wang7,8*
Abstract
Background: Catastrophic health expenditures (CHE) are out-of-pocket payments (OOP) that exceed a predefinedpercentage or threshold of a household’s resources, usually 40 %, that can push households into poverty in China.We analyzed the trends in the incidence and intensity, and explored the determinants, of CHE, and proposed policyrecommendation to address CHE.
Methods: A unique 5-year national urban-rural panel database was constructed from the China Family PanelStudies (CFPS) surveys. CHE incidence was measured by calculating headcount (percentage of households incurringCHE to the total household sample) and intensity was measured by overshoot (degree by which an average out ofpocket health expenditure exceeds the threshold of the total sample). A linear probability model was employed toassess the trend in the net effect of the determinants of CHE incidence and a random effect logit model was usedto analyse the role of the characteristics of the household head, the household and household health utilization onCHE incidence.
Results: CHE determinants vary across time and geographical location. From 2010 to 2018, the total, urban andrural CHE incidence all showed a decreasing tend, falling from 14.7 to 8.7 % for total households, 12.5–6.6 % inurban and 16.8–10.9 % in rural areas. CHE intensity decreased in rural (24.50–20.51 %) and urban (22.31–19.57 %)areas and for all households (23.61–20.15 %). Inpatient services were the most important determinant of theincidence of CHE. For urban households, the random effect logit model identified household head (age, education,self-rated health); household characteristics (members 65 + years, chronic diseases, family size and income status);and healthcare utilization (inpatient and outpatient usage) as determinants of CHE. For rural areas, the samevariables were significant with the addition of household head’s sex and health insurance.
© The Author(s). 2021 Open Access This article is licensed under a Creative Commons Attribution 4.0 International License,which permits use, sharing, adaptation, distribution and reproduction in any medium or format, as long as you giveappropriate credit to the original author(s) and the source, provide a link to the Creative Commons licence, and indicate ifchanges were made. The images or other third party material in this article are included in the article's Creative Commonslicence, unless indicated otherwise in a credit line to the material. If material is not included in the article's Creative Commonslicence and your intended use is not permitted by statutory regulation or exceeds the permitted use, you will need to obtainpermission directly from the copyright holder. To view a copy of this licence, visit http://creativecommons.org/licenses/by/4.0/.The Creative Commons Public Domain Dedication waiver (http://creativecommons.org/publicdomain/zero/1.0/) applies to thedata made available in this article, unless otherwise stated in a credit line to the data.
* Correspondence: [email protected] Fureng Institute of Economic and Social Development, WuhanUniversity, No.54 Dongsi Lishi Hutong, Dongcheng District, 100010 Beijing,China8Center for Health Economics and Management, School of Economics andManagement, Wuhan University, 299 Bayi Road, Wuchang District, 430072Wuhan, Hubei Province, ChinaFull list of author information is available at the end of the article
Liu et al. BMC Health Services Research (2021) 21:526 https://doi.org/10.1186/s12913-021-06533-x
Conclusions: The incidence and intensity of CHE in China displayed a downward trend, but was higher in ruralthan urban areas. Costs of inpatient service usage should be a key intervention strategy to address CHE. The policyimplications include improving the economic level of poor households, reforming health insurance and reinforcingpre-payment hospital insurance methods.
Keywords: Catastrophic health expenditures, Out-of-pocket expenses, Health insurance, China
IntroductionIllness-caused poverty and poverty-caused illness chal-lenge the well-being of whole societies. Medical costs,especially catastrophic health expenditures, force house-holds to cut back on other consumption, worsen familyquality of life and can plunge families into long-termdebt and medical poverty [1]. According to the WorldHealth Organization, catastrophic health expenditures(CHE) are out-of-pocket payments (OOP) for medicalexpenses, not covered by health insurance, ≥ 40 % oftotal household expenditure minus food spending [1–4].Globally, CHE has increased significantly [5, 6] and thecauses remain unsolved, especially in low and middle in-come countries. In 2015, about 150 million peopleworldwide experienced CHE, pushing an estimated100 million people into poverty [7]. Global per capitaOOP rose from $161.00 in 2010 to $187.00 in 2018, agrowth rate of 16.15 % [8]. Over the same period inChina, total OOP expenses increased from $96.254 bil-lion to $242.687 billion, growing about 152.13 % [9].Compared with other countries, China suffered a highCHE incidence, about 13 % compared to a 59 cross-country study where the rate of CHE ranged from 0.01in the Czech Republic and Slovakia to 10.5 % in Vietnam[10].Like many other developing countries, the incidence of
CHE in China reflects the limited health insurancecoverage of OOP expenses [4]. In order to lower CHEand OOP expenses, China piloted a series of healthcarereforms in 2009, including three national basic medicalinsurance (BMI) programs: urban employee basic med-ical insurance (UEBMI) covering employed urban resi-dents; the urban resident basic medical insurance(URBMI) designed for the urban unemployed, retired,elderly, students and children; and the new rural co-operative medical scheme (NRCMS) for rural residents.Currently, China’s national BMI covers more than1.35 billion people, with the insured rate reaching 97 %of the population [11]. However, the financial level andbenefit package of each BMI differ significantly. For ex-ample, the per-capita fund of UEBMI is US$424.7, butonly US$66.2 for URBMI and US$61.2 for NRCMS [12,13]. The UEBMI benefit package is more generous andcomprehensive than URBMI and NRCMS, with URBMI
and NRCMS having limited outpatient service coverage.Finally, the benefit packages vary by province and city,where the same BMI provides different OOP expenses,reimbursement rates and coverage depending on city-province. To narrow disparities between the three BMIschemes, China started to integrate URBMI and NRCMS into URRMI (Urban and Rural Residents Medical In-surance) scheme in 2016 [14]. To control the rapidly ris-ing health expenditure, these BMI reforms were coupledwith public hospital reform measures, limiting medicinepayments and increasing the fee-for-service paymentmethod.Aiming at relieving the financial burden on people
who suffer a critical illness, China also launched cata-strophic medical insurance (CMI) in 2012, which wasimplemented nationwide in 2016 after 3 years of city-based testing. CMI was designed to reimburse patientswhose OOP medical expenses exceeding a pre-determined BMI level, where claimants could receive a50–100 % reimbursement, depending on individual pro-vincial policies [15]. Critical illness in the CMI schemewas determined by the patient’s OOP expenses, whichwas defined by BMI province-level reimbursement pol-icies, irrespective of the kind of disease.In the context of China’s complex BMI schemes and
health reforms, the determinants of CHE have been atopic of continued research interest in China [16]. Em-pirical studies of the determinants of CHE broadly iden-tify four main causes: first, the characteristics of thehousehold head, including sex, age, education, maritalstatus and self-rated health; second, features of thehousehold [17], such as region, economic status andfamily size; third, attributes of the family members [18,19] including the number of old or young family mem-bers and family members with a doctor-diagnosedchronic and special diseases, such as cancer [20], dia-betes [21] cardiovascular diseases [22]and hypertension[23]; and fourth, health care service utilization and policyrelated variables, including inpatient and outpatient hos-pital care services [5, 16], access to health consultationservices [24, 25], the characteristics of the hospital [16,26], access to health services [16] including health insur-ance [4, 15, 22, 27–29] and medical assistance and pov-erty alleviation policies [16, 23].
Liu et al. BMC Health Services Research (2021) 21:526 Page 2 of 12

These CHE determinants vary across time and geo-graphical location. The time lag between the implemen-tation of health policy and its outcomes requires panel,or longitudinal data [30]. Based on the same definitionand measurement of CHE, most CHE China studies uti-lized cross-sectional survey data [15, 27–29] or limited 2or 3-year longitudinal comparison studies [24]. Only twoChinese studies used panel data from the China FamilyPanel Studies (CFPS) to analyse the trends of CHE inci-dence and intensity in China [22, 31]. Zhao et al. focusedon trends and socioeconomic disparities in CHE andhealth impoverishment in China using 4-year panel data(2010, 2012, 2014 and 2016) from the urban and ruralperspective, but only applied the 2016 data, and not thepanel model, to explore the determinants affecting CHEincidence [31]. Zhao et al. reported that the proportionof households experiencing CHE decreased from 19.37 %to 2010 to 15.11 % in 2016 and the logistic regressionmodel showed that chronic diseases, economic status,household size, residence location, age and education ofthe household head exert an influence on CHE. A studyby Sun [29] applied a random effect model to 3 years(2012, 2014 and 2016) of panel data to reveal the CHEtrends from the perspective of different BMI schemes.Sun found that total CHE incidence and intensity exhib-ited overall rising trends from 2012 to 2016 and the ran-dom effect model showed that households covered byBMI schemes did not decrease the odds of CHEoccurrence.We address these contradictory CHE outcomes by
assessing the changes across time, location, socioeco-nomic household characteristics and household healthutilization in the trends of CHE, and their determi-nants, and by analyzing China’s complex healthpolicies. First, we construct a unique CHE 5-year na-tionally representative panel database using CFPS toassess the trend in the incidence and intensity ofCHE. Second, employing a linear probability andrandom effect model, we analyze the role of the char-acteristics of the household head, the householdsocio-economics and household health utilization asdeterminants of CHE.
Materials and methodsDataCollected by Institute of Social Science and Survey(ISSS) of Peking University, China Family Panel Stud-ies’ (CFPS) data covers China’s society, economy,population, education and health. Our anonymizedhealth data were obtained directly from the CFPS of-ficial website (http://www.isss.pku.edu.cn/cfps/). Fromfive waves of the 2010–2018 CFPS, we constructed anationally representative longitudinal database on thehealth and socio-economic status of households and
individuals aged 16 and above across 25 provinces inChina. Using a multistage probability sampling ap-proach with implicit stratification, the 2010 CFPSbaseline survey yielded a representative national sam-ple at county level, village level, and household level[32]. In order to analyze the trends, incidence, anddeterminants of CHE, we built an unbalanced paneldatabase by matching the household ID in the currentCFPS survey with the same household in the previousCFPS survey. After managing missing and abnormalvalues, we obtained a sample consisting of 11,700households in 2010, 9290 in 2012, 11,309 in 2014, 13,092 in 2016 and 11,520 in 2018. We constructed thepanel structure by tracking 7386 or 63.12 % of the2010 households in the 2012 sample, which provideddata on the trends in the same household’s circum-stances during the preceding two-year period. In thethird wave survey in 2014, 64.67 % (7313/11,309)households from 2012 were tracked; in the fourthwave survey in 2016, 72.62 % (9507/13,092) house-holds were tracked from 2014 survey and in the fifthwave survey in 2018, 82.14 % (9462/11,520) of the2016 households were tracked.
VariablesMeasurement of CHE, CHE incidence and intensityOur data are based on households, where a house-hold member was defined in terms of marriage,blood or an adoptive relationship and an on-goingeconomic tie. The head of the household was con-firmed through the question “When your family en-counters important matters and decisions have to bemade, who has the final say?”. The minimum age ofthe household head was set as over 16 years old.Following previous research, we chose the question“In the past 12 months, the total expenditure of yourfamily including food, clothing, housing and trans-portation and so on” in CFPS to measure totalhousehold expenditure; the question “Excluding thereimbursable and expected reimbursable expenses,but including the part paid by relatives and friends,your family’s medical and health expenditures lastyear” to measure household out-of-pocket healthexpenditure; and the question on monthly mealexpenses to estimate yearly food expenditure, withnon-food expenditure equal to total householdexpenditure minus food expenditure.When a household’s out-of-pocket health payments,
including outpatient and inpatient services, preventa-tive care, maternal and child health services andmedication expenses, exceed 40 % of its capacity topay for non-food expenditure, the household facesCHE. CHE was coded 1 when OOP health expendi-tures as a proportion of household income, or
Liu et al. BMC Health Services Research (2021) 21:526 Page 3 of 12

capacity to pay (CTP), was equal or exceeded 0.4 and0 otherwise. CHE incidence was measured by head-count, which refers to the percentage of householdsincurring CHE to the total household sample:
Headcount ¼ 1N
PNi¼1 CHEi ð1Þ
where N represents the sample size, CHEi is 1 when theithhousehold incurred CHE, and 0 otherwise.CHE intensity was measured by overshoot which is
the degree by which an average OOP health expenditureexceeds the threshold of the total sample [16]:
Overshoot ¼ 1N
PNi¼1 CHEi
OOPiCTPi
� z� �
ð2Þ
where N is the sample size, OOPi and CTPi refer toOOP health expenditure and capacity to pay of the ithhousehold and z is the threshold value, which is 40 %.
Independent variablesBased on the previous studies, three categories of factorsinfluencing the household’s risk of CHE were collected.First, demographic characteristics of the household head,including sex, age (16–34 years, 35–54 years, 55–64years and 65 + years), marital status (unmarried, marriedand divorced or widow), education (illiteracy and elem-entary, middle school, high school and college andabove) and self-rated health (poor, medium and good).Second, household characteristics comprising whetherthere were household members aged 65 years and older;household members had a doctor-diagnosed chronic dis-ease(s) in the past 6 months; family size (1–3, 4–5 and≥ 6 members); and household economic status, mea-sured by the quartile of annual per capita household in-come. The last category of factors refers to thehealthcare utilization of the household, consisting ofwhether any family member used inpatient service in thepast year; outpatient usage measured by whether anyhousehold member had used outpatient services in thepast two weeks; and the type of health insurance, com-prising NRCMS, UEBMI, URBMI, supplementary med-ical insurance (SMI) and no health insurance. SMIreferred to all kinds of relatively high profit packages ofthe insurance programme, for instance, free medical ser-vice scheme for special sectors, commercial health insur-ance and enterprise supplementary medical insurance.
Linear probability modelWe are interested not only in the trend in the urban-rural CHE incidence, but also the reasons and the size oftheir effect on the trend pattern. First, we regressed theCHE incidence by urban-rural location in each year and
compared the coefficients to estimate the net effect ofeach determinant. There are several biases when apply-ing the coefficient from binary logit models to comparethe net effect of independent variables, which couldcause model misspecification and estimation errors [33].Linear probability modelling (LPM) is a robust methodto compare the coefficients in a binary outcome regres-sion for the same model, but different samples [34–37].To estimate the net effects of the determinants to CHEincidence by urban-rural location from 2010 to 2018, weapplied LPM to conduct regressions for the sub-sampleby region in each year and compare the absolute valueof coefficient in the models.
Random effect modelGiven the dependent variable, CHE incidence, is adummy variable, the binary logit model was used to esti-mate the determinants of CHE. Improving on the use ofcross-sectional data, we built a panel dataset to betterexplore the determinants for the occurrence of CHE.Since there were several unchanged variables for all ormost respondents, such as sex, marriage, education, arandom effect panel logit model was employed toanalyze the determinants of CHE based on the CFPS2010–2018 panel data by urban-rural location:
Log Pitð Þ ¼ ln Pit1�Pit
� �
¼ β0 þ β1 � Householdheadt þ β2 �Householdt þ β3 �Healthservicet þ �it
ð3Þ
where Pit is the likelihood of CHE occurrence for ithhousehold in the urban-rural location in the year t (t =2010, 2012, 2014, 2016, 2018), and Pit=1� Pit is theodds ratio (OR) of CHE occurrence.
ResultsDescription of rural, urban and total householdsSupplementary Table 1 displays the basic characteristicsof urban, rural and total sample households by year. In2010 and 2012 males accounted for more than 70 % ofthe household heads, falling to broadly male-femaleequity from 2014 to 2018. For rural households, al-though the percentage of male household heads was lar-ger than female, the disparity became smaller. For urbanhouseholds, female heads exceeded males, except for2010, for the whole sample period. Averaging roughly50 %, the 35–54 years was always the largest age group.More than 80 % of household heads were married.Household head’s education level were relatively low.From 2012 to 2018, more than 60 % household headsperceived their health as good, which was broadly thesame for urban and rural households.
Liu et al. BMC Health Services Research (2021) 21:526 Page 4 of 12

Looking at household characteristics, around 25% ofhouseholds in urban area had family member(s) aged ≥ 65years old while it was about 30 % in rural area. Similarly,around 30% of households contained members withdoctor-diagnosed chronic disease(s), roughly equal in urbanand rural areas. About 50 % of households had 1–3 mem-bers and 15% of households had 6 or more family mem-bers, but 60 % of urban households had 1–3 familymembers, while 20 % of rural households had 6 or moremembers. The economic status of households was improv-ing, with rising per capita income levels, but urban house-holds were economically better off than rural households.Finally, for health service utilization, inpatient service
usage gradually increased from 16.7 % to 2010 to 25.3 %in 2018, rising from 15.9 % in 2010 to 23.6 % in 2018 forurban households and from 17.4 % in 2010 to 27.6 % in2018 for rural households. Outpatient service also rosefrom 34.3 % in 2010 to 60 % in 2016, before falling to41.9 % in 2018. In urban households, outpatient servicesrose from 29.8 % in 2010 to 36.8 % in 2018 and from38.3 % in 2010 to 47.2 % in 2018 in rural households.Covering rural residents, between 55 and 65 % of house-holds were covered by NRCMS, which is consistent withestimates of NRCMS in the 2014 National Bureau ofStatistics of China, the 2015 Chinese General Social Sur-vey, 2016 China Labor-force Dynamics Survey and 2015China Health and Nutrition Survey of between 51.28and 68.44 %. Urban households were covered by UEBMI,which gradually rose over the 2010–2018 period; a mi-nority of the population, around 6-9 %, were insured byURBMI from 2010 to 2018; and the coverage rate ofSMI and no health insurance fell.
CHE incidence and intensity 2010–2018Figure 1 displays the trends of CHE incidence measuredby the headcount of households from 2010 to 2018.Total, urban and rural CHE incidence all showed a de-creasing tendency, falling from 14.7 % in 2010 to 8.7 %
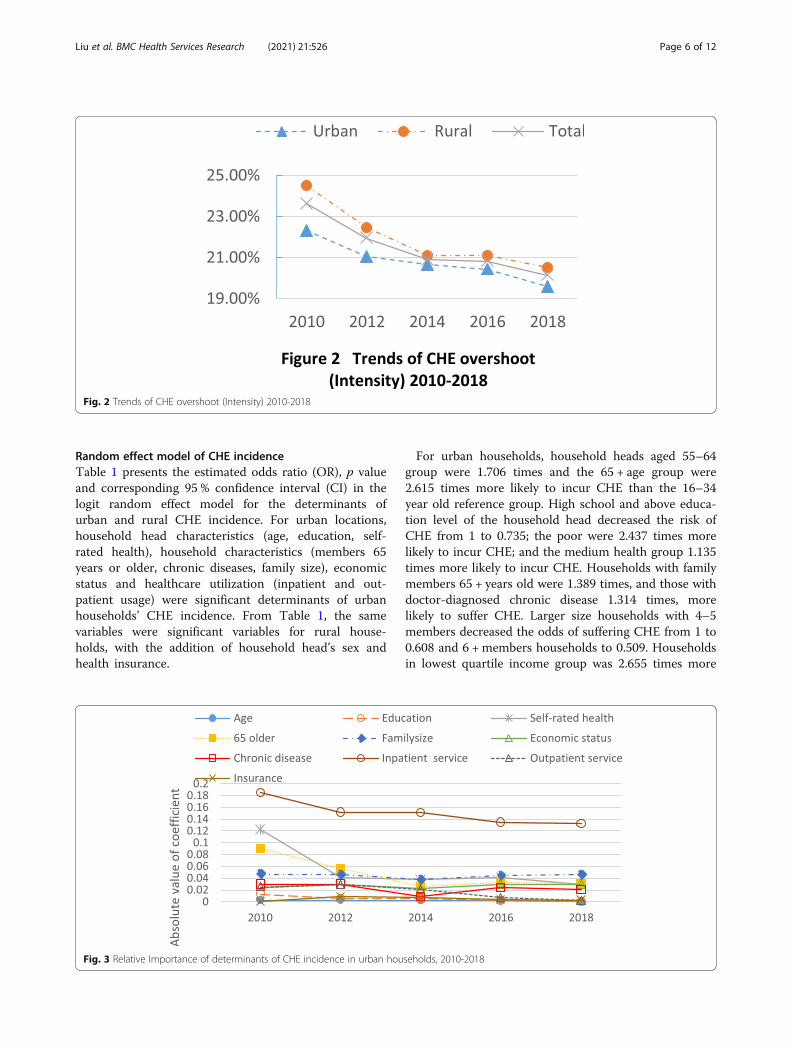
in 2018 for total households, 12.5 % in 2010 to 6.6 % in2018 for urban households and 16.8 % in 2010 to 10.9 %in 2018 for rural households. The decreasing amplitudefor the 2012 to 2014 years was relatively larger than forother years.Figure 2 shows the trends of CHE overshoot, or inten-
sity. Overall, CHE intensity decreased in rural (24.5% to20.5%) and urban (22.3% to 19.6%) areas and for allhouseholds (23.6% to 20.2%), with the most rapid de-cline from 2010 to 2014.
Determinants of CHE incidence and intensitySupplementary Tables 2 and 3 analyse the determinantsof CHE incidence in urban and rural households in eachyear. The linear probability model in Supplement Table 2shows urban household head’s characteristics (age, edu-cation level, self-rated health), household characteristics(member(s) 65 + years old, family size, doctor-diagnosedchronic diseases), economic status and healthcareutilization (use of inpatient services in the past year andoutpatient service use in the last two weeks and healthinsurance) were significant determinants of urbanhousehold CHE incidence. For rural households inSupplementary Table 3, the same variables were signifi-cant, except education and health insurance.For variables significant for at least two of the year pe-
riods, Figs. 3 and 4 show the trends in the relative im-portance of the determinants of urban and rural CHEincidence. For both rural and urban households, in-patient services were the most important determinant ofthe incidence of CHE, while household head’s age wasthe weakest determinant. Most determinants displayed adownward trend from 2010 to 2018, including inpatientservices, self-rated health, 65 + years old householdmembers, outpatient services, education and insurance.The relative importance of family size, economic statusand chronic disease was stable in Figs. 3 and 4.
Fig. 1 Trends of CHE headcount (Incidence) 2010-2018
Liu et al. BMC Health Services Research (2021) 21:526 Page 5 of 12
Random effect model of CHE incidenceTable 1 presents the estimated odds ratio (OR), p valueand corresponding 95 % confidence interval (CI) in thelogit random effect model for the determinants ofurban and rural CHE incidence. For urban locations,household head characteristics (age, education, self-rated health), household characteristics (members 65years or older, chronic diseases, family size), economicstatus and healthcare utilization (inpatient and out-patient usage) were significant determinants of urbanhouseholds’ CHE incidence. From Table 1, the samevariables were significant variables for rural house-holds, with the addition of household head’s sex andhealth insurance.
For urban households, household heads aged 55–64group were 1.706 times and the 65 + age group were2.615 times more likely to incur CHE than the 16–34year old reference group. High school and above educa-tion level of the household head decreased the risk ofCHE from 1 to 0.735; the poor were 2.437 times morelikely to incur CHE; and the medium health group 1.135times more likely to incur CHE. Households with familymembers 65 + years old were 1.389 times, and those withdoctor-diagnosed chronic disease 1.314 times, morelikely to suffer CHE. Larger size households with 4–5members decreased the odds of suffering CHE from 1 to0.608 and 6 +members households to 0.509. Householdsin lowest quartile income group was 2.655 times more
Fig. 2 Trends of CHE overshoot (Intensity) 2010-2018
Fig. 3 Relative Importance of determinants of CHE incidence in urban households, 2010-2018
Liu et al. BMC Health Services Research (2021) 21:526 Page 6 of 12

likely, quartile 2 income group was 1.763 times morelikely, and quartile 3 group was 1.519 times was morelikely to incur CHE. Inpatients were 3.710 times morelikely, and outpatients were 1.236 times more likely, tosuffer CHE. Finally, the health insurance variable wasnot significant.For rural households, household heads aged 55–64
were 2.087 times more likely and aged 65 + 1.613 timesmore likely to incur CHE than the 16–24 referencegroup. Mirroring the results for urban areas, high levelsof household head education effectively decreased therisk of CHE. The self-rated poor health group was1.933 times more likely and the medium health group1.292 times more likely to experience CHE. House-holds with family members 65+ years were 1.214times more likely, and those with doctor-diagnosedchronic diseases was 1.301 times more likely, to incurCHE. Similar to urban households, more family mem-bers reduced the risk of CHE, while poor income sta-tus increased the probability of CHE. Inpatients were3.395 times more likely, and outpatients were 1.145times more likely, to suffer CHE. Sex was an espe-cially important determinant of rural CHE, wheremale household heads were 1.092 times more likelyto suffer CHE.Compared with households covered byno insurance, those covered by NRCMS was 1.164times more likely to incur CHE. Other insurancegroups showed no effect on CHE occurrence.
DiscussionOur study applied a 5-year nationally representativeChinese household panel dataset and a conservativemethod to analyze the trends, incidence, intensity anddeterminants of CHE for urban and rural areas in China.Measured by headcount, CHE incidence decreased from14.73 % in 2010 to 8.67 % in 2018, with CHE in ruralareas about 4 % higher than for urban households. CHE
intensity, measured by overshoot, also fell from 23.61 %in 2010 to 20.15 % in 2018, with rural areas about 1 %higher than urban households. Using the same measure-ment of CHE as previous studies, our results werebroadly consistent with these studies [38, 39], whichfound the overall incidence of CHE was around 13 %,displayed a downward trend and was higher in ruralthan urban areas. But our estimates were lower thanSun’s CHE estimates, who also used the CFPS panel data[22], this might be due to Sun’s balanced panel datadropping almost half the observations in his sampleseach year. Our higher CHE in rural areas than urbanareas was consistent with other studies [25, 31, 40], withsome international studies reporting that rural house-holds’ incidence of CHE over 1.5 times higher than thenational average [31, 41].There were a number of possible factors explaining
these outcomes. First, the decreasing 2010–2018 CHEtrend was a result of a combination effects from eco-nomic growth and various policy interventions. Due toeconomic growth, CTP grew at 360.2 % and householdincome per capita grew at 168.4 %, compared to the64.63 % growth rate of OOP expenses, which reducedthe ratio of OOP to CTP and the incidence of CHE. Sec-ond, policy interventions reduced CHE, especially theexpansion of universal health insurance coverage andenhanced allowances for vulnerable populations, such aselderly people[42]. Third, our 13 % incidence estimate ofCHE was relatively high compared to other countries,which may reflect China’s fee-for-service payment sys-tem and low level of benefit packages [31]. Fourth, giventhe disparities in economic level, the social security sys-tem and health resources between urban and rural areasin China, CHE remained higher in rural than urbanhouseholds [43].Our linear probability model and random effect model
provided new insights into CHE in China. The relative
Fig. 4 Relative Importance of determinants of CHE incidence in rural households, 2010-2018
Liu et al. BMC Health Services Research (2021) 21:526 Page 7 of 12
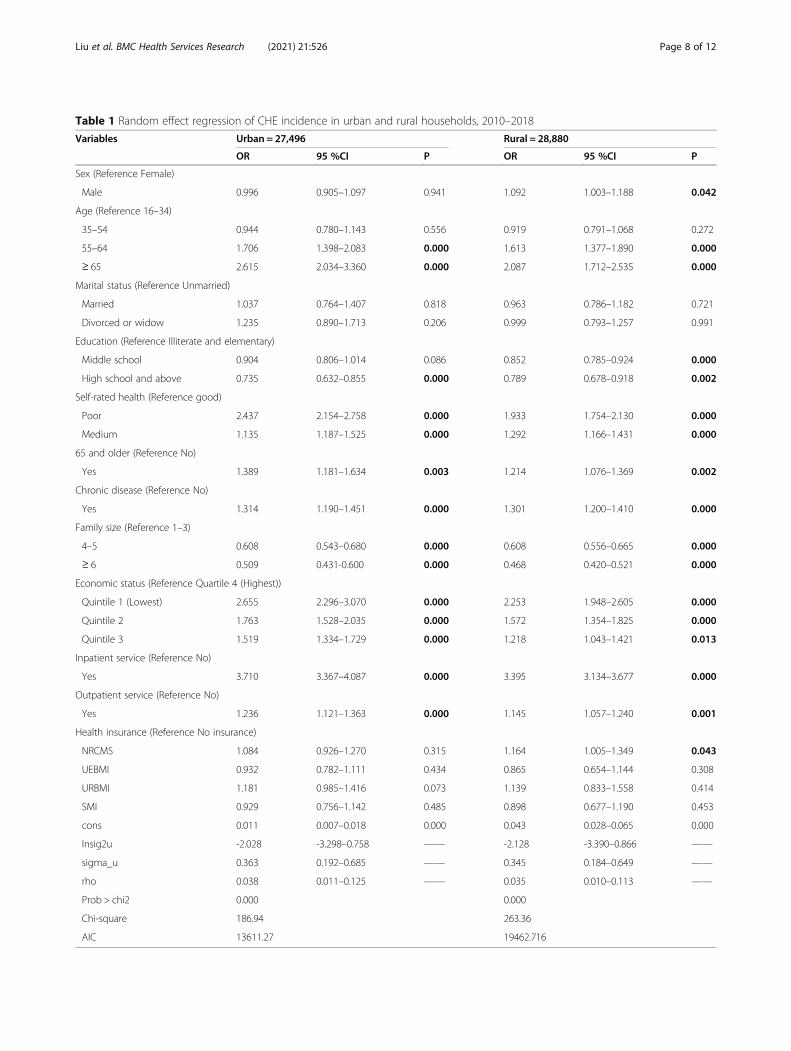
Table 1 Random effect regression of CHE incidence in urban and rural households, 2010–2018
Variables Urban = 27,496 Rural = 28,880
OR 95 %CI P OR 95 %CI P
Sex (Reference Female)
Male 0.996 0.905–1.097 0.941 1.092 1.003–1.188 0.042
Age (Reference 16–34)
35–54 0.944 0.780–1.143 0.556 0.919 0.791–1.068 0.272
55–64 1.706 1.398–2.083 0.000 1.613 1.377–1.890 0.000
≥ 65 2.615 2.034–3.360 0.000 2.087 1.712–2.535 0.000
Marital status (Reference Unmarried)
Married 1.037 0.764–1.407 0.818 0.963 0.786–1.182 0.721
Divorced or widow 1.235 0.890–1.713 0.206 0.999 0.793–1.257 0.991
Education (Reference Illiterate and elementary)
Middle school 0.904 0.806–1.014 0.086 0.852 0.785–0.924 0.000
High school and above 0.735 0.632–0.855 0.000 0.789 0.678–0.918 0.002
Self-rated health (Reference good)
Poor 2.437 2.154–2.758 0.000 1.933 1.754–2.130 0.000
Medium 1.135 1.187–1.525 0.000 1.292 1.166–1.431 0.000
65 and older (Reference No)
Yes 1.389 1.181–1.634 0.003 1.214 1.076–1.369 0.002
Chronic disease (Reference No)
Yes 1.314 1.190–1.451 0.000 1.301 1.200–1.410 0.000
Family size (Reference 1–3)
4–5 0.608 0.543–0.680 0.000 0.608 0.556–0.665 0.000
≥ 6 0.509 0.431-0.600 0.000 0.468 0.420–0.521 0.000
Economic status (Reference Quartile 4 (Highest))
Quintile 1 (Lowest) 2.655 2.296–3.070 0.000 2.253 1.948–2.605 0.000
Quintile 2 1.763 1.528–2.035 0.000 1.572 1.354–1.825 0.000
Quintile 3 1.519 1.334–1.729 0.000 1.218 1.043–1.421 0.013
Inpatient service (Reference No)
Yes 3.710 3.367–4.087 0.000 3.395 3.134–3.677 0.000
Outpatient service (Reference No)
Yes 1.236 1.121–1.363 0.000 1.145 1.057–1.240 0.001
Health insurance (Reference No insurance)
NRCMS 1.084 0.926–1.270 0.315 1.164 1.005–1.349 0.043
UEBMI 0.932 0.782–1.111 0.434 0.865 0.654–1.144 0.308
URBMI 1.181 0.985–1.416 0.073 1.139 0.833–1.558 0.414
SMI 0.929 0.756–1.142 0.485 0.898 0.677–1.190 0.453
cons 0.011 0.007–0.018 0.000 0.043 0.028–0.065 0.000
lnsig2u -2.028 -3.298–0.758 —— -2.128 -3.390–0.866 ——
sigma_u 0.363 0.192–0.685 —— 0.345 0.184–0.649 ——
rho 0.038 0.011–0.125 —— 0.035 0.010–0.113 ——
Prob > chi2 0.000 0.000
Chi-square 186.94 263.36
AIC 13611.27 19462.716
Liu et al. BMC Health Services Research (2021) 21:526 Page 8 of 12

importance of household head’s characteristics (age,education level, self-rated health), household characteris-tics (member(s) 65 + years old, family size, economic sta-tus, doctor-diagnosed chronic diseases) and healthcareutilization (use of inpatient services in the past year andoutpatient service use in the last two weeks and healthinsurance) as determinants of CHE incidence declinedover the 2010–2018 period, with the decline about thesame in urban and rural areas. Inpatient service usageaccounted for 10–20 % of all determinants of CHE, andaddressing the costs of inpatient service usage would at-tenuate CHE in China.The random effect model revealed that age, education,
self-rated health of household head, members 65 yearsor older, chronic diseases, family size, economic statusand urban healthcare utilization were significant deter-minants of urban households’ CHE incidence. The samevariables were significant for rural households, with theaddition of household head’s sex and health insurance.Previous studies also showed age and chronic diseases offamily member increased the probability of CHE [24–26,31, 44, 45]. These trends highlight the urgency in devel-oping long-term care insurance, extending insurancecoverage, improving the medical health assistance sys-tem, prioritizing outpatient services, supporting the costsof essential medications and expanding to rehabilitationservices [31].We found that large household size protectsed against
CHE, which was also reported in some other studies [16,46]. Larger households could share the CHE economicrisk among a larger number of people that meant greaterfamily-based medical cost affordability [16]. We alsofound that households in poor income quartiles morelikely to suffer CHE, which is consistent with otherChinese and international studies [31, 47]. These resultsemphasize that reform to China’s social security systemand income equality policies could provide a safety netfor poor households, the rural elderly, those withchronic diseases and single member households. Thegovernment should consider establishing subsidiaryhealth insurance funds and a financial rescue system thatattenuates the economic burden of disease for low-income households before they are pushed into the“poverty trap”.A key finding was that health service utilization was
the single most important variable both in urban andrural areas, while most previous studies only includedinpatient services [46] and the two studies using CFPSpanel data did not include any health service utilizationvariable [22, 26, 31]. In China, consultation visits tomedical institutions grew sharply from 5.8 billion visitsin 2010 to 8.3 billion visits in 2018, and the annualhospitalization rate jumped from 10.5 % in 2010 to18.2 % in 2018 [48]. Much of this growth in health
demand, and greater CHE risk, can be traced to China’sdistorted health care incentive mechanisms that encour-aged over-servicing. Based on pilot hospital reforms ex-perience, such as diagnosis-related groups (DRGs),canceling drug bonuses, lowering the prices of medicalconsumables, examinations and large medical equipmenttesting, we propose that the government should con-tinue an urgent assessment of the costs-benefits of thesereforms.We identified significant differences in CHE risk be-
tween rural and urban households, including householdhead sex and health insurance. Previous studies tookmainly a nationwide view of health insurance and CHE,with contradictory results [2, 4, 16, 27, 29, 39]. Most im-portantly, more than 80 % of the rural households werecovered by NRCMS, which provided more limited pro-tection against CHE compared to UEBMI [43]. Govern-ment should address the fragmented BMI schemes,aligning the benefit schedules.We recommended a coordinated approach to CHE re-
form. The government should continue to promote eco-nomic growth and to accelerate the financing level andrisk pooling of the BMI schemes, especially for NRCMS,to enhance the reimbursement ratio and provide fulleroutpatient service coverage. To improve the paymentcapacity of medical insurance funds, we suggest thecurrent funds, especially NRCMS, should be financed atthe city-province level not the county-level. Second, theintegration of BMI schemes should be promoted at thenational level to eliminate the fragmentation. Third, theCMI list should be broadened and based on treatmentneeds in relation to catastrophic illness and pharmaco-economics evaluations instead of following the BMI. Fi-nally, further assessment of hospital payment reform, re-imbursement policy reform and hospital innovations,such as DRGs, should be expedited to determine the ef-ficacy of their roll-out across the hospital system.
LimitationsThere are several limitations. The standard CHE calcula-tion used here excluded extremely poor households thatcannot afford health services. Future research shouldidentify families so poor they did not access a doctor.Second, OOP health expenditure in CFPS survey did notcover the non-medical direct and indirect cost for med-ical services, such as transportation expense, accommo-dation costs and income loss, which may lead to anunderestimate of the incidence and intensity of CHE.Third, the absence of data on the characteristics of hos-pitals, such as hospital level, should be addressed in fu-ture studies. Fourth, the situation where adult childrensupport their parents by paying for their medical care, orvice versa, should be addressed in future studies. Finally,CFPS health service utilization, health expenditure and
Liu et al. BMC Health Services Research (2021) 21:526 Page 9 of 12

household income were self-reported, which may be lessaccurate than data from medical records.
ConclusionsCHE incidence decreased from 2010 to 2018 both inurban and rural areas, but CHE was higher in rural thanurban households. For both urban and rural households,inpatient service usage remained the most important de-terminant of CHE incidence, while age was the weakestfactor. Almost all the included variables influenced CHEincidence in urban households (except gender and mar-riage) and rural household (except marriage). Both inurban and rural areas, the older household head’s age,poor and medium self-rated health, family members65 + years, members with doctor-diagnosed chronic dis-eases, low household income status, inpatient and out-patient service utilization significantly increased the riskof suffering CHE. There were differences in associationwith CHE risk between rural and urban households, in-cluding household head sex, education level and type ofhealth insurance. These findings have important policyimplications for healthcare delivery and financing inChina and other developing countries. To address CHE,the policy implications include improving the economiclevel of poor households and spreading equitably the percapita income benefits of economic growth; furtherreforming national health insurance schemes, especiallyimproving the benefit package of public basic insurance,and improving commercial insurance and specific insur-ance schemes for vulnerable populations; and reinforcingpre-payment hospital insurance methods to controlOOP hospital expenses.
AbbreviationsCHE: Catastrophic health expenditures; OOP: Out-of-pocket payments;CFPS: China Family Panel Studies; CTP: Capacity to pay; BMI: Basic medicalinsurance; UEBMI: Urban employee basic medical insurance; URBMI: Urbanresident basic medical insurance; NRCMS: New rural cooperative medicalscheme; CMI: Catastrophic medical insurance; SMI: Supplement medicalinsurance; DRGs: Diagnosis related groups; LPM: Linear probability modelling;OR: Odds ratio; CI: Confidence interval
Supplementary InformationThe online version contains supplementary material available at https://doi.org/10.1186/s12913-021-06533-x.
Additional file 1:
AcknowledgmentsWe gratefully acknowledge the China Family Panel Studies for providingdata and training in using the database. The authors also acknowledge thehelpful comments by the editor and reviewers.
Authors’ contributionsCL acquired the funding support, participated in the data analysis and wrotethe original draft. ZL contributed to the data analysis and resultsinterpretation. SN participated in editing the manuscript. JW conceived ofthe study design and was responsible for the revision. The authors read andapproved the final manuscript.
FundingThe research was supported by the Project from NHC Key Laboratory ofHealth Economics and Policy Research in Shandong University (NHC-NEPR2019005). The grant provided funding for the interpretation of the data.
Availability of data and materialsThe datasets used in this study were derived from China Family PanelStudies in the years of 2010,2012,2014,2016 and 2018. Available at: http://www.isss.pku.edu.cn/cfps/. Accessed 19 Aug 2019. The code used in thisstudy is available from the corresponding author on reasonable request.
Declarations
Ethics approval and consent to participateThe China Family Panel Studies were approved by the Ethical Committee ofPeking University; informed consent was obtained from all individualparticipants; and the data were collected in accordance with the ethicalstandards as laid down in the 1964 Declaration of Helsinki.
Consent for publicationNot applicable.
Competing interestsThe authors declare that they have no competing interests as defined byBMC, or other interests that might be perceived to influence the results and/or discussion reported in this paper.
Author details1School of Management, Tianjin University of Traditional Chinese Medicine,301617 Tianjin, China. 2Jining Medical University, 669 Xueyuan Road,Donggang District, 276826 Rizhao City, Shandong Province, China.3Australian National Institute of Management and Commerce, 1 CentralAvenue Australian Technology Park, Eveleigh, NSW 2015 Sydney, Australia.4School of Economics and School of Management, Tianjin Normal University,West Bin Shui Avenue, 300074 Tianjin, China. 5Research Institute forInternational Strategies, Guangdong University of Foreign Studies, BaiyunAvenue North, 510420 Guangzhou, China. 6Newcastle Business School,University of Newcastle, University Drive, 2308 Newcastle, NSW, Australia.7Dong Fureng Institute of Economic and Social Development, WuhanUniversity, No.54 Dongsi Lishi Hutong, Dongcheng District, 100010 Beijing,China. 8Center for Health Economics and Management, School of Economicsand Management, Wuhan University, 299 Bayi Road, Wuchang District,430072 Wuhan, Hubei Province, China.
Received: 10 December 2020 Accepted: 13 May 2021
References1. Zhu W, Xia Y. An analysis on household consumption-fueled borrowing in
China. J Finance Econ. 2018;44(10):67–81. https://doi.org/10.16538/j.cnki.jfe.2018.10.005.
2. Xu K, Evans DB, Kawabata K, et al. Household catastrophic healthexpenditure: a multicountry analysis. Lancet. 2003;362:111–7. https://doi.org/10.1016/S0140-6736(03)13861-5.
3. Wagstaff A, Van Doorslaer E. Catastrophic and impoverishment in paying forhealth care: with application to Vietnam 1993-98. Health Econ. 2003;12:921–34.https://doi.org/10.1002/hec.776.
4. Wagstaff A, Lindelow M. Can insurance increase financial risk? The curiouscase of health insurance in China. J Health Econ. 2008;27(4):990–1005.https://doi.org/10.1016/j.jhealeco.2008.02.002.
5. Dorjdagva J, Batbaatar E, Svensson M, Dorjsuren B, Kauhanen J. Catastrophichealth expenditure and impoverishment in Mongolia. Int J Equity Health.2016;15:105. https://doi.org/10.1186/s12939-016-0395-8.
6. Chuma J, Maina T. Catastrophic health care spending and impoverishmentin Kenya. BMC Health Serv Res. 2012;12:413. https://doi.org/10.1186/1472-6963-12-413.
7. Amaya-Lara JL. Catastrophic expenditure due to out-of-pocket healthpayments and its determinants in Colombian households. Int J EquityHealth. 2016;15:182–93. https://doi.org/10.1186/s12939-016-0472-z.
8. World Health Organization. Global Health Expenditure Database. https://apps.who.int/nha/database/Home/Index/zh. Accessed 10 Mar 2021.
Liu et al. BMC Health Services Research (2021) 21:526 Page 10 of 12
9. National Health Commission of the People’s Republic of China. Studyreport on total health expenditure in China. http://www.nhc.gov.cn/guihuaxxs/s10748/202006/ebfe31f24cc145b198dd730603ec4442.shtml.Accessed 02 May 2021.
10. Li Y, Wu Q, Xu L, Legge D, Hao Y, Gao L, et al. Factors affecting catastrophichealth expenditure and impoverishment from medical expenses in China:policy implications of universal health insurance. Bull World Health Organ.2012;90:664–71. https://doi.org/10.2471/BLT.12.102178.
11. Yin W. To accelerate the development of people’s health and promote theinnovation of medical insurance system. In: People’s Daily. 2016. http://healthpeople.com.cn/n1/2016/1010/c398004-28764621.html. Accessed 13 June2020.
12. He A, Wu S. Towards universal health coverage via social health insurancein China: systemic fragmengtation, reform imperatives, and policyalternatives. Appl Health Econ Health Policy. 2017;15:707–16. https://doi.org/10.1007/s40258-016-0254-1.
13. Meng Q, Fang H, Liu X, Yuan B, Xu J. Consolidating the social healthinsurance schemes in China: towards an equitable and efficient healthsystem. Lancet. 2015;386:1484–92. https://doi.org/10.1016/S0140-6736(15)00342-6.
14. Pan X, Xu J, Meng Q. Integrating social health insurance systems in China.Lancet. 2016;387:1274–75. https://doi.org/10.1016/S0140-6736(16)30021-6.
15. Zhao S, Zhang X, Dai W, Ding Y, Chen J, Fang, P. Effect of the catastrophicmedical insurance on household catastrophic health expenditure: evidencefrom China. Gaceta Sanitaria. 2020;34(4):370–76. https://doi.org/10.1016/j.gaceta.2018.10.005.
16. Wang Z, Li X, Chen S. Catastrophic health expenditures and its inequality inelderly households with chronic disease patients in China. Int J EquityHealth. 2015;14:8. https://doi.org/10.1186/s12939-015-0134-6.
17. Kien VD, Minh HV, Giang KB, et al. Socioeconomic inequalities incatastrophic health expenditure and impoverishment associated with non-communicable diseases in urban Hanoi, Vietnam. Int J Equity Health. 2016;15:169. https://doi.org/10.1186/s12939-016-0460-3.
18. Alkhatib AA, Hilden K, Adler DG. Impact of the policy of expanding benefitcoverage for cancer patients on catastrophic health expenditure acrossdifferent income groups in South Korea. Soc Sci Med. 2015;138:241–7.https://doi.org/10.1016/j.socscimed.2015.06.012.
19. Rahman M, Gilmour S, Saito E, Sultana P, Shibuya K. Health-related financialcatastrophe, inequality and chronic illness in Bangladesh. PLoS One. 2013;8:e56873. https://doi.org/10.1371/journal.pone.0056873.
20. Leng A, Li J, Nicholas S, Wang J. Catastrophic health expenditure ofcancer patients at the end-of-life: a retrospective observational study inChina. BMC Palliative Care. 2019;18(1):43. https://doi.org/10.1186/s12904-019-0426-5.
21. Guan X, Li H, Xin X, Guo Z, Ma L, Han S, et al. Research on equity andinfluential factors of medicine expenditure affordability for diabetes patientsin China. Chin Pharm Aff. 2015;29:1047–54. in Chinese. https://doi.org/10.16153/j.1002-7777.2015.10.010.
22. Sun J, Lyu SJ. The effect of medical insurance on catastrophic healthexpenditure: evidence from China. Cost Eff Resour Alloc. 2020;18(10):1–11.https://doi.org/10.1186/s12962-020-00206-y.
23. Zhang X, Xu Q, Xu L, Jing Z, Sun L, Li J, Zhou C. Catastrophic healthexpenditure: a comparative study between hypertensive patients with andwithout complication in rural Shandong, China. BMC Public Health. 2020;20(1):545. https://doi.org/10.1186/s12889-020-08662-0.
24. Quintal C. Evolution of catastrophic health expenditure in a highincome country: incidence versus inequalities. Int J Equity Health.2019(18):145–56. https://doi.org/10.1186/s12939-019-1044-9.
25. Yazdi-Feyzabadi V, Bahrampour M, Rashidian A, Haghdoost AA, JavarMA, Mohammad Hossein Mehrolhassani. Prevalence and intensity ofcatastrophic health care expenditures in Iran from 2008 to 2015: astudy on Iranian household income and expenditure survey. Int JEquity Health. 2018;17(1):44. https://doi.org/10.1186/s12939-018-0743-y.
26. Liu H, Zhu H, Wang J, Qi X, Zhao M, Shan L, et, al. Catastrophic healthexpenditure incidence and its equity in China: a study on the Initialimplementation of the medical insurance integration system. BMC PublicHealth. 2019;19(1):1761. https://doi.org/10.1186/s12889-019-8121-2.
27. Jue Y, Yong L, Nina H. Empirical study on the relief effect ofcatastrophic health expenditure under three basic medical schemes.Chin Health Econ. 2012;31(1):26–8. in Chinese. https://doi.org/10.3969/j.issn.1003-0743.2012.01.008.
28. Wang Y, Xu D. Can basic medical insurance reduce catastrophic healthspending for residents? Evidence from data of CHARLS. Financ TheoryPract. 2019;41(2):87–94. in Chinese https://doi.org/10.3969/j.issn.1003-4625.2019.02.012.
29. Guo N, Iversen T, Lu M, Wang J, Shi L. Does the new cooperative medicalscheme reduce inequality in catastrophic health expenditure in rural China?BMC Health Serv Res. 2016;16(1):653. https://doi.org/10.1186/s12913-016-1883-7.
30. Cheng H, Augustin D, Glass EH, Anthony JC. Nation-scale primaryprevention to reduce newly incident adolescent drug use: the issue of lagtime. Peer. 2019;7(11):e6356. https://doi.org/10.7717/peerj.6356.
31. Zhao Y, Oldenburg B, Mahal A, Lin Y,Tang S, Liu X. Trends and socio-economic disparities in catastrophic health expenditure and healthimpoverishment in China: 2010 to 2016. Trop Med Int Health. 2019;25(2):236–47. https://doi.org/10.1111/tmi.13344.
32. Xie Y, Lu P. The sampling design of the China Family Panel Studies(CFPS). Chin J Sociol. 2015:1(4):471–84. https://doi.org/10.1177/2057150X15614535.
33. Hoetker, Glenn P. Confounded coefficients: Extending recent advances inthe accurate comparison of logit and probit coefficients across groups.Working paper. Oct. 22, 2004. University of Illinoisat urbana-chanpaign.www.Public.Asu.edu/…/research/Hoetker-confounded.wp.pdf. https://doi.org/10.2139/ssrn.609104.
34. Wooldridge, Jeffery M. Econometric analysis of cross sectional and paneldata. Cambridge: MIT press; 2002. https://doi.org/10.1108/02635570710822822.
35. Mood C. Logistic regression: why we cannot do what we think we can do,and what can do about it. Eur Sociol Rev. 2010;26(1):67–82. https://doi.org/10.2307/40602478.
36. Karlson, Kristian B, Anders H, Richard B. Comparing regression coefficientsbetween same-samples nested models using logit and probit: a newmethod. Sociol Methodol. 2013;42(1): 286–313. https://doi.org/10.1177/0081175012444861.
37. Hong Y. On the coefficients comparison between logistic regression andthe solutions: a brief review. Chin J Sociol. 2015;35(04):227–48. In Chinese.https://doi.org/10.15992/j.cnki.31-1123/c.2015.04.009.
38. Wu D, Yu F. Improvement of the reduction in catastrophic healthexpenditure in China’s public health insurance. PLoS ONE. 2018;13:e0194915. https://doi.org/10.1371/journal.pone.0213243.
39. Meng Q, Xu L, Zhang Y, Qian J, Cai M, Xin Y, Gao J, Xu K, BoermaJT, Barber SL. Trends in access to health services and financialprotection in China between 2003 and 2011: a cross-sectional study.Lancet. 2012: 379(9818): 805–14. https://doi.org/10.1016/S0140-6736(12)60278-5.
40. Abu-Zaineh M, Romdhane HB, Ventelou B, Moatti JP, Chokri A.Appraising financial protection in health: the case of Tunisia. Int JHealth Care Finance Econ. 2013;13(1):73–93. https://doi.org/10.1007/s10754-013-9123-8.
41. O’Donnell O, Doorslaer E, Rannan-Eliya A, Somanathan C, Doorslaer E,Rannan-Eliya S. Explaining the incidence of catastrophic payments forhealth care: comparative evidence from Asia. EQUITAP Working Paper No. 5.2005.
42. Embassy of the People’s Republic of China in the Federal Republic ofGermany. China’s health care reform. http://www.fmprc.gov.cn/ce/cede/det/dshd/t787403.htm. Accessed 17 Jan 2011.
43. Chen Z, Jiang Y. Li W.; Chen Z, Jiang Y. Li W. Does NRCMS reduce theincidence and intensity of catastrophic out-of -pocket healthexpenditure? Based on universal coverage of CRCMS. Finan Econ.2016;12:110–20.
44. Arsenijevic J, Pavlova M, Rechel B, Groot W. Catastrophic health careexpenditure among older people with chronic diseases in 15 Europeancountries. PLoS One. 2016;11(7):e0157765. https://doi.org/10.1371/journal.pone.0157765.
45. Wang J, Chen L, Ye T, Zhang Z, Ma J. Financial protection effects ofmodification of China’s New Cooperative Medical Scheme on ruralhouseholds with chronic diseases. BMC Health Serv Res. 2014;14(1):305.https://doi.org/10.1186/1472-6963-14-305.
46. Wang J, Zhu H, Liu H, Wu K, Zhang X, Zhao M, et al. Can the reform ofintegrating health insurance reduce inequity in catastrophic healthexpenditure? Evidence from China. Int J Equity Health. 2020;19(1):49. https://doi.org/10.1186/s12939-020-1145-5.
Liu et al. BMC Health Services Research (2021) 21:526 Page 11 of 12

47. Su T, Kouyaté B, Flessa S. Catastrophic household expenditure for healthcare in a low income society: a study from Nouna district, Burkina Faso. BullWorld Health Organ. 2006;84:21–7. https://doi.org/10.1590/S0042-96862006000100010.
48. National Health Commission of the People’s Republic of China. Bulletin ofnational health commission of the People’s Republic of China. http://www.nhc.gov.cn/wjw/gongb/list.shtml. Accessed 22 May 2019.
Publisher’s NoteSpringer Nature remains neutral with regard to jurisdictional claims inpublished maps and institutional affiliations.
Liu et al. BMC Health Services Research (2021) 21:526 Page 12 of 12