tree species composition and structure of dry forest...
TRANSCRIPT

BIODIVERSITAS ISSN: 1412-033X Volume 19, Number 2, March 2018 E-ISSN: 2085-4722 Pages: 496-503 DOI: 10.13057/biodiv/d190217
Tree species composition and structure of dry forest in Mutis Timau Protected Forest Management Unit of East Nusa Tenggara, Indonesia
AAHAAH AHMAD ALMULQU1,2,♥, NOULKAMOL ARPORNPONG3, JARUNTORN BOONYANUPHAP3♥♥ 1Graduate School of Naresuan University. 99 moo 9 Tapho, Phitsanulok-Nakornsawan Rd., Phitsanulok, 65000 Thailand. Tel.: +66-5596-8821, Fax.:
+66-5596-8829, ♥[email protected] 2Politeknik Pertanian Negeri Kupang. Kupang 85011, East Nusa Tenggara, Indonesia
3Faculty of Agriculture Natural Resources and Environment, Naresuan University. Muang, Phitsanulok 65000, Thailand, ♥♥email: [email protected]
Manuscript received: 6 September 2017. Revision accepted: 27 February 2018.
Abstract. Almulqu AA, Arpornpong N, Boonyanuphap J. 2018. Tree species composition and structure of dry forest in Mutis Timau Protected Forest Management Unit of East Nusa Tenggara, Indonesia. Biodiversitas 19: 496-503. Plots 10,000 m2 were established in four sites of Mutis Timau Protected Forest Management Unit (Mutis Timau PFMU), in order to determine tree species density, basal area, importance value index, species richness and to identify the relationship betwen species richness and abundance of trees. A total of 94 species belonging to 72 genera and 45 families were recorded. Species richness and forest structure were different between sites. Moraceae was the dominant tree family at most sites, particulary for Eucalyptus urophylla. The results suggest controlling the number of species, level on species distribution pattern, silvicultural interventions to pioneer species through thinning liberation, seeding and planting (pioneer species) could accelerate the tree regeneration of Mutis Timau PFMU in Kupang District, East Nusa Tenggara Province, Indonesia.
Keywords: Forest structure, Mutis Timau PFMU, silvicultural interventions, species diversity, species richness, species abundance
INTRODUCTION
Dry tropical forest communities are among the world's most threatened systems and urgent measures are required to protect and restore them in degraded landscapes (Sagar and Singh 2006). Tropical dry forests, the most endangered and probably the most fragmented lowland forest in the tropics (Janzen 1988), have relatively low species diversity (Gentry 1995) and the trees are particularly vulnerable compared with other plant forms because they take a long time to reach reproductive age. They are also associated with low productivity, high mortality rates, increasing demand for food and energy and declining land productivity (FAO 2009). For planning conservation strategies, there is a need to determine the few essential measurable properties, such as number of species and basal area, that best describe the dry forest vegetation and its environment, and to document quantitative relationships among them (Sagar and Singh 2006).
According to Sagar et al. (2003), biodiversity inventories are used to determine the nature and distribution of biodiversity resources of the forests to be managed. Information from this quantitative inventory will provide a valuable reference for forest assessment and improve our knowledge by the identification of ecologically, useful species as well as species of special concern, thus identifying conservation efforts for sustainability of forest biodiversity (Naidu and Kumar 2016).
Information on composition, diversity of tree species and species-rich communities is primary importance in the
planning and implementation of biodiversity conservation efforts (Suratman 2012). For a good forest conservation plan, understanding tree species composition and knowledge of the forest stand structure is necessary (Farhadi et al. 2013). Because trees, an important component of vegetation, must be constantly monitored and managed in order to direct successional processes towards maintaining species and habitat diversity (Attua and Pabi 2013). Variables that influence the tree species diversity are climate, stand structure, species composition, and geomorphology. Forest stand structure is a key element in understanding forest ecosystems and also an important element of stand biodiversity (Ozcelik 2009).
Until today, only little published scientific information on the tree species composition and structure in the dry forest of Mutis Timau Protected Forest Management Unit (Mutis Timau PFMU), although biodiversity conservation in Mutis Timau PFMU received attention from the central government, local government and international conservation agencies. Such surveys by the Food and Agriculture Organization of the United Nations, in collaboration with the Department of Forestry’s Directorate General of Forest Protection and Nature Conservation, identified priority areas for conservation in 1980 (MacKinnon et al. 1982). Only one detailed study on Eucalyptus urophylla forests, using floristic and structural data, was conducted at Mutis Timau dry forest (Robinson and Supriadi 1981).
Here, we report on the tree species community and forest structure of dry forest in Mutis Timau PFMU. The study aims (i) to identify and inventory tree species in

ALMULQU et al. – Tree species of dry forest in Mutis Timau, East Nusa Tenggara, Indonesia
497
Mutis Timau PFMU, (ii) detail forest structure and composition of tree species (in terms of density, basal area and importance value index) Mutis Timau PFMU in Kupang District, East Nusa Tenggara Province, Indonesia.
MATERIALS AND METHODS
Study area The study was carried out at the Mutis Timau Protected
Forest Management Unit (Mutis Timau PFMU) of East Nusa Tenggara Province, Indonesia. This area includes Kupang District, Timor Tengah Selatan District and Timor Tengah Utara District (Lat. 90 20’ 00” - 90 45’ 10” South and long. 123.042’30” - 124.0 20’ 00” E) (Figure 1). Data for this study were collected from 4 dry forest study sites in Kupang District, named Binafun, Bonmuti, Letkole and Oelbanu, each study site consisting of two 10.000 m² plots. The detail description of the study sites is given in Table 1.
The research sites represent the dry forests of East Nusa Tenggara, Indonesia, and surrounding areas are the wettest areas on the island of Timor, the rain fell almost every month with the highest frequency of rainfall occurs during November to July, temperatures range between 140C - 290C, and in extreme conditions can decrease up to 90C. High-speed winds occurred in November until March. About 71% areas are hilly (15-30% slope) to mountainous
(>30% slope). The high-intensity rainfall (2000-3000 mm/year) during the rainy season (Fisher et al. 1999).
Plot setting The fieldwork was carried out during 7 months on May
2016 to November 2016. In that time, the study of tree diversity and community structure were conducted from the four study sites. To obtain data on the composition and diversity of vegetation we used sampling plots in a rectangular shape, with a size of 100 m x 100 m (1 ha). The plot design consists of two 1-ha plots per site. In each plot, all tree species were measured for species name, height, and diameter at breast height (DBH) ≥ 20 cm (1.3 meters).
Data analysis The tree species richness was calculated as the number
of tree species per 1-ha plot, and the total tree species richness was calculated as the number of tree species per site. The density of a species was the number of trees of that species per hectare. The relative density of a species was calculated as its density divided by the total density of all species and multiplied by 100. The frequency of a species was the number of plots in which that species was found. The relative frequency of a species was calculated as the frequency of a species divided by the total number of sampling plots and multiplied by 100 (Koonkhunthod et al. 2007).
Figure 1. Location of research sites at Mutis Timau PFMU, East Nusa Tenggara Province, Indonesia
Letkole
Oelbanu
Bonmuti
Binafun
MountMutis

B IODIVERSITAS 19 (2): 496-503, March 2018
498
Table 1. Description of research sites at Mutis Timau PFMU, Kupang District, East Nusa Tenggara Province, Indonesia Site 1 2 3 4 Village Binafun Bonmuti Letkole Oelbanu Sub-district Amfoang Tengah Amfoang Tengah Amfoang Barat Daya Amfoang Selatan District Kupang Kupang Kupang Kupang Longitude S 09039’12 9.22’’ S 09037’46.50’’ S 09041’02.62’’ S 09042’28.59’’ Latitude E 124001’421.16’’ E 12409127.92’’ E 123048’ E 123053’04.82’’ Geologya Mixed volcanic and
limestone rock Mixed volcanic and limestone rock
Mixed volcanic and limestone rock
Mixed volcanic and limestone rock
Rainfall (mm.year-1)b 1301 1405 1203 1254 Temperature (°C) b 24.1 21.4 26.4 25.3 Slope (°) 0-14 0-26 0-10 0-12 Elevation (m) 513-635 631-1007 122-125 310-636 Driest month b September (5mm) August (12mm) September (3mm) September (4mm) Wettest month b January (280mm) January (263mm) January (307mm) January (301mm) Highest temperatureb 25.40C (November) 22.70C (November) 27.60C (November) 26.60C (November) Lowest temperatureb 22.60C (July) 19.70C (July) 25.00C (July) 23.90C (July) Dry periods June-October June-September May-October May-October Rain periods December-May October-May September-April December-April Note: a)Fisher et al. (1999), b) BPS (2016)
The Importance value Index for a species is a composite of three ecological parameters including density, frequency and basal area, which measure different features and characteristics of a species in its habitat. Basal area per tree is the cross-sectional area of a tree at breast height. It was calculated from the diameter at breast height. Ecologically, density and frequency of a species measure the distribution of a species within the population while basal area measures the area occupied by the stems of trees.
RESULTS AND DISCUSSION
Tree species composition in research sites A total of 2097 trees, representing 94 species, 72
genera and 45 families, were identified within the 8.0 ha survey area. In this study, species number reaches its maximum value (74) at Letkole (tree) and minimum (6) at Oelbanu (sapling). The 4 sites are ranked in the same order according to the highest and the lowest observed values of species richness, i.e. species number is maximum value (36, 36, 22, 22, 53, 74, 18, 23, respectively) at Binafun (pole and tree), Bonmuti (pole and tree), Letkole (pole and tree) and Oelbanu (pole and tree) while minimum (16, 15, 30, 6, respectively) at Binafun (sapling), Bonmuti (sapling), Letkole (seedling) and Oelbanu (sapling) (Figure 2).
The composition of the forest is diverse and varies from place to place because of varying topography such as plains, foothills and upper mountains (Singh 2006). The different changing site conditions, from the base to the summit of mountains, originates the diversification of habitats. Changes in structure and species composition along elevational gradients were described in the Andes (Smith and Killeen 1998) and Central America (Vásquez and Givnish 1998). Altitudinal changes in biogeographical patterns were reported in Sulawesi in Indonesia (Culmsee and Pitopang 2009), where there is a progression from dominant tropical families in the submontane zone to
tropical Fagaceae (Castanopsis, Lithocarpus) in the lower/mid-montane. Sapotaceae, in particular, make a significant contribution to submontane forest and Magnoliaceae to mid-montane forest. Our studies show similar biogeographical patterns with altitude. Myrtaceae has the highest species richness in the Binafun, Bonmuti, Oelbanu forests, and Meliaceae in Letkole dry forest. If we rank the sites by their compositions, the dominance of Meliaceae decreased according to this scheme: Oelbanu > binafun > Bonmuti.
In this study, the tree species of dry forest was characterized by differences in DBH size classes (Figure 3). Generally, the numbers of stems in the >25.5 cm DBH size classes were higher in all research sites compared to others DBH class. Within the vegetation, the tree (>25.5cm) was dominated by dry forest with high DBH. Binafun had the highest number of stems in the 4.5-11.5 and >25.5 cm DBH size classes (133 and 174 stems, respectively). The highest number of stems in the 4.5-11.5 and >25.5 cm DBH size classes were in Bonmuti (60 and 95 stems, respectively). Letkole and Oelbanu had the highest number of stems in the 18.5-25.5 and >25.5 cm DBH size classes (64,199 and 87, 221 stems, respectively).
Figure 2.Species number of plant species in the research sites

ALMULQU et al. – Tree species of dry forest in Mutis Timau, East Nusa Tenggara, Indonesia
499
Density and species richness The mean stand density was 353.62 individuals/ha. The
highest stand density was observed in plot 2 of Oelbanu (545 individuals/ha), whereas the lowest stand density was observed in plot 1 of Oelbanu (166 individual/ha), and the other six plots showed moderate densities (Figure 4). The basal area in all the study plots ranged from 5.78 m2/ha (plot 2 of Bonmuti) to 27.79 m2/ha (plot 1 of Binafun) and the mean basal area for the four plots was 19.97 m2/ha (Figure 5). The basal area was highest in Binafun and lowest in Bonmuti (plot 2).
Eucalyptus urophylla had higher densities than other species in Binafun (51 stem ha-1), Bonmuti (46 stem ha-1) and Oelbanu (127 stem ha-1). The density value of a tree species is very important because it can show the number of occurrences for this species concerned on a particular unit area, the density value is an idea of vegetation amount at each research site. The representation of individual distribution of particular species of vegetation can be seen in the value of frequency. The highest (19.480 %) value of all research sites was found for Eucalyptus urophylla. But, in the dry forest of Bonmuti and Binafun, Elattostachys verrucosa, potentially could change the domination of Eucalyptus urophylla at tree stage because consistently, this species had high IVI (18.4-88.8%) on seedling, sapling, and pole.
The tree density in Letkole was higher than in other sites, except for Oelbanu plot 2 (545 stems ha-1), which showed the greatest density, while plot 1 of Oelbanu had the lowest density. At plot 2 of Oelbanu showed the greatest density; while at site 1 of Oelbanu, density was the lowest. This different may be related to the topographic variable aspect that influences parameters such as exposure to sunlight, drying winds and evapotranspiration. Therefore, aspect has implications to physiological of the species and ecological requirements such as community structure and species distribution of trees (Tagil 2015). However, further study on topographic factors is necessary.
The highest rank of density was measured for all research sites (Figure 6). This graph ranks, for each site, the number of species by decreasing density. For example in Binafun, only 1 species (Eucalyptus urophylla) have a density of more than 50 stems ha-1, and only 3 species (Syzygium javanica, Prunus sp. and Elattostachys verrucosa) have a density of more than 30 stems ha-1. The graph shows that in Binafun 2 species (Eucalyptus urophylla) are dominant in terms of stem density, 5 species (Celtis cinnamomea, Hibiscus timoriensis, Phaleria laurifolia, Elattostachys verrucosa and Eucalyptus urophylla) in Bonmuti, 7 species (Ficus ampelos, Celtis cinnamomea, Dysoxylum gaudichaudianum, Wikstroemia androsaemifolia, Drypetes macrophylla, Aglaia heptandra and Melaleuca leucadendron) in Letkole, 5 species (Vitex parviflora, Dryobalanops aromatic, Schleichera oleosa, Ceriops tagal and Eucalyptus urophylla) in Oelbanu.
In this research, we found 74 species of trees that occurred only at level of trees (DBH > 25.5 cm), most of them provided in Letkole dry forest i.e. 27 species in Binafun, 17 species in Bonmuti, 46 species in Letkole and
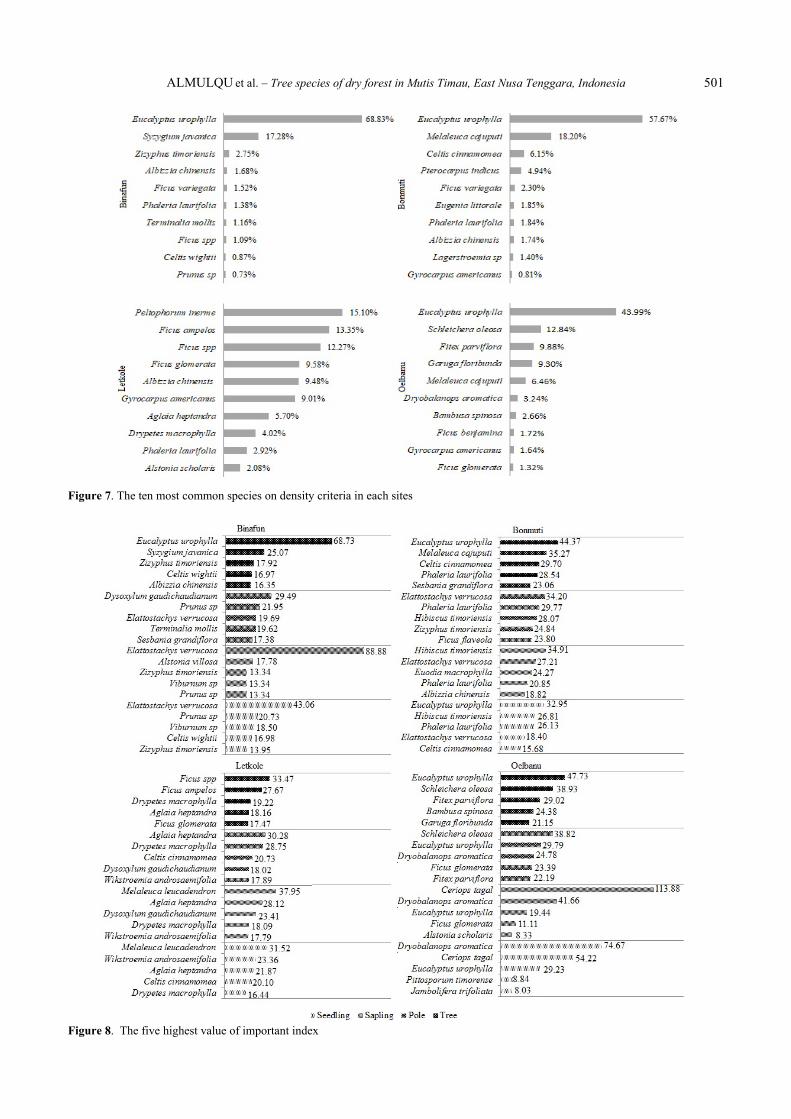
20 species in Oelbanu (Table 2). The most common family in the research sites was
Moraceae which was composed of 14 species (Table 2). Figure 7 show the ten most common species on density criteria in each sites, where its around 97.28% of a total of 365 stands, 96.90% of 373 stands, 83.50% of a total 759 stands and 93.05% of a total of 600 stands for Binafun, Bonmuti, Letkole and Oelbanu, respectively.
Figure 3. Stem number of plant species in the research sites
Figure 4. Density of plant species in the research sites
Figure 5. Basal area of tree species in the research sites

B IODIVERSITAS 19 (2): 496-503, March 2018
500
Figure 6. Cumulative ranked abundance curves of tree species in the research sites
Table 2. Density for each tree species which have DBH >25.5 cm in the research sites
Species Family
Number of stand
Bin
afun
Bon
mut
i
Let
kole
Oel
banu
Acacia oraria Mimosaceae 2 Aglaia heptandra Meliaceae 1 15 Albizia lebekioides Fabaceae Albizia procera Fabaceae 1 Albizia saponaria Fabaceae 2 Albizzia chinensis Fabaceae 5 5 3 Alstonia scholaris Apocynaceae 4 Alstonia villosa Apocynaceae 1 Bambusa spinosa Poaceae 1 Bauhinia malabarica Leguminosae Broussonetia papyrifera Moraceae 1 Canarium asperum Burseraceae Casuarina junghuhniana Casuarinaceae 1 Celtis cinnamomea Ulmaceae 1 17 Celtis wightii Ulmaceae 6 1 Ceriops tagal Rhizophoraceae Cordia spp. Boraginaceae 1 8 Cudrania cochinchinensis Moraceae. 1 Desmodium cephalotis Cephalotaceae Dryobalanops aromatica Dipterocarpaceae 22Drypetes longifolia Putranjivaceae Drypetes macrophylla Putranjivaceae 20 Dysoxylum gaudichaudianum Meliaceae 3 4 Elattostachys verrucosa Sapindaceae 1 Eleocarpus peyiolatus Elaeocarpaceae Eucalyptus urophylla Myrtaceae 50 21 87Eugenia littorale Myrtaceae 4 Eugenia polyantha Myrtaceae 2 Euodia macrophylla Rutaceae 2 1 Exocarpus latifolia Santalaceae 1 Ficus ampelos Moraceae 1 1 27 Ficus benjamina Moraceae 1 8
Ficus callosa Moraceae 1 Ficus flaveola Moraceae 4 Ficus fulva Moraceae 1 1 Ficus gibbosa Moraceae 1 Ficus glomerata Moraceae 1 14 10Ficus hispida Moraceae 3 Ficus nervosa Moraceae 6 1 Ficus racemosa Moraceae 4 Ficus spp. Moraceae 2 1 Ficus variegata Moraceae 3 1 2 Garuga floribunda Burseraceae 2 17Gnetum gnemon Gnetaceae Gyrocarpus americanus Hernandiaceae 1 2 12 11Harissonia perforata Simaroubaceae 2 Hibiscus tiliaceus Malvaceae 2 Hibiscus timoriensis Malvaceae Homalium tomantosum Salicaceae 1 Hymenodictyon excelsum Rubiaceae 2 Jambolifera trifoliata Rutaceae 2 Kleinhovia hospita Malvaceae 1 Lagerstroemia sp. Lythraceae 7 1 Lantana camara Verbenaceae Leea sp.. Vitaceae Litsea difersifolia Lauraceae 3 Macaranga tanarius Euphorbiaceae 2 1 Maesa latifolia Primulaceae 1 Mallotus philippinensis Euphorbiaceae 1 Mangifera indica Anacardiaceae Melaleuca cajuputi Myrtaceae 15 15Melaleuca leucadendron Myrtaceae 1 Mischocarphus sundaicus Sapindaceae Nauclea orientalis Rubiaceae 3 Nephelium juglandifolium Sapindaceae 2 Omalanthus populneus Euphorbiaceae Oroxylum indicum Bignoniaceae Peltophorum inerma Fabaceae 3 5 Phaleria laurifolia Thymelaeaceae 6 8 5 Photinia sp. Rosaceae Phyllanthus sp.. Phyllanthaceae Pipturus argenteus Urticaceae 3 Pittosporum timorense Pittosporaceae 1 Podocarpus amara Podocarpaceae 1 Podocarpus imbricata Podocarpaceae 1 Polyscias rumphiana Araliaceae Prunus sp. Rosaceae 5 1 Pterocarpus indicus Fabaceae 2 Pterocymium tinetorium Malvaceae Pygeum parviflorum Rosaceae 3 Schleichera oleosa Sapindaceae 2 63Sesbania grandiflora Fabaceae 1 Sterculia foetida Sterculiaceae 2 Syzygium javanica Myrtaceae 12 Tamarindus indica Fabaceae 6 Tarenna pubiflora Rubiaceae 3 Terminalia catappa Combretaceae 2 Terminalia mollis Combretaceae 2 1 Timonius sericaus Rubiaceae 2 1 Viburnum sp. Adoxaceae 1 1 Vitex parviflora Verbenaceae 40Wikstroemia androsaemifolia Thymelaeaceae 1 Wrightia calysina Apocynaceae Zizyphus timoriensis Rhamnaceae 9 1
ALMULQU et al. – Tree species of dry forest in Mutis Timau, East Nusa Tenggara, Indonesia
501
Figure 7. The ten most common species on density criteria in each sites
Figure 8. The five highest value of important index
B IODIVERSITAS 19 (2): 496-503, March 2018
502
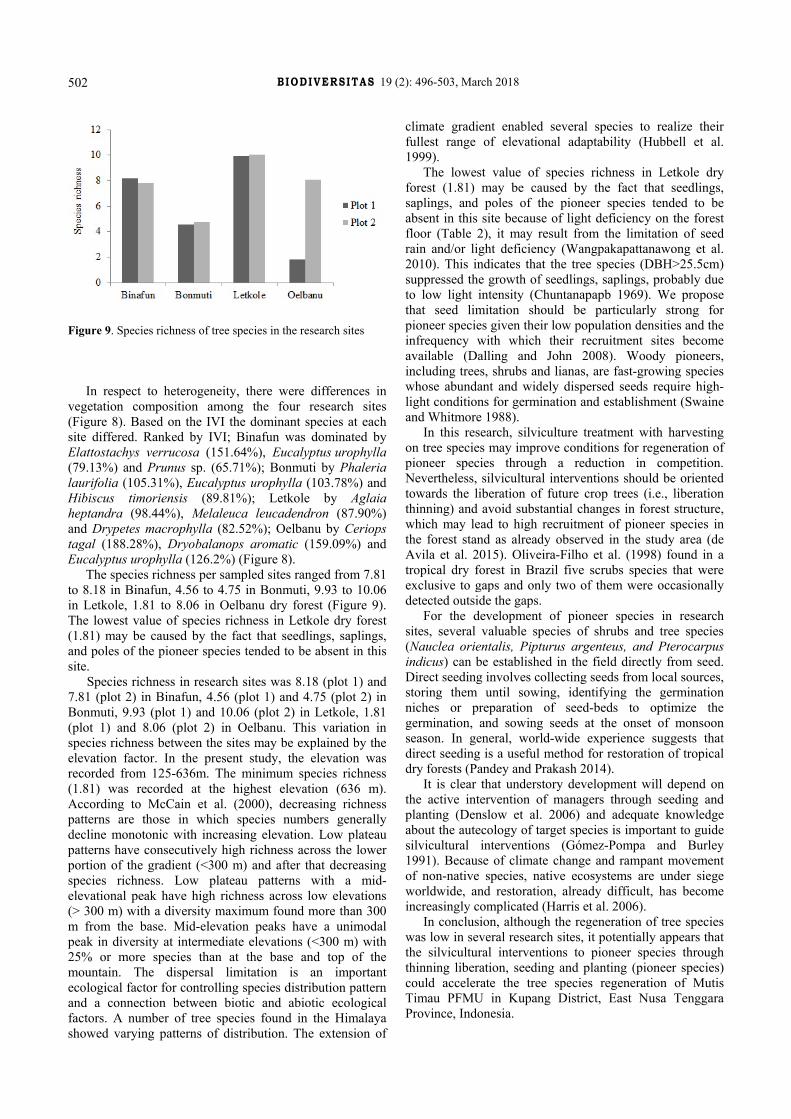
Figure 9. Species richness of tree species in the research sites
In respect to heterogeneity, there were differences in
vegetation composition among the four research sites (Figure 8). Based on the IVI the dominant species at each site differed. Ranked by IVI; Binafun was dominated by Elattostachys verrucosa (151.64%), Eucalyptus urophylla (79.13%) and Prunus sp. (65.71%); Bonmuti by Phaleria laurifolia (105.31%), Eucalyptus urophylla (103.78%) and Hibiscus timoriensis (89.81%); Letkole by Aglaia heptandra (98.44%), Melaleuca leucadendron (87.90%) and Drypetes macrophylla (82.52%); Oelbanu by Ceriops tagal (188.28%), Dryobalanops aromatic (159.09%) and Eucalyptus urophylla (126.2%) (Figure 8).
The species richness per sampled sites ranged from 7.81 to 8.18 in Binafun, 4.56 to 4.75 in Bonmuti, 9.93 to 10.06 in Letkole, 1.81 to 8.06 in Oelbanu dry forest (Figure 9). The lowest value of species richness in Letkole dry forest (1.81) may be caused by the fact that seedlings, saplings, and poles of the pioneer species tended to be absent in this site.
Species richness in research sites was 8.18 (plot 1) and 7.81 (plot 2) in Binafun, 4.56 (plot 1) and 4.75 (plot 2) in Bonmuti, 9.93 (plot 1) and 10.06 (plot 2) in Letkole, 1.81 (plot 1) and 8.06 (plot 2) in Oelbanu. This variation in species richness between the sites may be explained by the elevation factor. In the present study, the elevation was recorded from 125-636m. The minimum species richness (1.81) was recorded at the highest elevation (636 m). According to McCain et al. (2000), decreasing richness patterns are those in which species numbers generally decline monotonic with increasing elevation. Low plateau patterns have consecutively high richness across the lower portion of the gradient (<300 m) and after that decreasing species richness. Low plateau patterns with a mid-elevational peak have high richness across low elevations (> 300 m) with a diversity maximum found more than 300 m from the base. Mid-elevation peaks have a unimodal peak in diversity at intermediate elevations (<300 m) with 25% or more species than at the base and top of the mountain. The dispersal limitation is an important ecological factor for controlling species distribution pattern and a connection between biotic and abiotic ecological factors. A number of tree species found in the Himalaya showed varying patterns of distribution. The extension of
climate gradient enabled several species to realize their fullest range of elevational adaptability (Hubbell et al. 1999).
The lowest value of species richness in Letkole dry forest (1.81) may be caused by the fact that seedlings, saplings, and poles of the pioneer species tended to be absent in this site because of light deficiency on the forest floor (Table 2), it may result from the limitation of seed rain and/or light deficiency (Wangpakapattanawong et al. 2010). This indicates that the tree species (DBH>25.5cm) suppressed the growth of seedlings, saplings, probably due to low light intensity (Chuntanapapb 1969). We propose that seed limitation should be particularly strong for pioneer species given their low population densities and the infrequency with which their recruitment sites become available (Dalling and John 2008). Woody pioneers, including trees, shrubs and lianas, are fast-growing species whose abundant and widely dispersed seeds require high-light conditions for germination and establishment (Swaine and Whitmore 1988).
In this research, silviculture treatment with harvesting on tree species may improve conditions for regeneration of pioneer species through a reduction in competition. Nevertheless, silvicultural interventions should be oriented towards the liberation of future crop trees (i.e., liberation thinning) and avoid substantial changes in forest structure, which may lead to high recruitment of pioneer species in the forest stand as already observed in the study area (de Avila et al. 2015). Oliveira-Filho et al. (1998) found in a tropical dry forest in Brazil five scrubs species that were exclusive to gaps and only two of them were occasionally detected outside the gaps.
For the development of pioneer species in research sites, several valuable species of shrubs and tree species (Nauclea orientalis, Pipturus argenteus, and Pterocarpus indicus) can be established in the field directly from seed. Direct seeding involves collecting seeds from local sources, storing them until sowing, identifying the germination niches or preparation of seed-beds to optimize the germination, and sowing seeds at the onset of monsoon season. In general, world-wide experience suggests that direct seeding is a useful method for restoration of tropical dry forests (Pandey and Prakash 2014).
It is clear that understory development will depend on the active intervention of managers through seeding and planting (Denslow et al. 2006) and adequate knowledge about the autecology of target species is important to guide silvicultural interventions (Gómez-Pompa and Burley 1991). Because of climate change and rampant movement of non-native species, native ecosystems are under siege worldwide, and restoration, already difficult, has become increasingly complicated (Harris et al. 2006).
In conclusion, although the regeneration of tree species was low in several research sites, it potentially appears that the silvicultural interventions to pioneer species through thinning liberation, seeding and planting (pioneer species) could accelerate the tree species regeneration of Mutis Timau PFMU in Kupang District, East Nusa Tenggara Province, Indonesia.

ALMULQU et al. – Tree species of dry forest in Mutis Timau, East Nusa Tenggara, Indonesia
503
ACKNOWLEDGEMENTS
We would like to acknowledge the Mutis Timau PFMU East Nusa Tenggara, Indonesia for all facilities, and all convenience
REFERENCES
Attua EM, Pabi O. 2013. Tree species composition, richness and diversity in the northern forest-savanna ecotone of Ghana. J Appl Biosci 69: 5437-5448.
BPS. 2016. Kupang District in figures. BPS - Statistics of Kupang District, Kupang. [Indonesian].
Chuntanapapb L. 1969. Effect of improvement felling on increment and natural regeneration of teak forest. For Res Bull 7: 1-25. [Thailand].
Culmsee H, Pitopang R. 2009. Tree diversity in sub-montane and lower montane primary rainforests in Central Sulawesi. Blumea 54: 119-123.
Dalling JW, John R. 2008. Seed limitation and the coexistence of pioneer tree species. In: Carson WP, Schnitzer SA (eds.). Tropical Forest Community Ecology. Wiley-Blackwell, New York.
De avila AL, Ruschel AR, De Carvalho JOP, Mazzei L, Silva JNM, Lopes JDC, Araujo MM, Dormann CF, Bauhus J. 2015. Medium-term dynamics of tree species composition in response to silvicultural intervention intensities in a tropical rain forest. Biol Conserv 191: 577-586.
Denslow JS, Uowolo AL, Hughes RF. 2006. Limitations to seedling establishment in a mesic Hawaiian forest. Oecologia 148: 118-128.
FAO. 2009. Towards defining forest degradation: Comparative analysis of existing definitions by Simula. Forest Resources Assessment Working Paper No. 154. FAO, Rome.
Farhadi P, Soosani J, Alijani V, Adeli K. 2013. Comparison of the Quercus brantii and Pyrus glabra Boiss species structure in Zagros Forests (Case Study: Ghalehgol Forest, Khoramabad City, Iran). Intl J Biol Sci 3: 210-217.
Fisher L, Moeliono I, Wodicka S. 1999. The Nusa Tenggara uplands, Indonesia: Multiple-site lessons in conflict management. In: Buckles D (ed.). Cultivating peace: Conflict and Collaboration in Natural Resource Management. International Development Research Centre and World Bank, New York.
Gentry AH. 1995. Diversity and floristic composition of neotropical dry forests. In: Bullock SH, Mooney HA, Medina E (eds.). Seasonally Dry Tropical Forests. Cambridge University Press, New York.
Gomez-Pompa A, Burley FW. 1991. The management of natural tropical forests. In: Gomez-Pompa A, Whitmore TC, Hadley M (eds.). Rain Forest Regeneration and Management. Parthenon, Paris.
Harris JA, Hobbs RJ, Higgs E, Aronson J. 2006. Ecological restoration and climate change. Restor Ecol 14: 170-176.
Hubbell SP, Foster RB, O'brien S, Wechsler B, Condit R, Harms K, Wright SJ, Loo de lau S. 1999. Light-gap disturbances, recruitment limitation and tree diversity in a Neotropical forest. Science 283: 554-557.
Janzen DH. 1988. Management of habitat fragments in a tropical dry forest: growth. Ann Missouri Bot Gard 75: 105-116.
Koonkhunthod N, Sakurai K, Tanaka S. 2007. Composition and diversity of woody regeneration in a 37-year-old teak (Tectona grandis L.) plantation in Northern Thailand. For Ecol Manag 247: 246-254.
Mackinnon J, Beuduls R, Robinson A, Artha MB. 1982. Feasibility studies of potential reserves of Sumba Island. Food and Agriculture Organization/United Nations Development Programme field report. Directorate of Nature Conservation, Bogor.
Mccain, Chrishty M, Grytnes, John-Arvid. 2010. Elevational gradients in species richness. In: Encyclopedia of Life Sciences (ELS). John Wiley & Sons, Ltd., Chichester, UK.
Naidu MT, Kumar OA. 2016. Tree diversity, stand structure, and community composition of tropical forests in Eastern Ghats of Andhra Pradesh, India. J Asia-Pac Biodiv 9 (3): 328-334.
Oliveira-Filho AT, Curi N, Vilela EA, Carvalho DA. 1998. Effects of canopy gaps, topography, and soils on the distribution of woody species in a Central Brazilian deciduous dry forest. Biotropica 30: 362-375.
Ozcelik R. 2009.Tree species diversity of natural mixed stands in eastern Black sea and western Mediterranean region of Turkey. J Environ Biol 30: 761-766.
Pandey DN, Prakash NP. 2014. Tropical dry forest restoration: Science and practice of direct seeding in a nutshell. RSPCB Occasional Paper No. 7/2014. Climate Change and CDM Cell Rajasthan State Pollution Control Board, Rajasthan.
Robinson AH, Supriadi D. 1981. West Timor nature conservation areas: trip report and recommendations. United Nations Development Programme/Food and Agriculture Organization, Directorate of Nature Conservation, Bogor, Indonesia.
Sagar R, Singh JS. 2006. Tree density, basal area and species diversity in a disturbed dry tropical forest of northern India: implications for conservation. Environ Conserv 33 (3): 256-262.
Sagar R, Raghubanshi A, Singh J. 2003. Tree species composition, dispersion and diversity along a disturbance gradient in a dry tropical forest region of India. For Ecol Manag 186: 61-71.
Singh JS. 2006. Sustainable development of the Indian Himalayan region: Linking ecological and economic concerns. Curr Sci 90 (6): 784-788.
Smith DN, Killeen TJ. 1998. A comparison of the structure and composition of montane and lowland tropical forest in the Serrania Pilón, Beni, Bolivia. In: Dallmeier F, Comiskey JA (eds). Forest Biodiversity in North, Central and South America, and the Caribbean. Research and Monitoring. MAB Series Vol. 21. UNESCO, Paris, France.
Suratman MN. 2012. Tree Species Diversity and Forest Stand Structure of Pahang National Park, Malaysia. Biodiv Enrich Div World 18: 473-492.
Swaine MD, Whitmore TC. 1988. On the definition of ecological species groups in tropical rain forest. Vegetation 75: 81-86.
Udina F. 2005. Interactive biplot construction. J Stat Software 13 (5): 1-16.
Vásquez JA, Givnish TJ. 1998. Altitudinal gradients in tropical forest composition, structure and diversity in the Sierra de Manantlán, Jalisco, México. J Ecol 86: 999-1020.
Wangpakapattanawong P, Kavinchan N, Vaidhayakarn C, Schmidt-Vogt D, Elliott S. 2010. Fallow to forest: applying indigenous and scientific knowledge of swidden cultivation to tropical forest restoration. For Ecol Manag 260 (8): 1399-1406.